Pregnancy Related Pelvic Girdle Pain, MRI Appearance and
19
Pregnancy‐Related Pelvic Girdle Pregnancy‐Related Pelvic Girdle Pain, MRI Appearance and Functional Follow‐Up Ran Thein 1 , Itai Gat 2 , Gideon Burstein 1 Mordechai Dulitzky 2 Nogah Shabshin 3 Mordechai Dulitzky , Nogah Shabshin
Transcript of Pregnancy Related Pelvic Girdle Pain, MRI Appearance and

Pregnancy‐Related Pelvic Girdle Pregnancy‐Related Pelvic Girdle Pain, MRI Appearance and
Functional Follow‐Up
Ran Thein1, Itai Gat2, Gideon Burstein1
Mordechai Dulitzky2 Nogah Shabshin3Mordechai Dulitzky , Nogah Shabshin3

B kg dBackground
Pregnancy‐Related Pelvic Girdle Pain [PPGP] is a well‐known entityy
Prevalence 16‐25% >2y of pain 5‐8.5%y p 5 5 No consensus regarding its cause, anatomic structures, risk factors and prognosis

B kg d tBackground‐ cont.
Despite the potential harm, X‐raywas considered as the image of choice.
MRI is the primary evaluation radiological method for gPPGP (European guidelines‐ Eur Spine J 2008) No Radiation Better understanding R/O other pathologies

B kg d tBackground‐ cont.
Lack of knowledge among patients & doctors (orthopedic surgeons, gynecologists, family physicians)
“pain is normal” There is limited data regarding the prognosis of PPGP in the literature.
More then 3‐6m is bad
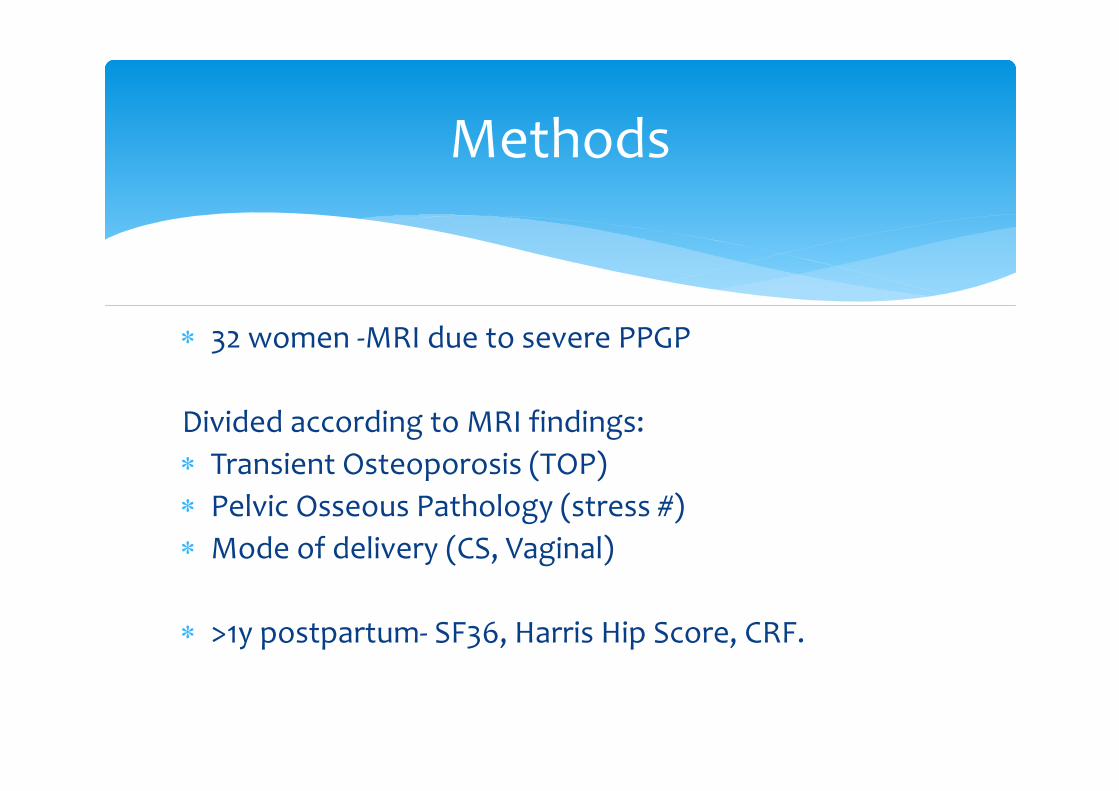
M th dMethods
32 women ‐MRI due to severe PPGP
Divided according to MRI findings: Transient Osteoporosis (TOP) Pelvic Osseous Pathology (stress #) Mode of delivery (CS, Vaginal)
>1y postpartum‐ SF36, Harris Hip Score, CRF.

R ltResults
23/32 completed the interview Average age‐ 33.2y [24‐43]Average age 33.2y [24 43] Average follow‐up – 23m [12‐88]

R lt MRI fi di g Results‐MRI findings
TOP‐43% Sacral Stress Fracture= 22%Sacral Stress Fracture 22% Symphysiolysis=34% Para‐Symphasis Stress Fracture=22%Para Symphasis Stress Fracture=22% Para‐Symphasis Edema=25% Adductor Injury=84% Adductor Injury=84% Rectus Abdominus Injury=69%
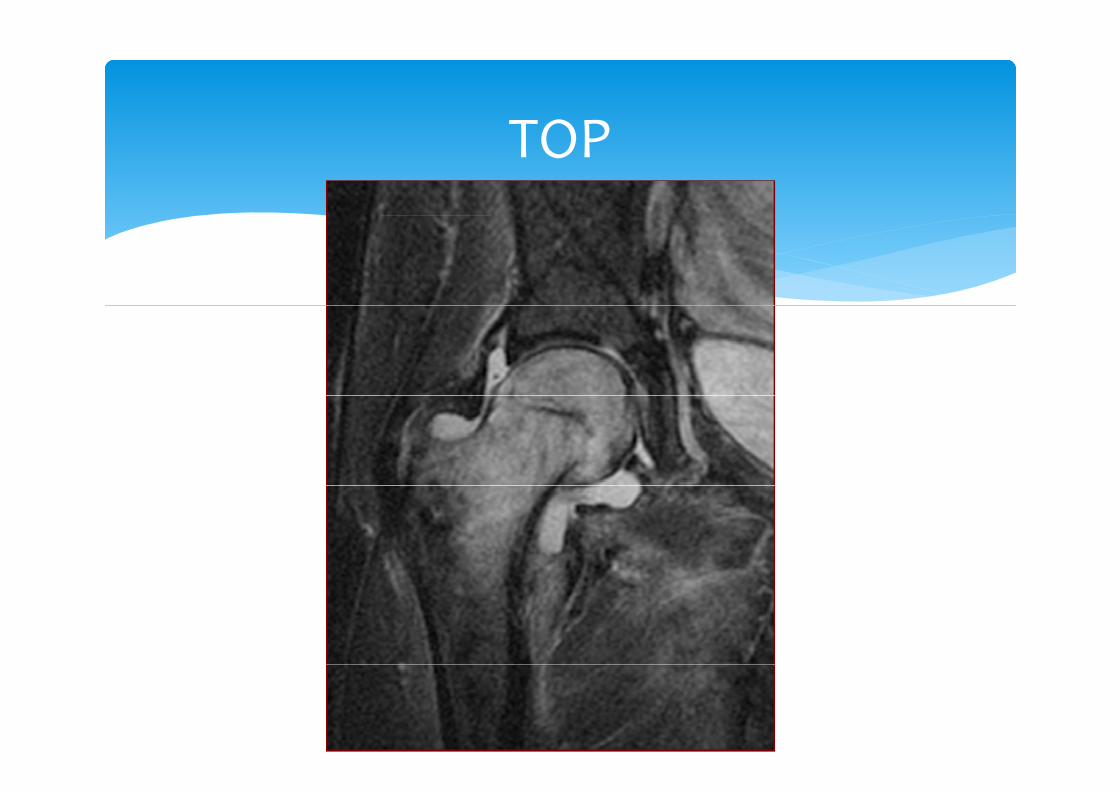
TOPTOP
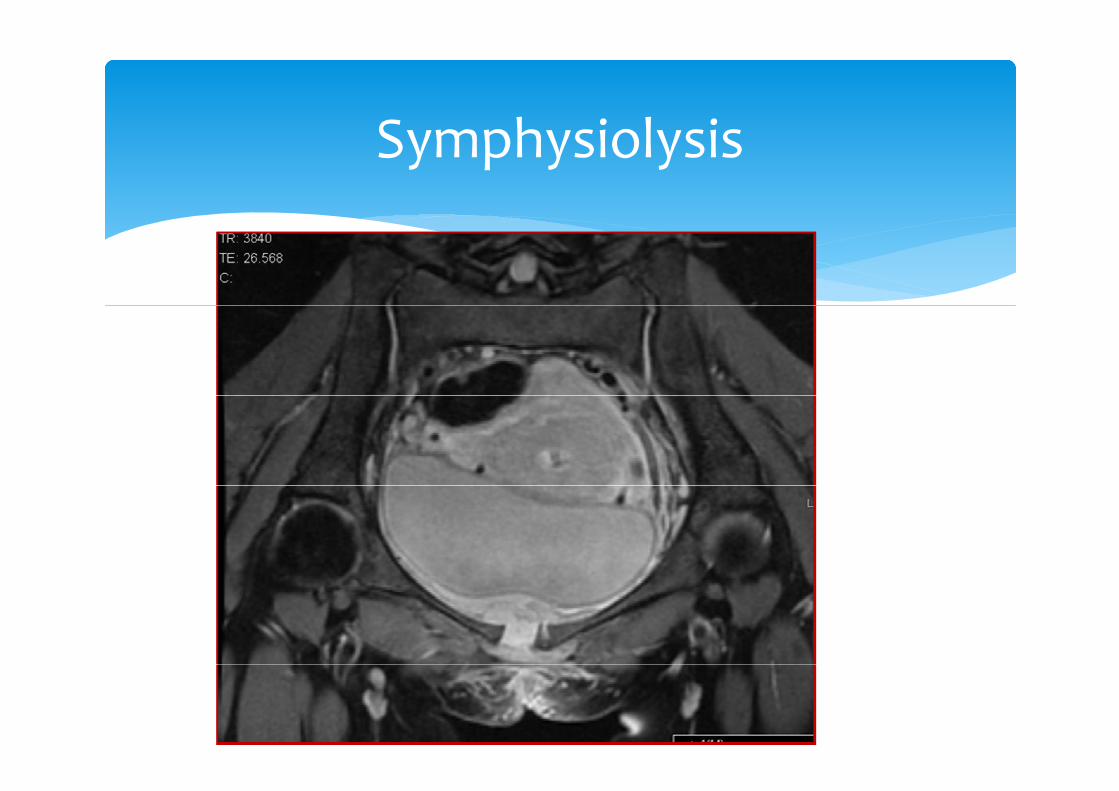
S h i l iSymphysiolysis

S l St #Sacral Stress #

P S h i St #Para‐Symphasis Stress #
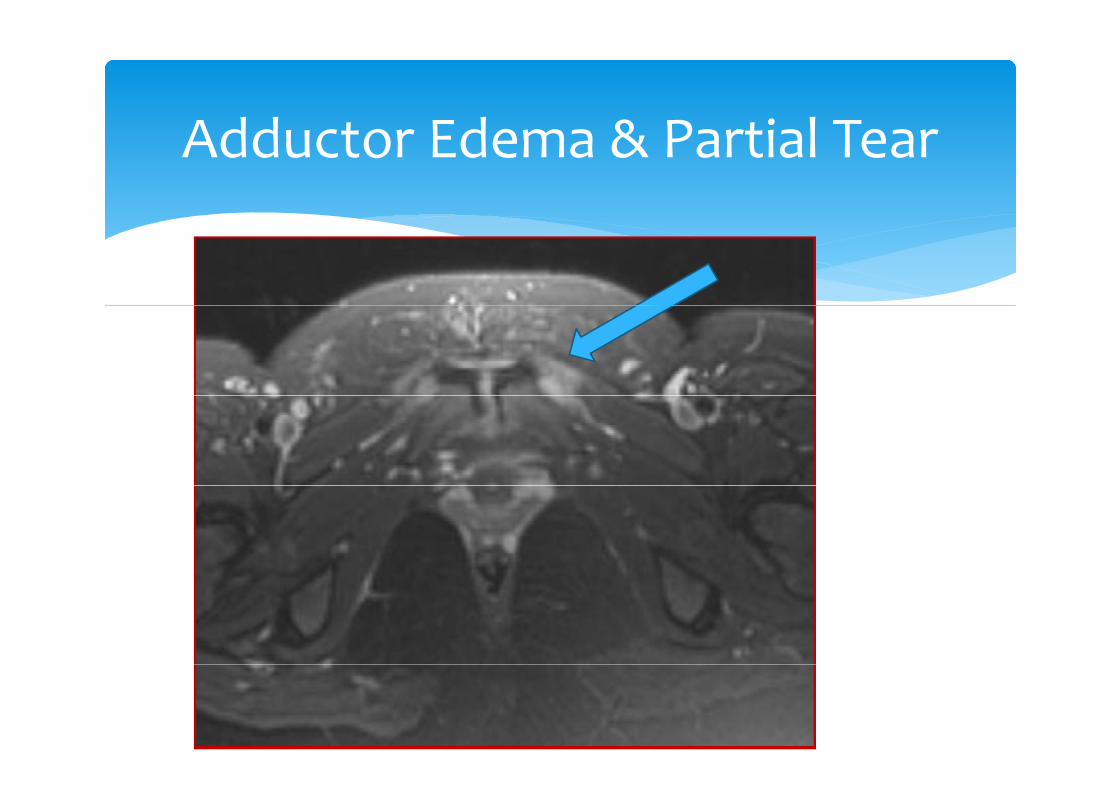
Add t Ed & P ti l TAdductor Edema & Partial Tear
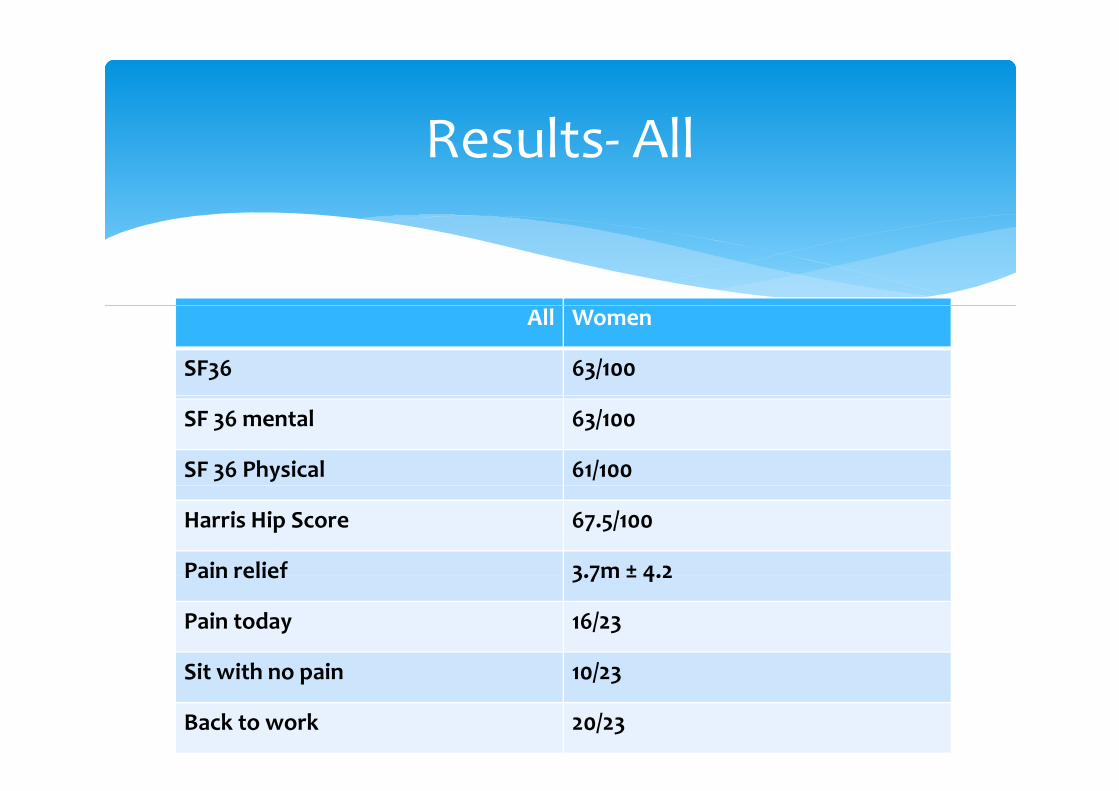
R lt AllResults‐ All
All Women
SF36 63/100
SF 36 mental 63/100
SF 36 Physical 61/100
Harris Hip Score 67.5/100
Pain relief 3.7m ± 4.2Pain relief 3.7m ± 4.2
Pain today 16/23
Sit ith i /Sit with no pain 10/23
Back to work 20/23

R lt bdi i i b MRIResults‐ subdivision by MRIPelvic ‐12 TOP‐13 P
Age 33.1 34.6
Follow‐up time (m) 28.4 29.7
One fetus 83.3% 90.9%
SF 36‐ physical 68/100 52/100 >0.05
HHS 70.6/100 62.9/100 >0.05
Time to relief (m) 4 2.4 >0.05
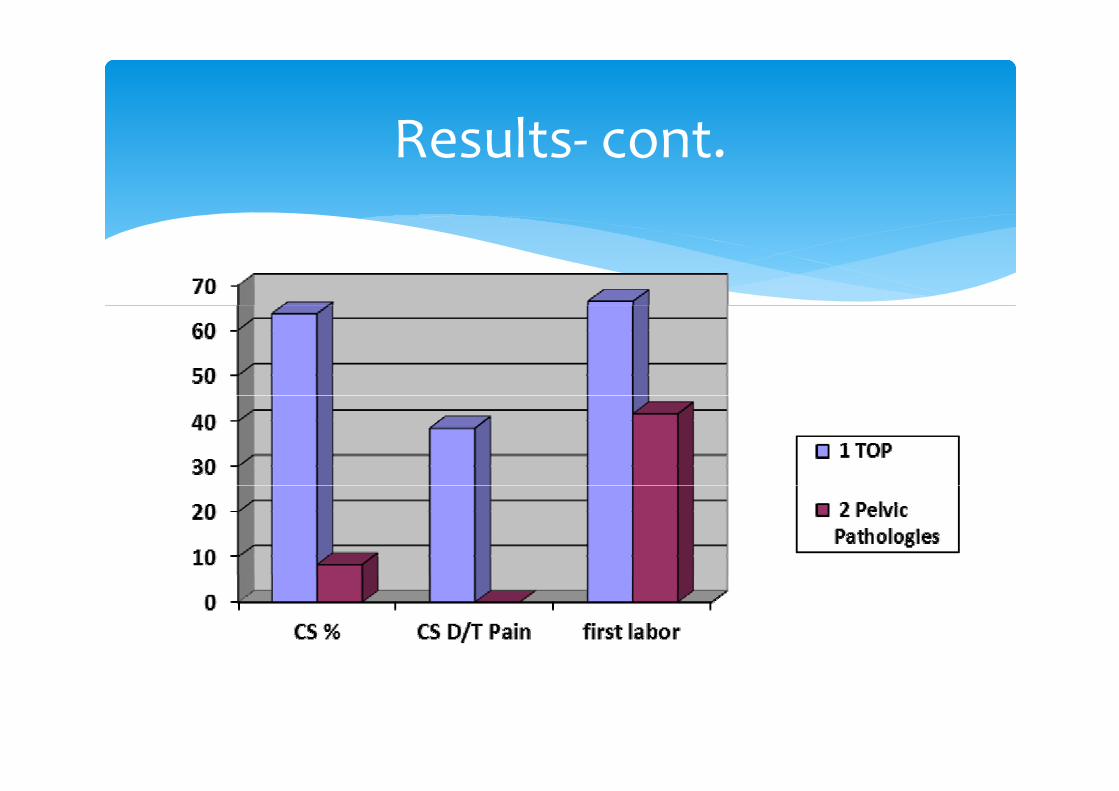
R lt tResults‐ cont.

V i l d li V C S tiVaginal delivery Vs Cesarean Section
Vaginal Delivery (17/22) Cesarean Section (6/10) P value
No demographic differenceSF36 Physical81.19+7.67 1.19+0.42 0.01
SF36 MentalSF36 Mental6.19+2.65 4.25+8.56 0.4
SF364.20+5.67 3.21+0.50 0.09
Harris Hip Score 4.10+9.70 2.15+8.57 0.03
Pain relief 6.4+1.4 5.2+7.2 0.4
Pain today (%) 10 (58.8) 6 (100.0) 0.1
Sit with no pain (%) 8 (47 1) 5 (83 3) 0 28 (47.1) 5 (83.3) 0.2
Back to work (%) 1 (5.9) 2 (33.3) 0.2
C l i Conclusions
MRI is an important tool in evaluation of PPGP The functional outcome was found to be The functional outcome was found to be unexpectedly poor (for young active women)
We believe that CS isn’t protectivep On the short time, CS may help for faster pain relief Further studies with control subjects should be jperformed

T k h gTake home massage
Peripartum pain is not normal in some cases MRI is the Image of choiceMRI is the Image of choice CS does not recommended as prophylactic treatment.

Th k f tt tiThank you for your attention