Preferred and Alternative Methods for Estimating Air Emissions from Plastic Products Manufacturing
72
81.7/’++%*#26’4 24’(’44’�& #.6’40#6+8’ /’6*1&5(14 ’56+/#6+0) #+4 ’/+55+105(41/ 2.#56+% 241&7%65 /#07(#%674+0) &GEGODGT
Transcript of Preferred and Alternative Methods for Estimating Air Emissions from Plastic Products Manufacturing
�81.7/'�++���%*#26'4���
24'('44'&�#0&�#.6'40#6+8'
/'6*1&5�(14�'56+/#6+0)�#+4
'/+55+105�(41/�2.#56+%
241&7%65�/#07(#%674+0)
&GEGODGT�����
2TGRCTGF D[�
'CUVGTP 4GUGCTEJ )TQWR� +PE�
2TGRCTGF HQT�
2QKPV 5QWTEGU %QOOKVVGG
'OKUUKQP +PXGPVQT[ +ORTQXGOGPV 2TQITCO
DISCLAIMER
As the Environmental Protection Agency has indicated in Emission Inventory ImprovementProgram (EIIP) documents, the choice of methods to be used to estimate emissions depends onhow the estimates will be used and the degree of accuracy required. Methods using site-specificdata are preferred over other methods. These documents are non-binding guidance and not rules. EPA, the States, and others retain the discretion to employ or to require other approaches thatmeet the requirements of the applicable statutory or regulatory requirements in individualcircumstances.
iii'++2 8QNWOG ++
ACKNOWLEDGMENT
This document was prepared by Eastern Research Group, Inc. for the Point Sources Committeeof the Emission Inventory Improvement Program and for Roy Huntley of the Emission Factorand Inventory Group, U.S. Environmental Protection Agency. Members of the Point SourcesCommittee contributing to the preparation of this document are:
Denise Alston-Guiden, Galson ConsultingDennis Beauregard, Emission Factor and Inventory Group, U.S. Environmental Protection AgencyBob Betterton, Co-Chair, South Carolina Department of Health and Environmental ControlPaul Brochi, Texas Natural Resource Conservation CommissionAlice Fredlund, Louisiana Department of Environmental QualityGary Helm, Air Quality Management, Inc.Toch Mangat, Bay Area Air Quality Management DistrictRalph Patterson, Wisconsin Department of Natural ResourcesJim Southerland, North Carolina Department of Environment and Natural ResourcesEitan Tsabari, Omaha Air Quality Control DivisionBob Wooten, North Carolina Department of Environment and Natural Resources
iv '++2 8QNWOG ++
%106'065
Section Page
1 Introduction . . . . . . . . . . . . . . . . . . . . . . . . . . . . . . . . . . . . . . . . . . . . . . . . . . . . . . .11.1-1
2 Source Category Description. . . . . . . . . . . . . . . . . . . . . . . . . . . . . . . . . . . . . . . . . .11.2-1
2.1 Process Description. . . . . . . . . . . . . . . . . . . . . . . . . . . . . . . . . . . . . . . . . . .11.2-12.1.1 Types of Plastics. . . . . . . . . . . . . . . . . . . . . . . . . . . . . . . . . . . . . . . .11.2-12.1.2 Manufacturing Techniques. . . . . . . . . . . . . . . . . . . . . . . . . . . . . . . .11.2-32.1.3 Additives . . . . . . . . . . . . . . . . . . . . . . . . . . . . . . . . . . . . . . . . . . . . . .11.2-8
2.2 Emission Sources. . . . . . . . . . . . . . . . . . . . . . . . . . . . . . . . . . . . . . . . . . . . .11.2-92.2.1 Free Monomer/Solvent. . . . . . . . . . . . . . . . . . . . . . . . . . . . . . . . . .11.2-102.2.2 Secondary Process Materials. . . . . . . . . . . . . . . . . . . . . . . . . . . . . .11.2-112.2.3 Chemical Reactions/Byproducts. . . . . . . . . . . . . . . . . . . . . . . . . . .11.2-112.2.4 Particulate Sources. . . . . . . . . . . . . . . . . . . . . . . . . . . . . . . . . . . . . .11.2-12
2.3 Process Design and Operating Factors Influencing Emissions. . . . . . . . .11.2-122.3.1 Process and Operating Factors. . . . . . . . . . . . . . . . . . . . . . . . . . . . .11.2-122.3.2 Control Techniques. . . . . . . . . . . . . . . . . . . . . . . . . . . . . . . . . . . . .11.2-13
3 Overview of Available Methods. . . . . . . . . . . . . . . . . . . . . . . . . . . . . . . . . . . . . . .11.3-1
3.1 Emission Estimation Methods. . . . . . . . . . . . . . . . . . . . . . . . . . . . . . . . . . .11.3-13.1.1 Material Balance. . . . . . . . . . . . . . . . . . . . . . . . . . . . . . . . . . . . . . . .11.3-13.1.2 Source Tests. . . . . . . . . . . . . . . . . . . . . . . . . . . . . . . . . . . . . . . . . . . .11.3-13.1.3 Emission Factors. . . . . . . . . . . . . . . . . . . . . . . . . . . . . . . . . . . . . . . .11.3-2
3.2 Comparison of Available Emission Estimation Methods. . . . . . . . . . . . . .11.3-23.2.1 Material Balance . . . . . . . . . . . . . . . . . . . . . . . . . . . . . . . . . . . . . . . .11.3-33.2.2 Source Tests. . . . . . . . . . . . . . . . . . . . . . . . . . . . . . . . . . . . . . . . . . . .11.3-43.2.3 Emission Factors . . . . . . . . . . . . . . . . . . . . . . . . . . . . . . . . . . . . . . . .11.3-4
4 Preferred Methods for Estimating Emissions. . . . . . . . . . . . . . . . . . . . . . . . . . . . .11.4-1
4.1 Emissions Calculation Using Material Balance . . . . . . . . . . . . . . . . . . . . .11.4-2
4.2 Emissions Calculation Using Source Test Data. . . . . . . . . . . . . . . . . . . . . .11.4-4

v'++2 8QNWOG ++
%106'065�%106+07'&�
Section Page
5 Alternative Methods for Estimating Emissions. . . . . . . . . . . . . . . . . . . . . . . . . . . .11.5-1
5.1 Emissions Calculation Using Source Test Data. . . . . . . . . . . . . . . . . . . . . .11.5-2
5.2 Emissions Calculation Using Emission Factors. . . . . . . . . . . . . . . . . . . . .11.5-5
5.3 Emissions Calculation Using Material Balance. . . . . . . . . . . . . . . . . . . . . .11.5-6
6 Quality Assurance/Quality Control. . . . . . . . . . . . . . . . . . . . . . . . . . . . . . . . . . . . .11.6-1
6.1 QA/QC for Using Material Balance. . . . . . . . . . . . . . . . . . . . . . . . . . . . . . .11.6-1
6.2 QA/QC for Using Emission Factors . . . . . . . . . . . . . . . . . . . . . . . . . . . . . .11.6-2
6.3 QA/QC for Using Source Test Data. . . . . . . . . . . . . . . . . . . . . . . . . . . . . .11.6-2
6.4 Data Attribute Rating System (DARS) Scores. . . . . . . . . . . . . . . . . . . . . .11.6-2
7 Data Coding Procedures. . . . . . . . . . . . . . . . . . . . . . . . . . . . . . . . . . . . . . . . . . . . .11.7-1
7.1 Source Classification Codes. . . . . . . . . . . . . . . . . . . . . . . . . . . . . . . . . . . .11.7-1
7.2 AIRS Control Device Codes. . . . . . . . . . . . . . . . . . . . . . . . . . . . . . . . . . . .11.7-1
8 References. . . . . . . . . . . . . . . . . . . . . . . . . . . . . . . . . . . . . . . . . . . . . . . . . . . . . . . .11.8-1
9 Bibliography . . . . . . . . . . . . . . . . . . . . . . . . . . . . . . . . . . . . . . . . . . . . . . . . . . . . . .11.9-1
Appendix A Example Data Collection Forms and Instructions - Plastic ProductsManufacturing
vi '++2 8QNWOG ++
6#$.'5
2CIG
11.2-1 Common Applications and Manufacturing Techniques for Selected Plastics . . 11.2-4
11.3-1 Summary of Preferred and Alternative Emission Estimation Methods forPlastic Products Manufacturing Operations. . . . . . . . . . . . . . . . . . . . . . . . . . . .11.3-2
11.4-1 List of Variables and Symbols. . . . . . . . . . . . . . . . . . . . . . . . . . . . . . . . . . . . . .11.4-1
11.5-1 List of Variables and Symbols. . . . . . . . . . . . . . . . . . . . . . . . . . . . . . . . . . . . . .11.5-1
11.6-1 DARS Scores: Material Balance Data. . . . . . . . . . . . . . . . . . . . . . . . . . . . . . . .11.6-5
11.6-2 DARS Scores: Source Test Data. . . . . . . . . . . . . . . . . . . . . . . . . . . . . . . . . . . .11.6-6
11.6-3 DARS Scores: Source-specific Emission Factor Data. . . . . . . . . . . . . . . . . . . .11.6-7
11.7-1 Source Classification Codes for Plastic Products Manufacturing Processes . . . 11.7-2
11.7-2 AIRS Control Device Codes for Plastic Products Manufacturing. . . . . . . . . . .11.7-4
11.1-1'++2 8QNWOG ++
�
+0641&7%6+10The purposes of the preferred methods guidelines are to describe emission estimation techniquesfor point sources in a clear and unambiguous manner and to provide concise examplecalculations to aid regulatory and non-regulatory personnel in the preparation of emissioninventories. This chapter describes the procedures and recommended approaches for estimatingair emissions from plastic products manufacturing operations.
Section 2 of this chapter contains a general description of the plastic products manufacturingsource category, identifies common emission sources, and contains an overview of available airpollution control technologies. Section 3 of this chapter provides an overview of availableemission estimation methods. It should be noted that the use of site-specific emissions data isusually preferred over the use of industry-averaged data. However, depending upon availableresources, obtaining site-specific data may not be cost effective.
Section 4 presents the preferred emission estimation methods for plastic products manufacturingand Section 5 presents alternative emission estimation techniques. Quality assurance and qualitycontrol procedures associated with the emission estimation methods are described in Section 6. Section 7 contains data coding procedures used for data input and storage. Some states use theirown unique identification codes, so non-regulatory personnel developing an inventory shouldcontact individual state agencies to determine the appropriate coding scheme to use. Referencescited in this document are provided in Section 8 and other useful information on this topic maybe found in the references listed in Section 9 (Bibliography). Appendix A contains an exampledata collection form for plastic products manufacturing sources and may be revised to fitindividual user’s needs.

%*#26'4 �� � 2.#56+% 241&7%65 /() ��������
11.1-2 '++2 8QNWOG ++
This page is intentionally left blank.
�#�RQN[OGT�KU�C�JKIJ�OQNGEWNCT�YGKIJV�QTICPKE�EQORQWPF��PCVWTCN�QT�U[PVJGVKE��YJQUG�
UVTWEVWTG�ECP�DG�TGRTGUGPVGF�D[�C�TGRGCVGF�UOCNN�WPKV��VJG�OQPQOGT���#�TGUKP�KU�C�UQNKF�QT
UGOKUQNKF�QTICPKE�RTQFWEV�WUWCNN[�QH�JKIJ�OQNGEWNCT�YGKIJV�CPF�PQ�FGHKPKVG�OGNVKPI�RQKPV��
/QUV�TGUKPU�CTG�RQN[OGTU�6JG�5QEKGV[�QH�VJG�2NCUVKEU�+PFWUVT[��������
11.2-1'++2 8QNWOG ++
�
5174%'�%#6')14;�&'5%4+26+10
��� 241%'55�&'5%4+26+10
Plastic products manufacturing involves molding, forming, shaping, or otherwise altering plasticresins or plastic materials to produce an intermediate or final product. This manufacturingindustry is also commonly referred to as plastics processing or polymer processing. Themanufacture of resins is not a part of plastic products manufacturing; however, some facilitiesmanufacture resins at the same site as where the resins are processed. This chapter will not1
address the manufacture of resins because it is not an activity inherent to plastic productsmanufacturing.
Solid and foamed plastic products are manufactured using plastic resins or solid plastic chips asthe starting material. Most plastic products are manufactured by mixing plastic resins withadditives, applying heat or pressure to the mixture, and shaping the mixture to form the desiredproduct.
Section 2.1.1 describes the different types of plastics used by plastic products manufacturingfacilities in the United States. Section 2.1.2 describes the major manufacturing techniques usedto process plastic products.
����� 6;2'5 1( 2.#56+%5
Plastic products can be fabricated into a solid or foam state. The basic properties of a plasticproduct are influenced and limited by the physical and chemical characteristics of the plasticresin from which it is made.
Plastic resins are generally defined by their rheology, or ability to flow under heat or pressure. Thermoplastic resins (or dry blends) and thermoset resins are the two major classes of resins thatare used to manufacture plastic products. Although most resins fall into one of these two classesof resins, some resins can be classified as both a thermoplastic and thermoset resin.
%*#26'4 �� � 2.#56+% 241&7%65 /() ��������
11.2-2 '++2 8QNWOG ++
6JGTOQRNCUVKEU
Thermoplastic resins (or thermoplastics) are plastic resins that will repeatedly become soft whenheated and hard when cooled. Thermoplastics do not normally undergo a chemical changeduring forming. Plastic products manufacturing facilities usually purchase and usethermoplastics in solid pellet form for processing. An economic advantage of products madefrom thermoplastics is that they can be easily remanufactured or reprocessed.
Thermoplastics account for the major share of domestic polymer production. The following sixthermoplastics are processed in the largest quantities in the United States:
& Low-density polyethylene;
& High-density polyethylene;
& Polyvinyl chloride;
& Polypropylene;
& Polystyrene; and
& Linear low-density polyethylene.
6JGTOQUGVU
Thermoset resins (or thermosets) undergo a chemical reaction and become permanently solidwhen heated, pressurized, or reacted with a hardening agent. Thermosets are usually availablein liquid or powder form for processing. Unlike thermoplastics, thermosets cannot be easilyremelted or refabricated. However, scraps from thermoset processing operations can be used asfillers for other products.
Some widely used thermosets include:
& Epoxy;
& Phenolic;
& Unsaturated polyester; and
& Urea.
�������� %*#26'4 �� � 2.#56+% 241&7%65 /()
11.2-3'++2 8QNWOG ++
(QCOGF�2NCUVKEU
Foamed plastics (or foams) have a unique cellular structure that is different from solid plastics. For this reason, foams are often called “cellular plastics.” Foams, which are rigid, semi-rigid, orflexible, can be manufactured with thermoplastic or thermoset resins. Many of themanufacturing techniques used to fabricate solid plastic products are also used to make foamproducts. The process used to manufacture foams influences the properties of the final foamproduct.
Some typical foams include:
& Polystyrene foam;
& Polyurethane foam; and
& Polyethylene foam.
A detailed description of foam processing is provided in Section 2.1.2.
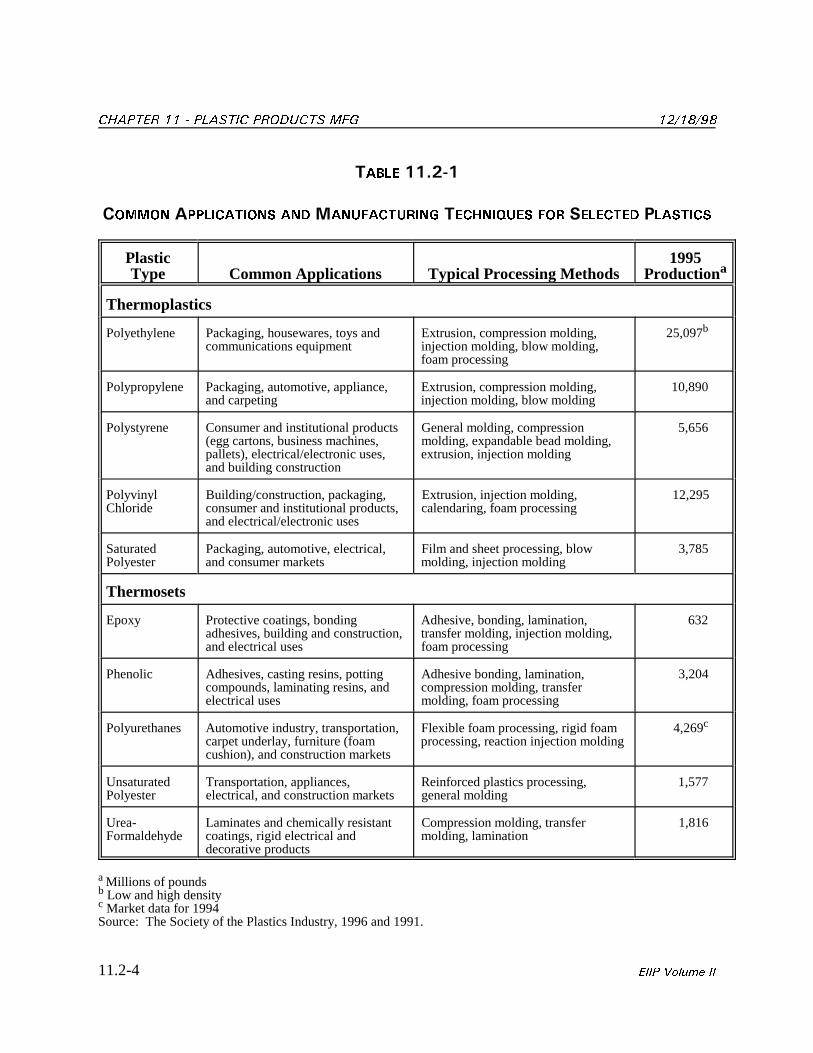
Table 11.2-1 lists ten plastics that are processed in the largest quantities in the United States(The Society of the Plastics Industry, 1991 and 1996). It also presents common applications andtypical manufacturing techniques used for each plastic type.
����� /#07(#%674+0) 6'%*0+37'5
Solid and foamed plastic products are manufactured by a variety of methods. The choice ofmanufacturing techniques used to process a plastic product depends largely on whether the resinis a thermoplastic or thermoset, and the dimensions, shape, or physical qualities of the desiredproduct.
This section describes the major manufacturing techniques used to fabricate intermediate andfinal plastic products. Extrusion is the most widely used processing technique, followed byinjection molding, blow molding, and foam processing (Midwest Research Institute, 1993). These four manufacturing techniques, in addition to lamination, coating, and finishingoperations, are described below.
'ZVTWUKQP
The extrusion process is a common technique used to form thermoplastic materials into longplastic shapes including pipes, tubes, coated wires, coated cables, rods, and continuous sheets
%*#26'4 �� � 2.#56+% 241&7%65 /() ��������
11.2-4 '++2 8QNWOG ++
6#$.' ������
%1//10 #22.+%#6+105 #0& /#07(#%674+0) 6'%*0+37'5 (14 5'.'%6'& 2.#56+%5
Plastic 1995Type Common Applications Typical Processing Methods Productiona
Thermoplastics
Polyethylene Packaging, housewares, toys and Extrusion, compression molding, 25,097communications equipment injection molding, blow molding,
foam processing
b
Polypropylene Packaging, automotive, appliance, Extrusion, compression molding, 10,890and carpeting injection molding, blow molding
Polystyrene Consumer and institutional products General molding, compression 5,656(egg cartons, business machines, molding, expandable bead molding,pallets), electrical/electronic uses, extrusion, injection moldingand building construction
Polyvinyl Building/construction, packaging, Extrusion, injection molding, 12,295Chloride consumer and institutional products, calendaring, foam processing
and electrical/electronic uses
Saturated Packaging, automotive, electrical, Film and sheet processing, blow 3,785Polyester and consumer markets molding, injection molding
Thermosets
Epoxy Protective coatings, bonding Adhesive, bonding, lamination, 632adhesives, building and construction, transfer molding, injection molding,and electrical uses foam processing
Phenolic Adhesives, casting resins, potting Adhesive bonding, lamination, 3,204compounds, laminating resins, and compression molding, transferelectrical uses molding, foam processing
Polyurethanes Automotive industry, transportation, Flexible foam processing, rigid foam 4,269carpet underlay, furniture (foam processing, reaction injection moldingcushion), and construction markets
c
Unsaturated Transportation, appliances, Reinforced plastics processing, 1,577Polyester electrical, and construction markets general molding
Urea- Laminates and chemically resistant Compression molding, transfer 1,816Formaldehyde coatings, rigid electrical and molding, lamination
decorative products
Millions of poundsa
Low and high densityb
Market data for 1994c
Source: The Society of the Plastics Industry, 1996 and 1991.
�������� %*#26'4 �� � 2.#56+% 241&7%65 /()
11.2-5'++2 8QNWOG ++
and films. The types of extrusion methods are as diverse as the products that can be fabricatedby extrusion. Extrusion methods include blown film, sheet extrusion, cast film, extrusioncoating, profile extrusion, pipe and tubing extrusion, wire and cable coating, and fiber extrusion.
In most extrusion operations, dry resin material is poured into a hopper, which directs the resinmaterial into the feed throat of the extruding machine where the resin is heated. A largecontinuously revolving screw encased in a long heating chamber then carries the heated resindown the length of the screw toward a die (orifice) at the end of the chamber. The revolvingscrew forces the fluidized resin material through the die which has the shape of the cross sectionof the final plastic product. After the resin material exits the die, it may be wound into a roll, ortransported on rollers or a conveyer belt where it is cooled by air or water immersion.
/QNFKPI
In most molding operations, the forming of the intermediate or final plastic product takes placein a closed mold. Molding methods vary depending on resin type, raw materials, desired plasticproduct shape, and other factors. Some of the more typical molding methods include injection,blow, general, rotational, transfer, reaction injection, and compression injection. This sectionwill describe the three most prevalent molding methods currently used in the United States. +PLGEVKQP�/QNFKPI� Injection molding is one of the more common methods used to moldthermoplastics; however, this method can also be used to mold thermosets. The injectionmolding process is similar to the extrusion method except that in injection molding, the moltenmaterial is injected into a mold rather than forced through a die.
Plastic pellets are fed into a heating chamber and are pushed along by a plunger until they arehomogenized and fluidized. The fluid plastic is then injected (forced under high pressure)through a nozzle into a relatively cold mold. The fluid plastic conforms to the shape of theclamped mold, which is released once the plastic solidifies. The reciprocating screw injectionmachine, which serves as both a plasticizer and injection ram, is the most common machineused for injection molding.
Reaction injection molding is a recently developed injection molding technology that mixesliquid plastic (i.e., polyols and isocyanates) at low temperatures before injecting the liquidplastic into a mold. Unlike standard injection molding, an exothermic reaction takes place inreaction injection molding; therefore reaction injection molding requires substantially lessenergy than traditional injection molding (The Society of the Plastics Industry, 1996).
$NQY�/QNFKPI� Blow molding is used to manufacture bottles and other hollow or lightweightobjects. The basic technique of blow molding is to stretch and form plastic material against amold, usually by air pressure. The extrusion blow molding method extrudes fluid plastic into a
%*#26'4 �� � 2.#56+% 241&7%65 /() ��������
11.2-6 '++2 8QNWOG ++
parison (a free-blown form shaped like a tube) before molding the final product. The parison isdirected between two halves of a mold, then air pressure expands the parison and forces it toconform to the contour of the mold. The injection blow molding method is similar to extrusionblow molding, except that the parison is injection-molded rather than extruded.
%QORTGUUKQP�/QNFKPI� Compression molding is a common method for forming thermosetsand is rarely used for thermoplastics, except with a few specialized processes. In compressionmolding, a premixed plastic mixture or preformed plastic part is placed in an open mold cavity. As the heated mold is closed, the plastic mixture spreads throughout the mold. The mixture inthe mold is pressurized and heated until it undergoes a chemical change that hardens the mixtureinto the desired shape.
6TCPUHGT�/QNFKPI� Transfer molding is a process similar to compression molding that is usedfor thermoplastics. However, unlike compression molding, a hydraulic plunger forces the heatedplastic mixture into a closed hot mold where it solidifies.
.COKPCVKQP
Lamination is the binding and fusing of multiple layers with heat and pressure. All thermosetscan be used as laminating binders; however, phenolic is the most common binder used inlamination.
Most laminating operations involve the following three basic steps: impregnation, drying, andpressing. First, a web of paper, fabric, or other material is impregnated with a resin solution bycontinuously feeding it through a dip tank. Next, excess resin is removed and the web is dried.The drying, which takes place in an oven, vaporizes the solvent and helps increase the molecularweight of the resin via additional chemical reactions. Usually the web sheeting is cut and placedin multiple layers. Finally, a hydraulic press compacts the layers of sheets at pressures rangingfrom 1,400 Kilopascals (kPa) to 12,000 kPa under temperature conditions of 140 to 180(C(EPA, 1978).
%QCVKPI
A variety of methods are available to coat objects, web materials, and other substrates withplastic. Some of the more common methods are included in this discussion. For a detaileddiscussion on coating operations and estimating emissions from associated activities, please seeChapter 7 in this series, Preferred and Alternative Methods for Estimating Emissions fromSurface Coating Operations.
Calender coating involves the production of plastic sheets that are then pressed between heatedrollers against a web of material. The heat and pressure bond the plastic to the web substrate.
�������� %*#26'4 �� � 2.#56+% 241&7%65 /()
11.2-7'++2 8QNWOG ++
In dip coating, a part is dipped or immersed in a resin solution. After the part is removed fromthe solution and excess coating is drained, the part is air-dried or baked. This coating method isuseful for irregularly shaped parts. In flow coating, a method similar to dip coating, plasticcoating is poured or sprayed on the part and allowed to drain by gravity.
Roll coating is another common method that is often used for web substrates. A controlledamount of resin is applied to the web as it passes over and between a series of rollers. Inknife-over-roll coating, a coating knife controls the thickness of the coating that is applied to theweb substrate as it passes over a roller. The coating thickness is regulated by the distancebetween the coating knife edge and the surface of the web material.
(QCO�2TQEGUUKPI�
Many of the same processes used to manufacture solid plastic products (i.e., extrusion andmolding) are used to generate foamed plastic products. However, unlike solid plastic productsmanufacturing, the manufacture of foamed plastic products requires a specialized stage whereair, chemical, or physical blowing agents are incorporated into the plastic mixture to produce acellular structure unique to foamed plastics.
Foamed plastics are divided into three major types: blown, syntactic, and structural. Blownfoam is an expanded matrix (resembles a sponge). Syntactic foam is the encapsulation ofhollow micro spheres in a plastic matrix. Structural foam is a foamed core surrounded by a solidouter skin.
The following are some basic processes that are used in conjunction with standard molding andforming operations to produce blown and syntactic foam plastic:
& A chemical blowing agent that generates gas through thermaldecomposition is incorporated into the polymer melt or pellet;
& Pressurized gas or liquid is injected into the melt and expandsduring pressure relief;
& A low-boiling-point liquid (i.e., hydrocarbons) is incorporated intothe plastic compound and volatilized through the exothermic heatof reaction or the application of heat;
& Nonchemical gas-liberating agents, in the form of gas adsorbed onfinely divided carbon, are added to the resin mix and releasedduring heating;
%*#26'4 �� � 2.#56+% 241&7%65 /() ��������
11.2-8 '++2 8QNWOG ++
& Air is dispersed by mechanical means within the polymer; or
& The external application of heat causes the expansion of smallbeads of thermoplastic resin containing a blowing agent.
Structural foam plastic is made by injection molding liquid resins that contain chemical blowingagents. Less mixture is injected into the mold than is needed to mold a solid plastic part. Atfirst, the injection pressure is very high, causing the blowing agent to solidify against the moldwithout undergoing expansion. As the outer skin is formed, the pressure is reduced and theremaining resin expands to fill the remainder of the mold (EPA, 1995).
(KPKUJKPI�1RGTCVKQPU�
Many plastic products need finishing or machining after they have been processed to removeimperfections, repair defects, or decorate the plastic product. Finishing operations includefiling, grinding, sanding, polishing, painting, bonding, coating, engraving, and a number of otheroperations. Some finishing operations, like bonding or grinding, can also be classified as majorprocesses when they are a part of the operations employed to produce an intermediate product.
����� #&&+6+8'5
Additives are incorporated in plastic materials prior to processing to impart specific chemical orphysical properties to the plastic. Additives include lubricants, antioxidants, antistats, blowing(foaming) agents, colorants, plasticizers, heat stabilizers, flame retardants, and ultravioletstabilizers. Three common additives (plasticizers, antioxidants, and stabilizers) are discussedbelow.
2NCUVKEK\GTU
Plasticizers are added to plastic materials to improve flexibility, workability, or extrudability. Most plasticizers are used in the manufacture of flexible polyvinyl chloride (PVC). Phthalates,adipates, and trimellitates are the most common plasticizers.
#PVKQZKFCPVU
Antioxidants are added to plastic materials to inhibit the oxidation of plastic exposed to air. Antioxidants minimize degradation during processing, storage, and service. Hindered phenolsare the class of compounds predominantly used to stabilize most polymers.
�������� %*#26'4 �� � 2.#56+% 241&7%65 /()
11.2-9'++2 8QNWOG ++
5VCDKNK\GTU
Stabilizers are used to prevent plastic materials from degrading when subject to heat orultraviolet radiation. For example, pure PVC degrades with the application of heat. Therefore,incorporating stabilizers into the PVC material can help maintain the physical and chemicalproperties of the PVC material throughout processing and the life of the PVC material.
Ultraviolet stabilizers protect plastics from degrading when exposed to sunlight. Hinderedamine light stabilizers (HALS), benzotriazoles, benzophenones, and nickel compounds aretypical light stabilizers (Midwest Research Institute, 1993).
��� �'/+55+10�5174%'5
Emissions from plastic products manufacturing come from a variety of sources and are highlydependent upon the chemical makeup of the raw materials (resins, additives) and types ofproduction processes used. In addition, the diverse nature of these raw materials andmanufacturing techniques results in a wide range of potential combinations of emission sourcesand pollutants.
The primary sources of emissions at plastic products manufacturing facilities are the pieces ofequipment (e.g., extruder hopper, die head, sander) used to handle raw materials and produce thefinal product. These are typically the locations where chemical reactions occur, liquid solventsand solvent blends are exposed to the atmosphere, solid resin is heated and melted, and additivesare introduced.
In addition to emissions generated directly from primary production processes associated withplastic products manufacturing, there may be additional emissions produced by secondaryprocesses at these facilities. Emission sources from these secondary processes include storagetanks, equipment leaks, wastewater treatment, combustion sources, and cleaning and surfacecoating operations. Chapter 2 of this volume addresses emissions from combustion in boilers,Chapter 4 addresses emissions from equipment leaks, Chapter 5 addresses emissions fromwastewater collection and treatment, and Chapter 7 addresses emissions from surface coatingoperations. In addition, Chapter 1 of this volume discusses general emission estimationapproaches and includes useful references to other sources and tools for estimating emissions.
As explained earlier, there are multiple processes occurring at plastic products manufacturingfacilities that give rise to a wide variety of pollutants. Emissions from plastic productsmanufacturing may be generally classified as follows:
%*#26'4 �� � 2.#56+% 241&7%65 /() ��������
11.2-10 '++2 8QNWOG ++
& Volatile organic compound (VOC) and hazardous air pollutant (HAP)emissions resulting from the volatilization of free monomer or solvent inthe primary polymer blend during processing;
& VOC and HAP emissions that result from secondary process materials,such as blowing agents, additives, and lubricants (mold releasecompounds);
& VOC, HAP, and particulate matter (PM) emissions that result frombyproducts formed by chemical reactions or formed during heating ofresins; and
& PM emissions generated during raw material handling and finishingoperations.
The following discussion provides additional information on some of the specific pollutantsemitted from plastic products manufacturing facilities and the specific processes giving rise toemissions.
����� (4'' /101/'4�51.8'06
Emissions of free monomer (a single molecule of a chemical used in a polymer) may occurwhen a solid resin is heated during extrusion, molding, or any of the other processes discussed inSection 2.1. For example, one recent study (Contos et al., 1995) found a monomer (styrene) tobe the principle component of the emissions produced during the extrusion ofacrylonitrile-butadiene-styrene (ABS) resins.
Emissions of free monomer would also be expected from resins used in solvent form. Someresins may be handled using a solvent medium to store and transport the resin prior toprocessing. In this case, emissions would also come from the solvent used to suspend the resinprior to the polymerization step. Thermoset resins are often handled in monomer form prior tosolidifying under heat or pressure, or reaction with a hardening agent to generate a solidpolymer. For example, when curing of thermosets is accomplished during processing or whenprocessing involves polymerization (such as when thermoset polyurethane elastomers areprocessed using reaction injection molding), substantial emissions of monomers are likely to begenerated (Midwest Research Institute, 1993).
�������� %*#26'4 �� � 2.#56+% 241&7%65 /()
11.2-11'++2 8QNWOG ++
����� 5'%10 241%'55 /#6'4+#.5
In addition to the bulk polymer and additives used to form the plastic product, additionalmaterials may be used to assist in lubrication, or, in the case of blowing agents used tomanufacture foams, to decrease the density of the final product.
.WDTKECVKQP
Lubrication is used in molding and forming operations to prevent plastic material from stickingto mold surfaces. A mold release agent (lubricating or parting agent) is sprayed on a moldcavity surface in a thin waxy layer to facilitate the release or removal of the molded plastic formfrom the mold. Mold release agents contain carrier solvents (HAP-based and non-HAP based)that evaporate immediately when the mold release agent adheres to the mold cavity surface(EPA, 1996).
$NQYKPI�#IGPVU
Emissions also occur from blowing agents used to manufacture certain foams. In expandedpolystyrene (EPS) bead manufacturing, the blowing agent is typically contained in the rawpolymer beads as they come from the supplier. This causes the beads to expand when exposedto heat. There are three general classes of emissions from this type of foam production:manufacturing emissions; prompt foam cell losses, which are losses that typically occur duringstorage and shipping; and banked emissions, which are losses that occur through slow diffusionof blowing agents out of the foam over the life of the product (EPA, 1990).
Another type of polystyrene foam is extruded polystyrene foam sheet (PSF). Pentane is thepredominant hydrocarbon blowing agent used to manufacture PSF. After extrusion, sheets ofintermediate product are wound into rolls and aged for 3 to 5 days. After aging, the sheets arethermoformed into consumer products and packaged for shipment. Typically 50 percent of theblowing agent is lost during the manufacturing and reclaim operations and the remainder asfugitives during warehousing, transportation, and after the product is sold (EPA, 1990).
In the manufacture of polyurethane foams, large quantities of auxiliary blowing agents are usedto reduce foam density. The use of these blowing agents (predominantly methylene chloride orchlorofluorocarbons) does not involve any chemical reactions, but is merely a change of thephysical state of the blowing agent. Volatilization of the auxiliary blowing agent from liquid togas provides the volume needed to increase the number and size of foam cells. One recent studyestimates that approximately 60 percent of methylene chloride is lost within the first 10 minutesof the process and the remaining 40 percent is lost slowly by diffusion over the next 24 hours(Kaufman and Overcash, 1993). The initial bulk of emissions are typically released through
%*#26'4 �� � 2.#56+% 241&7%65 /() ��������
11.2-12 '++2 8QNWOG ++
process vents located at the foaming equipment, while the remaining 40 percent of emissions arereleased fugitively while the foam is being transported and stored.
����� %*'/+%#. 4'#%6+105�$;241&7%65
VOC and HAP emissions may be generated from chemical reactions occurring as a direct part ofthe process, as in the case of thermoset resins, or as an indirect result of the processenvironment. For example, pure PVC degrades with the application of heat to formhydrochloric acid (HCl) gas, which itself is a catalyst for further degradation.
Because many thermoplastic operations occur in heated environments, some amount ofemissions occurs due to thermal degradation of additives as well as the actual polymericmaterial used to produce the final product.
����� 2#46+%7.#6' 5174%'5
Particulate emissions from plastic products manufacturing are composed of solid particulatesand hydrocarbon-based aerosols (EPA, 1978). The solid particulates are generated duringgrinding, cutting, and sawing of raw materials as well as finished products; and from thepneumatic and manual conveying and subsequent handling of polymeric materials and additives.
The level of particulate emissions is dependent on several factors. For example, one publication noted an increase in the level of particulate emissions with an increase in process temperature(Barlow et al., 1996). This may be due to the increased level of oxidation (smoking) the rawpolymer undergoes at higher temperatures. Thermoplastic resins may be handled in a variety offorms, from solvent suspended solutions to pellets, beads, flake, or granular form. In general,materials handled in finely divided solid form (resins or flakes) are more likely emitted fromhandling operations than materials handled in larger solid form (chips) or in aqueous solution.
��� 241%'55�&'5+)0�#0&�12'4#6+0)�(#%6145�+0(.7'0%+0)
'/+55+105
����� 241%'55 #0& 12'4#6+0) (#%6145
As mentioned above, emissions from plastic products manufacturing facilities occur where solidresins are heated and melted, liquid solvents and solvent blends are exposed to the atmosphere,additives are introduced, and where chemical reactions occur. Therefore, it is expected thatemissions are influenced by chemical makeup of the process materials, the physical makeup ofthe plastic processing equipment, and the conditions under which processing occurs.
�������� %*#26'4 �� � 2.#56+% 241&7%65 /()
11.2-13'++2 8QNWOG ++
For thermoplastic resins, one of the most important factors is the temperature at which the resinis melted and shaped into the final product. Those processes which occur at or near the meltingpoint of the solid resin result in lower emissions than processes occurring at temperatures wellbeyond the melting point of the resin. For example, published emission factors indicate that forlow-density polyethylene resin, there is an increase of over 400 percent in VOC emissions with achange of temperature from 500 to 600(F (Barlow et al., 1996).
Another important factor is the time interval during which the raw product (solid resin, solventsolutions) is exposed to air. Closed processes, such as enclosed mixing tanks or injectionmolds, result in lower emissions due to less direct contact with air and less opportunity formaterials to volatilize. Conversely, large open tanks or air cooled extrusion processes are likelyto lead to higher emissions. In addition to volatilization of organics and PM emissions fromwind, increased exposure to the atmosphere would lead to increased chemical reactions as mostpolymers are subject to attack from oxygen in the air (Midwest Research Institute, 1993).
Recent testing data appear to indicate that the total surface area of the plastic product exposed toair may also affect emissions. For example, the surface area to mass ratio is greater for blownsheet than for extruded rod, allowing more contact with air and greater opportunity for emissions(on a mass basis). However, further research is needed to validate these conclusions.
����� %10641. 6'%*0+37'5
Emissions from plastic products manufacturing may be reduced either through processmodifications or by using add-on control devices. Process modifications include the use ofalternative raw materials such as alternative blowing agents for foam or switching to non-HAPcontaining additives. Process modifications also refer to the use of modified equipment oroperating practices such as covering storage piles. In addition, keeping the die temperature closeto the resin melting temperature and reducing the residence time of the heated resin in air willhelp reduce emissions.
There are many types of add-on control devices that could potentially be employed at plasticproducts manufacturing facilities to control emissions of VOC, HAPs, and PM. These wouldtypically be most appropriate for contained streams with pollutant concentrations high enoughfor add-on control devices to be cost effective. Unfortunately, there is little informationavailable that indicates the types and extent of add-on control devices currently being used. It isexpected that VOC and organic HAP emissions could be controlled by incineration, adsorption,absorption, or condensation. Incineration and carbon adsorption have been identified astechnologies currently in use at polystyrene foam manufacturing facilities (EPA, 1990). PMemissions generated from finishing operations, including cutting and grinding, are typicallycontrolled by cyclones or fabric filters.

%*#26'4 �� � 2.#56+% 241&7%65 /() ��������
11.2-14 '++2 8QNWOG ++
This page is intentionally left blank.
11.3-1'++2 8QNWOG ++
�
18'48+'9�1(�#8#+.#$.'�/'6*1&5
��� '/+55+10�'56+/#6+10�/'6*1&5
Several methods are available for estimating emissions from primary processes at plasticproducts manufacturing facilities. The best method to use depends upon available data,available resources, and the degree of accuracy required in the estimate. In general, site-specificdata that are representative of normal operations at a particular site are preferred over dataobtained from other similar sites, or industry-averaged data.
This section discusses the methods available for calculating emissions from plastic productsmanufacturing operations and identifies the preferred method of calculation on a pollutant basis. Although preferred methods are identified, this document is not regulatory in nature and doesnot mandate any emission estimation method. Industry personnel using this manual shouldcontact the appropriate state or local air pollution control agency regarding use of suggestedmethods. A comparison of the methods is also presented.
����� /#6'4+#. $#.#0%'
A material balance approach may be used to estimate emissions when the quantities of amaterial used, recycled, incorporated into a product, and disposed of are known. For example,in PSF sheet production, the amount of blowing agent entering the process is a known quantity. After manufacturing is completed, the blowing agent remaining in the product can be measuredby gas chromatography or gravimetric methods. The difference between what was used and theresidual left in the foam represents the total manufacturing emissions (Krutchen and Wu, 1988a,1988b, 1988c).
For liquid applications, such as solvent use, usage figures would typically be in gallons. Thedifference (by mass) of the amount of a liquid used and the amount of the liquid recovered,disposed of, or converted to another form, is assumed to equal releases to the air.
%*#26'4 �� � 2.#56+% 241&7%65 /() ��������
11.3-2 '++2 8QNWOG ++
����� 5174%' 6'565
Source tests provide a "snapshot" of emissions during the period of the test. Samples arecollected using probes inserted into the stack, and pollutants are collected in or on various mediaand sent to a laboratory for analysis or analyzed on-site by continuous analysis. Pollutantconcentrations are obtained by dividing the amount of pollutant collected during the test by thevolume of the sample. Emission rates are then determined by multiplying the pollutantconcentration by the volumetric stack flow rate.
EPA has published approved test methods for determining air emissions in Title 40 CFRPart 60, Appendix A. Methods that would be applicable to plastic products manufacturingwould be Method 18 (speciated organics), Method 25 (total hydrocarbon [THC]), Method 5(PM), Method 201 (PM-10), Method 202 (condensable PM) and Method 0030 (speciatedorganics). In order to obtain accurate results using source testing, state-of-the-art methodsshould be chosen which are specifically targeted for pollutants of interest.
����� '/+55+10 (#%6145
Emission factors are used to estimate emissions based on known relationships between processrates and emission rates. The use of emission factors to estimate emissions from plasticproducts manufacturing facilities is an appropriate approach. Development of an accurateemission factor would require detailed knowledge of the process conditions and chemical andresin usage rates during the time period for which emissions are known. Emission factorsshould be applied to similar-type processes utilizing similar or identical process recipes.
��� %1/2#4+510�1(�#8#+.#$.'�'/+55+10�'56+/#6+10�/'6*1&5
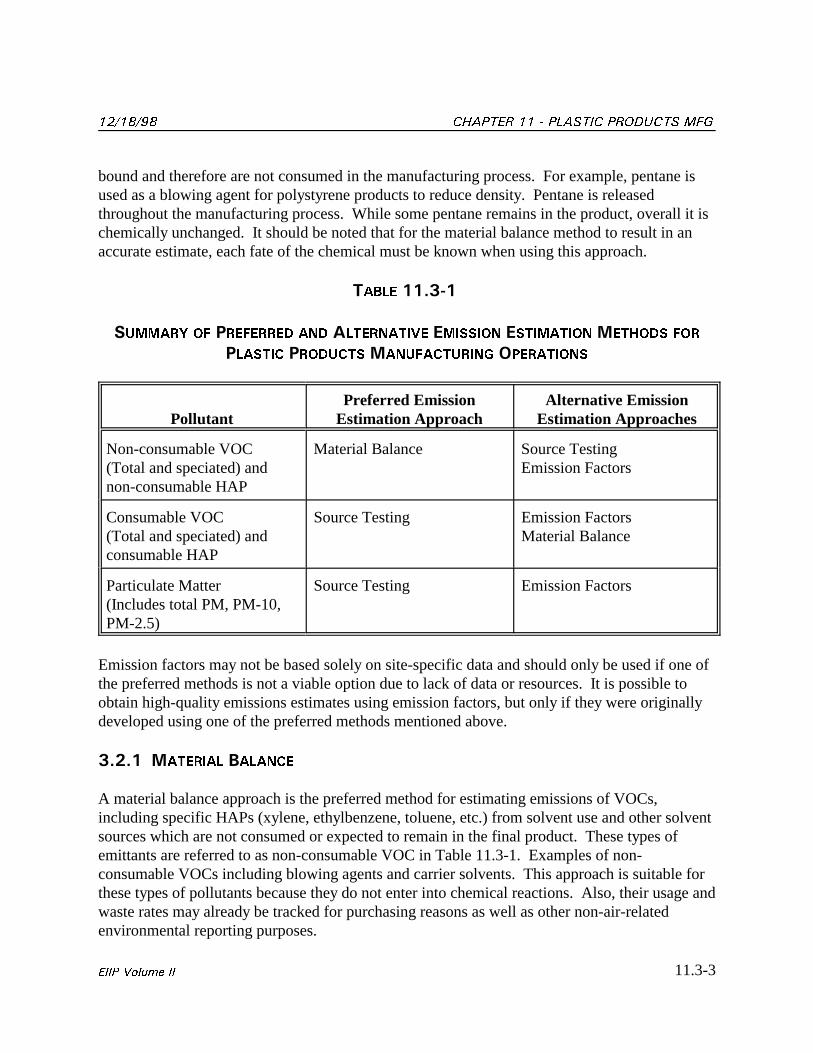
Table 11.3-1 identifies the preferred and alternative emission estimation approaches for theprimary types of pollutants emitted at plastic products manufacturing facilities. The preferredmethod for estimating organic compound (VOC and HAP) emissions is dependent on how thematerial is used and the source of the emissions. For example, the preferred method forestimating emissions of methylene chloride used as a blowing agent is through the use of amaterial balance. Alternatively, the preferred method for estimating emissions of HAPs emittedduring the heating of thermoplastics resins is the use of source testing since the extent ofvolatilization of the pollutant from the resin is unknown. In Table 11.3-1 these two cases areindicated as “Non-consumable VOC or HAP” and “Consumable VOC or HAP.” “ConsumableVOC or HAP” means chemical agents (such as monomers) used in the manufacturing processare chemically altered or bound and are consumed in the manufacturing process. For example,MDI (methylene di-para-phenylene isocyanate) is used in the manufacture of polyurenthane. Itreacts and becomes chemically bound in the final product. “Non-Consumable VOC or HAP”means chemical agents used in the manufacturing process that are not chemically altered or
�������� %*#26'4 �� � 2.#56+% 241&7%65 /()
11.3-3'++2 8QNWOG ++
bound and therefore are not consumed in the manufacturing process. For example, pentane isused as a blowing agent for polystyrene products to reduce density. Pentane is releasedthroughout the manufacturing process. While some pentane remains in the product, overall it ischemically unchanged. It should be noted that for the material balance method to result in anaccurate estimate, each fate of the chemical must be known when using this approach.
6#$.' ������
57//#4; 1( 24'('44'& #0& #.6'40#6+8' '/+55+10 '56+/#6+10 /'6*1&5 (14
2.#56+% 241&7%65 /#07(#%674+0) 12'4#6+105
Pollutant Estimation Approach Estimation ApproachesPreferred Emission Alternative Emission
Non-consumable VOC Material Balance Source Testing(Total and speciated) and Emission Factorsnon-consumable HAP
Consumable VOC Source Testing Emission Factors(Total and speciated) and Material Balanceconsumable HAP
Particulate Matter Source Testing Emission Factors(Includes total PM, PM-10,PM-2.5)
Emission factors may not be based solely on site-specific data and should only be used if one ofthe preferred methods is not a viable option due to lack of data or resources. It is possible toobtain high-quality emissions estimates using emission factors, but only if they were originallydeveloped using one of the preferred methods mentioned above.
����� /#6'4+#. $#.#0%'
A material balance approach is the preferred method for estimating emissions of VOCs,including specific HAPs (xylene, ethylbenzene, toluene, etc.) from solvent use and other solventsources which are not consumed or expected to remain in the final product. These types ofemittants are referred to as non-consumable VOC in Table 11.3-1. Examples of non-consumable VOCs including blowing agents and carrier solvents. This approach is suitable forthese types of pollutants because they do not enter into chemical reactions. Also, their usage andwaste rates may already be tracked for purchasing reasons as well as other non-air-relatedenvironmental reporting purposes.
%*#26'4 �� � 2.#56+% 241&7%65 /() ��������
11.3-4 '++2 8QNWOG ++
For thermoplastic processing where blowing agents, solvents, or other liquids are not involved, amaterial balance technique is generally not the preferred method. For these processes, sourcetesting or emission factors will generally give a more accurate estimate. Examples of theseprocesses are discussed in Section 2 and include most thermoplastic processes where solventsare not added.
For other pollutants emitted at plastic products manufacturing facilities, a material balance maynot be an appropriate primary emission estimate approach due to the uncertainty in the extent ofchemical remaining in the product or generated as the result of chemical reactions. However, amaterial balance could be used as an alternative approach in cases where other methods aredifficult or resource intensive and where a finite number of assumptions would result in acomplete mass balance equation.
����� 5174%' 6'565
The standard EPA test methods mentioned in Section 3.1.2 can be used to obtain emissionestimates from plastic products manufacturing processes for specific classes of compounds. Ingeneral, stack tests result in an accurate assessment of emissions when performed at the point ofemissions generation and when the emissions can be directly correlated to a process activity foruse in developing a site specific emission factor.
However, many of the emissions generating processes found at plastic products manufacturingfacilities are not specifically vented or hooded, resulting in emissions being released as fugitives(through building openings such as windows, doors, and ventilation ducts) rather than throughdiscrete emission points (such as process vents or stacks).
The former scenario would not be conducive to the use of source testing for estimatingemissions. Source testing is best applied to contained gas streams originating at a specificemission generating process such as process vents or sanding and finishing stations.
����� '/+55+10 (#%6145
Emission factors may also be used to estimate emissions from plastic products manufacturing. However, because of the highly variable nature of the plastic products manufacturing process,emission factors should be determined using site-specific data whenever possible. There arethree principal ways to derive emission factors for plastic products manufacturing operations: through the use of emissions test data; a material balance approach; or engineering judgement.
Once derived, these factors may be applied to estimate emissions based on production rates orother appropriate parameters such as usage rates of a particular chemical. This approachprovides an alternative method of estimating emissions over a longer term or for a different
�������� %*#26'4 �� � 2.#56+% 241&7%65 /()
11.3-5'++2 8QNWOG ++
processing scenario based on short-term emission estimates (i.e., during the time of the test)obtained from individual process steps. Also, emission factors for one process or chemical maybe appropriate to use for estimating emissions from similar processes occurring within a facilityor at other similar facilities.
The Society of the Plastics Industry (SPI) recently began a testing program with the cooperationof several resin suppliers to characterize emissions and develop emission factors for a variety ofresin types and manufacturing techniques. Initial results from these testing programs have beenpublished in several recent journal articles (Barlow et al., 1996; Barlow et al., 1997; Contos etal., 1995). The types of resins addressed in these studies include polyethylene, ABS,polypropylene, PVC, polystyrene, polycarbonate, and Nylon.
Emission factors for plastic products manufacturing are also presented in AP-42; SourceAssessment: Plastics Processing, State of the Art (EPA, 1978); and the Factor Information andRetrieval (FIRE) System database. The emission factors presented in Source Assessment:Plastics Processing, State of the Art were developed in the mid 1970's and appear to be severalorders of magnitude higher than emission factors based on recent testing. The reportacknowledges “...that the accuracy of the data in this table (Table 5-Emission Factors) isunknown.” The reader should consult with their local air pollution agency to determine whichemission factors are acceptable for a particular application.

%*#26'4 �� � 2.#56+% 241&7%65 /() ��������
11.3-6 '++2 8QNWOG ++
This page is intentionally left blank.
11.4-1'++2 8QNWOG ++
�
24'('44'&�/'6*1&5�(14
'56+/#6+0)�'/+55+105
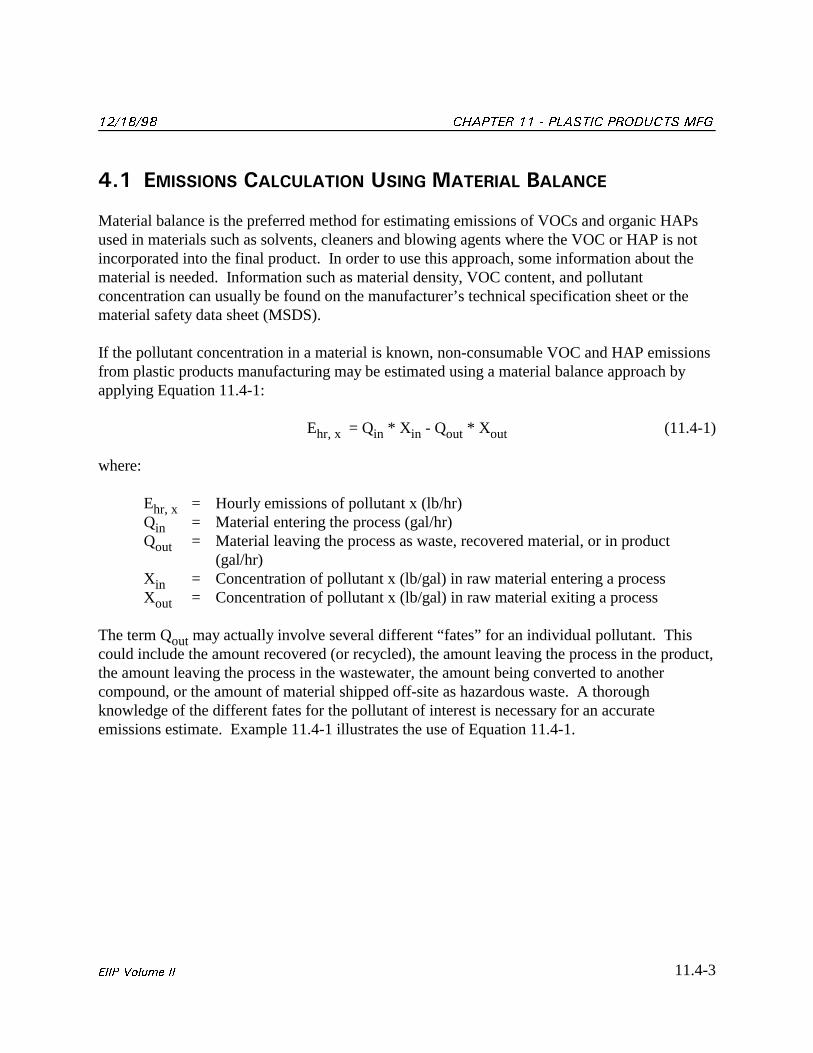
The preferred method for estimating non-consumable VOC emissions (including HAPs) fromplastic products manufacturing processes is the use of a material balance. This approach can beused to estimate emissions from solvent use and coating application for pollutants not involvedin chemical reactions. As mentioned in Section 3, material balance uses the raw material usagerate and material disposal rate (present in product or waste streams) to estimate emissions;therefore, a detailed knowledge of each fate of the chemical is needed.
The preferred method for estimating PM and consumable VOC (including HAPs) emissions isthe use of source testing. This is also the preferred method for estimating emissions ofpollutants generated as a result of chemical reactions, thermal degradation, or pollutants withuncertain fates or origins.
It should be noted that for many processes both consumable and non-consumable chemicals areused. As the preferred methods are chemical specific and not process specific, severalestimation techniques may be preferred for an individual operation.
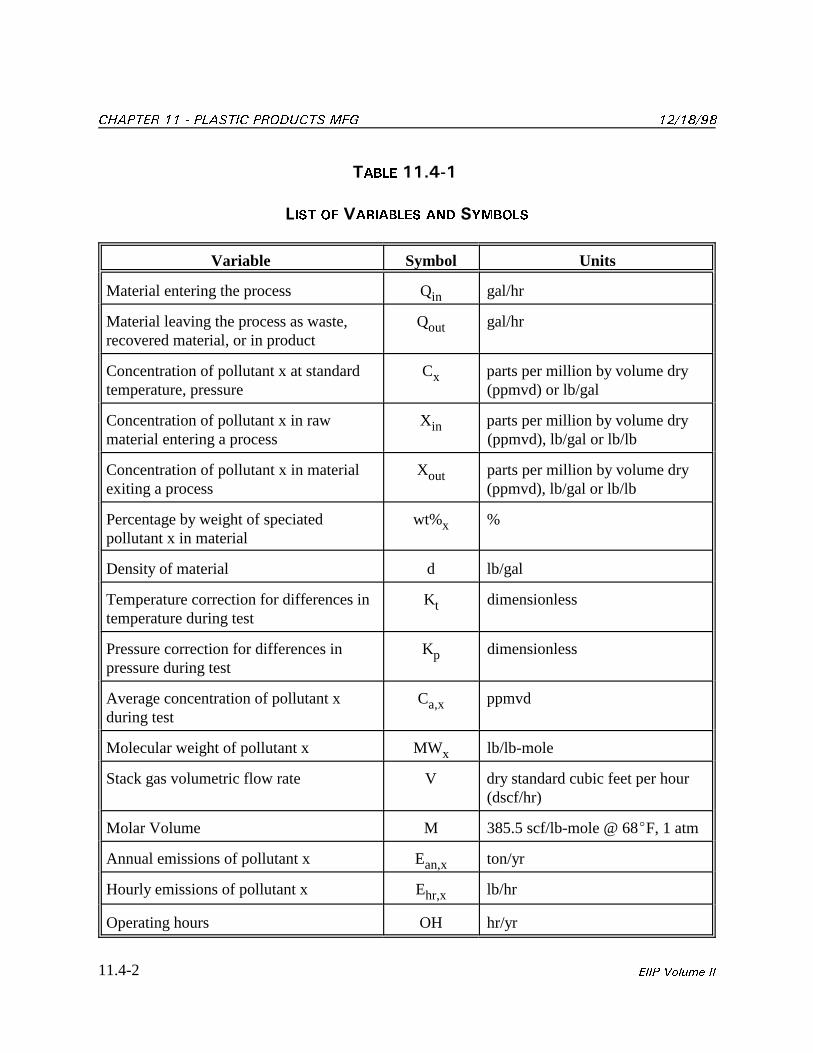
The equations and examples in this section present how material balance and source testing datamay be used to estimate VOC, speciated organic, speciated inorganic, and particulate emissions. Table 11.4-1 lists the variables and symbols used in the following discussions.
%*#26'4 �� � 2.#56+% 241&7%65 /() ��������
11.4-2 '++2 8QNWOG ++
6#$.' ������
.+56 1( 8#4+#$.'5 #0& 5;/$1.5
Variable Symbol Units
Material entering the process Q gal/hrin
Material leaving the process as waste, Q gal/hrrecovered material, or in product
out
Concentration of pollutant x at standard C parts per million by volume drytemperature, pressure (ppmvd) or lb/gal
x
Concentration of pollutant x in raw X parts per million by volume drymaterial entering a process (ppmvd), lb/gal or lb/lb
in
Concentration of pollutant x in material X parts per million by volume dryexiting a process (ppmvd), lb/gal or lb/lb
out
Percentage by weight of speciated wt% %pollutant x in material
x
Density of material d lb/gal
Temperature correction for differences in K dimensionlesstemperature during test
t
Pressure correction for differences in K dimensionlesspressure during test
p
Average concentration of pollutant x C ppmvdduring test
a,x
Molecular weight of pollutant x MW lb/lb-molex
Stack gas volumetric flow rate V dry standard cubic feet per hour(dscf/hr)
Molar Volume M 385.5 scf/lb-mole @ 68(F, 1 atm
Annual emissions of pollutant x E ton/yran,x
Hourly emissions of pollutant x E lb/hrhr,x
Operating hours OH hr/yr
�������� %*#26'4 �� � 2.#56+% 241&7%65 /()
11.4-3'++2 8QNWOG ++
��� '/+55+105�%#.%7.#6+10�75+0)�/#6'4+#.�$#.#0%'�
Material balance is the preferred method for estimating emissions of VOCs and organic HAPsused in materials such as solvents, cleaners and blowing agents where the VOC or HAP is notincorporated into the final product. In order to use this approach, some information about thematerial is needed. Information such as material density, VOC content, and pollutantconcentration can usually be found on the manufacturer’s technical specification sheet or thematerial safety data sheet (MSDS).
If the pollutant concentration in a material is known, non-consumable VOC and HAP emissionsfrom plastic products manufacturing may be estimated using a material balance approach byapplying Equation 11.4-1:
E = Q * X - Q * X (11.4-1)hr, x in in out out
where:
E = Hourly emissions of pollutant x (lb/hr)hr, xQ = Material entering the process (gal/hr)inQ = Material leaving the process as waste, recovered material, or in productout
(gal/hr)X = Concentration of pollutant x (lb/gal) in raw material entering a processinX = Concentration of pollutant x (lb/gal) in raw material exiting a processout
The term Q may actually involve several different “fates” for an individual pollutant. Thisoutcould include the amount recovered (or recycled), the amount leaving the process in the product,the amount leaving the process in the wastewater, the amount being converted to anothercompound, or the amount of material shipped off-site as hazardous waste. A thoroughknowledge of the different fates for the pollutant of interest is necessary for an accurateemissions estimate. Example 11.4-1 illustrates the use of Equation 11.4-1.
%*#26'4 �� � 2.#56+% 241&7%65 /() ��������
11.4-4 '++2 8QNWOG ++
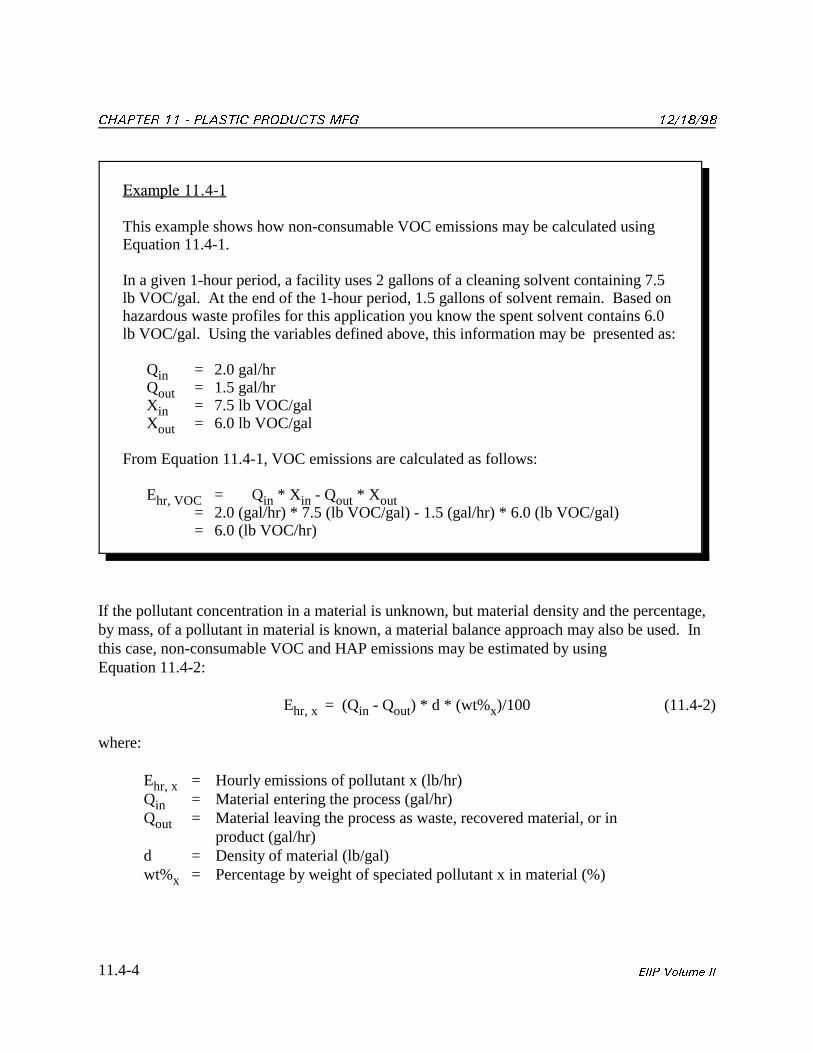
'ZCORNG�������
This example shows how non-consumable VOC emissions may be calculated usingEquation 11.4-1.
In a given 1-hour period, a facility uses 2 gallons of a cleaning solvent containing 7.5lb VOC/gal. At the end of the 1-hour period, 1.5 gallons of solvent remain. Based onhazardous waste profiles for this application you know the spent solvent contains 6.0lb VOC/gal. Using the variables defined above, this information may be presented as:
Q = 2.0 gal/hrinQ = 1.5 gal/hroutX = 7.5 lb VOC/galinX = 6.0 lb VOC/galout
From Equation 11.4-1, VOC emissions are calculated as follows:
E = Q * X - Q * Xhr, VOC in in out out= 2.0 (gal/hr) * 7.5 (lb VOC/gal) - 1.5 (gal/hr) * 6.0 (lb VOC/gal)= 6.0 (lb VOC/hr)
If the pollutant concentration in a material is unknown, but material density and the percentage,by mass, of a pollutant in material is known, a material balance approach may also be used. Inthis case, non-consumable VOC and HAP emissions may be estimated by usingEquation 11.4-2:
E = (Q - Q ) * d * (wt% )/100 (11.4-2)hr, x in out x
where:
E = Hourly emissions of pollutant x (lb/hr)hr, xQ = Material entering the process (gal/hr)inQ = Material leaving the process as waste, recovered material, or in out
product (gal/hr)d = Density of material (lb/gal)wt% = Percentage by weight of speciated pollutant x in material (%)x
�������� %*#26'4 �� � 2.#56+% 241&7%65 /()
11.4-5'++2 8QNWOG ++
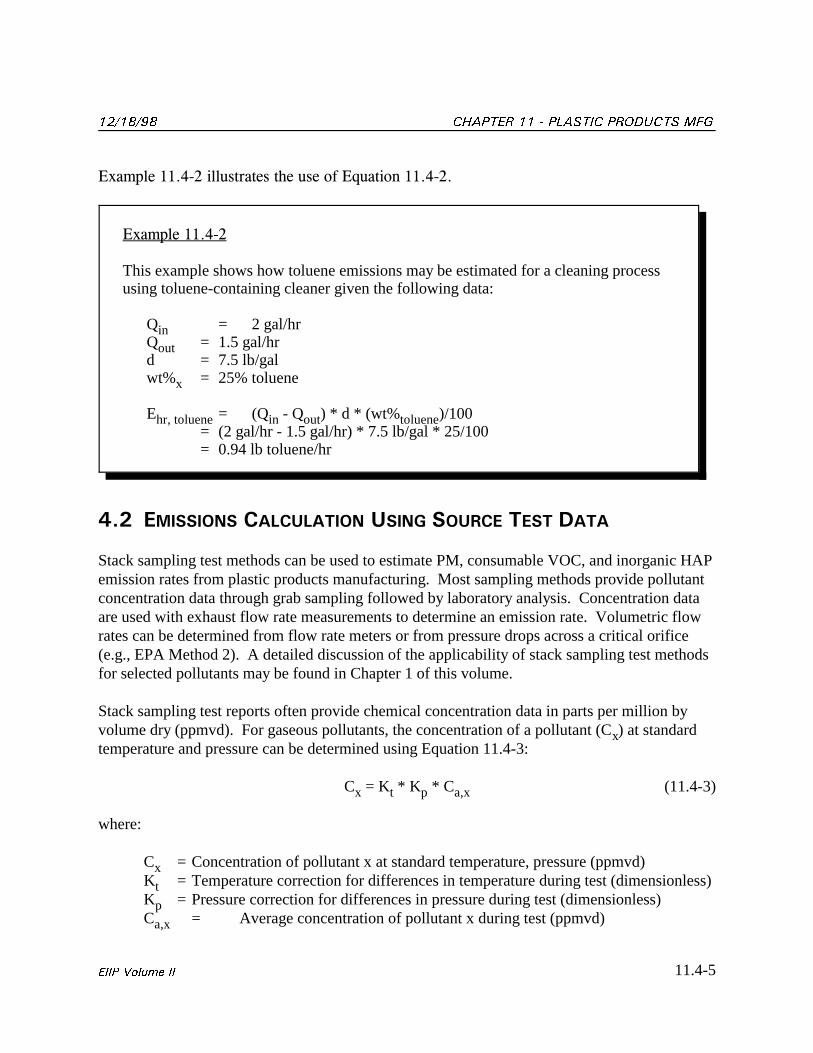
'ZCORNG�������
This example shows how toluene emissions may be estimated for a cleaning processusing toluene-containing cleaner given the following data:
Q = 2 gal/hrinQ = 1.5 gal/hroutd = 7.5 lb/galwt% = 25% toluenex
E = (Q - Q ) * d * (wt% )/100hr, toluene in out toluene= (2 gal/hr - 1.5 gal/hr) * 7.5 lb/gal * 25/100= 0.94 lb toluene/hr
'ZCORNG��������KNNWUVTCVGU�VJG�WUG�QH�'SWCVKQP��������
��� '/+55+105�%#.%7.#6+10�75+0)�5174%'�6'56�#
Stack sampling test methods can be used to estimate PM, consumable VOC, and inorganic HAPemission rates from plastic products manufacturing. Most sampling methods provide pollutantconcentration data through grab sampling followed by laboratory analysis. Concentration dataare used with exhaust flow rate measurements to determine an emission rate. Volumetric flowrates can be determined from flow rate meters or from pressure drops across a critical orifice(e.g., EPA Method 2). A detailed discussion of the applicability of stack sampling test methodsfor selected pollutants may be found in Chapter 1 of this volume.
Stack sampling test reports often provide chemical concentration data in parts per million byvolume dry (ppmvd). For gaseous pollutants, the concentration of a pollutant (C ) at standardxtemperature and pressure can be determined using Equation 11.4-3:
C = K * K * C (11.4-3)x t p a,x
where:
C = Concentration of pollutant x at standard temperature, pressure (ppmvd)xK = Temperature correction for differences in temperature during test (dimensionless)tK = Pressure correction for differences in pressure during test (dimensionless)pC = Average concentration of pollutant x during test (ppmvd)a,x
%*#26'4 �� � 2.#56+% 241&7%65 /() ��������
11.4-6 '++2 8QNWOG ++
If the concentration is known, an hourly emission rate can be determined using Equation 11.4-4:
E = (C * MW * V)/(M * 10 ) (11.4-4)hr,x x x6
where:
E = Hourly emissions of pollutant x (lb/hr)hr,xC = Concentration of pollutant x at standard temperature, pressure (ppmvd)xMW = Molecular weight of pollutant x (lb/lb-mole)xV = Stack gas volumetric flow rate (dscf/hr)M = Molar volume; i.e., volume occupied by 1 mole of ideal gas at standard
temperature and pressure (385.5 scf/lb-mole at 68(F and 1 atm)
Emissions in tons per year can be calculated by multiplying the hourly emission rate (lb/hr) fromEquation 11.4-4 by the number of operating hours (as shown in Equation 11.4-5 below).
E = E * OH * 1 ton/2,000 lb (11.4-5)an,x hr,x
where:
E = Annual emissions of pollutant x (ton/yr)an,xE = Total hourly emissions of pollutant x (lb/hr)hr,x
OH = Operating hours (hr/yr)
Example 11.4-3 illustrates the use of Equations 11.4-3 through 11.4-5.
Concentration data obtained from source testing may come in a variety of units, including partsper million (ppm) or grams per dry standard cubic feet (g/dscf), and in a variety of conditions, such as wet, dry, or excess oxygen (O ). This may require conversion of concentration data to2consistent units for compatibility with the equations given above.
�������� %*#26'4 �� � 2.#56+% 241&7%65 /()
11.4-7'++2 8QNWOG ++
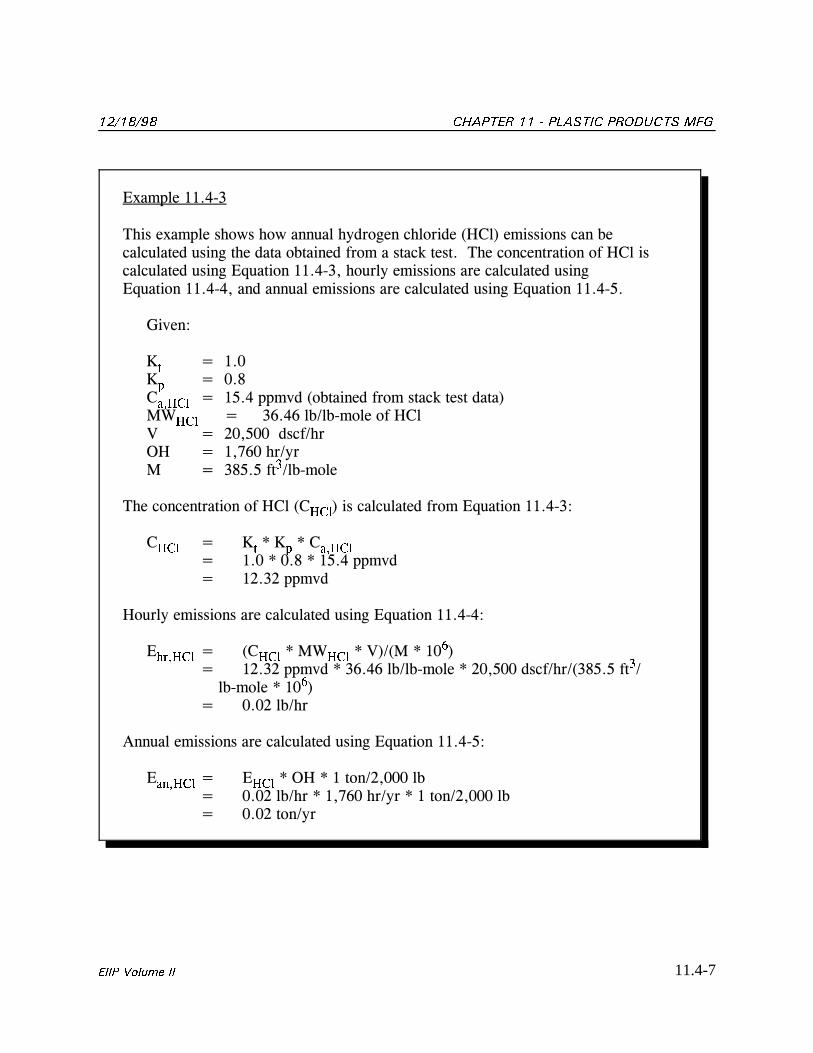
'ZCORNG�������
6JKU�GZCORNG�UJQYU�JQY�CPPWCN�J[FTQIGP�EJNQTKFG�*%N��GOKUUKQPU�ECP�DGECNEWNCVGF�WUKPI�VJG�FCVC�QDVCKPGF�HTQO�C�UVCEM�VGUV���6JG�EQPEGPVTCVKQP�QH�*%N�KUECNEWNCVGF�WUKPI�'SWCVKQP���������JQWTN[�GOKUUKQPU�CTG�ECNEWNCVGF�WUKPI'SWCVKQP���������CPF�CPPWCN�GOKUUKQPU�CTG�ECNEWNCVGF�WUKPI�'SWCVKQP��������
)KXGP��
- � ���V- � ���R% � �����RROXF�QDVCKPGF�HTQO�UVCEM�VGUV�FCVC�C�*%N/9 � ������ND�ND�OQNG�QH�*%N*%N8 �� ��������FUEH�JT1* � ������JT�[T�/ � ������HV �ND�OQNG�
6JG�EQPEGPVTCVKQP�QH�*%N�% ��KU�ECNEWNCVGF�HTQO�'SWCVKQP��������*%N
% � - ���- ���%*%N V� � R� � C�*%N� �����������������RROXF�� ������RROXF
*QWTN[�GOKUUKQPU�CTG�ECNEWNCVGF�WUKPI�'SWCVKQP��������
' � % ���/9 ���8��/����� �JT�*%N *%N� � *%N�
� ������RROXF���������ND�ND�OQNG����������FUEH�JT�������HV ��
ND�OQNG����� ��
� �����ND�JT�
#PPWCN�GOKUUKQPU�CTG�ECNEWNCVGF�WUKPI�'SWCVKQP��������
' � ' ���1*�����VQP�������NDCP�*%N *%N� �����ND�JT���������JT�[T�����VQP�������ND� �����VQP�[T

%*#26'4 �� � 2.#56+% 241&7%65 /() ��������
11.4-8 '++2 8QNWOG ++
This page is intentionally left blank.
11.5-1'++2 8QNWOG ++
�
#.6'40#6+8'�/'6*1&5�(14
'56+/#6+0)�'/+55+105
Source testing, material balance, and emission factors are all alternative methods for estimatingorganic compound emissions (including VOC and HAP) and inorganic compound emissionsfrom primary processes at plastic products manufacturing facilities. Emission factors may beused as an alternative method for estimating emissions of PM.
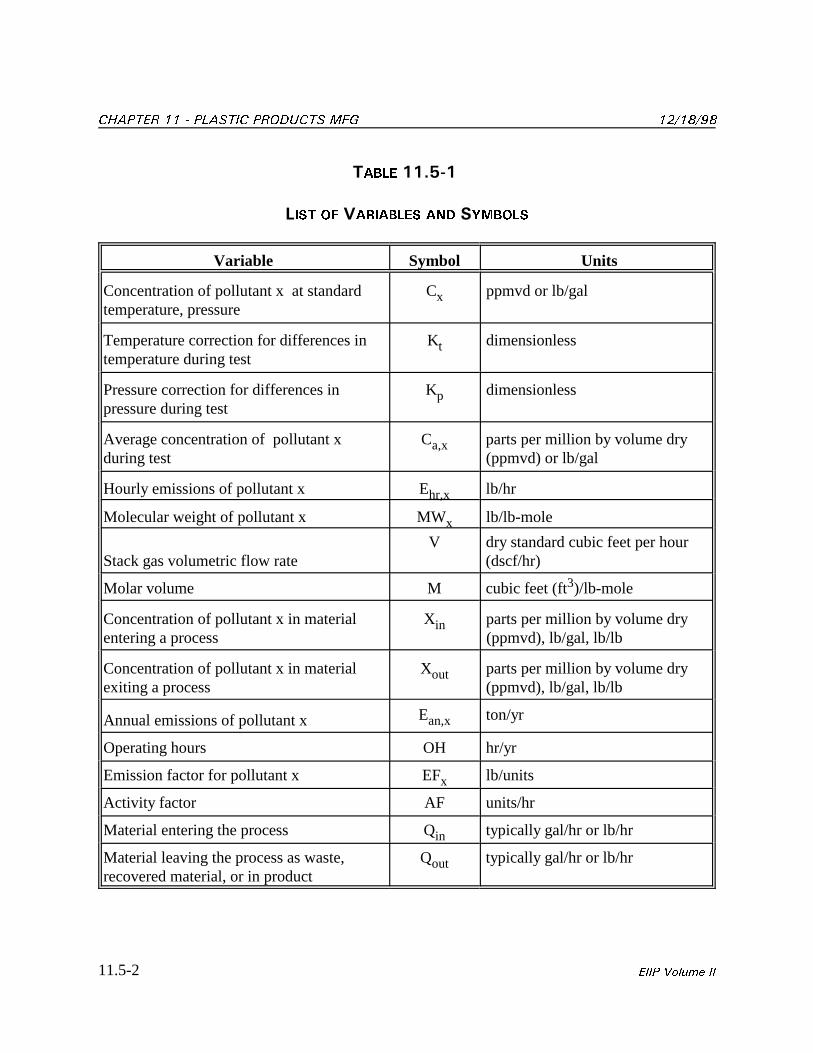
The following equations and examples present how source test data, emission factors and material balance may be used to estimate PM, VOC (consumable and non-consumable),speciated organic, and speciated inorganic emissions. Table 11.5-1 lists the variables andsymbols used in the following discussions.
��� '/+55+105�%#.%7.#6+10�75+0)�5174%'�6'56�#
Various stack sampling test methods can be used to estimate non-consumable VOC andspeciated organic emission rates from plastic products manufacturing (e.g., EPA Method 25). Volumetric flow rates can be determined from flow rate meters or from pressure drops across acritical orifice (e.g., EPA Method 2).
Stack sampling test reports often provide chemical concentration data in parts per million byvolume dry (ppmvd). For gaseous pollutants, the concentration of a pollutant (C ) can bexdetermined from Equation 11.5-1:
C = K * K * C (11.5-1)x t p a,x
%*#26'4 �� � 2.#56+% 241&7%65 /() ��������
11.5-2 '++2 8QNWOG ++
6#$.' ������
.+56 1( 8#4+#$.'5 #0& 5;/$1.5
Variable Symbol Units
Concentration of pollutant x at standard C ppmvd or lb/galtemperature, pressure
x
Temperature correction for differences in K dimensionlesstemperature during test
t
Pressure correction for differences in K dimensionlesspressure during test
p
Average concentration of pollutant x C parts per million by volume dryduring test (ppmvd) or lb/gal
a,x
Hourly emissions of pollutant x E lb/hrhr,x
Molecular weight of pollutant x MW lb/lb-molex
Stack gas volumetric flow rate (dscf/hr)V dry standard cubic feet per hour
Molar volume M cubic feet (ft )/lb-mole3
Concentration of pollutant x in material X parts per million by volume dryentering a process (ppmvd), lb/gal, lb/lb
in
Concentration of pollutant x in material X parts per million by volume dryexiting a process (ppmvd), lb/gal, lb/lb
out
Annual emissions of pollutant x E ton/yran,x
Operating hours OH hr/yr
Emission factor for pollutant x EF lb/unitsx
Activity factor AF units/hr
Material entering the process Q typically gal/hr or lb/hrin
Material leaving the process as waste, Q typically gal/hr or lb/hrrecovered material, or in product
out
�������� %*#26'4 �� � 2.#56+% 241&7%65 /()
11.5-3'++2 8QNWOG ++
where:
C = Concentration of pollutant x (ppmvd) at standard temperature, pressurexK = Temperature correction for differences in temperature during testt
(dimensionless)K = Pressure correction for differences in pressure during test (dimensionless)pC = Average concentration of pollutant x (ppmvd) during testa,x
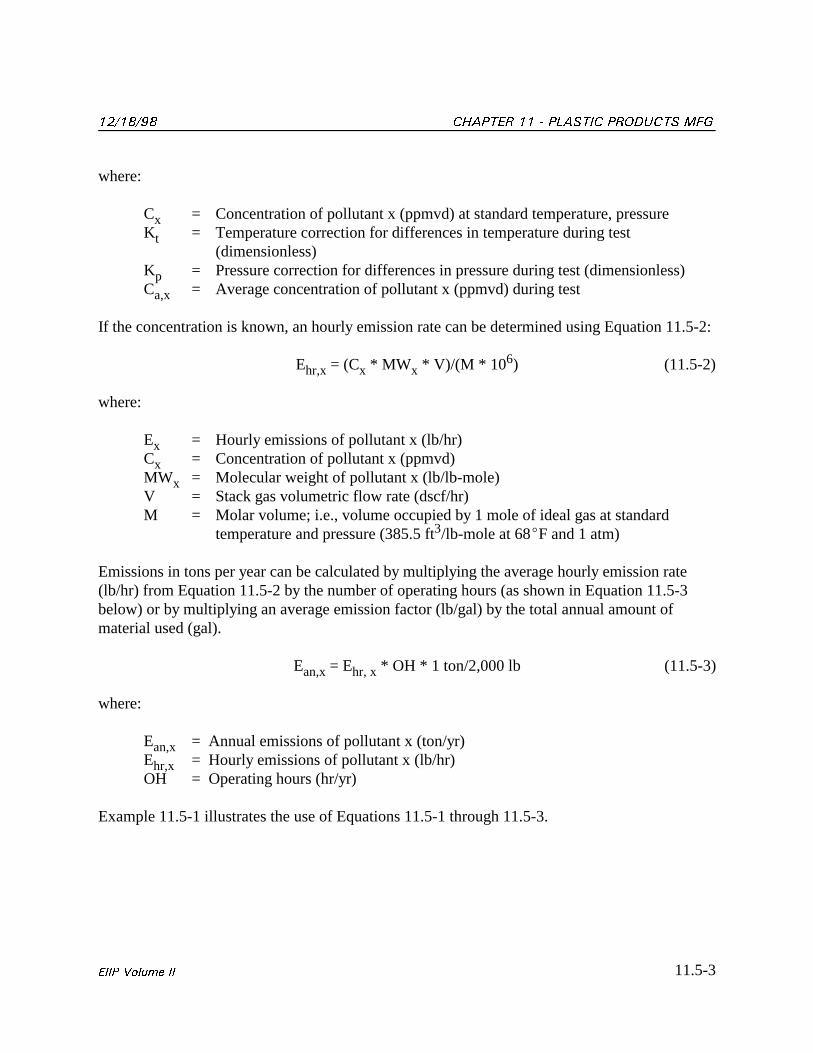
If the concentration is known, an hourly emission rate can be determined using Equation 11.5-2:
E = (C * MW * V)/(M * 10 ) (11.5-2)hr,x x x6
where:
E = Hourly emissions of pollutant x (lb/hr)xC = Concentration of pollutant x (ppmvd)xMW = Molecular weight of pollutant x (lb/lb-mole)xV = Stack gas volumetric flow rate (dscf/hr)M = Molar volume; i.e., volume occupied by 1 mole of ideal gas at standard
temperature and pressure (385.5 ft /lb-mole at 68(F and 1 atm)3
Emissions in tons per year can be calculated by multiplying the average hourly emission rate(lb/hr) from Equation 11.5-2 by the number of operating hours (as shown in Equation 11.5-3below) or by multiplying an average emission factor (lb/gal) by the total annual amount ofmaterial used (gal).
E = E * OH * 1 ton/2,000 lb (11.5-3)an,x hr, x
where:
E = Annual emissions of pollutant x (ton/yr)an,xE = Hourly emissions of pollutant x (lb/hr)hr,x
OH = Operating hours (hr/yr)
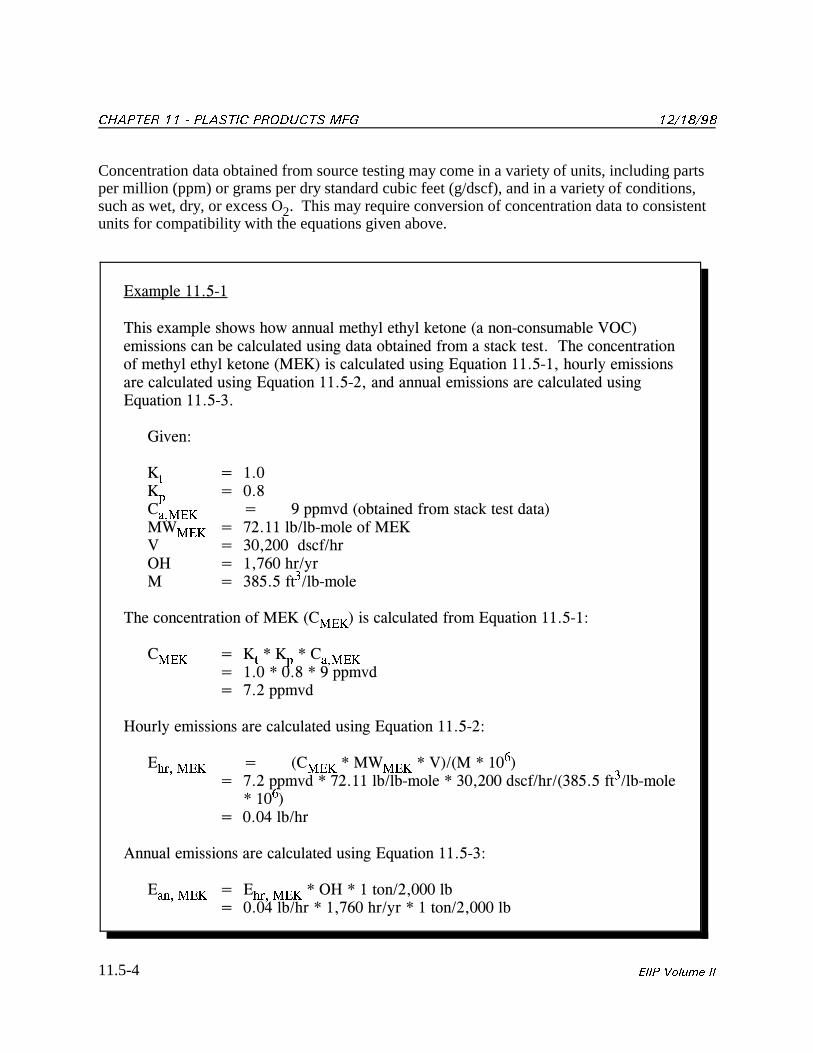
Example 11.5-1 illustrates the use of Equations 11.5-1 through 11.5-3.
%*#26'4 �� � 2.#56+% 241&7%65 /() ��������
11.5-4 '++2 8QNWOG ++
'ZCORNG�������
6JKU�GZCORNG�UJQYU�JQY�CPPWCN�OGVJ[N�GVJ[N�MGVQPG�C�PQP�EQPUWOCDNG�81%��GOKUUKQPU�ECP�DG�ECNEWNCVGF�WUKPI�FCVC�QDVCKPGF�HTQO�C�UVCEM�VGUV���6JG�EQPEGPVTCVKQPQH�OGVJ[N�GVJ[N�MGVQPG�/'-��KU�ECNEWNCVGF�WUKPI�'SWCVKQP���������JQWTN[�GOKUUKQPUCTG�ECNEWNCVGF�WUKPI�'SWCVKQP���������CPF�CPPWCN�GOKUUKQPU�CTG�ECNEWNCVGF�WUKPI'SWCVKQP��������
)KXGP��
- � ���V- � ���R% � ��RROXF�QDVCKPGF�HTQO�UVCEM�VGUV�FCVC�C�/'-/9 � ������ND�ND�OQNG�QH�/'-/'-8 � ��������FUEH�JT1* � ������JT�[T�/ � ������HV �ND�OQNG�
6JG�EQPEGPVTCVKQP�QH�/'-�% ��KU�ECNEWNCVGF�HTQO�'SWCVKQP��������/'-
% � - ���- ���%/'- V� � R� � C�/'-� ��������������RROXF�� ����RROXF
*QWTN[�GOKUUKQPU�CTG�ECNEWNCVGF�WUKPI�'SWCVKQP��������
' � % ���/9 ���8��/����� �JT� /'- /'-� � /'-�
�� ����RROXF���������ND�ND�OQNG����������FUEH�JT�������HV �ND�OQNG��
���� ��
��������ND�JT�
#PPWCN�GOKUUKQPU�CTG�ECNEWNCVGF�WUKPI�'SWCVKQP��������
' � ' ���1*�����VQP�������NDCP� /'- JT� /'-� �����ND�JT���������JT�[T�����VQP�������ND
Concentration data obtained from source testing may come in a variety of units, including partsper million (ppm) or grams per dry standard cubic feet (g/dscf), and in a variety of conditions,such as wet, dry, or excess O . This may require conversion of concentration data to consistent2units for compatibility with the equations given above.
�������� %*#26'4 �� � 2.#56+% 241&7%65 /()
11.5-5'++2 8QNWOG ++
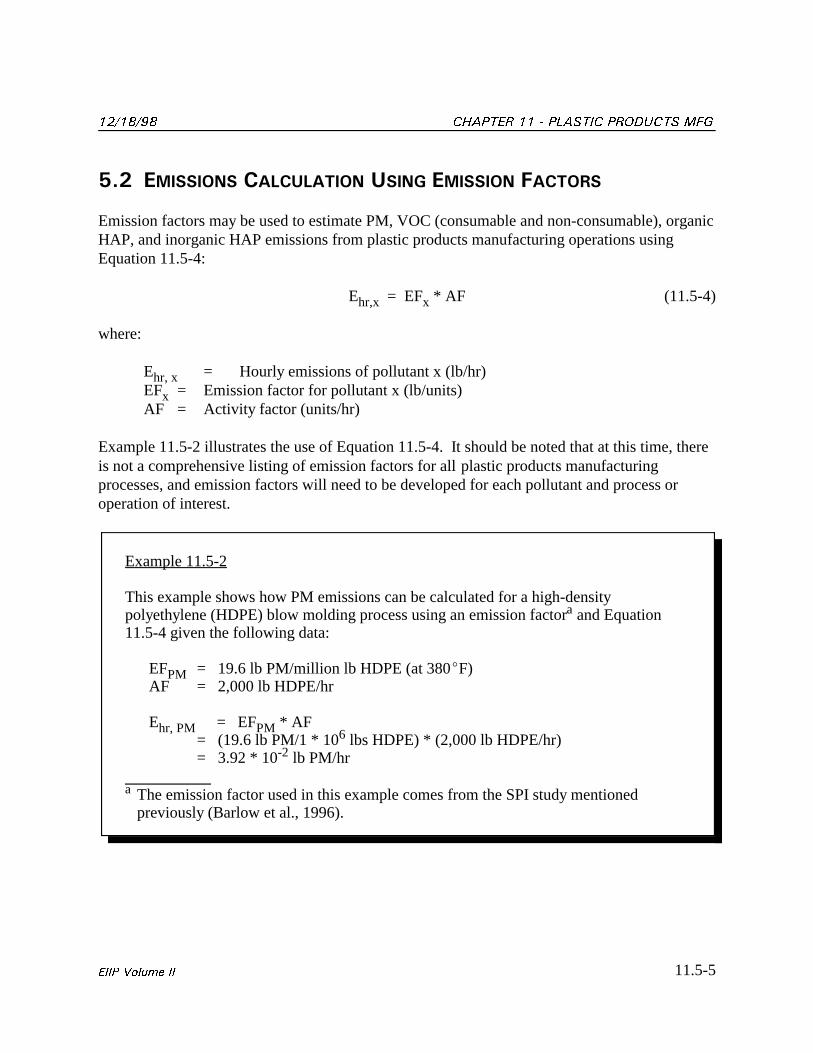
Example 11.5-2
This example shows how PM emissions can be calculated for a high-densitypolyethylene (HDPE) blow molding process using an emission factor and Equationa
11.5-4 given the following data:
EF = 19.6 lb PM/million lb HDPE (at 380(F)PMAF = 2,000 lb HDPE/hr
E = EF * AFhr, PM PM= (19.6 lb PM/1 * 10 lbs HDPE) * (2,000 lb HDPE/hr)6
= 3.92 * 10 lb PM/hr-2
The emission factor used in this example comes from the SPI study mentioneda
previously (Barlow et al., 1996).
��� '/+55+105�%#.%7.#6+10�75+0)�'/+55+10�(#%6145
Emission factors may be used to estimate PM, VOC (consumable and non-consumable), organicHAP, and inorganic HAP emissions from plastic products manufacturing operations usingEquation 11.5-4:
E = EF * AF (11.5-4)hr,x x
where:
E = Hourly emissions of pollutant x (lb/hr)hr, xEF = Emission factor for pollutant x (lb/units)xAF = Activity factor (units/hr)
Example 11.5-2 illustrates the use of Equation 11.5-4. It should be noted that at this time, thereis not a comprehensive listing of emission factors for all�plastic productU manufacturingprocesses, and emission factors will need to be developed for each pollutant and process oroperation of interest.
%*#26'4 �� � 2.#56+% 241&7%65 /() ��������
11.5-6 '++2 8QNWOG ++
��� '/+55+105�%#.%7.#6+10�75+0)�/#6'4+#.�$#.#0%'�
Consumable VOC emissions from plastic products manufacturing may be estimated using amaterial balance approach by applying Equation 11.5-5:
E = Q * X - Q * X (11.5-5)hr,x in in out outwhere:
E = Hourly emissions of pollutant x (lb/hr)hr,xQ = Material entering the process (gal/hr or lb/hr)inQ = Material leaving the process as waste, recovered material, or in out
product (gal/hr or lb/hr)X = Concentration of pollutant x (lb/gal) in raw material entering a processinX = Concentration of pollutant x (lb/gal) in raw material exiting a processout
The term Q may actually involve several different “fates” for an individual pollutant. Thisoutcould include the amount recovered (or recycled), the amount leaving the process in the product,the amount leaving the process in the wastewater, the amount being converted to anothercompound or the amount of material shipped off-site as hazardous waste. A thoroughknowledge of the different fates for the pollutant of interest is necessary for an accurateemissions estimate. Fates of pollutants should include pollutants created through chemicaldegradation or re-polymerization. Example 11.5-3 illustrates the use of Equation 11.5-5.
�������� %*#26'4 �� � 2.#56+% 241&7%65 /()
11.5-7'++2 8QNWOG ++
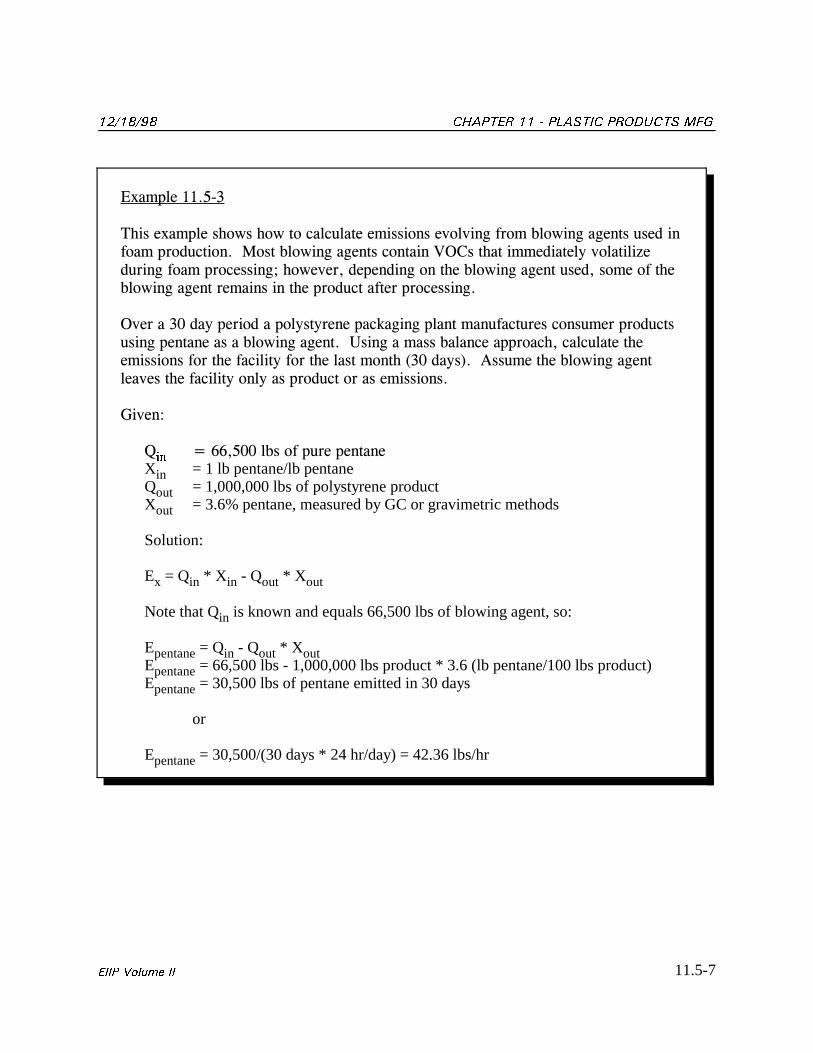
'ZCORNG�������
6JKU�GZCORNG�UJQYU�JQY�VQ�ECNEWNCVG�GOKUUKQPU�GXQNXKPI�HTQO�DNQYKPI�CIGPVU�WUGF�KPHQCO�RTQFWEVKQP���/QUV�DNQYKPI�CIGPVU�EQPVCKP�81%U�VJCV�KOOGFKCVGN[�XQNCVKNK\GFWTKPI�HQCO�RTQEGUUKPI��JQYGXGT��FGRGPFKPI�QP�VJG�DNQYKPI�CIGPV�WUGF��UQOG�QH�VJGDNQYKPI�CIGPV�TGOCKPU�KP�VJG�RTQFWEV�CHVGT�RTQEGUUKPI�
1XGT�C����FC[�RGTKQF�C�RQN[UV[TGPG�RCEMCIKPI�RNCPV�OCPWHCEVWTGU�EQPUWOGT�RTQFWEVUWUKPI�RGPVCPG�CU�C�DNQYKPI�CIGPV���7UKPI�C�OCUU�DCNCPEG�CRRTQCEJ��ECNEWNCVG�VJGGOKUUKQPU�HQT�VJG�HCEKNKV[�HQT�VJG�NCUV�OQPVJ����FC[U����#UUWOG�VJG�DNQYKPI�CIGPVNGCXGU�VJG�HCEKNKV[�QPN[�CU�RTQFWEV�QT�CU�GOKUUKQPU�
)KXGP�
3 � ���������NDU�QH�RWTG�RGPVCPGKPX = 1 lb pentane/lb pentaneinQ = 1,000,000 lbs of polystyrene productoutX = 3.6% pentane, measured by GC or gravimetric methodsout
Solution:
E = Q * X - Q * Xx in in out out
Note that Q is known and equals 66,500 lbs of blowing agent, so:in
E = Q - Q * Xpentane in out outE = 66,500 lbs - 1,000,000 lbs product * 3.6 (lb pentane/100 lbs product)pentaneE = 30,500 lbs of pentane emitted in 30 dayspentane
or
E = 30,500/(30 days * 24 hr/day) = 42.36 lbs/hrpentane

%*#26'4 �� � 2.#56+% 241&7%65 /() ��������
11.5-8 '++2 8QNWOG ++
This page is intentionally left blank.
11.6-1'++2 8QNWOG ++
�
37#.+6;�#5574#0%'�37#.+6;
%10641.
Quality assurance (QA) and quality control (QC) are essential elements in producing highquality emission estimates and should be included in all methods used to estimate emissions. QA/QC of emissions estimates are accomplished through a set of procedures that ensure thequality and reliability of data collection and processing. These procedures include the use ofappropriate emission estimation methods, reasonable assumptions, data reliability checks, andaccuracy/logic checks of calculations. Volume VI of this EIIP document series, QualityAssurance Procedures, describes methods and tools for performing these QA/QC procedures.
In addition, Chapter 1 of this EIIP Point Sources Volume, Introduction to Point SourceEmission Inventory Development, provides QA/QC guidance for preparing point sourceemission estimates. The following sections discuss QA/QC considerations that are specific tothe emission estimation methods presented in this chapter for estimating emissions from plasticproducts manufacturing.
��� 3#�3%�(14�75+0)�/#6'4+#.�$#.#0%'
The material balance method for estimating emissions may use various approaches, so theQA/QC considerations will vary and may be specific to an approach. Generally, the fates of allmaterials of interest are identified, and then the quantity of material allocated to each fatedetermined. Identifying these fates, such as material contained in a product or material leavingthe process in the wastewater, is usually straightforward. However, estimating the amount ofmaterial allocated to each fate is sometimes complicated and is the prime QA/QC considerationin using the material balance approach. Amounts obtained by direct measurement are moreaccurate and produce emission estimates of higher quality than those obtained by engineering ortheoretical calculations. QA/QC of an emissions estimate developed from a material balanceapproach should include a thorough check of all assumptions and calculations.
��� 3#�3%�(14�75+0)�'/+55+10�(#%6145�
When using emission factors to estimate emissions from plastic products manufacturing, theapplicability and representativeness of the emission factor are the first criteria to consider. Toassess applicability, the reviewer needs to examine how closely the process of interest matches
%*#26'4 �� � 2.#56+% 241&7%65 /() ��������
11.6-2 '++2 8QNWOG ++
the process for which the emission factor is available. Similarly, the reviewer should look athow well the range of conditions on which the available emission factor is based compares tothe conditions of interest. For example, an emission factor that is based on a strand extruderprocess may be appropriate for a conservative estimate of emissions from heavy sheet andprofile extrusion (as well as closed mold operations such as injection molding) andthermoforming, but may not be the best emission factor for a film process.
��� 3#�3%�(14�75+0)�5174%'�6'56�#
In reviewing stack sampling data, the first consideration is whether the method measures thepollutant of interest or can only be used as a surrogate. For example, if particulate matterconcentration in a hood exhaust is measured, PM-10 emissions could be estimated only afterassuming all, or a given percentage, of the particulate is present as PM-10. Next, the reviewershould determine whether the sampling conditions represent the operating conditions of interestfor the emission estimate. For example, if the data are to be used to estimate emissions duringtypical operations, then sampling should have been done during typical operating conditions. Parameters that should be evaluated in QA/QC of stack sampling data and the acceptancecriteria for stack sampling are presented in Chapter 1 of this volume and in the individual testmethods.
��� #�#664+$76'�4#6+0)�5;56'/�-��5%14'5
One measure of emission inventory data quality is the DARS score. Chapter 4 of Volume VI,Quality Assurance Procedures, and the QA/QC section in Chapter 1 of this volume provide acomplete discussion of DARS. DARS assumes activity data and factor data are used to generatean inventory and provides criteria that are used to assign a numerical score to each data set. Theactivity score is multiplied by the factor score to obtain a composite score for the emissionsestimate. The highest (best) possible value for an individual or composite score is 1.0. Thecomposite score for the emissions estimate can be used to evaluate the quality and accuracy ofthe estimate.
DARS was used to evaluate the methods for estimating emissions that are presented in thisdocument to provide an idea of the relative quality of each method. This was accomplished byassuming an inventory was developed using each method and using DARS to score eachinventory. Because the inventories are hypothetical, it was necessary to make some additionalassumptions. The first three assumptions were that emissions are for a 1-year period, from oneprocess or from one facility, and for normal operating conditions. Also, all material usage dataused were assumed to be reasonably accurate. Some scores are expressed as a range, with thelower value representing an estimate developed from low- to medium-quality data and the uppervalue representing an estimate based on relatively high-quality data. Tables 11.6-1 through
�������� %*#26'4 �� � 2.#56+% 241&7%65 /()
11.6-3'++2 8QNWOG ++
11.6-3 present the DARS scores for the different emission estimation methods presented in thischapter. It should be noted that the DARS scoring is currently applied manually, but the systemwill eventually be publicly available as an electronic tool.
Comparing the scores for the different methods, the preferred methods (material balance andsource testing) received higher scores and the alternative method (emission factors) received thelowest. The material balance method for estimating emissions received the highest DARS score(0.98), as shown in Table 11.6-1. Note that the score is based on the assumption that the factordata were measured continuously during the year (the inventory period) and that the pollutant isa non-consumable VOC. Also, note that if factor data and activity data are measuredcontinuously over the year, a perfect score (1.0) is possible for an emissions estimate when usingmaterial balance. Table 11.6-1 assumes the pollutant being estimated is a non-consumableVOC.
The source testing approach received the next highest overall score (0.78-0.93), as shown inTable 11.6-2. As indicated by the scores, the major parameters affecting the quality of stacksampling data are the number of tests (range of process rates; number of tests performed overthe year) and the frequency of measurement of activity data (intermittent or continuous). A highDARS score for an emissions estimate based on stack sampling data is possible if the factor dataare the result of numerous tests performed during typical operations and the emission activitydata are the result of continuous measurements over the inventory period.
In using DARS to score the emission factor approach, the example provided shows how therepresentativeness (or quality) of an emission factor may vary and how emission factor qualityaffects emission estimates. The example shown in Table 11.6-3 assumes the emission factorwas developed from a process that is similar, if not identical, to the process for which theemissions estimate was made. Because the emission factor represents a process similar to theinventory process, a high score is assigned. Assuming the activity data were measuredcontinuously, a composite score of 0.83 to 0.90 results. The lower value reflects the scoreassigned to an estimate based on a lower-quality emission factor and the upper value reflects anestimate based on a higher-quality emission factor. As shown by the scores in Table 11.6-3, thequality of an emissions estimate developed from emission factors is directly affected by thequality of the emission factors and can vary greatly. The scores also indicate that a source-specific emission factor may produce an emissions estimate of higher quality than an estimatedeveloped from a factor developed for a similar process.
The examples provided in the tables are given as an illustration of the relative quality of eachestimation method. If DARS was applied to actual inventories developed using the preferred and alternative methods and data of reasonably good quality were used for each method, thescores could be different; however, the relative ranking of the methods would be expected toremain the same.
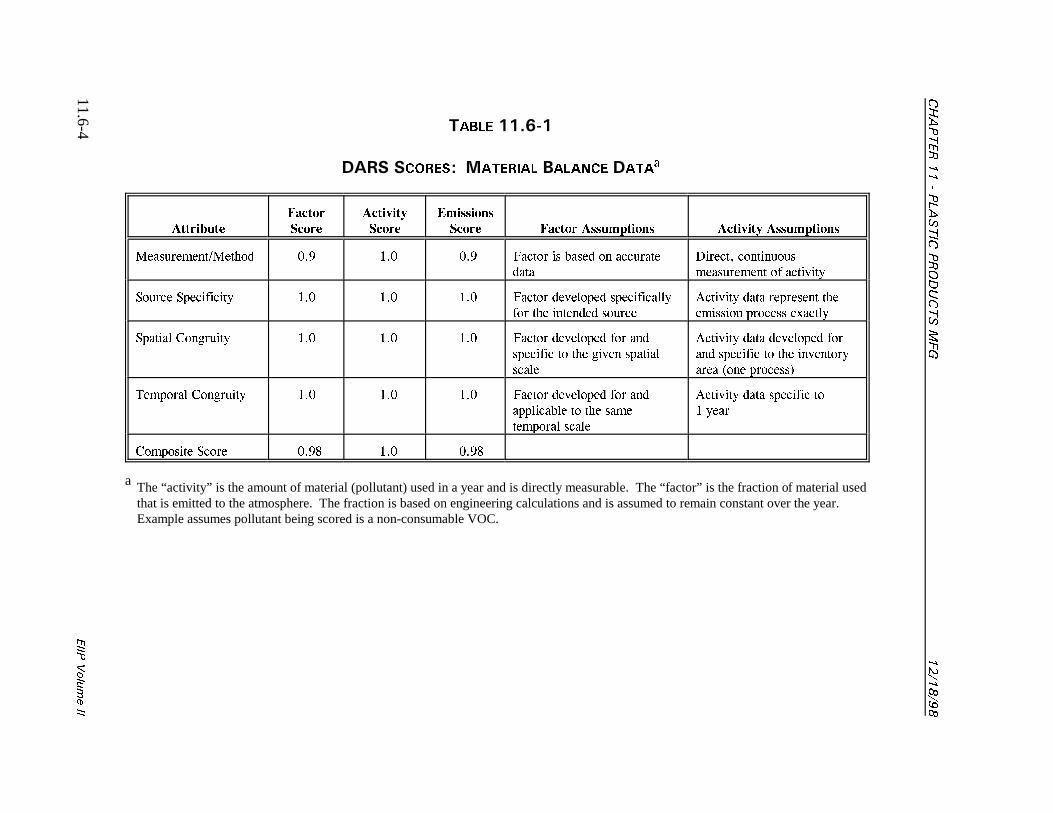
%*#26'4���2.#56+%
241&7%65/()
��������
11.6-4'++2
8QNWOG++
6#$.' ������
- 5%14'5� /#6'4+#. $#.#0%' #C
#VVTKDWVG
(CEVQT
5EQTG
#EVKXKV[
5EQTG
'OKUUKQPU
5EQTG (CEVQT #UUWORVKQPU #EVKXKV[ #UUWORVKQPU
/GCUWTGOGPV�/GVJQF ��� ��� ��� (CEVQT KU DCUGF QP CEEWTCVG
FCVC
&KTGEV� EQPVKPWQWU
OGCUWTGOGPV QH CEVKXKV[
5QWTEG 5RGEKHKEKV[ ��� ��� ��� (CEVQT FGXGNQRGF URGEKHKECNN[
HQT VJG KPVGPFGF UQWTEG
#EVKXKV[ FCVC TGRTGUGPV VJG
GOKUUKQP RTQEGUU GZCEVN[
5RCVKCN %QPITWKV[ ��� ��� ��� (CEVQT FGXGNQRGF HQT CPF
URGEKHKE VQ VJG IKXGP URCVKCN
UECNG
#EVKXKV[ FCVC FGXGNQRGF HQT
CPF URGEKHKE VQ VJG KPXGPVQT[
CTGC QPG RTQEGUU�
6GORQTCN %QPITWKV[ ��� ��� ��� (CEVQT FGXGNQRGF HQT CPF
CRRNKECDNG VQ VJG UCOG
VGORQTCN UECNG
#EVKXKV[ FCVC URGEKHKE VQ
� [GCT
%QORQUKVG 5EQTG ���� ��� ����
The “activity” is the amount of material (pollutant) used in a year and is directly measurable. The “factor” is the fraction of material useda
that is emitted to the atmosphere. The fraction is based on engineering calculations and is assumed to remain constant over the year. Example assumes pollutant being scored is a non-consumable VOC.
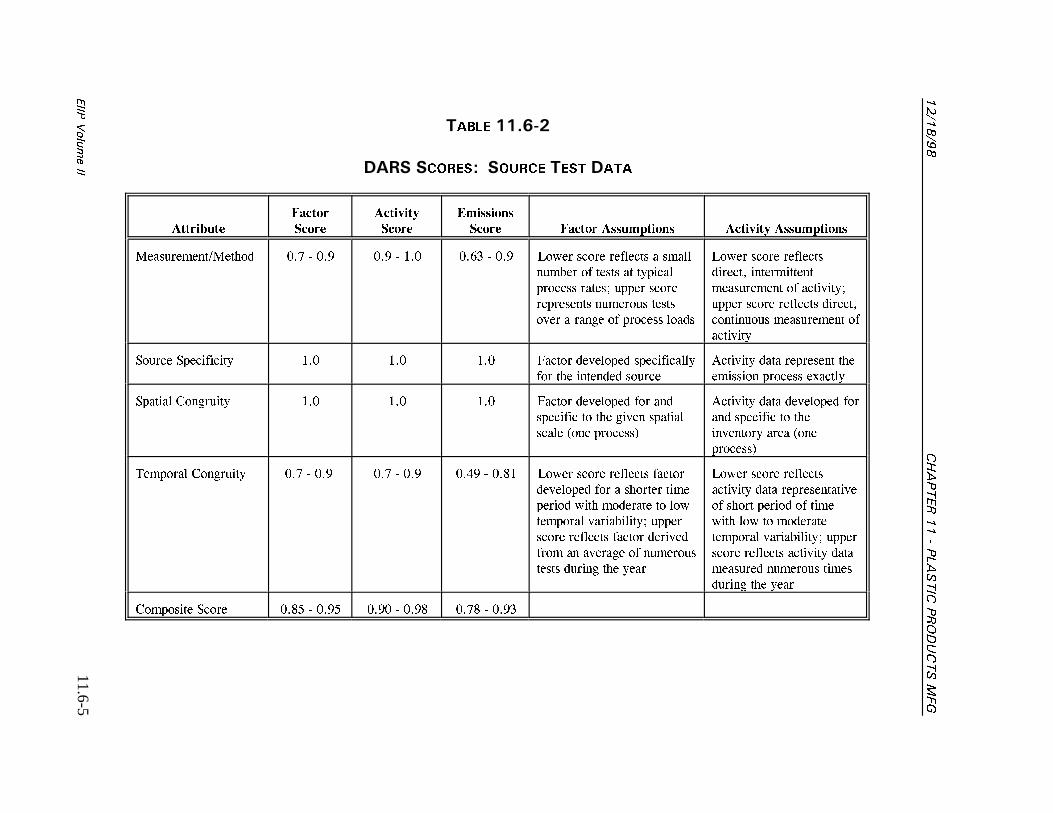
��������
%*#26'4���2.#56+%
241&7%65/()
11.6-5'++2
8QNWOG++
6#$.' ������
- 5%14'5� 5174%' 6'56 #
#VVTKDWVG
(CEVQT
5EQTG
#EVKXKV[
5EQTG
'OKUUKQPU
5EQTG (CEVQT #UUWORVKQPU #EVKXKV[ #UUWORVKQPU
/GCUWTGOGPV�/GVJQF ��� � ��� ��� � ��� ���� � ��� .QYGT UEQTG TGHNGEVU C UOCNN
PWODGT QH VGUVU CV V[RKECN
RTQEGUU TCVGU� WRRGT UEQTG
TGRTGUGPVU PWOGTQWU VGUVU
QXGT C TCPIG QH RTQEGUU NQCFU
.QYGT UEQTG TGHNGEVU
FKTGEV� KPVGTOKVVGPV
OGCUWTGOGPV QH CEVKXKV[�
WRRGT UEQTG TGHNGEVU FKTGEV�
EQPVKPWQWU OGCUWTGOGPV QH
CEVKXKV[
5QWTEG 5RGEKHKEKV[ ��� ��� ��� (CEVQT FGXGNQRGF URGEKHKECNN[
HQT VJG KPVGPFGF UQWTEG
#EVKXKV[ FCVC TGRTGUGPV VJG
GOKUUKQP RTQEGUU GZCEVN[
5RCVKCN %QPITWKV[ ��� ��� ��� (CEVQT FGXGNQRGF HQT CPF
URGEKHKE VQ VJG IKXGP URCVKCN
UECNG QPG RTQEGUU�
#EVKXKV[ FCVC FGXGNQRGF HQT
CPF URGEKHKE VQ VJG
KPXGPVQT[ CTGC QPG
RTQEGUU�
6GORQTCN %QPITWKV[ ��� � ��� ��� � ��� ���� � ���� .QYGT UEQTG TGHNGEVU HCEVQT
FGXGNQRGF HQT C UJQTVGT VKOG
RGTKQF YKVJ OQFGTCVG VQ NQY
VGORQTCN XCTKCDKNKV[� WRRGT
UEQTG TGHNGEVU HCEVQT FGTKXGF
HTQO CP CXGTCIG QH PWOGTQWU
VGUVU FWTKPI VJG [GCT
.QYGT UEQTG TGHNGEVU
CEVKXKV[ FCVC TGRTGUGPVCVKXG
QH UJQTV RGTKQF QH VKOG
YKVJ NQY VQ OQFGTCVG
VGORQTCN XCTKCDKNKV[� WRRGT
UEQTG TGHNGEVU CEVKXKV[ FCVC
OGCUWTGF PWOGTQWU VKOGU
FWTKPI VJG [GCT
%QORQUKVG 5EQTG ���� � ���� ���� � ���� ���� � ����
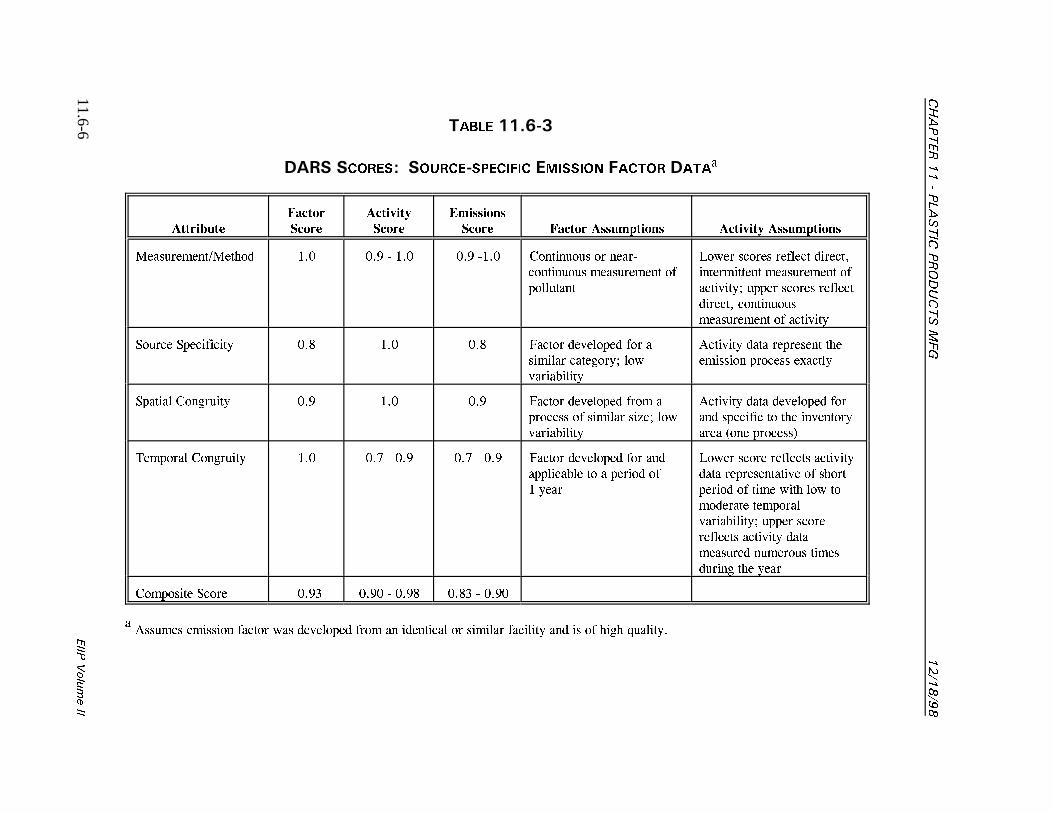
%*#26'4���2.#56+%
241&7%65/()
��������
11.6-6'++2
8QNWOG++
6#$.' ������
- 5%14'5� 5174%'�52'%+(+% '/+55+10 (#%614 #C
#VVTKDWVG
(CEVQT
5EQTG
#EVKXKV[
5EQTG
'OKUUKQPU
5EQTG (CEVQT #UUWORVKQPU #EVKXKV[ #UUWORVKQPU
/GCUWTGOGPV�/GVJQF ��� ��� � ��� ��� ���� %QPVKPWQWU QT PGCT�
EQPVKPWQWU OGCUWTGOGPV QH
RQNNWVCPV
.QYGT UEQTGU TGHNGEV FKTGEV�
KPVGTOKVVGPV OGCUWTGOGPV QH
CEVKXKV[� WRRGT UEQTGU TGHNGEV
FKTGEV� EQPVKPWQWU
OGCUWTGOGPV QH CEVKXKV[
5QWTEG 5RGEKHKEKV[ ��� ��� ��� (CEVQT FGXGNQRGF HQT C
UKOKNCT ECVGIQT[� NQY
XCTKCDKNKV[
#EVKXKV[ FCVC TGRTGUGPV VJG
GOKUUKQP RTQEGUU GZCEVN[
5RCVKCN %QPITWKV[ ��� ��� ��� (CEVQT FGXGNQRGF HTQO C
RTQEGUU QH UKOKNCT UK\G� NQY
XCTKCDKNKV[
#EVKXKV[ FCVC FGXGNQRGF HQT
CPF URGEKHKE VQ VJG KPXGPVQT[
CTGC QPG RTQEGUU�
6GORQTCN %QPITWKV[ ��� ��� � ��� ��� � ��� (CEVQT FGXGNQRGF HQT CPF
CRRNKECDNG VQ C RGTKQF QH
� [GCT
.QYGT UEQTG TGHNGEVU CEVKXKV[
FCVC TGRTGUGPVCVKXG QH UJQTV
RGTKQF QH VKOG YKVJ NQY VQ
OQFGTCVG VGORQTCN
XCTKCDKNKV[� WRRGT UEQTG
TGHNGEVU CEVKXKV[ FCVC
OGCUWTGF PWOGTQWU VKOGU
FWTKPI VJG [GCT
%QORQUKVG 5EQTG ���� ���� � ���� ���� � ����
#UUWOGU GOKUUKQP HCEVQT YCU FGXGNQRGF HTQO CP KFGPVKECN QT UKOKNCT HCEKNKV[ CPF KU QH JKIJ SWCNKV[�C
11.7-1'++2 8QNWOG ++
�
#�%1&+0)�241%'&74'5This section describes the methods and codes available for characterizing emission sources atplastic products manufacturing facilities. Consistent categorization and coding will result ingreater uniformity among inventories. In addition, the procedures described here will assist thereader who is preparing data for input to the Aerometric Information Retrieval System (AIRS) ora similar database management system. The use of the Source Classification Codes (SCCs)provided in Table 11.7-1 is recommended for describing various plastic products manufacturingoperations. Refer to the Clearinghouse for Inventories and Emission Factors (CHIEF) web site(www.epa.gov/ttn/chief) for these codes and any additional codes that may be added to describeplastic products manufacturing operations.
��� 5174%'�%.#55+(+%#6+10�%1&'5
SCCs for various processes occurring at plastic products manufacturing facilities are presentedin Table 11.7-1.
��� #+45�%10641.�&'8+%'�%1&'5
Control device codes that may be applicable to plastic products manufacturing operations arepresented in Table 11.7-2. These should be used to enter the type of applicable emission controldevice into the AIRS Facility Subsystem (AFS). The “099" control code may be used formiscellaneous control devices that do not have a unique identification code.
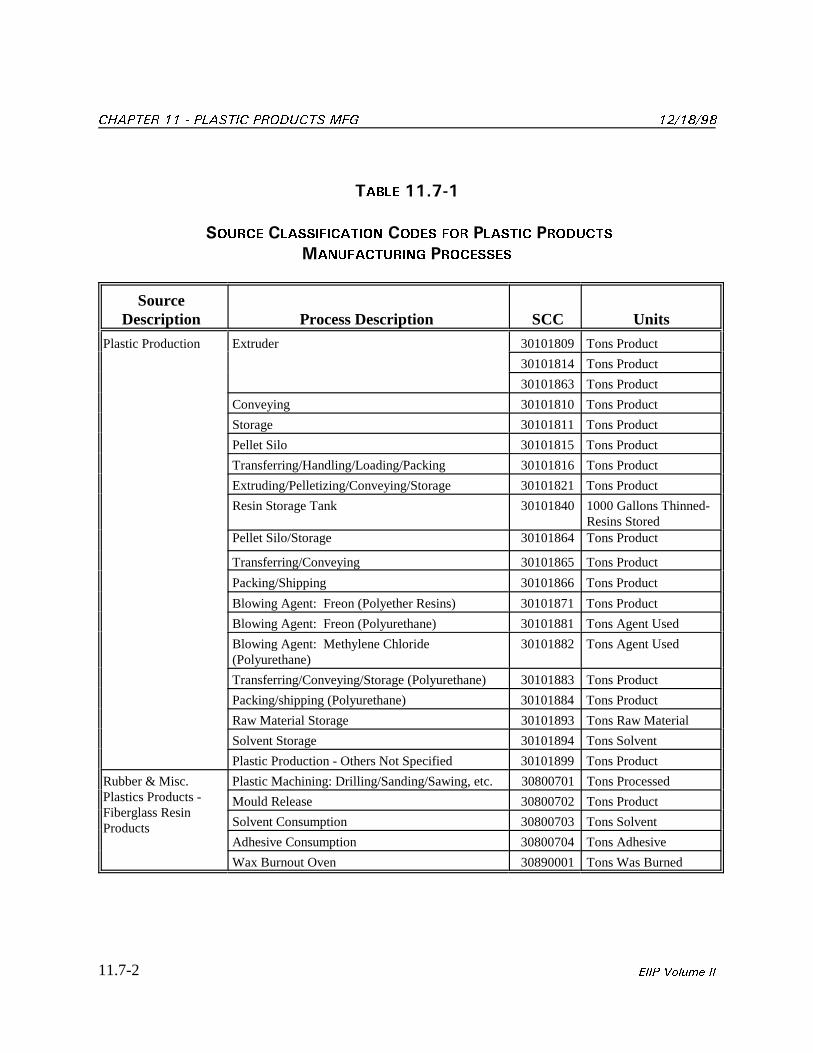
%*#26'4 �� � 2.#56+% 241&7%65 /() ��������
11.7-2 '++2 8QNWOG ++
6#$.' ������
5174%' %.#55+(+%#6+10 %1&'5 (14 2.#56+% 241&7%65
/#07(#%674+0) 241%'55'5
SourceDescription Process Description SCC Units
Plastic Production Extruder 30101809 Tons Product
30101814 Tons Product
30101863 Tons Product
Conveying 30101810 Tons Product
Storage 30101811 Tons Product
Pellet Silo 30101815 Tons Product
Transferring/Handling/Loading/Packing 30101816 Tons Product
Extruding/Pelletizing/Conveying/Storage 30101821 Tons Product
Resin Storage Tank 30101840 1000 Gallons Thinned-Resins Stored
Pellet Silo/Storage 30101864 Tons Product
Transferring/Conveying 30101865 Tons Product
Packing/Shipping 30101866 Tons Product
Blowing Agent: Freon (Polyether Resins) 30101871 Tons Product
Blowing Agent: Freon (Polyurethane) 30101881 Tons Agent Used
Blowing Agent: Methylene Chloride 30101882 Tons Agent Used (Polyurethane)
Transferring/Conveying/Storage (Polyurethane) 30101883 Tons Product
Packing/shipping (Polyurethane) 30101884 Tons Product
Raw Material Storage 30101893 Tons Raw Material
Solvent Storage 30101894 Tons Solvent
Plastic Production - Others Not Specified 30101899 Tons Product
Rubber & Misc. Plastic Machining: Drilling/Sanding/Sawing, etc. 30800701 Tons ProcessedPlastics Products -Fiberglass ResinProducts
Mould Release 30800702 Tons Product
Solvent Consumption 30800703 Tons Solvent
Adhesive Consumption 30800704 Tons Adhesive
Wax Burnout Oven 30890001 Tons Was Burned
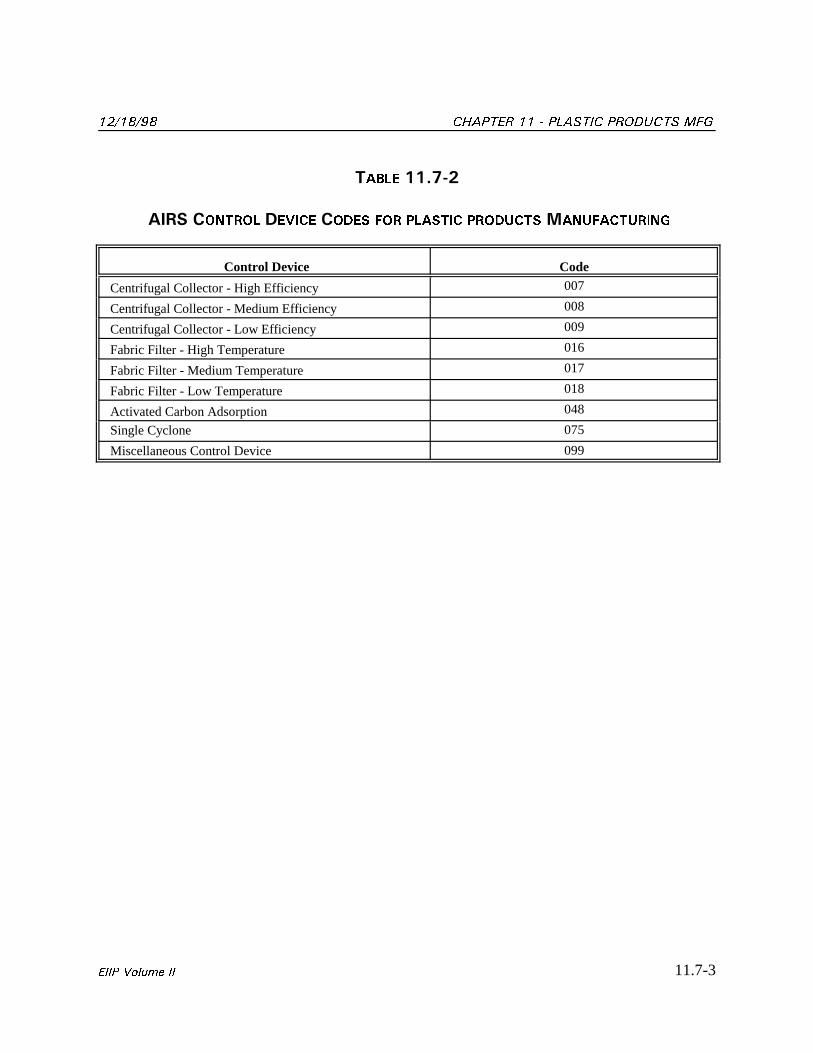
�������� %*#26'4 �� � 2.#56+% 241&7%65 /()
11.7-3'++2 8QNWOG ++
6#$.' ������
#+45 %10641. &'8+%' %1&'5 (14 2.#56+% 241&7%65 /#07(#%674+0)
Control Device Code
Centrifugal Collector - High Efficiency 007
Centrifugal Collector - Medium Efficiency 008
Centrifugal Collector - Low Efficiency 009
Fabric Filter - High Temperature 016
Fabric Filter - Medium Temperature 017
Fabric Filter - Low Temperature 018
Activated Carbon Adsorption 048
Single Cyclone 075
Miscellaneous Control Device 099

%*#26'4 �� � 2.#56+% 241&7%65 /() ��������
11.7-4 '++2 8QNWOG ++
This page is intentionally left blank.
11.8-1'++2 8QNWOG ++
�
4'('4'0%'5
Barlow, A., K. Adams, M. Holdren, P. Moss, E. Parker, and T. Schroer. 1997. Development ofEmission Factors for Ethylene-Vinyl Acetate and Ethylene-Methyl Acrylate CopolymerProcessing. Journal of the Air & Waste Management Association. 47:1111-1118.
Barlow, A., D. Contos, M. Holdren, P. Garrison, L. Harris, and B. Janke. 1996. Development ofEmission Factors for Polyethylene Processing. Journal of the Air Waste ManagementAssociation. 46:569-580.
Contos, D., M. Holdren, D. Smith, R. Brooke, V. Rhodes, and M. Rainey. 1995. Sampling andAnalysis of Volatile Organic Compounds Evolved During Thermal Processing of AcrylonitrileButadiene Styrene Composite Resins. Journal of the Air & Waste Management Association. 45:686-694.
EPA. 1996. Hazardous Air Pollutant Emissions From the Production of Flexible PolyurethaneFoam--Basis and Purpose Document for Proposed Standards. U.S. Environmental ProtectionAgency, Office of Air Quality Planning and Standards, EPA-453/R-96-008a. Research TrianglePark, North Carolina.
EPA. 1995. EPA Office of Compliance Sector Notebook Project: Profile of the Rubber andPlastics Industry. U.S. Environmental Protection Agency, Office of Enforcement andCompliance Assurance, EPA-310/R-95-016. Washington, D.C.
EPA. 1990. Control of VOC Emissions From Polystyrene Foam Manufacturing. U.S.Environmental Protection Agency, Office of Air Quality Planning and Standards,EPA-450/3-90-020. Research Triangle Park, North Carolina.
EPA. 1978. Source Assessment: Plastics Processing, State of the Art. U.S. EnvironmentalProtection Agency, Office of Research and Development, EPA 600/2-78-004c. Cincinnati, Ohio
Kaufman, C., and M. Overcash. 1993. Waste Minimization in the Manufacture of FlexiblePolyurethane Foams: Quantification of Auxiliary Blowing Agent Volatilization. Journal of theAir & Waste Management Association. 43:736-744.
Krutchen, C., and W. Wu. 1988a. Gas Chromatographic Determination of Residual BlowingAgents in Polystyrene Foams. SPE 46th ANTEC, Atlanta. April 18-21, 1988.
%*#26'4 �� � 2.#56+% 241&7%65 /() ��������
11.8-2 '++2 8QNWOG ++
Krutchen, C. and W. Wu. 1988b. Corrected Volatiles Test for Determination of ResidualBlowing Agents in Polystyrene Foams. SPE 46th ANTEC, Atlanta. April 18-21, 1988.
Krutchen, C. and W. Wu. 1988c. Blowing Agents from Polystyrene Foam Plants. SPE 46thANTEC, Atlanta. April 18-21, 1988.
Midwest Research Institute. 1993. Development of Test Strategies for Polymer ProcessingEmission Factors. Final Report. Cary, North Carolina.
The Society of the Plastics Industry, Inc. 1996. Facts & Figures of the U.S. Plastics Industry. Washington, D.C.
The Society of the Plastics Industry, Inc. 1991. Plastics Engineering Handbook. Van NostrandReinhold, Fifth Edition. New York, New York.
11.9-1'++2 8QNWOG ++
�
$+$.+1)4#2*;
Crawford, J., Rhodes, V., and Toner, P. 1998. Emission Factors for Plastic Processing. Presented at the Air & Waste Management Association Conference the Emission Inventory, NewOrleans, Louisiana. December 8-10.
Ernes, D. A. and Griffin, J. P. 1996. Process Emissions for Vinyl Pipe Industry, J. of Vinyl &Additive Technology, 1996, Vol. 2, No. 3, p180-183.
Society of the Plastics Industry, Inc. 1996. MDI/polymeric MDI Emissions ReportingGuidelines for the Polyurethane industry.
Society of the Plastics Industry, Inc. 1995. Air Permit Workbook: A Practical Guide for PlasticsProcessors, Compounders, and Fabricators, 1995.

%*#26'4 �� � 2.#56+% 241&7%65 /() ��������
11.9-2 '++2 8QNWOG ++
This page is intentionally left blank.
�������� %*#26'4 �� � 2.#56+% 241&7%65 /()
'++2 8QNWOG ++
#22'0&+:�#
':#/2.'�#�%1..'%6+10�(14/5
#0&�+05647%6+105���
2.#56+%�241&7%65�/#07(#%674+0)

%*#26'4 �� � 2.#56+% 241&7%65 /() ��������
'++2 8QNWOG ++
This page is intentionally left blank.
�������� %*#26'4 �� � 2.#56+% 241&7%65 /()
11.A-1'++2 8QNWOG ++
':#/2.' # %1..'%6+10 (14/5 +05647%6+105 �
2.#56+% 241&7%65 /#07(#%674+0) (#%+.+6+'5
1. These forms may be used as worksheets to aid the plant engineer in collecting theinformation necessary to calculate emissions from plastic products manufacturing facilities. The information requested on the forms relates to the methods (described in Sections 3, 4,and 5) for quantifying emissions. These forms may also be used by the regulatory agencyto assist in area wide inventory preparation.
2. The completed forms should be maintained in a reference file by the plant engineer withother supporting documentation.
3. If the information requested is unknown, write "unknown" in the blank. If the informationrequested does not apply to a particular unit or process, write "NA" in the blank.
4. If you want to modify the form to better serve your needs, an electronic copy of the formmay be obtained through the EIIP on the Clearinghouse for Inventories and EmissionFactors (CHIEF) web site.
5. Collect all Material Safety Data Sheets (MSDSs) for all materials containing potential aircontaminants that are used at the facility.
6. The plant engineer should maintain all material usage information and MSDSs in areference file.
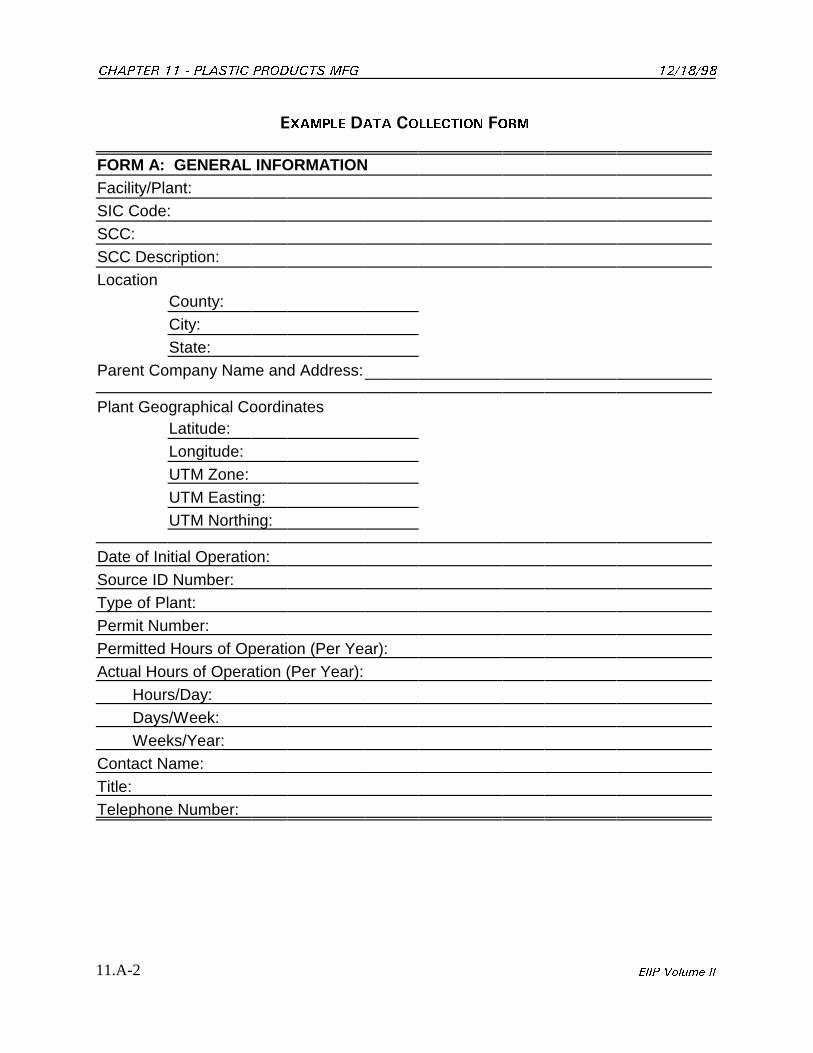
%*#26'4 �� � 2.#56+% 241&7%65 /() ��������
11.A-2 '++2 8QNWOG ++
':#/2.' # %1..'%6+10 (14/
FORM A: GENERAL INFORMATIONFacility/Plant:SIC Code:SCC:SCC Description:Location
County:City:State:
Parent Company Name and Address:
Plant Geographical CoordinatesLatitude:Longitude:UTM Zone:UTM Easting:UTM Northing:
Date of Initial Operation:Source ID Number:Type of Plant:Permit Number:Permitted Hours of Operation (Per Year):Actual Hours of Operation (Per Year):
Hours/Day:Days/Week:Weeks/Year:
Contact Name:Title:Telephone Number:
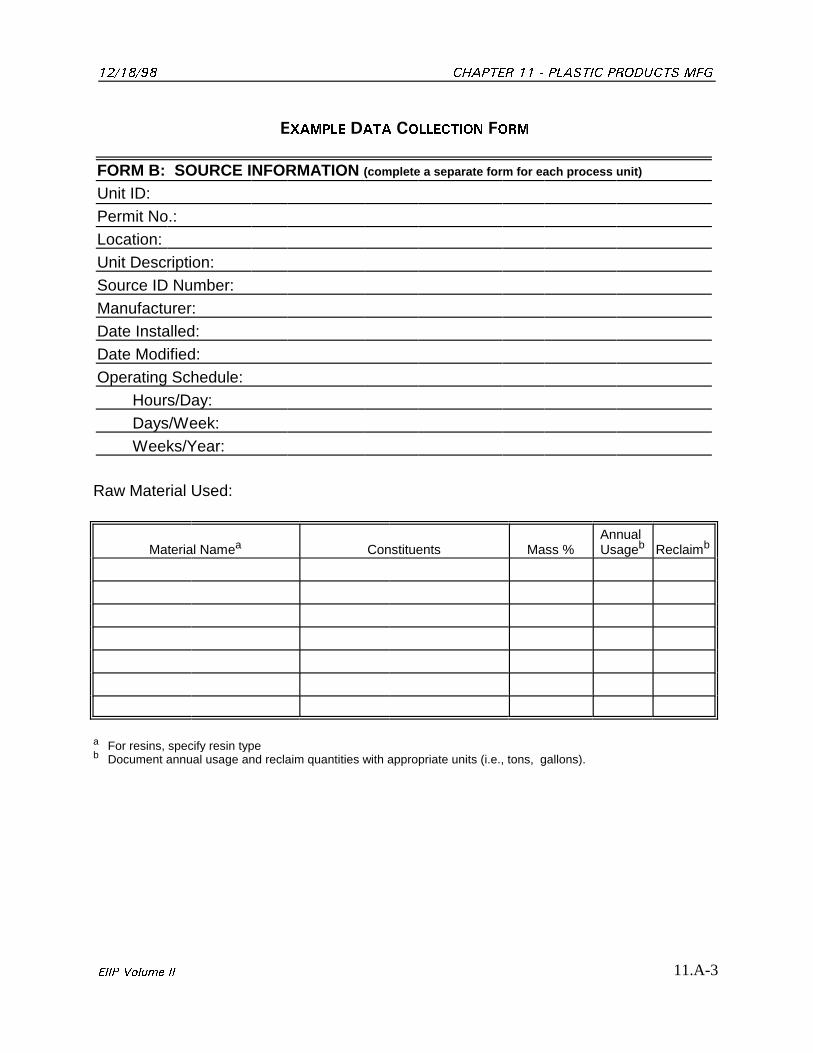
�������� %*#26'4 �� � 2.#56+% 241&7%65 /()
11.A-3'++2 8QNWOG ++
':#/2.' # %1..'%6+10 (14/
FORM B: SOURCE INFORMATION (complete a separate form for each process unit)
Unit ID:Permit No.:Location:Unit Description:Source ID Number:Manufacturer:Date Installed:Date Modified: Operating Schedule:
Hours/Day:Days/Week:Weeks/Year:
Raw Material Used:
Material Name Constituents Mass % Usage Reclaim aAnnual
b b
For resins, specify resin typea
Document annual usage and reclaim quantities with appropriate units (i.e., tons, gallons).b
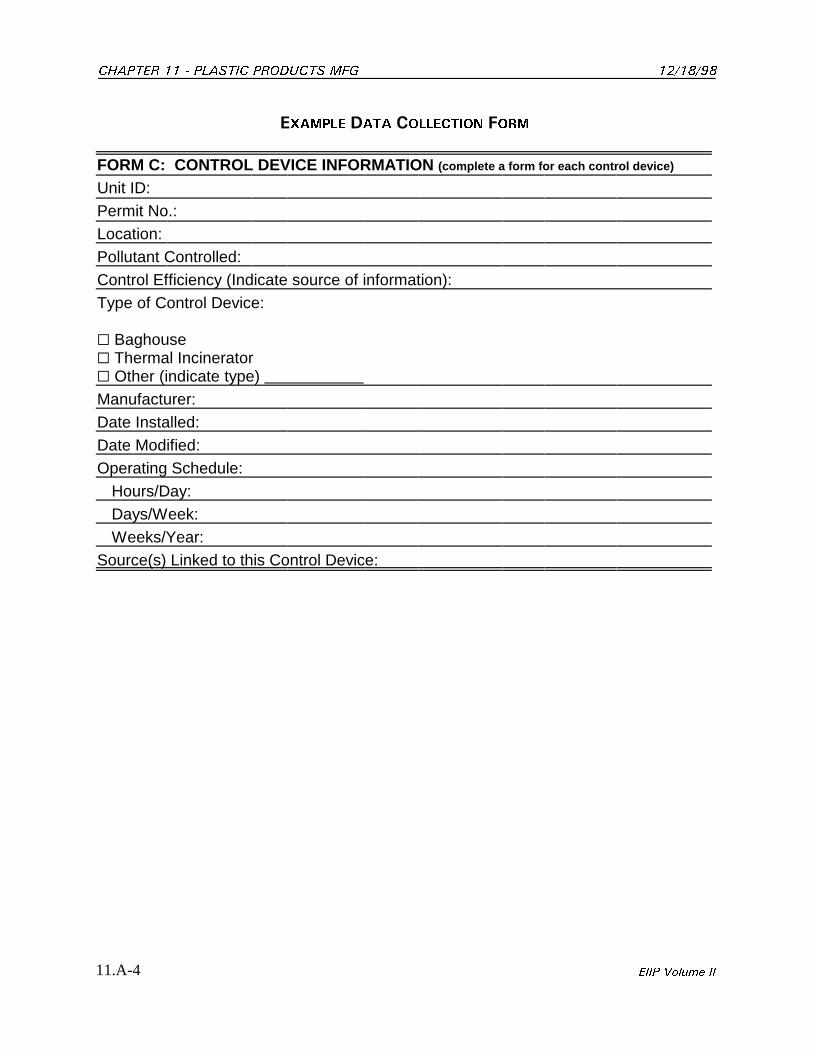
%*#26'4 �� � 2.#56+% 241&7%65 /() ��������
11.A-4 '++2 8QNWOG ++
':#/2.' # %1..'%6+10 (14/
FORM C: CONTROL DEVICE INFORMATION (complete a form for each control device)
Unit ID:Permit No.:Location:Pollutant Controlled:Control Efficiency (Indicate source of information):Type of Control Device:
* Baghouse* Thermal Incinerator* Other (indicate type) Manufacturer:Date Installed:Date Modified: Operating Schedule:
Hours/Day:Days/Week:Weeks/Year:
Source(s) Linked to this Control Device:
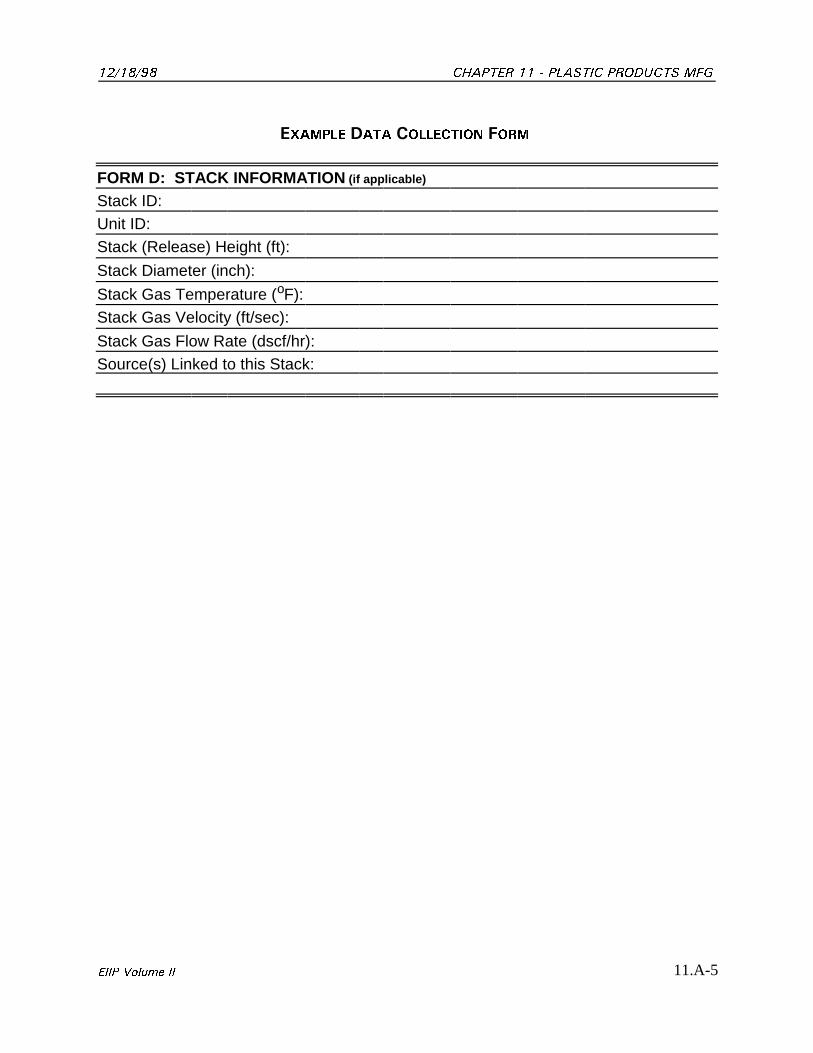
�������� %*#26'4 �� � 2.#56+% 241&7%65 /()
11.A-5'++2 8QNWOG ++
':#/2.' # %1..'%6+10 (14/
FORM D: STACK INFORMATION (if applicable)
Stack ID:Unit ID:Stack (Release) Height (ft):
Stack Diameter (inch):
Stack Gas Temperature ( F):o
Stack Gas Velocity (ft/sec):
Stack Gas Flow Rate (dscf/hr):Source(s) Linked to this Stack:
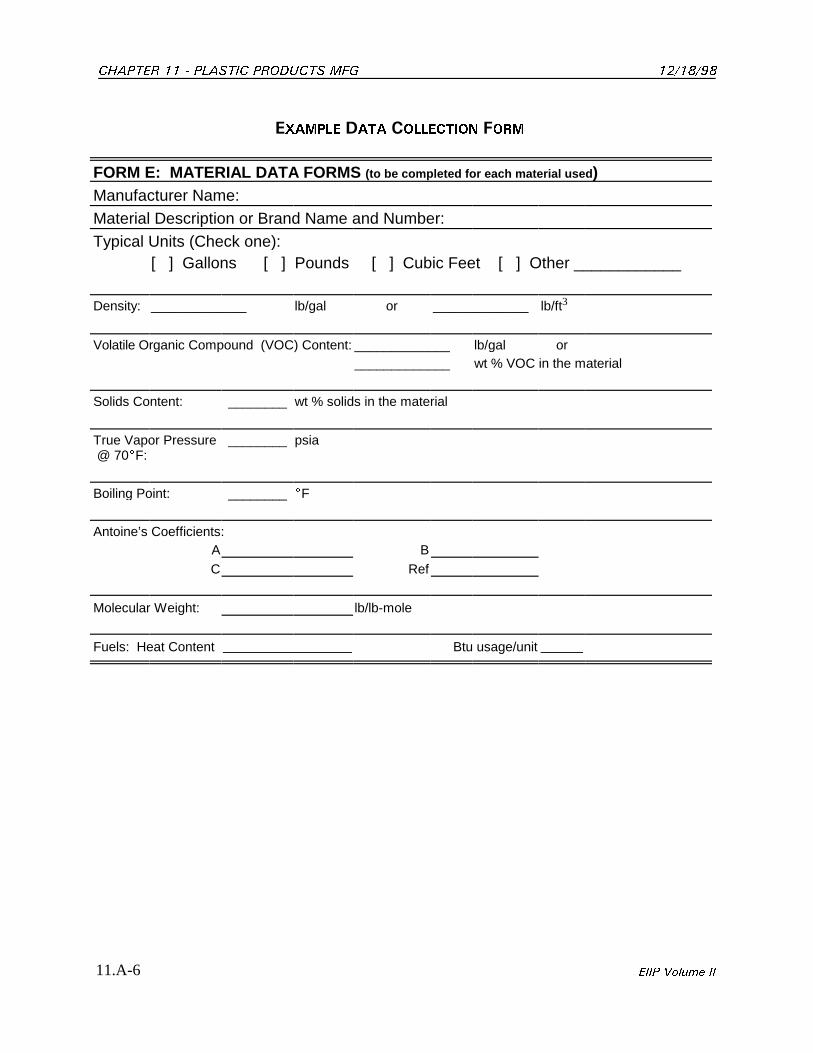
%*#26'4 �� � 2.#56+% 241&7%65 /() ��������
11.A-6 '++2 8QNWOG ++
':#/2.' # %1..'%6+10 (14/
FORM E: MATERIAL DATA FORMS (to be completed for each material used )Manufacturer Name:Material Description or Brand Name and Number:Typical Units (Check one):
[ ] Gallons [ ] Pounds [ ] Cubic Feet [ ] Other ____________
Density: _____________ lb/gal or _____________ lb/ft3
Volatile Organic Compound (VOC) Content: _____________ lb/gal or_____________ wt % VOC in the material
Solids Content: ________ wt % solids in the material
True Vapor Pressure ________ psia @ 70(F:
Boiling Point: ________ (F
Antoine’s Coefficients:A B
C Ref
Molecular Weight: lb/lb-mole
Fuels: Heat Content Btu usage/unit
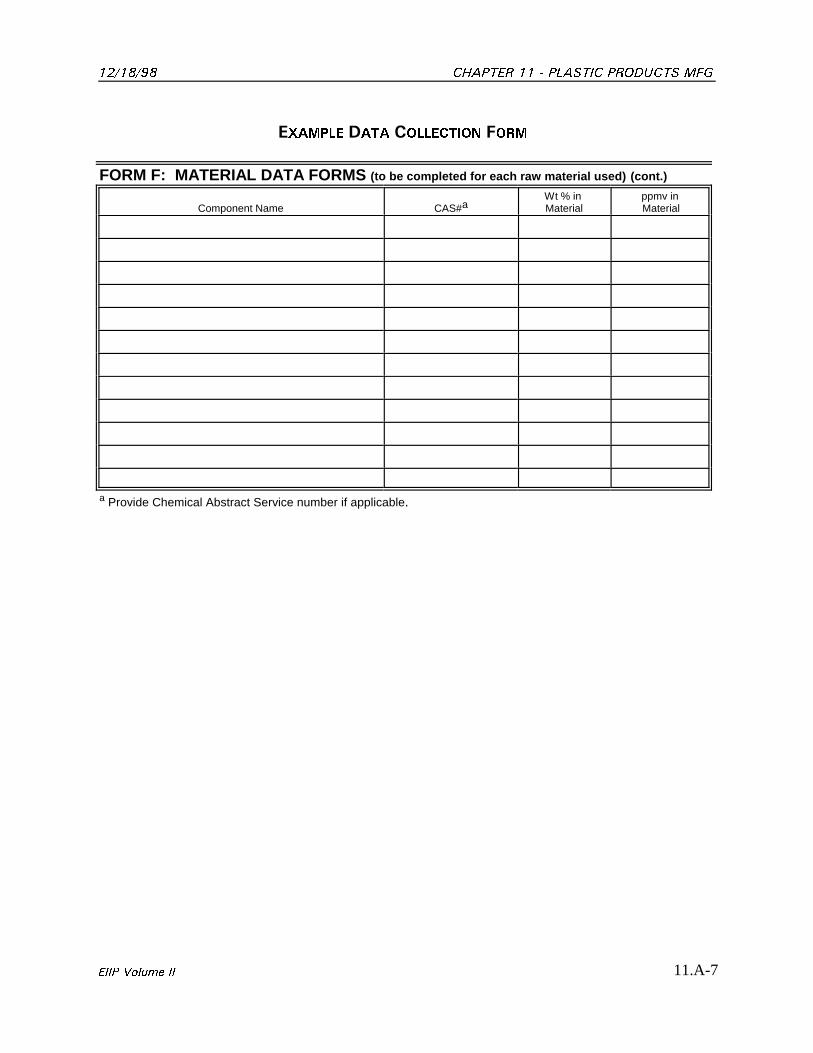
�������� %*#26'4 �� � 2.#56+% 241&7%65 /()
11.A-7'++2 8QNWOG ++
':#/2.' # %1..'%6+10 (14/
FORM F: MATERIAL DATA FORMS (to be completed for each raw material used) (cont.)
Component Name CAS# Material MaterialaWt % in ppmv in
Provide Chemical Abstract Service number if applicable.a
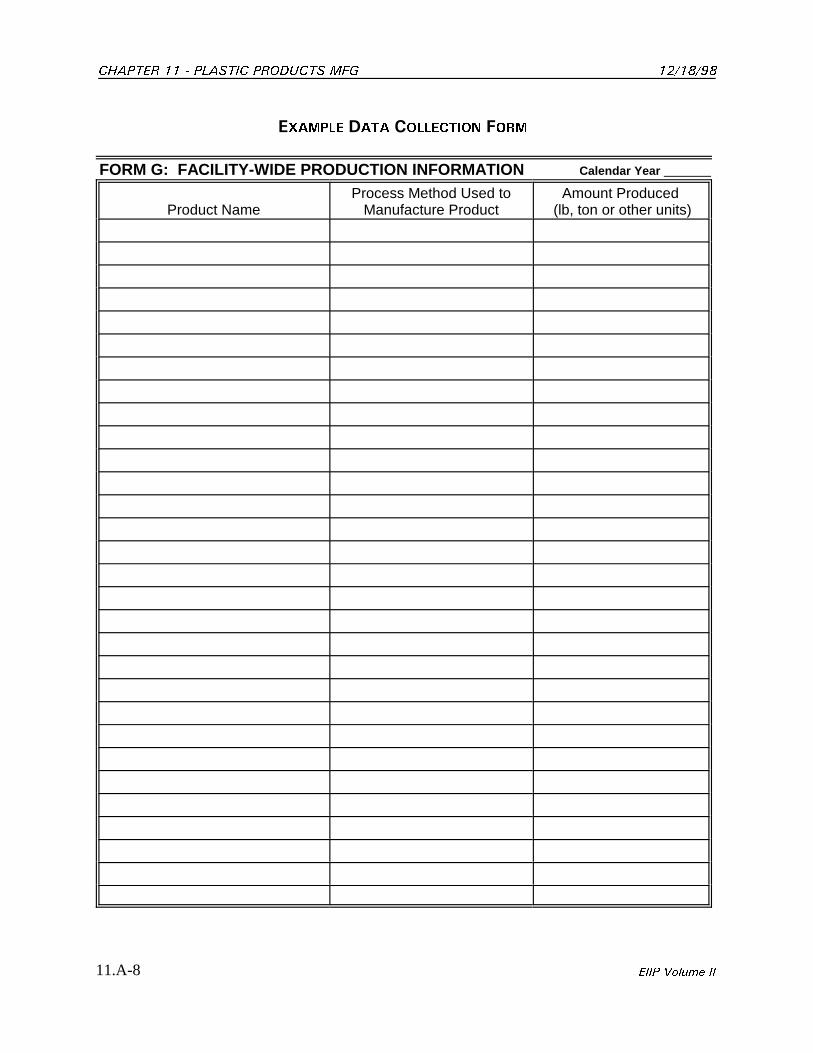
%*#26'4 �� � 2.#56+% 241&7%65 /() ��������
11.A-8 '++2 8QNWOG ++
':#/2.' # %1..'%6+10 (14/
FORM G: FACILITY-WIDE PRODUCTION INFORMATION Calendar Year
Product Name Manufacture Product (lb, ton or other units)Process Method Used to Amount Produced
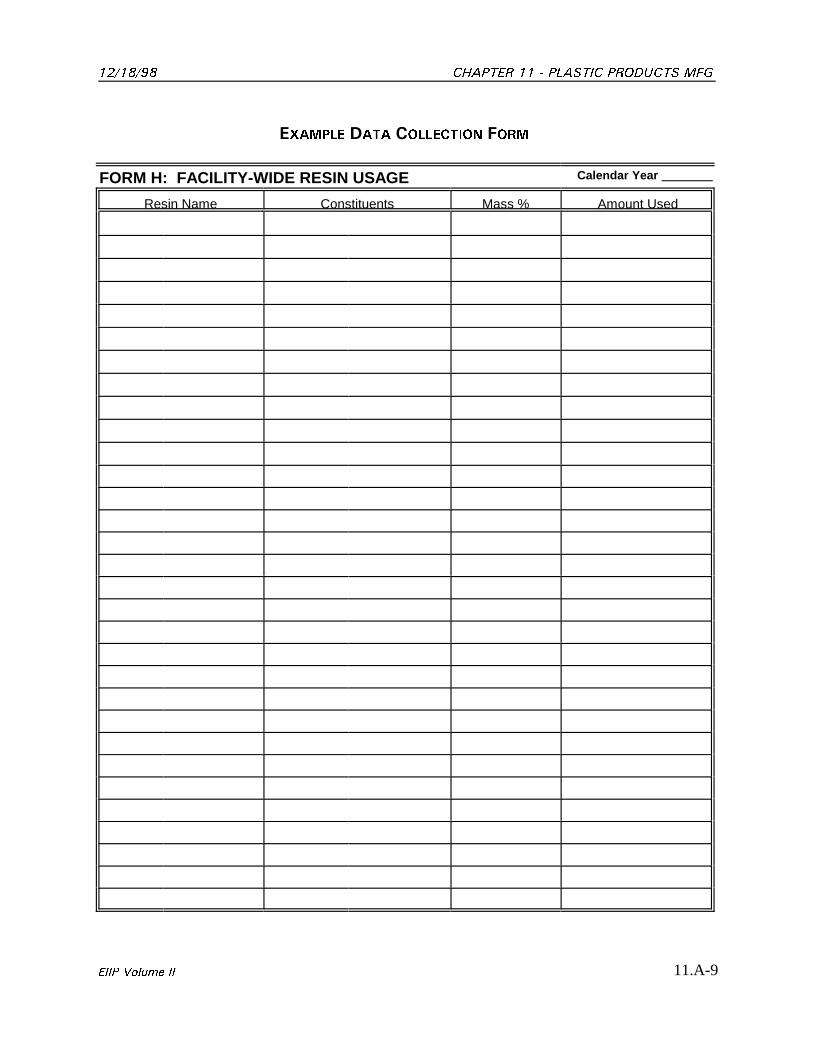
�������� %*#26'4 �� � 2.#56+% 241&7%65 /()
11.A-9'++2 8QNWOG ++
':#/2.' # %1..'%6+10 (14/
FORM H: FACILITY-WIDE RESIN USAGE Calendar Year
Resin Name Constituents Mass % Amount Used
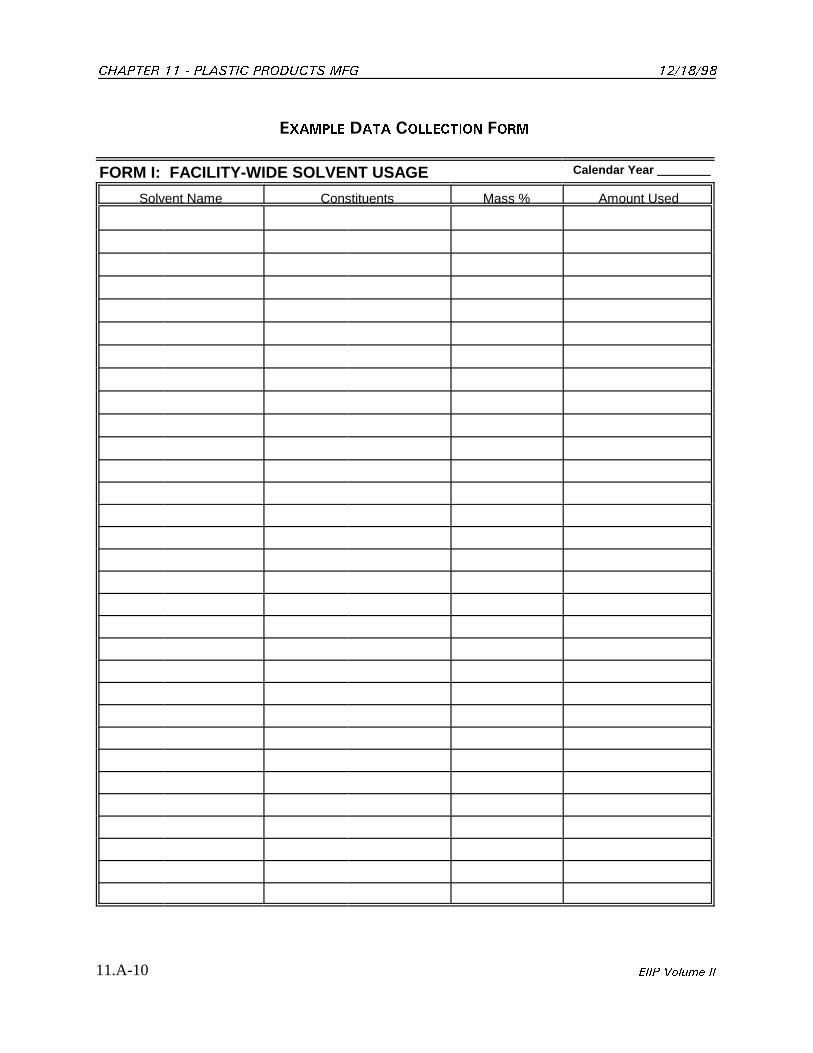
%*#26'4 �� � 2.#56+% 241&7%65 /() ��������
11.A-10 '++2 8QNWOG ++
':#/2.' # %1..'%6+10 (14/
FORM I: FACILITY-WIDE SOLVENT USAGE Calendar Year
Solvent Name Constituents Mass % Amount Used
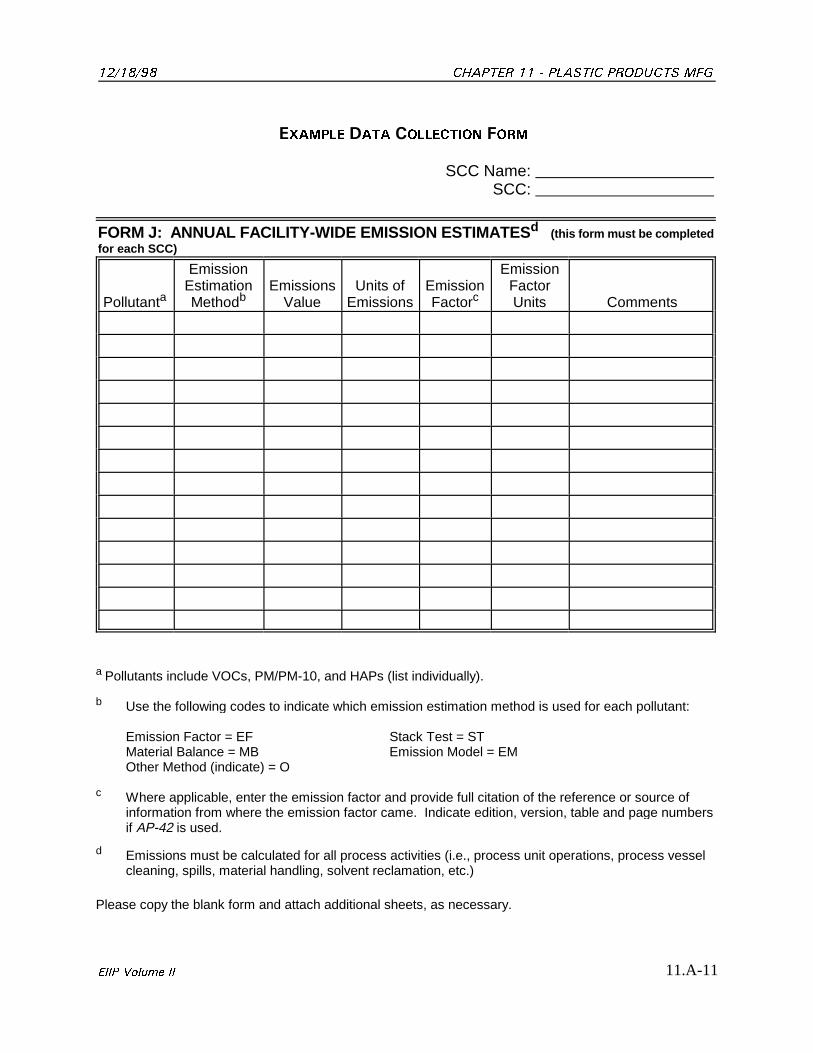
�������� %*#26'4 �� � 2.#56+% 241&7%65 /()
11.A-11'++2 8QNWOG ++
':#/2.' # %1..'%6+10 (14/
SCC Name: SCC:
FORM J: ANNUAL FACILITY-WIDE EMISSION ESTIMATES (this form must be completedd
for each SCC)
Pollutant Method Value Emissions Factor Units Commentsa
Emission EmissionEstimation Emissions Units of Emission Factor
b c
Pollutants include VOCs, PM/PM-10, and HAPs (list individually).a
Use the following codes to indicate which emission estimation method is used for each pollutant:b
Emission Factor = EF Stack Test = STMaterial Balance = MB Emission Model = EMOther Method (indicate) = O
Where applicable, enter the emission factor and provide full citation of the reference or source ofc
information from where the emission factor came. Indicate edition, version, table and page numbersif AP-42 is used.
Emissions must be calculated for all process activities (i.e., process unit operations, process vesseld
cleaning, spills, material handling, solvent reclamation, etc.)
Please copy the blank form and attach additional sheets, as necessary.
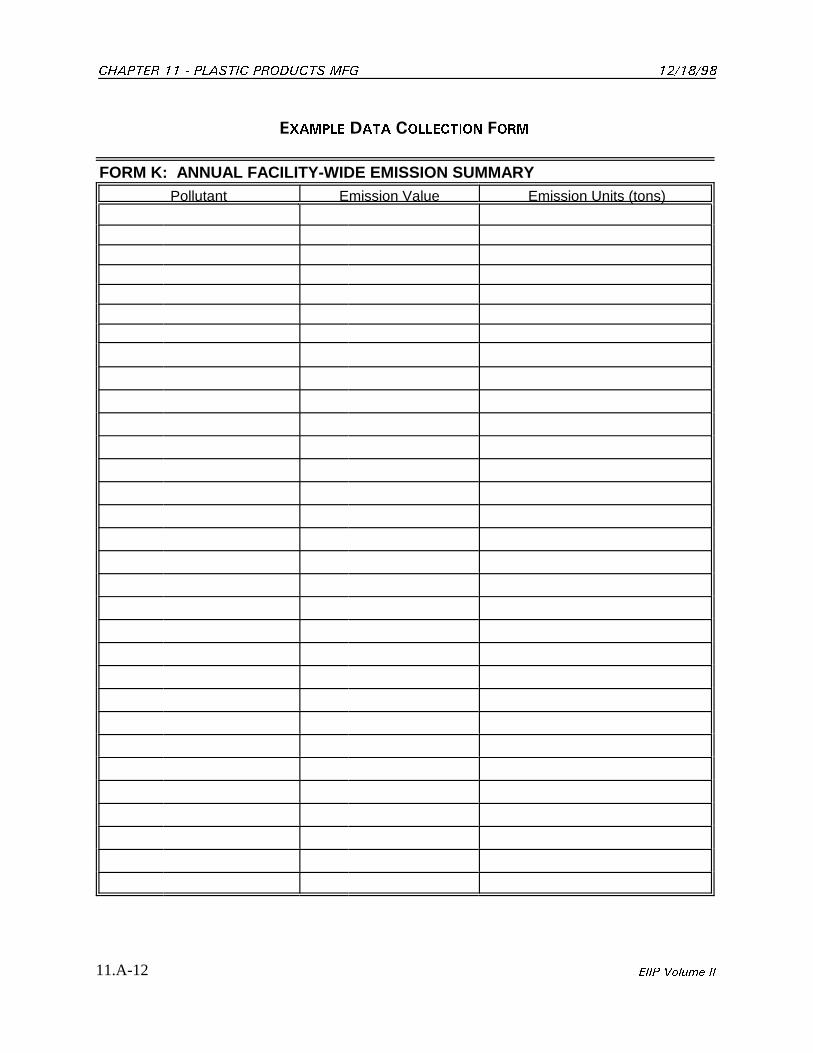
%*#26'4 �� � 2.#56+% 241&7%65 /() ��������
11.A-12 '++2 8QNWOG ++
':#/2.' # %1..'%6+10 (14/
FORM K: ANNUAL FACILITY-WIDE EMISSION SUMMARY Pollutant Emission Value Emission Units (tons)