Preferential Trade Agreements in the Asia-Pacific Region · Preferential Trade Agreements in the...
40
WP/05/149 Preferential Trade Agreements in the Asia-Pacific Region Tubagus Feridhanusetyawan
Transcript of Preferential Trade Agreements in the Asia-Pacific Region · Preferential Trade Agreements in the...

WP/05/149
Preferential Trade Agreements in the Asia-Pacific Region
Tubagus Feridhanusetyawan

© 2005 International Monetary Fund WP/05/149
IMF Working Paper
Policy Development and Review Department
Preferential Trade Agreements in the Asia-Pacific Region
Prepared by Tubagus Feridhanusetyawan1
Authorized for distribution by Hans Peter Lankes
July 2005
Abstract
This Working Paper should not be reported as representing the views of the IMF. The views expressed in this Working Paper are those of the author(s) and do not necessarily represent those of the IMF or IMF policy. Working Papers describe research in progress by the author(s) and are published to elicit comments and to further debate.
Preferential trade agreements (PTAs) in the Asia-Pacific region have proliferated rapidly over the past five years and are creating a complex web of intersecting bilateral and regional trade agreements. This paper describes the proliferation of these PTAs, discusses their characteristics and implementation, and assesses their potential effects. Realizing the potential gains from Asia-Pacific PTAs requires a commitment to liberalize sensitive sectors, to maintain consistent provisions, and to enforce agreements. Other factors, including administrative complications, also could undermine any potential gains. JEL Classification Number: F15 Keywords: Asia; Pacific; Trade; FTA; Preferential Trade Agreement Author(s) E-Mail Address: [email protected]
1 This paper is associated with the work program of the Trade Policy Division. The author would like to thank Hans Peter Lankes, Nur Calika, and Yongzheng Yang for valuable comments and suggestions, and Dustin Smith for his assistance in calculating tariff data.

- 2 -
Contents Page
I. Introduction ............................................................................................................................4
II. The Proliferation of PTAs .....................................................................................................5 A. The Formation of PTAs ............................................................................................5 B. Understanding the Proliferation of PTAs................................................................13
III. The Implementation of PTAs.............................................................................................15 A. General Characteristics and Coverage ....................................................................15 B. Tariff Reduction and Rules of Origin .....................................................................16 C. Commitments Beyond Tariff Reduction .................................................................22
IV. Assessment of PTAs ..........................................................................................................27 A. The Quality of PTAs ...............................................................................................27 B. The Effects of PTAs................................................................................................28
V. Conclusion ..........................................................................................................................32
Tables 1. PTAs Involving Asia-Pacific Countries (June 2005).............................................................7 2. Participation in PTAs: Selected Asia-Pacific Countries (June 2005)..................................12 3. Tariff Reduction in Selected Asia-Pacific PTAs .................................................................17 4. The Difference Between Preferential and MFN Rates: Selected Countries, 2002 ..............19 5. Rules of Origin in Selected Asia-Pacific PTAs ...................................................................21 6. Services and Investment Liberalization in Selected Asia-Pacific PTAs .............................23 7. Provisions Beyond Tariff Reduction, Services Liberalization, and Investment
Liberalization: Selected Asia-Pacific PTAs.....................................................................26 8. Intra-Regional Trade Intensity Index of Selected PTAs......................................................30 Figures 1. Declining Trade Barriers and Increasing Integration in the Asia-Pacific Region .................5 2. Asia-Pacific Regional and Bilateral Trade Agreements (June 2005) ..................................10 3. Asia-Pacific Regional and Bilateral Trade Agreements under Negotiation (June 2005) ....11 Boxes 1. ASEAN and AFTA................................................................................................................8 2. ASEAN and AFAS ..............................................................................................................24 Appendices I. Asia Pacific Economic Cooperation (APEC).......................................................................34 II. Economic and Trade Indicators of Selected Asia-Pacific Economies ................................36 References................................................................................................................................37

- 3 -
List of Abbreviations
AEC Asian Economic Community AFAS ASEAN Framework Agreement on Services AFTA ASEAN Free Trade Area ACCEC ASEAN China Comprehensive Economic Cooperation AIA ASEAN Investment Area AICEC ASEAN India Comprehensive Economic Cooperation AJCEP ASEAN Japan Comprehensive Economic Partnership AKCCP ASEAN Korea Comprehensive Cooperation Partnership APEC Asia Pacific Economic Cooperation ASEAN Association of South East Asian Nations
BIMSTEC Bangladesh, India, Myanmar, Sri Lanka, Thailand, Bhutan, Nepal Economic Cooperation
BTAs Bilateral trade agreements CAPs Collective action plans CEP Closer Economic Partnership CEPT Common Effective Preferential Tariff CER Closer Economic Relation between Australia and New
Zealand EAI Enterprise for ASEAN Initiative EU European Union EVSL Early Voluntary Sector Liberalization FTA Free trade agreement FTAA Free Trade Area of the Americas GATS General Agreement on Trade in Services GATT General Agreement on Tariffs and Trade HS Harmonized system MFN Most-favored-nation NAFTA North American Free Trade Agreement NTBs Nontariff barriers PACER Pacific Agreement on Closer Economic Relations PICTA Pacific Island Countries Trade Agreement PECC Pacific Economic Cooperation Council PTAs Preferential trade agreements RIAs Regional integration agreements RTAs Regional trade agreements SAARC South Asian Associations for Regional Cooperation SAFTA South Asian Free Trade Area SAPTA SAARC Preferential Trading Arrangement SPARTECA South Pacific Regional Trade and Economic Cooperation Agreement TPSEPA Trans-Pacific Strategic Economic Partnership Agreement WTO World Trade Organization

- 4 -
I. INTRODUCTION
Preferential trade agreements (PTAs) in the Asia-Pacific region have proliferated rapidly for the past five years. These PTAs include both regional trade agreements (RTAs) and bilateral trade agreement (BTAs).2 Although PTAs have been common elsewhere, there were few PTAs in Asia and the Pacific until the late 1990s.3 In fact, the momentum in the region was toward multilateralism, as reflected in the objectives of the Asia Pacific Economic Cooperation (APEC). The situation changed rapidly in the late 1990s, as many Asia-Pacific countries announced their intention to form bilateral and regional trade agreements. The formation of preferential agreements is a departure from APEC’s principle of open regionalism. APEC’s 1994 Bogor Declaration aims to form a free trade area in the Asia-Pacific region by 2010 for developed countries and by 2020 for developing countries. APEC trade liberalization is based on concerted unilateral liberalization in accordance with the most-favored-nation (MFN) principle. APEC operates through open dialogue; decisions are reached by consensus; and commitments are undertaken on a voluntary basis (see Appendix I). In contrast to APEC, the recent trade agreements are preferential in nature since they discriminate in favor of their members. Despite the recent proliferation of PTAs, Asia has had a successful track record in pursuing nonpreferential trade liberalization. Implementation of open regionalism and concerted unilateral liberalization through APEC principles in the mid–1990s demonstrated that a nonpreferential approach was possible.4 Barriers to trade declined markedly, and Asia-Pacific trade regimes are today open or moderately open, with average tariffs below the world average and declining. The value of both intra- and extra-regional trade increased remarkably for the last two decades, and trade has contributed significantly to the region’s economies in terms of both output and growth. The share of intra-regional trade in terms of total trade has continued to increase, except during the period of the Asian financial crisis in 1997–98 (see Figure 1 and Appendix II)5.
2 Special nonreciprocal PTAs between developed and developing countries are excluded from the discussion in this paper. 3 As of May 1, 2004, 208 PTAs have been notified to the GATT/WTO and have entered into force, with 146 entering into force since January 1, 1995, when the WTO was established. More than 250 agreements have been notified to the GATT/WTO, but many of them are not effectively in force, or have been superseded by redesigned agreements by the same signatories. The WTO estimates that by the end of 2005, the number of PTAs may surpass 300. 4 See, for example, Bora and Pangestu (1996) and PECC (1996, 1999). 5 Krumm and Kharas (2004) present extensive studies on economic integration in East Asia.

- 5 -
Figure 1. Declining Trade Barriers and Increasing Integration in the Asia-Pacific Region
East Asia:1 Average Most-favored-nation (MFN) Tariffs and Regional Exports, 1990-2003
35
37
39
41
43
45
47
49
51
53
55
1990 1991 1992 1993 1994 1995 1996 1997 1998 1999 2000 2001 2002 2003
Reg
iona
l exp
orts
as a
per
cent
of w
orld
exp
orts
4
6
8
10
12
14
16
18
Ave
rage
MFN
tarif
fs in
per
cent
East Asian Regional Exports as percent of Total East Asian Export (left axis)
Average MFN Tariff (right axis)
1 Brunei-Darussalam, China, Hong Kong, Indonesia, Japan, Korea, Malaysia, Philippines, Singapore, Taiwan Province of China. Sources: IMF Direction of Trade Statistics (DOTS) and IMF Trade Policy Information Database.
This paper describes the proliferation of Asia-Pacific PTAs during the past five years, discusses their characteristics and implementation, and assesses their potential effects in the near future. The focus of the paper is on East Asia, although some trade agreements in the Americas and South Asia are mentioned for comparison. This remainder of the paper is organized as follows. Section II presents the development and patterns of trade agreements in the Asia-Pacific region, while Section III describes the coverage and implementation of the agreements. Section IV provides some assessments of these PTAs by focusing on the quality of the agreements and the potential effects in the near future. Section V concludes the paper.
II. THE PROLIFERATION OF PTAS
A. The Formation of PTAs
The mid–1990s saw strong momentum toward open regionalism and multilateralism in the Asia-Pacific region. Although long debated in the region, very few PTAs were actually

- 6 -
implemented prior to 2000.6 In addition, the 1994 Bogor Declaration of APEC appeared to express the consensus within the Asia-Pacific region that further trade liberalization would be conducted on an MFN basis. Japan, Korea, China, Hong Kong SAR, and Taiwan Province of China were not involved in any PTA, and so the entire North Asian region was absent from the world map of PTAs. The situation changed drastically beginning in 1998. In 1998 there was initial discussion of a Japan-Korea trade agreement. The initiative was significant, considering how difficult relations between the two countries had been in the past. This was followed, in quick succession, by the launching of trade initiatives between Chile and Korea, Singapore and New Zealand, Singapore and Japan, Singapore and the United States, Association of South East Asian Nations (ASEAN) and China, ASEAN and Japan, and others. At least 15 PTAs involving Asia-Pacific countries have been established within the past five years, while at least 30 new PTAs are under formal negotiations. Therefore, more than 45 new PTAs may be established in the Asian-Pacific Rim within a decade.7 In addition to the agreements under formal negotiation, there are also informal discussions to develop more PTAs (see Table 1). Bilateral agreements have proliferated rapidly, and there are various initiatives to extend the existing regional agreements to include additional countries. Agreements between a regional grouping and a single country include the ASEAN-Japan Comprehensive Economic Partnership (AJCEP), ASEAN-China Comprehensive Economic Cooperation (ACCEC), and ASEAN-India Comprehensive Economic Cooperation (AICEC). There are also efforts to develop plurilateral agreements in addition to existing bilateral agreements. For example, the Trans-Pacific Strategic Economic Partnership (TPSEPA) involving New Zealand, Singapore, Brunei Darussalam, and Chile is a separate agreement from the existing New Zealand-Singapore bilateral agreement.
6 The Bangkok Agreement, an initiative launched by several countries in 1975, barely progressed for two decades and is considered inactive. The South Pacific Regional Trade and Economic Cooperation Agreement (SPARTECA), through which Australia and New Zealand offer nonreciprocal trade preferences to the South Pacific island countries, was signed in 1981. In 1983, Australia and New Zealand formed Closer Economic Cooperation (CER), and in 1992 Association of South East Asian Nations (ASEAN) announced the intention to form ASEAN Free Trade Area (AFTA). 7 However, the track record suggests that the period between the negotiation and the eventual implementation could be lengthy.

- 7 -
Table 1. PTAs Involving Asia-Pacific Countries (June 2005)1
PTAs established (year of signing the agreement, year into force) RTAs BTAs 2
AFTA (ASEAN Free Trade Area, 1992, 1993) Australia-New Zealand (1983, 1983) SAPTA (SAARC Preferential Trading Arrangement, 1993, 1995) India-Sri Lanka (1998, 2000) PICTA (Pacific Island Countries Trade Agreement, 2001, 2001) 3 New Zealand-Singapore (2000, 2001) TPSEPA (Trans-Pacific Strategic Economic Partnership Japan-Singapore (2002, 2002) Agreement, 2005, 2006) Australia-Singapore (2003, 2003) Singapore-United States (2003, 2004) Chile-Korea (2003, 2004) China-Macao SAR (2003, 2004) China-Hong Kong SAR (2003, 2004) China-Thailand (2004, 2004) India-Thailand (2004, 2004) Australia-Thailand (2004, 2005) Australia-United States (2004, 2005) Japan-Mexico (2004, 2005) New Zealand-Thailand (2005, 2005) Pakistan-Sri Lanka (2005, 2005) PTAs under negotiation (framework agreement has been signed)
RTAs BTAs ACCEC (ASEAN-China Comprehensive Economic Cooperation) Australia-China Japan-Thailand AFTA-CER CEP(AFTA-CER Closer Economic Partnership) Australia-Japan Korea-Mexico AICEP (ASEAN-India Comprehensive Economic Partnership) Australia-Malaysia Korea-Singapore AJCEC (ASEAN-Japan Comprehensive Economic Cooperation) Canada-Singapore Malaysia-Pakistan AKCCP (ASEAN-Korea Comprehensive Cooperation Partnership) China-India Malaysia-New Zealand BIMSTEC (Bangladesh, India, Myanmar, Sri Lanka, Thailand China-New Zealand Mexico-Singapore Bhutan, Nepal Economic Cooperation) Hong Kong SAR-New Zealand Panama-Singapore SAFTA (South Asian Free Trade Area) India-Singapore Peru-Thailand Indonesia-Japan Peru-Singapore Japan-Korea Singapore-Sri Lanka Japan-Malaysia Thailand-United States Japan-Philippine
PTAs under discussion (framework agreement has not been signed) 4 RTAs BTAs
ASEAN+3 (ASEAN-China-Japan-Korea) Australia-Chile Korea-New Zealand ASEAN-United States EAI (Enterprise for ASEAN Initiative) Canada-Korea Korea-United States Chile-Japan Mexico-New Zealand India-Malaysia New Zealand-United States Korea-Malaysia Philippine-United States 1 PTAs with countries that are not in the Asia Pacific region are excluded. Although purely South Asian agreements are not discussed in this paper, they are included in the table for illustration. 2 The list includes agreements on the early harvest program. 3 PICTA is developed under the Pacific Agreement on Closer Economic Relations (PACER), an umbrella agreement that establishes the guidelines for the development of trade relations among the Pacific Island countries, and with other trading partners including Australia and New Zealand. 4 The list of PTAs under discussion could be longer due to the informal nature of the initiative.

- 8 -
ASEAN is expected to play a significant role in the new network of PTAs. Over the past two years, ASEAN has become party to free trade negotiations with Australia-New Zealand, China, India, Japan, and Korea. These new ASEAN partners have adopted AFTA’s framework (see Box 1) and expanded liberalization to include investment, services, and to some extent, agriculture. Under these initiatives, referred to as the ASEAN+1 mechanism, ASEAN negotiates with each country separately. PTAs based on the ASEAN+1 scheme are expected to dominate the development of Asia-Pacific trade agreements in the next decade. Box 1. ASEAN and AFTA
The ASEAN Free Trade Area (AFTA) was announced by the first six members of ASEAN in 1992. ASEAN was formed in 1967 by Indonesia, Malaysia, the Philippines, Singapore, and Thailand. Brunei Darussalam joined in 1984, Vietnam in 1995, Myanmar and Lao People’s Democratic Republic (PDR) in 1997, and Cambodia in 1999. Cooperation among ASEAN members was initially more political in nature and was directed at security issues; the economic initiatives emerged in the aftermath of the Cold War. AFTA is a cooperative arrangement to reduce intraregional tariffs and nontariff barriers (NTBs). The tariff reduction is formulated in a Common Effective Preferential Tariff (CEPT) scheme, and every member country allocates goods that are subject to tariffs to one of four lists. The lists, which each country completes independently, determine the schedule of tariff reductions for the listed goods. The inclusion list contains goods for which each country agrees to reduce tariffs to 0–5 percent within ten years under the normal track and five to eight years under the fast track. The temporary exclusion list allows countries to delay tariff reduction on certain goods. Three years after joining AFTA, countries must gradually transfer the goods to the inclusion list. The sensitive list contains items such as unprocessed agricultural goods, and the member has eight years after joining AFTA to start reducing tariffs on these goods. The general exclusion list includes goods that are not subject to tariff reductions. The general exclusion list mostly contains arms and ammunitions, goods of an artistic and historic nature, and the like. By 2003, the first six member countries had included more than 99 percent of tariff items on the inclusion list, with the intraregional tariff reduced to 0–5 percent. Some commodities remained on the sensitive list, but these totaled less than 0.5 percent of all tariff items. For the four new members of ASEAN (Cambodia, Lao PDR, Myanmar, and Vietnam), the inclusion list comprised about 72 percent of total tariff lines in 2003, up from about 57 percent in 2001. Therefore, there are two tiers of membership and implementation of AFTA: the original six countries (ASEAN6) and the four newer members (ASEAN4). ASEAN countries continue to trade more with non-ASEAN members. Although the total value of ASEAN trade has doubled over the past ten years, the share of intra-ASEAN trade has increased more modestly from about 18 percent in the early 1990s to about 22 percent in 2001, and has remained relatively constant since then. For the newer members of ASEAN, the share of intra-ASEAN trade remained at more than 50 percent. Source: based in part on material from ASEAN Secretariat
A further initiative aims at forming an ASEAN+3 (ASEAN + China + Japan + Korea) regional partnership, viewed by some as a building block of a future Asian Economic Community (AEC). Asian leaders have expressed a desire to form an AEC, even though they

- 9 -
have so far developed neither a clear format nor the modalities for negotiations. The ASEAN+3 initiative emerged in the aftermath of the economic crisis in Asia and initially focused more on financial cooperation than on trade. For instance, the initiative was used to explore the idea of a regional financing facility proposed by Japan and the development of an Asian bond market. The desire to develop a regional mechanism for providing financial resources in crises was reflected in the ASEAN+3 finance ministers’ adoption of a regional system of currency swaps through the Chiang Mai Initiative in May 2000.8 There has been concern that the formation of a large East Asia trade bloc might fragment world trade. Combined with the possible establishment of the Free Trade Agreement of the Americas (FTAA) in the Americas and the European Union (EU) and its agreements with Africa, the Mediterranean area, and the CIS, the result might be a tripolar global trading system.9 Recent developments, however, suggest that the formation of a tripolar trading system is not imminent. Since the adoption of the Chiang Mai Initiative in 2000, the ASEAN+3 process has been overshadowed by the rapid development of ASEAN+1 initiatives.10 Some Asian countries have developed bilateral agreements with their partners in the Americas, while the United States has also been active in developing bilateral relations with various countries across the Asia-Pacific. The EU has its own designs in South America and Southeast Asia. FTAA negotiations have slowed to a crawl, and so the formation of a large trade bloc in the Americas may well be some time off. What is more likely to emerge in the foreseeable future is a complex web of intersecting bilateral, regional, and plurilateral trade agreements in the Asia-Pacific region. The formation of PTAs in the region will span economic and geographical divides (see Figures 2 and 3). The development of bilateral agreements is expected to progress more rapidly than that of plurilateral agreements, and distance or proximity does not seem to matter. The complex intersection of multiple free trade agreements has been called the “spaghetti bowl” effect.11 But the situation in the Asia and Pacific region is perhaps even more complex with many bilateral agreements developed within and across different regional agreements. One country may negotiate with another under several unrelated framework agreements (see Table 2).
8 These agreements are established through regular meetings of ministry of finance and central bank deputies. 9 See, for example, Bergsten (2000) and Scollay (2001). 10 It remains unclear how the current format of ASEAN+3 financial cooperation might lead to the formation of an East Asian trade bloc. The convergence of various ASEAN+1 initiatives may lead to such a trade bloc, but these initiatives have been negotiated independently and differ in many important respects. 11 See Bhagwati (1995) and Bhagwati, Greenaway, and Panagariya (1998).

- 10 -
Figure 2. Asia-Pacific Regional and Bilateral Trade Agreements (June 2005)
Russian Federation
China
Taiwan Province of China Canada
Hong Kong SAR
Nepal Japan U nited Bhutan States Maldives Pakistan Brunei
Korea
Darussalam
Indonesia Sri Lanka Malaysia Mexico
Philippines
Singapore India
Bangladesh Thailand Peru
Chile
Vietnam Australia New Zealand Papua New Guinea
Cambodia Lao PDR Myanmar . Note: : Bilateral trade agreement : Regional trade agreement
APEC
A FTA6
A FTA10
CER
NAFTA
S A PTA
TPSEPA

- 11 -
Figure 3. Asia-Pacific Regional and Bilateral Trade Agreements under Negotiation (June 2005)
Japan Canada U nited Maldives
Indonesia States
Brunei Darussalam
Korea Mexico Pakistan Malaysia Philippine Sri Lanka Singapore India Thailand Vietnam Bangladesh
Cambodia Australia New Zealand Chile
Lao P . D .R. + 28 other Myanmar countries China Hong Kong SAR Note: : Bilateral trade agreement : Regional trade agreement : Extension of regional trade agreement
A FTA
CER
FTAA
S A FTA
BIMSTEC
Peru
Nepal Bhutan
Panama

- 12 -
Table 2. Participation in PTAs: Selected Asia-Pacific Countries (June 2005)1
Countries RTAs BTAs Australia AFTA-CER CEP China, Japan, Malaysia, New Zealand,
Singapore, Thailand, United States Bangladesh BIMSTEC, SAFTA, SAPTA
Brunei Darussalam AFTA, AFTA-CER CEP, ACCEC, AJCEP, AICEC, AKCCP, TPSEPA
Cambodia AFTA, AFTA-CER CEP, ACCEC, AJCEP, AICEC, AKCCP
China ACCEC Australia, Hong Kong SAR, India, Macao SAR, New Zealand, Thailand
Hong Kong SAR China, New Zealand Indonesia AFTA, AFTA-CER CEP, ACCEC , AJCEP, AICEC,
AKCCP Japan
India AICEC, BIMSTEC, SAFTA, SAPTA China, Singapore, Sri Lanka, Thailand Japan AJCEP Australia, Indonesia, Korea, Malaysia,
Mexico, Philippine, Singapore, Thailand Korea AKCCP Chile, Japan, Mexico, Singapore Lao, PDR AFTA, AFTA-CER CEP, ACCEC, AJCEP, AICEC,
AKCCP
Malaysia AFTA, AFTA-CER CEP, ACCEC, AJCEP, AICEC, AKCCP
Australia, Japan, New Zealand, Pakistan
Myanmar AFTA, AFTA-CER CEP, ACCEC, AJCEP, AICEC, AKCCP, BIMSTEC
New Zealand AFTA-CER CEP, TPSEPA Australia, China, Hong Kong SAR, Malaysia, Singapore, Thailand
Philippines AFTA, AFTA-CER CEP, ACCEC, AJCEP, AICEC, AKCCP
Japan
Singapore AFTA, AFTA-CER CEP, ACCEC, AJCEP, AICEC, AKCCP, TPSEPA
Australia, Canada, India, Japan, Korea, Mexico, New Zealand, Panama, Peru, Sri Lanka, United States
Sri Lanka BIMSTEC, SAFTA, SAPTA India, Pakistan, Singapore Thailand AFTA, AFTA-CER CEP, ACCEC, AJCEP, AICEC,
AKCCP, BIMSTEC Australia, China, Japan, India, New Zealand, Peru, United States
Vietnam AFTA, AFTA-CER CEP, ACCEC, AJCEP, AICEC, AKCCP
1 Derived from Table 1. Only established PTAs and PTAs under negotiation are included.
- 13 -
B. Understanding the Proliferation of PTAs
Several events in the late 1990s contributed to the surge of interest in PTAs. The first was APEC’s failure to deliver Early Voluntary Sector Liberalization (EVSL). In 1997, in an effort to make more progress toward the Bogor Goals, APEC members selected 15 commodities to liberalize early, and through 1998 negotiations were conducted to choose the first nine sectors. However, the negotiations failed to produce a consensus, and members agreed essentially to transfer their efforts to liberalize these sectors to the World Trade Organization (WTO) framework. The failure was significant because it showed that the Bogor Goals might not be achieved by relying merely on the voluntary APEC process. Some have argued that the reciprocity-based negotiation for the EVSL, à la WTO, was not consistent with the principle of voluntarism embodied in APEC. Another contributing factor was the failure of the 1999 WTO Ministerial Conference in Seattle, which was seen as a major setback not only for the multilateral approach but also for the spirit of open regionalism in APEC. The EVSL episode forced APEC to look for the successful launch of the new WTO round to maintain the momentum of open regionalism, and the failure in Seattle was a disappointment. The role of APEC in supporting multilateralism was also questioned because of the lack of cohesiveness among APEC members during the meeting.12 It is important to note, however, that discussions to develop various preferential trading agreements actually emerged before Seattle, but the failure of the WTO Ministerial Conference provided another incentive for APEC members to adopt the preferential route to liberalization. PTAs came to be seen as a pragmatic, second-best approach to advance liberalization at a time when the multilateral route seemed slow to deliver and unilateral liberalization was politically difficult. The Asian crisis may have contributed to the move toward regional and bilateral approaches in East Asia. The crisis provided an incentive to create an East Asian economic identity, as most East Asians believed the West had “let them down.” There was a perception that Western investors had “created” the crisis by pulling their investments out of Asia and that the West had also dictated the response to the crisis.13 The development of ASEAN+3 was seen as an embryo of Asian financial cooperation, as reflected in the proposal to develop an Asian Monetary Fund. Pangestu and Gooptu (2004) also indicate that the need to reduce the risk of financial contagion and unusual exchange rate instability, which is made clear by the Asian financial crisis, is an important factor behind new regionalism in East Asia.14
12 Scollay and Gilbert (2001). 13 Bergsten (2000, 2001). 14 The crisis initially propelled countries to explore monetary cooperation and economic coordination, but by highlighting the economic interdependence of the region, it has led to the proposals for regional cooperation in trade and investments.

- 14 -
While the Asian crisis and developments within APEC and the WTO have triggered the recent burst of activity, underlying motivations include political and strategic considerations and the potential economic benefits of PTAs.15 These considerations are briefly discussed in the following. It has been common for trade agreements to be used to cement the political relationship among the countries involved. The Asia-Pacific region is no exception. For example, ASEAN was established during the Cold War to maintain peace and security in the region, and the formation of AFTA in 1992 kept ASEAN relevant when the Cold War ended. Similarly, the ASEAN-China agreement was regarded as a political confidence-building process with significant geostrategic undertones. For example, Soesastro (2003) indicates that although ASEAN was in many ways engaged in a difficult competition with China—for third-country markets and investment—it accepted the Chinese overtures, mainly because doing so returned ASEAN to center stage in the aftermath of the Asian financial crisis.16 Pangestu and Gooptu (2004) also emphasize that the key factor in the recent regionalism in the Asia-Pacific region is the need for stronger cooperation with China as a result of growing importance of China in the region. The Enterprise for ASEAN Initiative (EAI) proposal states that EAI is aimed at enhancing the already close ties between the United States and ASEAN. Another example is the Korea-Japan FTA which was intended to cement the improved political relationship between the two countries since the late 1990s.17 Apart from political and strategic objectives, many Asia-Pacific countries have pursued regional and bilateral agreements in an effort to promote trade and economic integration because of the speed and flexibility associated with this approach. The small number of parties involved, compared with the WTO and APEC, promised greater ease in reaching agreement, and in tailoring agreements to the specific conditions of the members. Reflecting the search for a flexible tool to deepen economic integration, many PTAs in the region cover areas well beyond merchandise trade. These include trade liberalization in services and investment and various provisions of behind-border measures. As PTAs proliferate, a domino effect increases the incentive for other countries to join. PTAs may damage the export prospects of nonmembers—including through trade diversion—and so the creation of a PTA may tempt other countries to join it or to form competing agreements. This is exemplified by the sequence of events following the opening of negotiations between ASEAN and China. As anticipated, Japan submitted a similar proposal 15 The objectives of trade agreements, as set out in legal documents and speeches, include expanding trade, promoting investment, developing economic integration, establishing regional cooperation and coordination, promoting human rights and democracy, and improving security. 16 Soesastro (2003) also underscores the importance of the strategic factor by indicating that it was the first time China found common ground and engaged in formal economic cooperation with its Southeast Asian neighbors. 17 Some early studies, such as IDE (2000) and Yamazawa (2001), suggested that the economic gains of such an agreement may be asymmetric. However, in October 2003 the governments of the two countries reaffirmed their commitment to develop a free trade agreement. The reasons may be defensive, with both countries seeking to mitigate the growing economic influence of China. See Kihwan (2002).

- 15 -
to ASEAN within months, and India and Korea soon followed. As a result, ASEAN is now seen—at least temporarily—as a strategic hub in the region.
III. THE IMPLEMENTATION OF PTAS
A. General Characteristics and Coverage
PTAs that were established prior to the mid-1990s have gradually moved beyond preferential tariff reductions in goods trade. The original Common Effective Preferential Tariff (CEPT) agreement of AFTA, signed in 1992, was formulated as a preferential tariff reduction in goods. The Australia-New Zealand CER agreement in 1983 was already more comprehensive than AFTA, but its original focus was also on tariff reduction. Both have gradually moved beyond tariff reductions. CER was revised several times to incorporate investment, services, trade facilitation, and labor mobility. Similarly, ASEAN developed separate agreements in services, investment, customs, and other areas. This approach differs from the all-inclusive approach of the agreements in the Americas, which were formulated from the outset as comprehensive agreements that include investment, services, property rights, customs harmonization, and other measures. Many of the newer initiatives envisage going well beyond the elimination of tariffs and NTBs at the outset. The new agreements include other border provisions, such as antidumping and safeguards, and behind-border provisions, such as harmonizing customs and competition policy and laws.18 The newer trade agreements, such as Singapore-Japan, ASEAN-China, ASEAN-Japan, and India-ASEAN, explicitly use the term “comprehensive economic partnership” (CEP) rather than “free trade agreement” to demonstrate that the commitments go beyond free trade. Although CEP has gained in popularity, there is no guarantee that the commitment to liberalization is stronger or that the list of exceptions is shorter. Most of these new agreements are still under negotiation, and the strength of the commitment to move into regulatory areas remains to be seen. Although Asia-Pacific PTAs go beyond free trade, there is no significant indication that they are leading to formation of a common market or a customs union. These agreements include some cooperation in domestic policies, standards, and regulations and include certain provisions for labor mobility. However, most agreements do not aim to develop market integration that would result in the free movement of production factors, including goods, services, people, and finance, among members as in a common market. Also, none of the Asia-Pacific PTAs envisages the establishment of custom unions, i.e., common external trade policies vis-à-vis nonmembers.19 18 Because these PTAs include provisions aimed at greater economic integration Schiff and Winters (2003) refer to such agreements as regional integration agreements (RIAs).
19 A helpful classification of PTAs according to the extent of policy harmonization was discussed in Krueger (1999). The simplest form of preferential trading agreement is a free trade agreement, in which tariffs are lowered for members and maintained for nonmembers. The next level is the custom union, in which tariffs
(continued)
- 16 -
The PTAs vary extensively in terms of the institutional arrangements for negotiations. AFTA followed a regional approach to negotiations, whereby an AFTA member provides a common preferential tariff for other AFTA members on a reciprocal basis. The ASEAN-China framework agreement specifies a regional approach to negotiations, while providing for the possibility of bilateral negotiations, for example, in determining the lists of exemptions. In contrast, Japan has followed both bilateral and regional approaches in negotiating its partnership with ASEAN. In most cases, economic or trade ministries are in charge of the negotiations, while the final decisions are made at annual meetings of heads of state. Trade agreements in the Asia-Pacific region tend to be more loosely formulated and less detailed than the agreements in Europe or the Americas. Most Asia-Pacific PTAs have no supranational institution to monitor implementation and settle disputes. ASEAN has a secretariat to coordinate and facilitate ASEAN-related activities, but the secretariat does not enforce rules. The implementation of CER is monitored by the Australia-New Zealand Affairs Secretariat under the ministries of foreign affairs and trade of the two countries. The rules of origin are also enforced mostly at the national level. Most Asia-Pacific PTAs also use informal consultations and negotiations to resolve disputes.20
B. Tariff Reduction and Rules of Origin
Although most trade agreements envisage the progressive elimination of tariffs and NTBs on substantially all trade in goods, there is no standard approach to undertaking tariff reductions. Some agreements, such as AFTA, ASEAN-China, CER, Singapore-New Zealand, and Singapore-Australia, have pursued an approach whereby tariffs for all items are generally reduced and exceptions are spelled out on a negative list. In contrast, ASEAN-India, Singapore-Japan, and some other PTAs are pursuing a positive list approach, whereby tariffs of specific commodities on the list are reduced. In all these agreements, there is a common practice that members set the base tariff rates to which the reduction applies before tariff reduction schedules are adopted. The base rate is usually the MFN-applied rate at the beginning of the negotiation period (see Table 3).
among members are eliminated and tariffs for nonmembers are adjusted to a common level. A common market is a custom union that permits the free movement of production factors, including labor and capital, among members. An economic union is a common market that has common economic laws covering issues such as standards for members. 20 In contrast, the EU has a supranational institution that oversees the common market policies and has the right to enforce rules on members. Similarly, Mercosur has a multilateral trade commission that resolves disputes, the Andean Pact has a court of justice, and NAFTA has a free trade commission and a secretariat to administer the agreements and help resolve disputes.
- 17 -
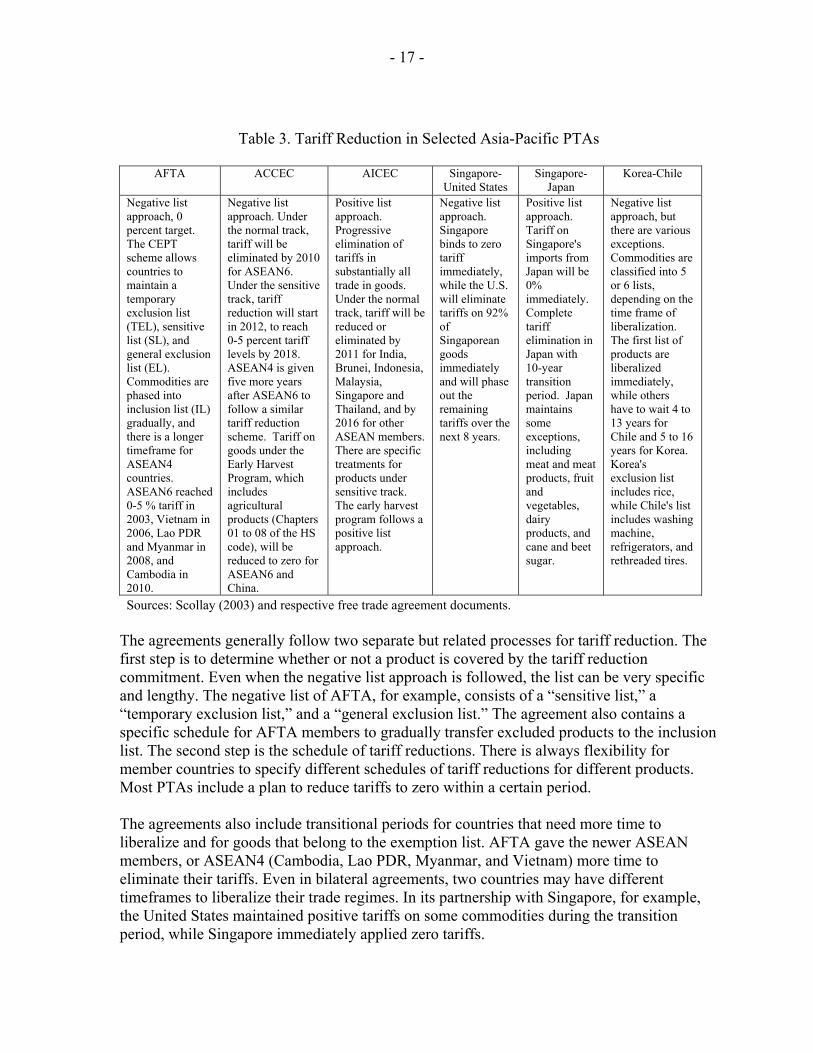
Table 3. Tariff Reduction in Selected Asia-Pacific PTAs
AFTA ACCEC AICEC Singapore-United States
Singapore-Japan
Korea-Chile
Negative list approach, 0 percent target. The CEPT scheme allows countries to maintain a temporary exclusion list (TEL), sensitive list (SL), and general exclusion list (EL). Commodities are phased into inclusion list (IL) gradually, and there is a longer timeframe for ASEAN4 countries. ASEAN6 reached 0-5 % tariff in 2003, Vietnam in 2006, Lao PDR and Myanmar in 2008, and Cambodia in 2010.
Negative list approach. Under the normal track, tariff will be eliminated by 2010 for ASEAN6. Under the sensitive track, tariff reduction will start in 2012, to reach 0-5 percent tariff levels by 2018. ASEAN4 is given five more years after ASEAN6 to follow a similar tariff reduction scheme. Tariff on goods under the Early Harvest Program, which includes agricultural products (Chapters 01 to 08 of the HS code), will be reduced to zero for ASEAN6 and China.
Positive list approach. Progressive elimination of tariffs in substantially all trade in goods. Under the normal track, tariff will be reduced or eliminated by 2011 for India, Brunei, Indonesia, Malaysia, Singapore and Thailand, and by 2016 for other ASEAN members. There are specific treatments for products under sensitive track. The early harvest program follows a positive list approach.
Negative list approach. Singapore binds to zero tariff immediately, while the U.S. will eliminate tariffs on 92% of Singaporean goods immediately and will phase out the remaining tariffs over the next 8 years.
Positive list approach. Tariff on Singapore's imports from Japan will be 0% immediately. Complete tariff elimination in Japan with 10-year transition period. Japan maintains some exceptions, including meat and meat products, fruit and vegetables, dairy products, and cane and beet sugar.
Negative list approach, but there are various exceptions. Commodities are classified into 5 or 6 lists, depending on the time frame of liberalization. The first list of products are liberalized immediately, while others have to wait 4 to 13 years for Chile and 5 to 16 years for Korea. Korea's exclusion list includes rice, while Chile's list includes washing machine, refrigerators, and rethreaded tires.
Sources: Scollay (2003) and respective free trade agreement documents. The agreements generally follow two separate but related processes for tariff reduction. The first step is to determine whether or not a product is covered by the tariff reduction commitment. Even when the negative list approach is followed, the list can be very specific and lengthy. The negative list of AFTA, for example, consists of a “sensitive list,” a “temporary exclusion list,” and a “general exclusion list.” The agreement also contains a specific schedule for AFTA members to gradually transfer excluded products to the inclusion list. The second step is the schedule of tariff reductions. There is always flexibility for member countries to specify different schedules of tariff reductions for different products. Most PTAs include a plan to reduce tariffs to zero within a certain period. The agreements also include transitional periods for countries that need more time to liberalize and for goods that belong to the exemption list. AFTA gave the newer ASEAN members, or ASEAN4 (Cambodia, Lao PDR, Myanmar, and Vietnam) more time to eliminate their tariffs. Even in bilateral agreements, two countries may have different timeframes to liberalize their trade regimes. In its partnership with Singapore, for example, the United States maintained positive tariffs on some commodities during the transition period, while Singapore immediately applied zero tariffs.

- 18 -
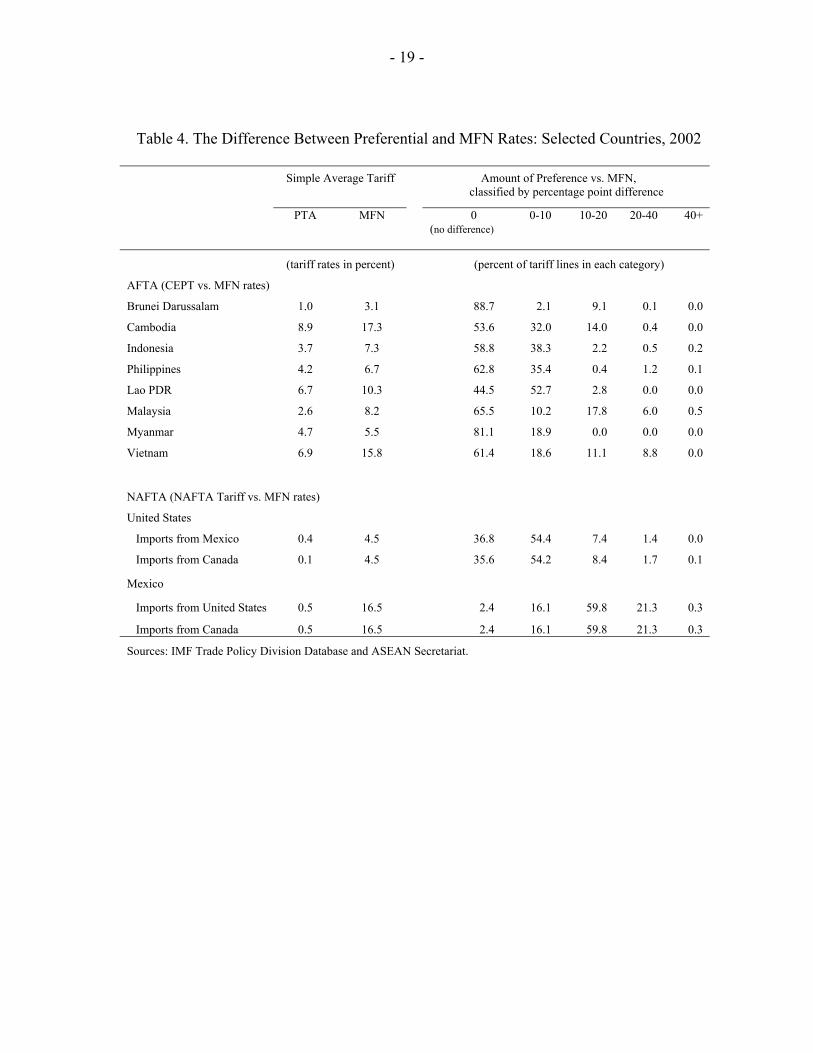
Every trade agreement has a list of exemptions, and in some agreements the list is long and complicated. All agreements make provision for sectors considered sensitive by the negotiating parties. Agriculture generally receives special treatment and in many cases is totally excluded from the scheme. The Singapore-Japan comprehensive partnership excludes some agriculture and fisheries products even though Singapore has no significant agricultural or fisheries sectors. Many agreements also exclude some nonagricultural products. The Korea-Chile agreement, for example, excludes specific items such as refrigerators and washing machines. AFTA also excludes from tariff reductions Indonesia’s textile and petrochemical products, Malaysia’s automotive products, and the Philippines’ cement sector. Although the MFN tariff rates and preferential tariff rates vary greatly among countries and trade agreements, the difference between the two rates is small in AFTA.21 Average MFN rates for AFTA members tend to be less than 10 percent, and the difference between the MFN and the preferential rates are generally 5 percentage points or less, except for the newer members such as Cambodia, Lao PDR, and Vietnam. While these gaps are relatively comparable to the differences between NAFTA and MFN rates in the United States, the differences are clearly smaller than in the case of Mexico (see Table 4). AFTA members have a strong tendency to apply the preferential tariff rates multilaterally, on an MFN basis, to nonmembers. AFTA tariff data show that the preferential and MFN rates are similar for a majority of tariff lines. When the two rates differ, the difference is generally less than 10 percentage points. Indonesia and Philippines, for example, apply similar tariff rates in about 60 percent of all tariff lines and maintain a less than 10 percentage point tariff differential in about 36 percent of all tariff lines. The respective figures for the United States, in contrast, are 36 percent and 54 percent. Mexico maintains similar tariff rates in only 2 percent of all tariff lines, while Vietnam, which is comparable to Mexico in terms of average tariff level, maintains similar tariffs in 61 percent of all tariff lines. Some ASEAN members, such as Cambodia, Malaysia, and Vietnam, maintain higher MFN tariff rates in some sectors, but the amount of preferential treatment is generally less than that under NAFTA (see Table 4).
21 The differences between the MFN and preferential tariffs provide incentives for traders to favor preferential agreements. However, no generalizations can be made for the effect of these differences because one country may participate in various preferential agreements, each with a different tariff reduction schedule.
- 19 -
Table 4. The Difference Between Preferential and MFN Rates: Selected Countries, 2002
Simple Average Tariff Amount of Preference vs. MFN,
classified by percentage point difference
PTA MFN 0
(no difference) 0-10 10-20 20-40 40+
(tariff rates in percent) (percent of tariff lines in each category)
AFTA (CEPT vs. MFN rates)
Brunei Darussalam 1.0 3.1 88.7 2.1 9.1 0.1 0.0
Cambodia 8.9 17.3 53.6 32.0 14.0 0.4 0.0
Indonesia 3.7 7.3 58.8 38.3 2.2 0.5 0.2
Philippines 4.2 6.7 62.8 35.4 0.4 1.2 0.1
Lao PDR 6.7 10.3 44.5 52.7 2.8 0.0 0.0
Malaysia 2.6 8.2 65.5 10.2 17.8 6.0 0.5
Myanmar 4.7 5.5 81.1 18.9 0.0 0.0 0.0
Vietnam 6.9 15.8 61.4 18.6 11.1 8.8 0.0
NAFTA (NAFTA Tariff vs. MFN rates)
United States
Imports from Mexico 0.4 4.5 36.8 54.4 7.4 1.4 0.0
Imports from Canada 0.1 4.5 35.6 54.2 8.4 1.7 0.1
Mexico
Imports from United States 0.5 16.5 2.4 16.1 59.8 21.3 0.3
Imports from Canada 0.5 16.5 2.4 16.1 59.8 21.3 0.3
Sources: IMF Trade Policy Division Database and ASEAN Secretariat.

- 20 -
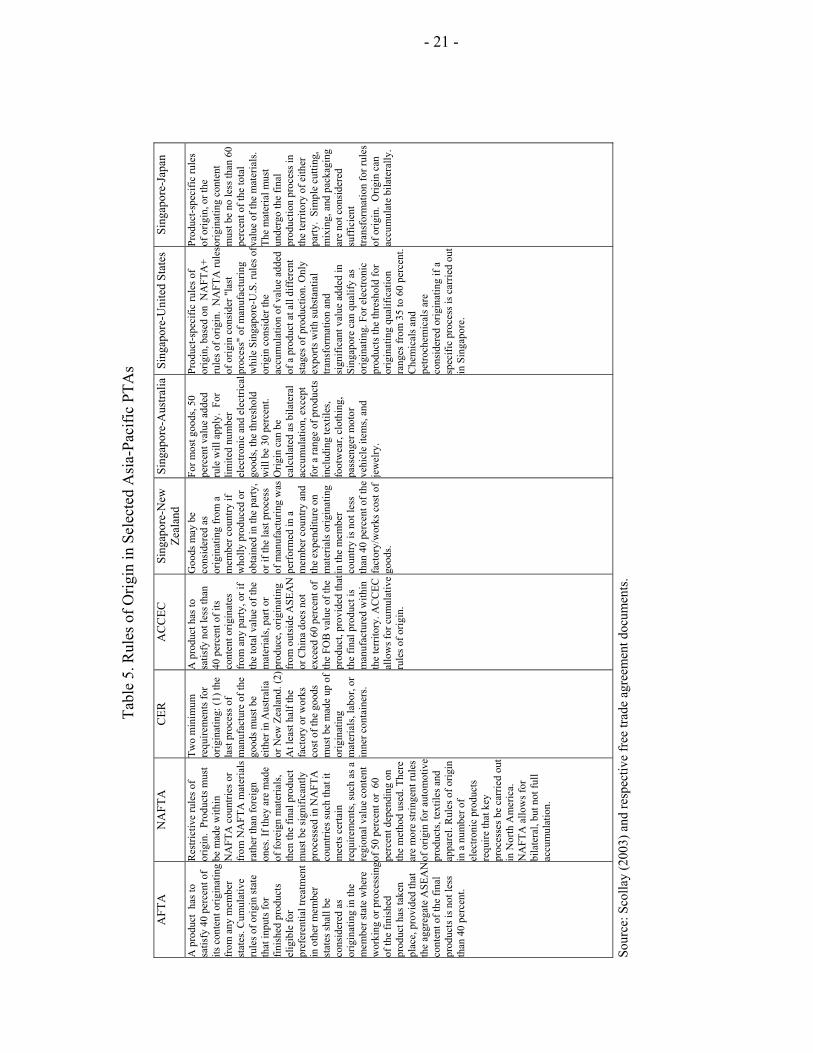
Some new framework agreements identify products that will be liberalized early and more progressively in the early harvest program. The ASEAN-China CEC follows a negative list approach and includes some agricultural products in the early harvest program.22 The exception lists for these products are long, and they are being negotiated between China and ASEAN members. However, the negative list approach of this program looks more attractive than the positive list approach adopted by the ASEAN-India CEP. The latter specifies 105 products to be included in the early harvest program in which the parties agree to exchange tariff concessions. Another list consists of 111 products for which India accords concessions to new ASEAN members. The early harvest is attractive because it could include sensitive products, such as agriculture, but the initiative will be considered successful if it creates momentum for further liberalization. Rules of origin vary from the relatively simple and liberal in the cases of AFTA and CER to the more complex and product-specific in the cases of the Singapore-U.S. and Singapore-Japan agreements.23 Most agreements allow for cumulative rules of origin to determine the total bilateral or regional local content of a specific product. The more liberal rules of origin apply a general rule that the local content of the product has to be at 40–50 percent. In contrast, NAFTA has adopted complex product-specific rules of origin, which constitute more than 200 pages of the agreement. Some bilateral agreements, such as Singapore-U.S. and Singapore-Japan, use product-specific rules of origin, even though they are more flexible than NAFTA. For example, the Singapore-U.S. FTA may review the rules of origin for textiles and apparel should there be eventual harmonization pursuant to the WTO agreements on rules of origin. As with the schedule of tariff reductions, there is invariably special treatment for “special sectors” (see Table 5).
22 The products covered include live animals, meat and edible meat offal, fish, dairy products, other live animal products, live trees, edible vegetables, and edible fruit and nuts. 23 Since a preferential trading agreement does not always maintain uniform external tariff rates, rules of origin are important to prevent trade deflection, or the shift of imports to a member country with a lower external tariff. The procedures to calculate rules of origin vary. Calculations can be based on changes of the tariff heading, on processes used, on percentage of value added, or on substantial transformation. When value added is the basis, additional rules address the treatment of raw materials, interest costs, accounting, and other issues.
- 21 -
Ta
ble
5. R
ules
of O
rigin
in S
elec
ted
Asi
a-Pa
cific
PTA
s
AFT
A
NA
FTA
C
ER
AC
CEC
Si
ngap
ore-
New
Ze
alan
d Si
ngap
ore-
Aus
tralia
Sing
apor
e-U
nite
d St
ates
Sing
apor
e-Ja
pan
A p
rodu
ct h
as to
sa
tisfy
40
perc
ent o
f its
con
tent
orig
inat
ing
from
any
mem
ber
stat
es. C
umul
ativ
e ru
les o
f orig
in st
ate
that
inpu
ts fo
r fin
ishe
d pr
oduc
ts
elig
ible
for
pref
eren
tial t
reat
men
t in
oth
er m
embe
r st
ates
shal
l be
cons
ider
ed a
s or
igin
atin
g in
the
mem
ber s
tate
whe
re
wor
king
or p
roce
ssin
g of
the
finis
hed
prod
uct h
as ta
ken
plac
e, p
rovi
ded
that
th
e ag
greg
ate
ASE
AN
co
nten
t of t
he fi
nal
prod
ucts
is n
ot le
ss
than
40
perc
ent.
Res
trict
ive
rule
s of
orig
in.
Prod
ucts
mus
t be
mad
e w
ithin
N
AFT
A c
ount
ries o
r fr
om N
AFT
A m
ater
ials
ra
ther
than
fore
ign
ones
. If t
hey
are
mad
e of
fore
ign
mat
eria
ls,
then
the
final
pro
duct
m
ust b
e si
gnifi
cant
ly
proc
esse
d in
NA
FTA
co
untri
es su
ch th
at it
m
eets
cer
tain
re
quire
men
ts, s
uch
as a
re
gion
al v
alue
con
tent
of
50
perc
ent o
r 60
pe
rcen
t dep
endi
ng o
n th
e m
etho
d us
ed. T
here
ar
e m
ore
strin
gent
rule
s of
orig
in fo
r aut
omot
ive
prod
ucts
, tex
tiles
and
ap
pare
l. R
ules
of o
rigin
in
a n
umbe
r of
elec
troni
c pr
oduc
ts
requ
ire th
at k
ey
proc
esse
s be
carr
ied
out
in N
orth
Am
eric
a.
NA
FTA
allo
ws f
or
bila
tera
l, bu
t not
full
accu
mul
atio
n.
Two
min
imum
re
quire
men
ts fo
r or
igin
atin
g: (1
) the
la
st p
roce
ss o
f m
anuf
actu
re o
f the
go
ods m
ust b
e ei
ther
in A
ustra
lia
or N
ew Z
eala
nd. (
2)
At l
east
hal
f the
fa
ctor
y or
wor
ks
cost
of t
he g
oods
m
ust b
e m
ade
up o
f or
igin
atin
g m
ater
ials
, lab
or, o
r in
ner c
onta
iner
s.
A p
rodu
ct h
as to
sa
tisfy
not
less
than
40
per
cent
of i
ts
cont
ent o
rigin
ates
fr
om a
ny p
arty
, or i
f th
e to
tal v
alue
of t
he
mat
eria
ls, p
art o
r pr
oduc
e, o
rigin
atin
g fr
om o
utsi
de A
SEA
N
or C
hina
doe
s not
ex
ceed
60
perc
ent o
f th
e FO
B v
alue
of t
he
prod
uct,
prov
ided
that
th
e fin
al p
rodu
ct is
m
anuf
actu
red
with
in
the
terr
itory
. AC
CEC
al
low
s for
cum
ulat
ive
rule
s of o
rigin
.
Goo
ds m
ay b
e co
nsid
ered
as
orig
inat
ing
from
a
mem
ber c
ount
ry if
w
holly
pro
duce
d or
ob
tain
ed in
the
party
, or
if th
e la
st p
roce
ss
of m
anuf
actu
ring
was
pe
rfor
med
in a
m
embe
r cou
ntry
and
th
e ex
pend
iture
on
mat
eria
ls o
rigin
atin
g in
the
mem
ber
coun
try is
not
less
th
an 4
0 pe
rcen
t of t
he
fact
ory/
wor
ks c
ost o
f go
ods.
For m
ost g
oods
, 50
perc
ent v
alue
add
ed
rule
will
app
ly.
For
limite
d nu
mbe
r el
ectro
nic
and
elec
trica
l go
ods,
the
thre
shol
d w
ill b
e 30
per
cent
. O
rigin
can
be
calc
ulat
ed a
s bila
tera
l ac
cum
ulat
ion,
exc
ept
for a
rang
e of
pro
duct
s in
clud
ing
text
iles,
foot
wea
r, cl
othi
ng,
pass
enge
r mot
or
vehi
cle
item
s, an
d je
wel
ry.
Prod
uct-s
peci
fic ru
les o
f or
igin
, bas
ed o
n N
AFT
A+
rule
s of o
rigin
. N
AFT
A ru
les
of o
rigin
con
side
r "la
st
proc
ess"
of m
anuf
actu
ring
whi
le S
inga
pore
-U.S
. rul
es o
f or
igin
con
side
r the
ac
cum
ulat
ion
of v
alue
add
ed
of a
pro
duct
at a
ll di
ffer
ent
stag
es o
f pro
duct
ion.
Onl
y ex
ports
with
subs
tant
ial
trans
form
atio
n an
d si
gnifi
cant
val
ue a
dded
in
Sing
apor
e ca
n qu
alify
as
orig
inat
ing.
For
ele
ctro
nic
prod
ucts
the
thre
shol
d fo
r or
igin
atin
g qu
alifi
catio
n ra
nges
from
35
to 6
0 pe
rcen
t. C
hem
ical
s and
pe
troch
emic
als a
re
cons
ider
ed o
rigin
atin
g if
a sp
ecifi
c pr
oces
s is c
arrie
d ou
t in
Sin
gapo
re.
Prod
uct-s
peci
fic ru
les
of o
rigin
, or t
he
orig
inat
ing
cont
ent
mus
t be
no le
ss th
an 6
0 pe
rcen
t of t
he to
tal
valu
e of
the
mat
eria
ls.
The
mat
eria
l mus
t un
derg
o th
e fin
al
prod
uctio
n pr
oces
s in
the
terr
itory
of e
ither
pa
rty.
Sim
ple
cutti
ng,
mix
ing,
and
pac
kagi
ng
are
not c
onsi
dere
d su
ffic
ient
tra
nsfo
rmat
ion
for r
ules
of
orig
in.
Orig
in c
an
accu
mul
ate
bila
tera
lly.
Sour
ce: S
colla
y (2
003)
and
resp
ectiv
e fr
ee tr
ade
agre
emen
t doc
umen
ts.

- 22 -
C. Commitments Beyond Tariff Reduction
Most trade agreements have some commitments to eliminate quotas and other NTBs, but the degree of liberalization varies. The more liberal agreements, such as CER, Singapore-New Zealand, and Singapore-Australia, do not permit any quantitative trade restrictions. In AFTA, quantitative restrictions and NTBs are to be eliminated within a certain period and there is no explicit provision in these agreements to prevent the introduction of new trade restrictions. Other agreements, such as Singapore-Japan, are binding the liberalization of quantitative restrictions and NTBs under General Agreement on Tariffs and Trade (GATT) Article XI. Asian trade agreements tend to have less detailed safeguard provisions than U.S. agreements. Australia-New Zealand, Singapore-New Zealand, and Singapore-Australia agreements state that no safeguard mechanisms are to be applied by either country, while AFTA does not even mention safeguards. Singapore-Japan, Singapore-U.S., and the proposed ASEAN-China agreements, however, mention the possibility of applying temporary safeguards during the transitional period. Most agreements include specific rules to prohibit or eliminate export subsidies either immediately or gradually. In terms of antidumping, countervailing duties, and subsidies, most countries applied their WTO commitments to their PTAs. In contrast, NAFTA and other bilateral agreements in the Americas, such as Chile-Canada and Chile-U.S., explicitly give members the right to impose safeguards when an increase in imports damages domestic economies. Most agreements cover the liberalization of services trade, although the extent of commitment and implementation vary. Service liberalization has played an important role in the partnership among the more developed countries in the region, such as Australia, Japan, New Zealand, Singapore, and the United States, where the services sector accounts for a significant share of the economy. Many agreements, including Singapore-U.S., CER, and Singapore-Australia, follow a negative list approach, incorporating market access provisions and granting the better of national treatment or MFN treatment to foreign service providers from member countries. Singapore-Japan and Singapore-New Zealand agreements have such provisions, although they follow the General Agreement on Trade in Services (GATS) positive list approach. While each agreement has a general list applying to all members, each country may also have its own list of additional exemptions. This specific list usually consists of services that require government certification of licenses or involve government institutions (airports, postal services, public hospitals, social security, atomic energy). Other private or semiprivate sectors also may be exempted, such as the aviation industry, basic telecommunications, maritime services, cultural industries, some financial services, and medical services (see Table 6).

- 23 -
Ta
ble
6. S
ervi
ces a
nd In
vest
men
t Lib
eral
izat
ion
in S
elec
ted
Asi
a-Pa
cific
PTA
s Tr
ade
Agr
eem
ent
AFT
A
AC
CEC
A
JCEP
Si
ngap
ore-
Uni
ted
Stat
es
Sing
apor
e-Ja
pan
Sing
apor
e-A
ustra
lia
Serv
ices
Se
rvic
es li
bera
lizat
ion
is
cove
red
unde
r AFA
S, si
gned
in
1995
. Th
e ob
ject
ive
of A
FAS
is to
enh
ance
coo
pera
tion
in
serv
ices
, to
elim
inat
e su
bsta
ntia
lly re
stric
tions
to
trade
in se
rvic
es, a
nd to
lib
eral
ize
trade
in se
rvic
es b
y ex
pand
ing
the
dept
h an
d sc
ope
of li
bera
lizat
ion
beyo
nd G
ATS
co
mm
itmen
t. A
FAS
follo
ws a
po
sitiv
e lis
t app
roac
h.
Agr
ee to
ent
er n
egot
iatio
n to
pr
ogre
ssiv
ely
elim
inat
e al
l di
scrim
inat
ory
mea
sure
s with
re
spec
t to
trade
in se
rvic
es,
expa
nd th
e de
pth
and
scop
e of
se
rvic
es li
bera
lizat
ion
unde
r G
ATS
, and
enh
ance
co
oper
atio
n in
serv
ices
to
impr
ove
effic
ienc
y an
d co
mpe
titiv
enes
s.
Libe
raliz
atio
n is
dire
cted
to
prog
ress
ive
elim
inat
ion
of
subs
tant
ially
all
disc
rimin
atio
n,
expa
nsio
n in
dep
th a
nd sc
ope
of se
rvic
es li
bera
lizat
ion.
Fa
cilit
atio
n of
ent
ry a
nd
tem
pora
ry m
ovem
ent o
f bu
sine
sspe
ople
. Enh
ance
d co
oper
atio
n in
serv
ices
.
Neg
ativ
e lis
t app
roac
h. N
atio
nal
treat
men
t and
mar
ket a
cces
s pr
ovis
ion
appl
y. L
ocal
pre
senc
e is
not
requ
ired.
Gov
ernm
ent
proc
urem
ent a
nd in
vest
men
ts a
re
incl
uded
in a
sepa
rate
cha
pter
.
Full
incl
usio
n of
fina
ncia
l se
rvic
es. T
he e
xclu
sion
list
in
clud
e ge
nera
l ser
vice
s tha
t re
quire
d go
vern
men
t cer
tific
atio
n in
volv
emen
t. Th
e ge
nera
l ex
clus
ion
list i
nclu
des a
ir an
d m
ariti
me
serv
ices
, bro
adca
stin
g,
soci
al se
curit
y se
rvic
es, p
ublic
ho
spita
ls, p
aten
t age
ncie
s, re
gist
erin
g se
curit
y, a
nd o
ther
so
cial
serv
ices
.
Posi
tive
list a
ppro
ach
base
d on
G
ATS
. Mai
nly
agre
emen
t on
natio
nal t
reat
men
t and
im
prov
emen
t of m
arke
t acc
ess.
Safe
guar
d pr
ovis
ion
is n
ot
incl
uded
. Gov
ernm
ent
proc
urem
ent a
nd in
vest
men
ts a
re
cove
red
sepa
rate
ly.
The
right
of
non-
esta
blis
hmen
t is n
ot
incl
uded
. Mar
itim
e an
d av
iatio
n se
rvic
es a
re g
ener
ally
exc
lude
d,
whi
le te
leco
mm
unic
atio
ns
serv
ices
are
cov
ered
und
er
sepa
rate
cha
pter
.
Neg
ativ
e lis
t app
roac
h. M
arke
t ac
cess
and
nat
iona
l tre
atm
ent
prov
isio
n. S
afeg
uard
act
ions
m
ay b
e ta
ken
in th
e ev
ent o
f ba
lanc
e of
pay
men
t diff
icul
ties.
The
list o
f exe
mpt
ion
for
Aus
tralia
incl
udes
te
leco
mm
unic
atio
n, m
edic
ine,
po
stal
, and
supp
ly o
f th
erap
eutic
goo
ds.
Sing
apor
e ex
clud
es fi
nanc
ial a
uditi
ng,
arch
itect
ure,
tax-
rela
ted
serv
ices
, roy
alty
col
lect
ion,
la
nd su
rvey
ing
and
requ
ires a
n ap
poin
tmen
t of l
ocal
man
ager
fo
r for
eign
serv
ices
es
tabl
ishm
ent.
Inve
stm
ent
Cov
ered
und
er th
e Fr
amew
ork
Agr
eem
ent o
n th
e A
SEA
N
Inve
stm
ent A
rea
(AIA
), si
gned
in
199
8, to
est
ablis
h A
SEA
N
com
petit
ive
inve
stm
ent a
rea
by
2010
and
free
flow
of
inve
stm
ent b
y 20
20. A
IA
prov
ides
nat
iona
l tre
atm
ent t
o A
SEA
N in
vest
ors b
y 20
10 a
nd
othe
r inv
esto
rs b
y 20
20, o
pens
al
l ind
ustri
es to
ASE
AN
in
vest
ors b
y 20
10 a
nd o
ther
s by
202
0.
The
parti
es a
gree
to e
nter
into
ne
gotia
tion
to p
rogr
essi
vely
lib
eral
ize
inve
stm
ent r
egim
e,
to st
reng
then
coo
pera
tion
in
inve
stm
ent,
to fa
cilit
ate
inve
stm
ent,
to im
prov
e tra
nspa
renc
y of
inve
stm
ent
rule
s and
regu
latio
ns, a
nd to
pr
ovid
e pr
otec
tion
for
inve
stm
ent.
ASE
AN
and
Japa
n de
cide
to
crea
te li
bera
l and
com
petit
ive
envi
ronm
ent,
to st
reng
then
co
oper
atio
n in
inve
stm
ent,
to
faci
litat
e in
vest
men
t, to
im
prov
e tra
nspa
renc
y, a
nd to
pr
ovid
e pr
otec
tion
for i
nves
tor
and
inve
stm
ent.
The
bette
r of n
atio
nal t
reat
men
t or
MFN
trea
tmen
t app
lies t
o fo
reig
n in
vest
ors.
Pro
visi
on o
f in
vest
or p
rote
ctio
n an
d se
curit
y an
d al
so fa
ir an
d eq
uita
ble
treat
men
t. Tr
ansf
er a
nd
rem
ittan
ce a
re fr
eely
allo
wed
. N
o un
fair
perf
orm
ance
-rel
ated
re
quire
men
ts m
ay b
e im
pose
d.
Gra
ntin
g fa
ir m
arke
t val
ue in
the
even
t of e
xpro
pria
tion
or
natio
naliz
atio
n fo
r pub
lic
purp
ose.
Pro
vidi
ng in
vest
or -
stat
e di
sput
e se
ttlem
ent
mec
hani
sm.
Prov
isio
n of
nat
iona
l tre
atm
ent t
o in
vest
ors,
and
equa
l acc
ess t
o ju
stic
e to
pur
sue
or d
efen
d in
vest
or's
right
. N
o pe
rfor
man
ce-r
elat
ed re
quire
men
t as
the
cond
ition
for
esta
blis
hmen
t and
exp
ansi
on o
f op
erat
ion.
Tem
pora
ry sa
fegu
ard
mea
sure
s are
pos
sibl
e in
the
case
of
serio
us b
alan
ce o
f pay
men
t di
ffic
ultie
s. N
eith
er p
arty
shal
l ex
prop
riate
or n
atio
naliz
e in
vest
men
t or o
ther
sim
ilar
mea
sure
s, ex
cept
for p
ublic
pu
rpos
es, a
nd th
e ex
prop
riatio
n sh
all b
e co
nduc
ted
base
d on
non
-di
scrim
inat
ory
base
s and
upo
n th
e pa
ymen
t of c
ompe
nsat
ion.
Nat
iona
l tre
atm
ent f
or
inve
stor
s, w
ith a
few
ex
cept
ions
. Tr
ansf
er a
nd
rem
ittan
ce fr
eely
allo
wed
with
so
me
bala
nce
of p
aym
ent
safe
guar
ds. I
nves
tors
are
pr
otec
ted
agai
nst
expr
opria
tion,
and
fully
co
mpe
nsat
ed sh
ould
ex
prop
riatio
n oc
cur.
G
over
nmen
t pro
cure
men
t is
excl
uded
. Pro
vidi
ng in
vest
or-
stat
e di
sput
e se
ttlem
ent
mec
hani
sm.
Sour
ces:
Sco
llay
(200
3) a
nd re
spec
tive
free
trad
e ag
reem
ent d
ocum
ents
.

- 24 -
When countries are not ready to liberalize their service sectors, the minimum pledge is to bind their PTA commitments in the GATS. Many trade agreements include services liberalization in the agenda but contain few provisions beyond GATS commitments. ASEAN Framework Agreement on Services (AFAS) follows a positive list approach and promises to go beyond GATS in terms of liberalization. But the progress of AFAS has been very slow (see Box 2). The framework agreements of the ASEAN+1 initiatives, such as ASEAN-China, ASEAN-Japan, and ASEAN-India, clearly note that each party is committed to liberalize trade in services beyond its GATS commitments. It remains unclear, however, how the goal to liberalize trade in services will be met. Experience from AFAS indicates that the voluntary nature of the commitment and the dependence on GATS is not likely to lead to significant progress.
Box 2. ASEAN and AFAS
AFAS is a an agreement on trade cooperation in services signed by ASEAN members in 1995. The objective is to enhance cooperation in the services sector among ASEAN members by eliminating intraregional trade restrictions and expanding the scope of liberalization beyond GATS. AFAS has adopted a positive list approach. ASEAN members are required to list their horizontal (all sectors) and sector-specific national treatment and market access commitments in a schedule that specifies the conditions for entry and treatment of foreign service vis-à-vis domestic providers in these sectors. Although the commitments are expected to be binding once they are listed, they may be modified subject to certain rules. Three rounds of negotiations have been completed under AFAS, which produced common subsectors to be liberalized. At present, there are four packages of commitments involving various subsectors in seven sectors: financial services, air transport, telecommunication, tourism, business services, construction, and maritime transport. A number of areas under the Mutual Recognition Arrangements (MRAs), which enables the qualifications of professional services suppliers to be mutually recognized by signatory member countries, are also being negotiated. Critics argue that the progress of AFAS has been limited and the request-and-offer format has been ineffective. The commitments are generally partial, and it is difficult to find a subsector in which all countries make their common commitments. For example, one country may make commitments on banking but not insurance, while others have no commitments in either subsectors but make commitments in security brokerage and dealing. Several factors are contributing to the delay in AFAS. The current GATS-plus approach creates incentives for countries to wait for every GATS decision before making any commitments to AFAS. The ASEAN members that are signatories of GATS have been very cautious in committing to GATS-plus offers under AFAS and have made little progress in liberalizing trade in services. The voluntary nature of the approach allows a country to make no commitments in certain sectors. Different levels of economic development among members of ASEAN also create complications. Sources: ASEAN Secretariat and Rajan and Sen (2002a and 2002b).
Most agreements include investment liberalization, trade facilitation, and economic cooperation measures. Most agreements provide national treatment and legal and security protection for foreign investors from member countries. They also include protection against
- 25 -
the expropriation and nationalization of assets and a ban on performance-related investment restrictions. Most agreements include trade facilitation, such as harmonizing customs, standards and conformances, technical barriers, and sanitary and phytosanitary measures. For example, AFTA has a wide range of trade facilitation measures, including the ASEAN Agreement on Customs and ASEAN Customs Vision 2020, aimed at harmonizing and streamlining customs procedures among the ASEAN members. The CER includes measures to harmonize customs policies and procedures, in addition to harmonization of business laws, government procurement procedures, and industry assistance. Most regional trade arrangements include behind-border provisions, such as mutual recognition and harmonization of competition policy, laws, standards, conformances, and technical barriers. Some also include provisions on government procurement, intellectual property, e-commerce, transportation, and communications (see Table 7).

- 26 -
Tabl
e 7.
Pro
visi
ons B
eyon
d Ta
riff R
educ
tion,
Ser
vice
s Lib
eral
izat
ion,
and
Inve
stm
ent L
iber
aliz
atio
n: S
elec
ted
Asi
a-Pa
cific
PTA
s
AFT
A
AC
CEP
C
ER
Sing
apor
e-N
ew
Zeal
and
Sing
apor
e-A
ustra
lia
Sing
apor
e-U
nite
d St
ates
Si
ngap
ore-
Japa
n K
orea
-Chi
le
NA
FTA
Agr
icul
ture
Se
nsiti
ve li
st
Sim
ilar t
reat
men
t Si
mila
r tre
atm
ent
Sim
ilar t
reat
men
t Si
mila
r tre
atm
ent
Sim
ilar t
reat
men
t Ja
pan'
s exe
mpt
ion
list
Exem
ptio
n lis
t In
clud
ed
Qua
ntita
tive
rest
rictio
n El
imin
ated
El
imin
ated
El
imin
ated
El
imin
ated
El
imin
ated
G
radu
al e
limin
atio
n by
the
Uni
ted
Stat
esA
pply
WTO
co
nsis
tenc
y Pe
rmitt
ed fo
r som
e pr
oduc
ts
App
ly W
TO
cons
iste
ncy
Ant
idum
ping
N
o sp
ecifi
c pr
ovis
ion
No
spec
ific
prov
isio
n N
ot a
llow
ed
WTO
rule
+ so
me
chan
ges
WTO
rule
+ so
me
chan
ges
No
spec
ific
prov
isio
n A
pply
WTO
co
nsis
tenc
y A
pply
WTO
co
nsis
tenc
y Pe
rmitt
ed u
nder
sp
ecifi
c ru
le
Cou
nter
vaili
ng d
utie
s N
o sp
ecifi
c pr
ovis
ion
No
spec
ific
prov
isio
n A
pply
WTO
co
nsis
tenc
y A
pply
WTO
co
nsis
tenc
y
App
ly W
TO
cons
iste
ncy
No
spec
ific
prov
isio
n N
o sp
ecifi
c pr
ovis
ion
App
ly W
TO
cons
iste
ncy
Perm
itted
und
er
spec
ific
rule
Expo
rt/im
port
subs
idie
s N
o sp
ecifi
c pr
ovis
ion
No
spec
ific
prov
isio
n N
o ex
port
subs
idie
s al
low
ed
No
expo
rt su
bsid
ies a
llow
ed
No
expo
rt su
bsid
ies a
llow
ed
No
spec
ific
prov
isio
n Pe
rmitt
ed
No
spec
ific
prov
isio
n Pe
rmitt
ed, b
ut
very
rest
rictiv
e
Safe
guar
ds
No
safe
guar
ds
Perm
itted
und
er
spec
ific
rule
s N
o sa
fegu
ards
N
o sa
fegu
ards
N
o sa
fegu
ards
Te
mpo
rary
sa
fegu
ards
Te
mpo
rary
sa
fegu
ards
Pe
rmitt
ed u
nder
sp
ecifi
c ru
les
Perm
itted
und
er
spec
ific
rule
St
anda
rd a
nd c
onfo
rman
ces,
tech
nica
l bar
riers
, and
sa
nita
ry a
nd p
hyto
sani
tary
m
easu
res
Mut
ual r
ecog
nitio
n an
d ha
rmon
izat
ion
Mut
ual r
ecog
nitio
n an
d ha
rmon
izat
ion
Mut
ual r
ecog
nitio
n an
d ha
rmon
izat
ion
Mut
ual r
ecog
nitio
n an
d ha
rmon
izat
ion
Mut
ual r
ecog
nitio
n an
d ha
rmon
izat
ion
Mut
ual r
ecog
nitio
n an
d ha
rmon
izat
ion
Mut
ual r
ecog
nitio
n an
d ha
rmon
izat
ion
Mut
ual r
ecog
nitio
n an
d ha
rmon
izat
ion
Mut
ual
reco
gniti
on a
nd
harm
oniz
atio
n
Prov
isio
n fo
r cus
tom
s ha
rmon
izat
ion
Incl
uded
In
clud
ed
Incl
uded
In
clud
ed
Incl
uded
In
clud
ed
Incl
uded
In
clud
ed
Incl
uded
Rul
es o
n go
vern
men
t pr
ocur
emen
t N
o sp
ecifi
c pr
ovis
ion
No
spec
ific
prov
isio
n In
clud
ed
Incl
uded
In
clud
ed
Incl
uded
In
clud
ed
Incl
uded
In
clud
ed
Prov
isio
n to
faci
litat
e m
ovem
ent o
f per
son
and
la
bor m
obili
ty
Som
e pr
ovis
ions
, bu
t not
free
labo
r m
obili
ty
No
spec
ific
prov
isio
n R
elat
ivel
y fr
ee
labo
r mob
ility
So
me
prov
isio
ns,
but n
ot fr
ee la
bor
mob
ility
Som
e pr
ovis
ions
, bu
t not
free
labo
r m
obili
ty
Som
e pr
ovis
ions
, bu
t not
free
labo
r m
obili
ty
Som
e pr
ovis
ions
, bu
t not
free
labo
r m
obili
ty
Som
e pr
ovis
ions
, bu
t not
free
labo
r m
obili
ty
Som
e pr
ovis
ions
, bu
t not
free
labo
r m
obili
ty
Har
mon
izat
ion
of
com
petit
ion
polic
y an
d la
w N
o sp
ecifi
c pr
ovis
ion
No
spec
ific
prov
isio
n So
me
prov
isio
ns fo
r ha
rmon
izat
ion
Coo
pera
tion,
but
no
t har
mon
izat
ion
Coo
pera
tion,
but
no
t har
mon
izat
ion
Coo
pera
tion,
but
not
ha
rmon
izat
ion
Coo
pera
tion,
but
no
t har
mon
izat
ion
Coo
pera
tion,
but
no
t har
mon
izat
ion
Coo
pera
tion,
but
no
t har
mon
izat
ion
Inte
llect
ual p
rope
rty a
nd
e-co
mm
erce
Pr
omot
ing
coop
erat
ion
Pr
omot
ing
coop
erat
ion
So
me
prov
isio
ns in
pr
ogre
ss
Bin
ding
on
WTO
W
TO ru
le a
nd
addi
tiona
l pr
ovis
ion
Com
preh
ensi
ve
prov
isio
n C
oope
ratio
n in
pr
ogre
ss
Bin
ding
on
WTO
Ex
tens
ive
prov
isio
ns
Tran
spor
t and
co
mm
unic
atio
n Pr
omot
ing
coop
erat
ion
Pr
omot
ing
coop
erat
ion
G
ener
al p
rovi
sion
s un
der s
ervi
ces
No
spec
ific
prov
isio
n So
me
prov
isio
ns
on te
leco
m
Som
e pr
ovis
ions
on
tele
com
B
road
cast
ing
coop
erat
ion
Som
e pr
ovis
ions
on
tele
com
Ex
tens
ive
prov
isio
ns
Labo
r sta
ndar
ds
No
spec
ific
prov
isio
n N
o sp
ecifi
c pr
ovis
ion
No
spec
ific
prov
isio
n N
o sp
ecifi
c pr
ovis
ion
No
spec
ific
prov
isio
n Pr
ovis
ions
on
labo
r st
anda
rd
No
spec
ific
prov
isio
n N
o sp
ecifi
c pr
ovis
ion
Prov
isio
ns o
n la
bor s
tand
ards
D
ispu
te se
ttlem
ents
M
ainl
y co
nsul
tatio
ns
Con
sulta
tions
fo
llow
ed b
y pa
nel
arbi
tratio
n
Mai
nly
cons
ulta
tions
C
onsu
ltatio
ns
follo
wed
by
pane
l ar
bitra
tion
Con
sulta
tions
fo
llow
ed b
y pa
nel
arbi
tratio
n
Con
sulta
tions
fo
llow
ed b
y pa
nel
arbi
tratio
n
Con
sulta
tions
fo
llow
ed b
y pa
nel
arbi
tratio
n
Con
sulta
tions
fo
llow
ed b
y pa
nel
arbi
tratio
n
Con
sulta
tions
fo
llow
ed b
y pa
nel
arbi
tratio
n
Sour
ces:
Sco
llay
(200
3) a
nd re
spec
tive
free
trad
e ag
reem
ent d
ocum
ents
.
- 27 -
IV. ASSESSMENT OF PTAS
A. The Quality of PTAs
What are the determinants of successful PTAs? The literature has shown that preferential agreements that are most likely to produce benefits are those with the following characteristics24: (i) large and diverse membership; (ii) low external MFN tariffs; (iii) comprehensive coverage in terms of measures, sectors and products, with few exemptions;25 (iv) liberal rules of origin; and (v) inclusion of measures to facilitate trade and to promote cross-border competition. In addition, well-designed agreements also need to be supported by effective monitoring and enforcement mechanisms to ensure consistent implementation. Against these benchmarks, the scores of Asia-Pacific PTAs are mixed.26 Bilateral agreements, which have proliferated during the past three years are lacking a “large and diverse membership.” However, initiatives such as ASEAN+1 and ASEAN+3 perform better on this score. In terms of external tariffs, ASEAN6 (Brunei Darussalam, Indonesia, Malaysia, the Philippines, Singapore, and Thailand), for example, has a tendency to apply the preferential tariff reduction on MFN basis, and therefore to maintain relatively low MFN external tariffs. Many other countries, however, continue to maintain high MFN external tariffs. Some of the new bilateral agreements, for example, Singapore-Japan and Singapore-United States, have comprehensive policy coverage by including services, investments, and various behind-border measures. On the other hand, some other Asia-Pacific PTAs tend to be shallow as they focus mainly on free trade in goods and maintain a long list of exemptions. AFTA has low MFN tariff levels and liberal rules of origin but has delayed the inclusion of sensitive products in the scheme of tariff reduction. ASEAN+1 initiatives have followed the framework of AFTA in terms of progressive tariff reduction and liberal rules origin. But similar to AFTA, these new agreements maintain a long list of exemptions and show weak commitments beyond market access for goods. Many of these PTAs are somewhat flexible (agree first, negotiate later), and weak in terms of institutional arrangements (no enforcement, no supranational institution). The flexible nature of the agreements and the minimal effort to enforce implementation means that they may not be implemented consistently. However, a flexible approach seems to be preferred in Asia and the Pacific, considering the political and strategic objectives of these PTAs, the different level of economic development, cultural factors, and limited institutional capacity. 24 Best practice in designing PTAs have been reviewed in World Bank (2004).
25 GATT Article XXIV stipulates that “duties and other restrictive regulations ... are eliminated on substantially all trade.”
26 Australia-New Zealand CER is an example of an agreement that appears to meet the benchmarks, covering, for example, the free movement of most factors of productions including labor and the effective implementation of behind-border provisions.

- 28 -
Although many Asia-Pacific PTAs follow a simple format and a flexible approach, there are cases where implementation actually exceeds commitments. For example, AFTA was originally designed as a free trade area based on tariff reductions. Because both tariff reduction and the rules of origin were written in a simple format with a clear timeframe, the negotiating parties felt no need for a formal institutional setup to support implementation. In addition, many AFTA members have applied their “preferential” tariff reductions on an MFN basis, which indicates that the implementation exceeds commitments under the original agreement.
B. The Effects of PTAs
This section explores the effects of Asia-Pacific PTAs by discussing some factors that matter in determining outcomes. This section, however, does not intend to present the estimates the potential welfare effects of these PTAs.27 A vast literature has shown that the welfare effect of a preferential arrangement is theoretically unknown and this paper does not intend to retrace this literature.28 It is also difficult to measure the effects simply because most of the PTAs are very recent, being negotiated, and not fully implemented. Since most of these PTAs follow a gradual process of negotiation and implementation, this section provides some general considerations or factors that matter in determining the impact of these PTAs in the future. However, before turning to the effects of the PTAs, it is useful to note that the Asia-Pacific region has benefited from unilateral and multilateral trade liberalization.
• The Asia-Pacific region has been integrating vigorously in the absence of PTAs.
Many countries in the region have unilaterally lowered their border barriers, which led to rapid growth of both extra- and intra-regional trade for the last three decades. Ng and Yeats (2003), for example, indicate that East Asia’s share of global exports expanded more than three-folds, while intraregional exports, expressed as share of world trade, expanded more than six-fold during 1975–2001.
27 Most PTAs are developed based on some empirical studies commissioned by the members of the PTAs, which generally suggest positive welfare gains. However, the results of these studies should be interpreted carefully due to the following factors. First, the welfare gains for members are partly at the expense of nonmembers. Second, the empirical estimates depend on the specification of the model and the scenarios of liberalization, and so the results, for example the absolute monetary value of welfare gains or losses, should be treated with caution. Third, most liberalization scenarios could not capture the provisions on nontariff barriers, services, investments, and behind-border measures. Fourth, the studies generally omit the list of exemptions, which could be lengthy in many PTAs. Fifth, it is unrealistic to estimate the effects of one PTA in isolation of others, while in fact many PTAs are implemented at the same time. 28 One classic argument is related to the trade and investment diversion effect, in which trade and investment may be diverted from the most efficient sources that are not members. Therefore, trade and investment creation does not necessarily lead to a positive overall outcome. It can also be shown analytically that while the total welfare of all members may increase, partly at the expense of nonmembers, there is no guarantee that the net welfare of each member will increase. Panagariya (2000) provides extensive surveys on theoretical aspects of preferential trade liberalization. Krueger (1999) presents the debate on the merits of PTAs.
- 29 -
• Based on a Trade Intensity Index (TII), various studies indicate that flows in the Asia-Pacific region in the 1990s were not biased towards intrabloc trade, possibly reflecting limited trade diversion.29 While Asia-Pacific intraregional trade has increased rapidly for the last few decades, intrabloc trade intensity has in fact declined because the Asia-Pacific share in world trade has increased even faster. Also, TIIs in Asia-Pacific PTAs are generally lower than those in Central and Latin America.30 This finding supports the notion that many Asian countries have maintained their outward trade orientation, despite their participation in various PTAs. These studies also show that the index—and thus the prima facie evidence of trade diversion—is generally lower in trade agreements with a large and diverse membership such as APEC (see Table 8).
• Studies of trade liberalization in the Asia-Pacific region suggest that the gains of MFN-based liberalization have been far greater than those of preferential liberalizations. For example, Young and Huff (1997), Gilbert, Scollay, and Bora (2001), and Scollay and Gilbert (2001) show that the welfare gains from APEC are large because the tariff reductions are significant and the liberalization is conducted on an MFN basis. Feridhanusetyawan and Pangestu (2003) also show that the gains from AFTA would have been much larger if trade liberalization were conducted on an MFN basis.
What is the potential value added of the recent proliferation of PTAs? One source of potential value added is the inclusion of sensitive sectors and the provisions on services, investment, and trade facilitation. Some PTAs, such as ASEAN-China CEC, include agriculture, and consistent implementation of these agreements could create a momentum for further agricultural liberalization in the Asia-Pacific region. Most PTAs include provisions on services, investment, and trade facilitation, although the provisions generally lack specifics and a time table for implementation. In this regard, it remains unclear whether the commitments to liberalize services and investment and to strengthen trade facilitation are strong. Previous experience, such as the implementation of AFAS, shows that services liberalization has progressed only slowly.
29 The TII measures the importance of intraregional trade relative to the importance of the region in world trade. The increase in intra-bloc TII indicates regional bias in trade as trade flows have been diverted towards intra-bloc trade, which would lead to a negative welfare effect if the members of the RTAs are not the most efficient producers. Anderson and Norheim (1993) formally define TII as Iij = xij /mj ; where xij is the share of country I’s exports towards region J, and mj is the share of region J in world imports, net of country I’s trade. If the trade flows are not geographically biased, the index has the value of unity. If trade flows are concentrated within a certain region, the TII of this region would be greater than one. 30 Ng and Yeats (2003) also indicate that “re-orientation” of trade toward intrabloc trade is weaker in East Asian RTAs than in Mercosur.

- 30 -
Table 8. Intra-Regional Trade Intensity Index of Selected PTAs
ADB (2002) Schiff and Winters (2003) Frankel (1997) Year TII Year TII Year TII AFTA 1980-84 4.2 1991 3.8 1990 4.7 2000 4.0 1996 2.8 1994 4.3 APEC 1980-84 1.6 1980 1.9 2000 1.6 1994 1.7 SAFTA 1980-84 4.1 2000 4.1 Andean Pact 1980-84 3.6 1990 6.8 1985 5.5 2000 16.6 1996 15.6 1994 15.8 NAFTA 1980-84 1.8 1985 2.7 2000 2.2 1994 3.1 Mercosur 1980-84 5.6 1990 10.5 1985 6.4 2000 14.3 1996 14.1 1994 17.1 Source: ADB (2002), Schiff and Winters (2003), Frankel (1997)
Note: Intra regional trade intensity index = the ratio between the share of intraregional trade and the share of the region in world total trade.
Another potential value added is the possibility that the PTAs could spur another round of MFN trade liberalizations in the Asia-Pacific region. Although MFN tariff rates in Asia and the Pacific have declined rapidly during the past two decades, they remain high in some countries. The use of nontariff barriers also continues to be extensive and non-transparent. The experience of AFTA shows that preferential tariff reductions could become a step towards MFN-based liberalization. Nevertheless, although these PTAs may offer some potential benefits, there are various factors that could undermine their potential. The proliferation of Asia Pacific PTAs increases the bias toward intraregional trade and raises the risk of trade diversion, especially because the MFN tariff rates in some countries are high and strongly dispersed. The recent proliferation could increase intraregional trade intensity as a result of trade diversion.31 The level of MFN tariffs in many participants of preferential agreements, such as China, Thailand, the ASEAN4, and South Asian countries,
31 To illustrate the possible effect of trade diversion Schiff and Winters (2003), for example show that intra-bloc trade intensities have increased in six out of nine PTAs under observation, while extra-bloc trade intensities have declined in seven of the nine.

- 31 -
remains relatively high. Unless the preferential agreement creates momentum to reduce MFN tariffs, the risk of trade diversion remains significant. Administrative complications could severely diminish any potential benefits of PTAs and further accentuate trade diversion. What was initially billed as a pragmatic approach to liberalization could lead in practice to serious administrative complications. Because various bilateral agreements are being negotiated within and across regional agreements, one country may negotiate with another within different framework agreements simultaneously.32 A particularly important problem is the possible emergence of overlapping and inconsistent rules of origin in the region over the next decade. Compliance with differing rules of origin could be costly and increase the risk of trade diversion, especially when the institutional capacity to implement these rules is limited. Preferential agreements could potentially inhibit the processes of cross-border production networking which has been central to the region’s successful integration. One important feature of industrial development in the Asia-Pacific region has been the process of cross-border production networking, in which intermediate inputs are imported from various countries before being assembled into a final product in one country and then exported to another. Uncoordinated proliferation may lead to inconsistent provisions between PTAs, especially on the rules of origin, which could hamper the process of production networking across countries. While the initial APEC framework appears to have promoted unilateral and multilateral liberalization, it is far less certain that the current crop of PTAs will have the same effect. Although many Asia-Pacific PTAs claim to offer “WTO-plus” commitments, they also maintain exemptions and specific treatments for sensitive sectors, which can actually result in “WTO-minus” commitments. These exemptions may create a bad precedent, because exemptions in one agreement could carry over to other agreements. All PTAs claim to be WTO-consistent, even though there is no effective mechanism to confirm whether a regional trade agreement is consistent with WTO principles.33 Institutional capacity that should be used to resolve problems in multilateral trade negotiations has been diverted to manage bilateral and regional agreements. All of these suggest that the contribution of Asia-Pacific PTAs in promoting multilateral liberalization remains unclear.
32 For example, the different ASEAN+1 initiatives have been developed independently and under different framework agreements. At the same time, individual members of ASEAN are also negotiating bilateral agreements with ASEAN partners separately.
33 The WTO rules on preferential agreements are weak because of the imprecision and ambiguity of GATT Article XXIV and GATS Article V.

- 32 -
V. CONCLUSION
The proliferation of PTAs in the Asia-Pacific region will lead to a complex web of intersecting bilateral and regional trade agreements in the near future. More than 45 new PTAs may be established within a decade, with many bilateral agreements developed within and across different regional agreements. One country may negotiate with another under different and unrelated framework agreements. Many of these regional initiatives involve ASEAN countries, individually or as a group, so that ASEAN is expected to play an important role in the network of PTAs. The Asia-Pacific region has benefited from multilateral liberalization in the past, but the recent proliferation of PTAs reflects the surge of interest in regionalism. Multilateral and unilateral trade liberalization has resulted in a relatively open trade regime and a rapid process of trade integration in the region for the last two decades. However, the delay in multilateral trade negotiations, the failure of APEC in implementing EVSL, the Asian financial crisis, and some strategic and political considerations contributed to a surge of regionalism in the late 1990s. The provisions of Asia-Pacific PTAs vary extensively. Tariff reduction schemes vary between PTAs and between countries, and there tend to be exemptions for certain sectors and certain countries. The agreements tend to be loosely formulated and lack detail in order to accommodate various interests of the members. These PTAs also vary extensively in terms of the institutional arrangements for negotiations, and they have no supranational institution to monitor implementation and to settle disputes. Most Asia-Pacific PTAs envisage going well beyond tariff reduction in goods trade, but the degree of liberalization varies. Most PTAs have commitments to eliminate nontariff barriers and to liberalize agriculture. They also include provisions on services, but in most cases the pledge is to bind commitments in the GATS. The provisions on investment liberalization, trade facilitation, and other behind-border measures appear to be shallow and lack specifics. Asia-Pacific PTAs offer potential gains, although the realization of these gains depends on the commitment to liberalize sensitive sectors, to maintain consistent provisions, and to enforce agreements. The welfare gains are likely to come from the possibility that these PTAs may spur another round of MFN trade liberalization in the Asia-Pacific region and from the inclusion of agriculture, services, trade facilitation, and other behind-border measures in the agreements. However, the realization of these gains depends on the design of the agreements and the quality of implementation. Unless countries liberalize sensitive sectors, such as agriculture and services, many of the potential benefits will not materialize. The quality of implementation also depends on institutional coordination among PTAs to ensure consistent provisions. The development of an effective mechanism to enforce the agreements is also crucial. There are various factors that could undermine the potential gains. The risk of trade diversion remains high because the MFN tariff rates are dispersed and remain high in some countries.

- 33 -
Administrative complications, including the possible emergence of overlapping and inconsistent rules of origin, could hamper implementation and inhibit the deepening of cross-border production networks in the Asia-Pacific region. Finally, the focus on PTAs may divert energy from the Doha Round and create new constituencies opposing multilateral liberalization.
- 34 - APPENDIX I
I. Asia Pacific Economic Cooperation (APEC) Asia Pacific Economic Cooperation (APEC) began as an informal dialogue group in 1989 and has become the forum for facilitating economic growth, cooperation, trade, and investment in the Asia-Pacific region. The Bogor Goal of APEC to form free and open trade and investment in the region by 2010 for developed countries and 2020 for developing countries was established in Bogor, Indonesia, in 1994. APEC currently has 21 member economies. The word “economies” is used to describe the membership because the cooperation is predominantly in trade and economic issues, with members interacting as economic entities. Member economies are Australia, Brunei Darussalam, Canada, Chile, People's Republic of China, Hong Kong SAR, Indonesia, Japan, Republic of Korea, Malaysia, Mexico, New Zealand, Papua New Guinea, Peru, the Republic of the Philippines, the Russian Federation, Singapore, Taiwan Province of China, Thailand, the United States of America, and Vietnam. In 2001, the member economies accounted for more than 2.5 billion people, a combined gross domestic product of 19 trillion U.S. dollars, and 47 percent of world trade. APEC works in three broad areas (the three pillars of APEC) to meet the Bogor Goal: trade and investment liberalization, business facilitation, and economic and technical cooperation. APEC member economies follow the strategic roadmap called the Osaka Action Agenda, which consists of the following basic principles:
1. Comprehensiveness: APEC addresses all impediments to achieving the long-term goal of free and open trade.
2. WTO consistency: Measures undertaken in the context of the APEC Action
Agenda are consistent with the principles of the WTO. 3. Comparability: APEC member economies endeavor to have comparable trade and
investment liberalization and facilitation, taking into account the general levels achieved by each APEC economy.
4. Nondiscrimination: Reductions in barriers to trade achieved through APEC are
available to all APEC member economies and non APEC economies. 5. Transparency: The laws, regulations, and administrative procedures in all APEC
member economies that affect the flow of goods, services, and capital among APEC member economies are transparent.
6. Standstill: APEC member economies do not take measures that increase levels of
protection. 7. Simultaneous start, continuous process, and differentiated timetables: APEC
member economies simultaneously began the process of liberalization, facilitation, and cooperation and continuously contribute to the long-term goal
- 35 - APPENDIX I
of free and open trade and investment. 8. Flexibility: APEC member economies deal with the liberalization and facilitation
process in a flexible manner, taking into account differing levels of economic development.
9. Cooperation: Economic and technical cooperation contributing to liberalization and
facilitation is actively pursued.
APEC operates based on nonbinding commitments, open dialogue, and equal respect for the views of participants. In line with the concept of concerted unilateral liberalization, APEC member economies undertake trade and investment liberalization on a voluntary and nonbinding basis. The member reports progress toward achieving free and open trade and investment goals through Individual Action Plans and Collective Action Plans, submitted to APEC annually. Decisions made within APEC are reached by consensus, and commitments are undertaken on a voluntary basis. Each year, several APEC member economies volunteer to have their Individual Action Plans reviewed. Known as Peer Reviews, this process involves a formal review team considering each volunteer economy's individual action plan. Experts conducting independent in-country research and analysis and the independent private sector body, the APEC Business Advisory Council, are also part of the process.
Unlike other trade arrangements in the region that created an exclusive bloc for its members, trade liberalization in APEC is conducted on an MFN basis and is viewed as a vehicle to support multilateral trade liberalization. The Bogor Goal is to be achieved through a spirit of open regionalism based on nondiscrimination, and it is intended to strengthen the multilateral trading system. The principle of concerted unilateral liberalization means that APEC members realized that the benefit of trade and investment liberalization would come mainly from their own liberalization and that the gain would increase significantly if trading partners liberalized at the same time. Because trade and investment liberalization requires the development of human and institutional capacity, business facilitation and economic and technical cooperation are also included in the program.
APEC has played an important role in creating pressure for trade liberalization in the region, especially in the mid–1990s. Tariff reduction through the IAP was generally more progressive than the commitment given to the WTO by APEC members. Tariffs declined significantly, and the region was apparently on track toward the Bogor Goal. APEC’s support for multilateralism was clear, and there little interest in regionalism and bilateralism in the region before 1998. But critics have said that the voluntary nature of APEC has created problems that became apparent in the late 1990s. The failure of APEC’s Early Voluntary Sector Liberalization initiative in 1998 and the proliferation of preferential trading agreements in the region in recent years cast some doubt on the relevance and effectiveness of APEC in maintaining the spirit of open regionalism.
Source: Taken mainly from APEC Secretariat (http://www.apecsec.org.sg)
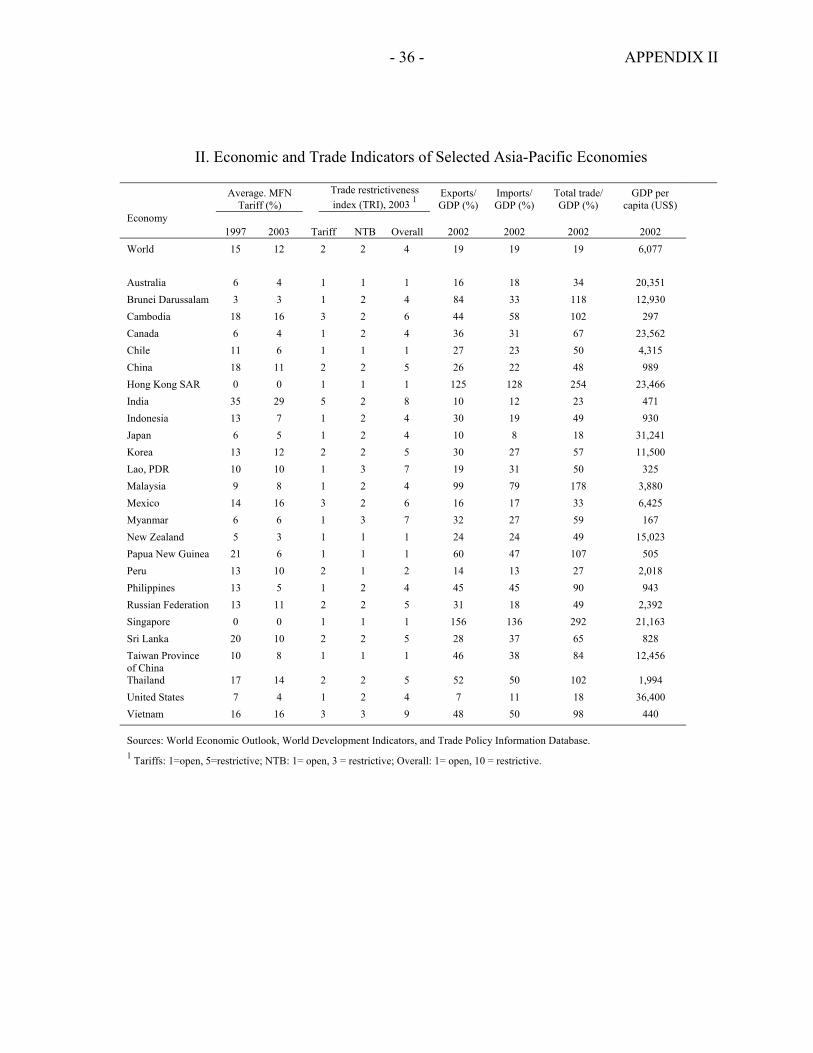
- 36 - APPENDIX II
II. Economic and Trade Indicators of Selected Asia-Pacific Economies
Average. MFN
Tariff (%) Trade restrictiveness
index (TRI), 2003 1 Exports/ GDP (%)
Imports/GDP (%)
Total trade/ GDP (%)
GDP per capita (US$)
Economy 1997 2003 Tariff NTB Overall 2002 2002 2002 2002
World 15 12 2 2 4 19 19 19 6,077
Australia 6 4 1 1 1 16 18 34 20,351 Brunei Darussalam 3 3 1 2 4 84 33 118 12,930 Cambodia 18 16 3 2 6 44 58 102 297 Canada 6 4 1 2 4 36 31 67 23,562 Chile 11 6 1 1 1 27 23 50 4,315 China 18 11 2 2 5 26 22 48 989 Hong Kong SAR 0 0 1 1 1 125 128 254 23,466 India 35 29 5 2 8 10 12 23 471 Indonesia 13 7 1 2 4 30 19 49 930 Japan 6 5 1 2 4 10 8 18 31,241 Korea 13 12 2 2 5 30 27 57 11,500 Lao, PDR 10 10 1 3 7 19 31 50 325 Malaysia 9 8 1 2 4 99 79 178 3,880 Mexico 14 16 3 2 6 16 17 33 6,425 Myanmar 6 6 1 3 7 32 27 59 167 New Zealand 5 3 1 1 1 24 24 49 15,023 Papua New Guinea 21 6 1 1 1 60 47 107 505 Peru 13 10 2 1 2 14 13 27 2,018 Philippines 13 5 1 2 4 45 45 90 943 Russian Federation 13 11 2 2 5 31 18 49 2,392 Singapore 0 0 1 1 1 156 136 292 21,163 Sri Lanka 20 10 2 2 5 28 37 65 828 Taiwan Province of China
10 8 1 1 1 46 38 84 12,456
Thailand 17 14 2 2 5 52 50 102 1,994 United States 7 4 1 2 4 7 11 18 36,400 Vietnam 16 16 3 3 9 48 50 98 440
Sources: World Economic Outlook, World Development Indicators, and Trade Policy Information Database. 1 Tariffs: 1=open, 5=restrictive; NTB: 1= open, 3 = restrictive; Overall: 1= open, 10 = restrictive.

- 37 -
References Anderson, Kym and Hege Norheim, 1993, “History, Geography and Regional Economic
Integration,” CEPR Discussion Paper No. 795, June 1993 (London: Centre for Economic Policy Research).
Asian Development Bank (ADB), 2002, Asian Development Outlook 2002 (Manila: Asian
Development Bank). Bhagwati, Jagdish, 1995, “U.S. Trade Policy: The Infatuation with Free Trade Areas,” in The
Dangerous Drift to Preferential Trade Agreements, ed. by Jagdish Bhagwati and Anne O Krueger (Washington: American Enterprise Institute for Public Policy Research).
Bhagwati, Jagdish, D. Greenaway, and A. Panagariya, 1998, “Trading Preferentially: Theory
and Policy,” Economic Journal, Vol. 108, pp. 1128–48. Bergsten, C. F., 2000, “Towards a Tripartite World,” The Economist (July 15) pp. 23-25. ——, 2001, “America’s Two-Front Economic Conflict,” Foreign Affairs (March/April),
pp. 16–28. Bora, Bijit, and Mari Pangestu, eds., 1996, Priority Issues in Trade and Investment
Liberalisation: Implications for the Asia Pacific Region (Singapore: Pacific Economic Cooperation Council).
Gilbert, John, Robert Scollay, and Bijit Bora, 2001, “Assessing Regional Trade
Arrangements in the Asia-Pacific,” Policy Issues in International Trade and Commodities Study Series No. 15 (Geneva: United Nations Conference on Trade and Development).
Feridhanusetyawan, Tubagus, and Mari Pangestu, 2003, “Indonesian Trade Liberalization:
Estimating the Gains.” Bulletin of Indonesian Economic Studies, Vol. 39, No 1 (April), pp. 51–74.
Frankel, Jeffrey A., 1997, Regional Trade Block in the World Economic System
(Washington: Institute of International Economics). Institute of Developing Economies (IDE), 2000, Towards Closer Japan-Korea Economic
Relations in the 21st Century: Summary Report (Tokyo: IDE). Kihwan, Kim, 2002, “New Trends Towards Preferential Trade Arrangements in East Asia:
An Unmixed Blessing?” Asia Perspectives Vol. 5, No. 1, pp 11–14.

- 38 -
Krueger, Anne O., 1999, “Are Preferential Trading Arrangements Trade-Liberalizing or Protectionist?” Journal of Economic Perspectives (U.S.), Vol. 13, No. 4, pp. 105–24.
Krumm, Kathie, and Homi Kharas, eds., 2004, East Asia Integrates: A Trade Policy Agenda for Shared Growth (Washington: World Bank and Oxford University Press).
Ng, Francis, and Alexander Yeats, 2003, “Major Trade Trends in East Asia: What are their
Implications for Regional Cooperation and Growth?” Policy Research Working Paper No. 3084 (Washington: World Bank).
Pacific Economic Cooperation Council (PECC), 1996, Perspective on the Manila Action
Plan for APEC (Manila: PECC). ——, 1999, Assessing APEC Individual Action Plans and Their Contribution to APEC’s
Goal (Auckland: PECC). Panagariya, Arvind, 2000, “Preferential Trade Liberalization: The Traditional Theory and
New Development,” Journal of Economic Literature, Vol. 37, No. 2, pp. 123–345. Pangestu, Mari, and Sudarshan Gooptu, 2004, “New Regionalism: Options for East Asia,” in
East Asia Integrates: A Trade Policy Agenda for Shared Growth, ed. by Kathie Krumm and Homi Kharas (Washington: World Bank and Oxford University Press).
Rajan, Ramkishen S., and Rahul Sen, 2002a, “Liberalization of International Trade in
Financial Services in Southeast Asia: Indonesia, Thailand, Philippines and Thailand,” Centre for International Economic Studies (CIES) Working Paper No. 0217 (University of Adelaide).
——, 2002b, “Liberalization of Financial Services in Southeast Asia under the ASEAN
Framework Agreement on Services (AFAS),” Centre for International Economic Studies (CIES) Discussion Paper No. 0226 (University of Adelaide).
Schiff, Maurice, and L. Alan Winters, 2003, Regional Integration and Development
(Washington: World Bank and Oxford University Press). Scollay, Robert, 2001, “The Changing Outlook for Asia-Pacific Regionalism,” World
Economy (U.K.), Vol. 24 (9), pp. 1135–60.
——, 2003, “RTA Developments in the Asia Pacific Region: State of Play,” paper presented at the Trade Policy Forum, Phuket, Thailand, May. Available via the internet: http://www.pecc.org
Scollay, Robert, and John Gilbert, 2001, New Regional Trading Arrangements in the Asia-Pacific? (Washington: Institute for International Economics).

- 39 -
Soesastro, Hadi, 2003, “Dynamics of Competitive Liberalization in RTA Negotiations: East Asian Perspective,” paper presented at PECC-LAEBA Conference on Regional Trade agreement in Comparative Perspective, Washington, D.C., April. Available via the internet: http://www.pecc.org
World Bank, 2004, Global Economic Prospects 2005: Trade, Regionalism, and Development. (Washington: World Bank).
Yamazawa, Ippei, 2001, “Assessing a Japan-Korea Free Trade Agreement,” The Developing Economies, Vol. 39, No. 1 (March), pp. 3–48.
Young, Linda, and Karen M. Huff, 1997, “Free Trade in the Pacific Rim: On What Basis?” in Global Trade Analysis: Modeling and Applications, ed. by Thomas W. Hertel (New York: Cambridge University Press), pp. 235–52.