Preference Checklists: An Effective, Selective Choice Architecture · PDF file ·...
25
Preference Checklists: An Effective, Selective Choice Architecture Insert Subhead Here Eric Johnson (Columbia Business School/CFPB) TIAA-CREF Institute, 2016 [email protected] With Kirstin Appelt (Columbia Business School), Melissa Knoll| CFPB, & Jonathan Westfall (Delta State University) Disclaimer: The views expressed are those of the speaker and do not necessarily reflect those of the Consumer Financial Protection Bureau or the United States.
Transcript of Preference Checklists: An Effective, Selective Choice Architecture · PDF file ·...

Preference Checklists: An Effective,
Selective Choice Architecture
Insert Subhead Here
Eric Johnson (Columbia Business School/CFPB)
TIAA-CREF Institute, 2016
With Kirstin Appelt (Columbia Business School), Melissa Knoll| CFPB, & Jonathan
Westfall (Delta State University)
Disclaimer: The views expressed are those of the speaker and do
not necessarily reflect those of the Consumer Financial
Protection Bureau or the United States.

Nudges as blunt tools
● Nudges affect both people who would be helped by a
change AND those who could be harmed
● First-generation nudges focus largely on changes in means
– What is the average impact?
● We will focus on heterogeneity
– Who is helped and by how much?
– Who is harmed and by how much?
● Preference checklists as an effective and selective tool to
improve choice
0%
20%
40%
60%
80%
100%
120%
140%
62 63 64 65 66 67 68 69 70
Age you choose to start collecting benefits
Siz
e o
f m
on
thly
be
ne
fits
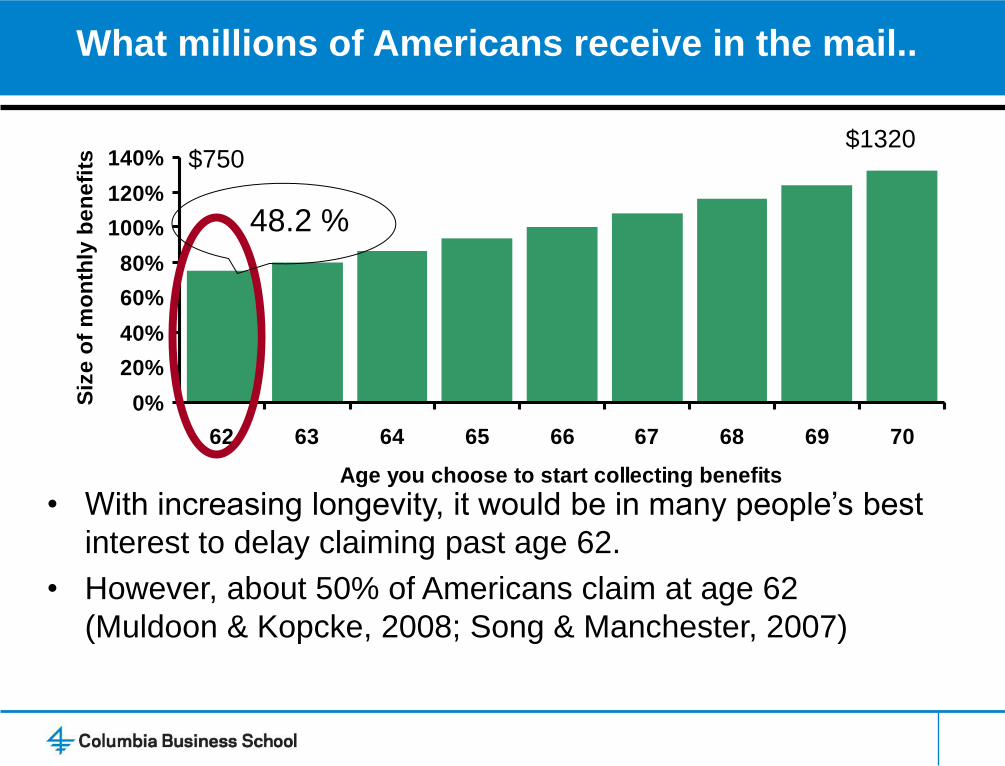
• With increasing longevity, it would be in many people’s best
interest to delay claiming past age 62.
• However, about 50% of Americans claim at age 62
(Muldoon & Kopcke, 2008; Song & Manchester, 2007)
What millions of Americans receive in the mail..
48.2 %
$750 $1320

Why early claiming?
● Present bias?
– When people consider claiming, they think about claiming as soon
as possible
– Focus on immediate consequences/suppress consideration of long-
term consequences
– If we can “frame the future first” we may overcome present bias and
improve decisions (e.g., Weber et al., 2007)
● Previous work shows changing order of thoughts changes claiming preferences
Knoll, M. A. Z., Appelt, K. C., Johnson, E. J., & Westfall, J. E. (2015). Time to retire:
Why Americans claim benefits early and how to encourage delay. Behavioral
Science and Policy, 1(1), 53-62.

5
What are Preference Checklists?
● Lists of choice-relevant factors consumers might want to consider, but often
do not
Early Claiming Later Claiming

Are Checklists Effective and Selective?
● Effective
– Study 1: Replicate previous findings using more user-friendly and
implementable approach
– Study 2: Understand mechanism underlying efficacy of checklists
(hint: accessibility)
● Selective
– Study 3: Evaluate if checklists nudge the right people in the right
direction
• Compare to traditional nudge (default)
• Account for person-specific factors (life expectancy)
• Minimize errors, not just shift the mean
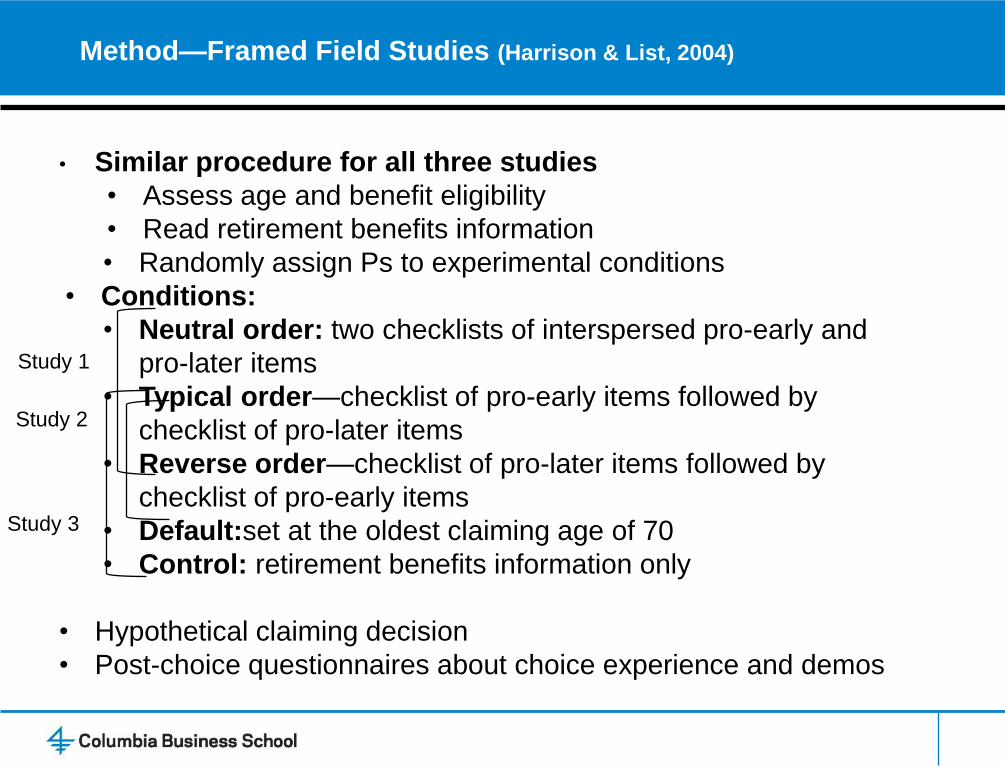
Method—Framed Field Studies (Harrison & List, 2004)
• Similar procedure for all three studies
• Assess age and benefit eligibility
• Read retirement benefits information
• Randomly assign Ps to experimental conditions
• Conditions:
• Neutral order: two checklists of interspersed pro-early and
pro-later items
• Typical order—checklist of pro-early items followed by
checklist of pro-later items
• Reverse order—checklist of pro-later items followed by
checklist of pro-early items
• Default:set at the oldest claiming age of 70
• Control: retirement benefits information only
• Hypothetical claiming decision
• Post-choice questionnaires about choice experience and demos
Study 3
Study 1
Study 2

Study 1
● 309 older Americans (ages 45-70) who are already eligible or expect to become eligible for SS retirement benefits
● Checklist items clustered into two sets of eight reasons each – Typical order—pro-early items then pro-later items
– Reverse order—pro-later items then pro-early items
– Neutral order—pro-early and pro-later items interspersed
● Is this something you would consider when making the
claiming decision? “Yes, No, I don’t know”

Study 1: Checklist order affects choice
● Considering pro-later list before pro-early list delays preferred claiming age by,
on average, 13.6 months
● Neutral condition does not impact claiming age, ruling out simple reminder
explanation
● Checklists are effective at encouraging delay
p > .05
*p < .01
65.57 66.17
66.70
62
63
64
65
66
67
68
69
70
Early-First Checklist Neutral-OrderChecklist
Later-First Checklist
Pre
ferr
ed
Cla
imin
g A
ge

Study 2
● Checklists influence choice by manipulating accessibility of claiming-related thoughts
● 398 older Americans (ages 45-70) who are already eligible or expect to become eligible for SS benefits
● Same as Study 1, but eliminate neutral checklist condition
● Present each checklist item one at a time to measure reaction times (accessibility)

Study 2: Accessibility explains effectiveness
● Reasons in first checklist more accessible than reasons in second checklist
• First checklist: M = 63.51 seconds
• Second checklist: M = 77.81 seconds
● Difference in response times fully mediates relationship between order and claiming
age, p = .04
● Ps presented with checklists in reverse order respond more quickly to thoughts
favoring later claiming and this leads to preference for later claiming
*p = .04
Pre
ferr
ed
Cla
imin
g A
ge
65.28
66.70
62
63
64
65
66
67
68
69
70
Early-First Checklist Later-First Checklist
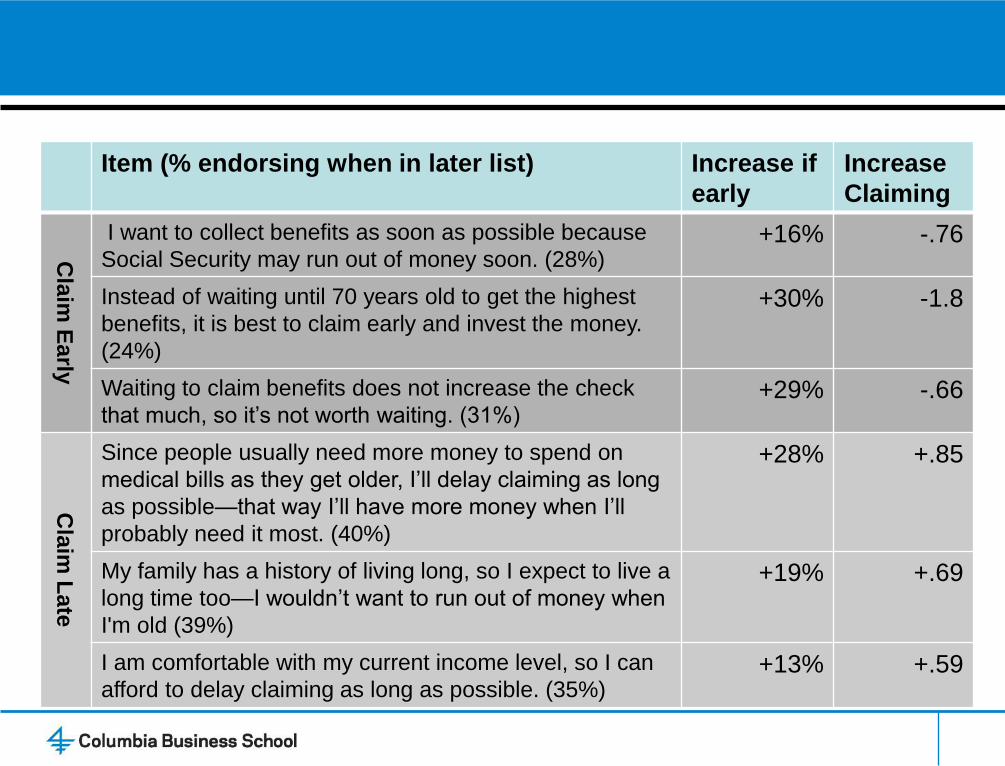
Item (% endorsing when in later list) Increase if
early
Increase
Claiming
Cla
im E
arly
I want to collect benefits as soon as possible because
Social Security may run out of money soon. (28%) +16% -.76
Instead of waiting until 70 years old to get the highest
benefits, it is best to claim early and invest the money.
(24%)
+30% -1.8
Waiting to claim benefits does not increase the check
that much, so it’s not worth waiting. (31%) +29% -.66
Cla
im L
ate
Since people usually need more money to spend on
medical bills as they get older, I’ll delay claiming as long
as possible—that way I’ll have more money when I’ll
probably need it most. (40%)
+28% +.85
My family has a history of living long, so I expect to live a
long time too—I wouldn’t want to run out of money when
I'm old (39%)
+19% +.69
I am comfortable with my current income level, so I can
afford to delay claiming as long as possible. (35%) +13% +.59

Study 3
● Although majority of Americans should delay claiming to maximize benefits
(Burtless & Quinn, 2002; Coile, Diamond, Gruber, & Jousten, 2002), optimal claiming
age depends on personal factors
– Longevity
– Income
– Retirement savings
– Job satisfaction and security
● The longer an individual is expected to live, the later she should claim
benefits (up to age 70)
– Focus on the ideal claiming age based on expected longevity
– Life expectancy calculator

Study 3
● Are checklists effective and selective?
● Compare checklists to a standard nudge—default set at 70
● 451 older Americans aged 45-65 who are already eligible or expect
to become eligible for SS benefits
● After retirement choice, 3 questionnaires:
– Choice experience confidence, difficulty, control, satisfaction
– Expanded demographics to calculate LE age, gender, marital status,
race, cigarette use, seatbelt use, annual car mileage, exercise
– Other claiming-related factors retirement savings, perceived longevity
risk, perceived current health, job satisfaction, perceived job security

Study 3: Checklists more effective than defaults
● Compared to standard benefits information and a popular nudge (i.e., default), considering the
future first is more effective at encouraging later claiming
F(3, 447) = 7.92, p < .001, ηp2 = .05
66.21
66.95
66.29
67.78
62
63
64
65
66
67
68
69
70
Control Default Early-First Checklist Later-First Checklist
Pre
ferr
ed
Cla
imin
g A
ge
** **
* **p < .001
* p = .02
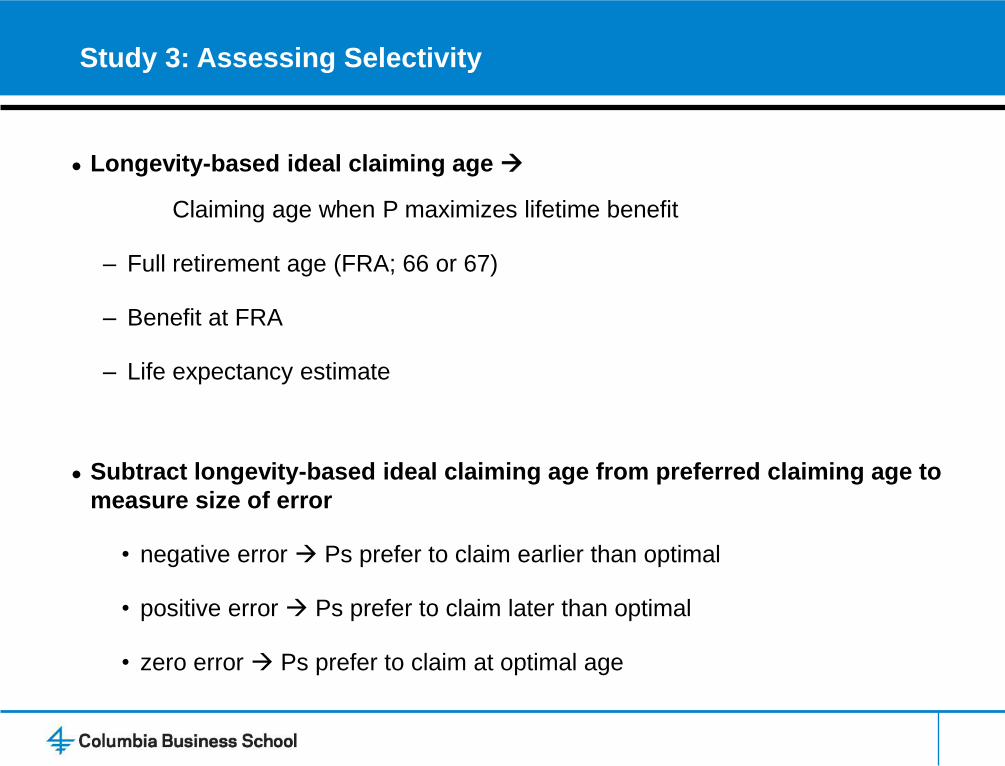
Study 3: Assessing Selectivity
● Longevity-based ideal claiming age
Claiming age when P maximizes lifetime benefit
– Full retirement age (FRA; 66 or 67)
– Benefit at FRA
– Life expectancy estimate
● Subtract longevity-based ideal claiming age from preferred claiming age to
measure size of error
• negative error Ps prefer to claim earlier than optimal
• positive error Ps prefer to claim later than optimal
• zero error Ps prefer to claim at optimal age
-1.85
-1.07
-1.88
-0.33
(8.00)
(6.00)
(4.00)
(2.00)
0.00
2.00
4.00
6.00
8.00
Control Default Early-First Checklist Later-First Checklist
Av
era
ge C
laim
ing
Err
or
in Y
ears
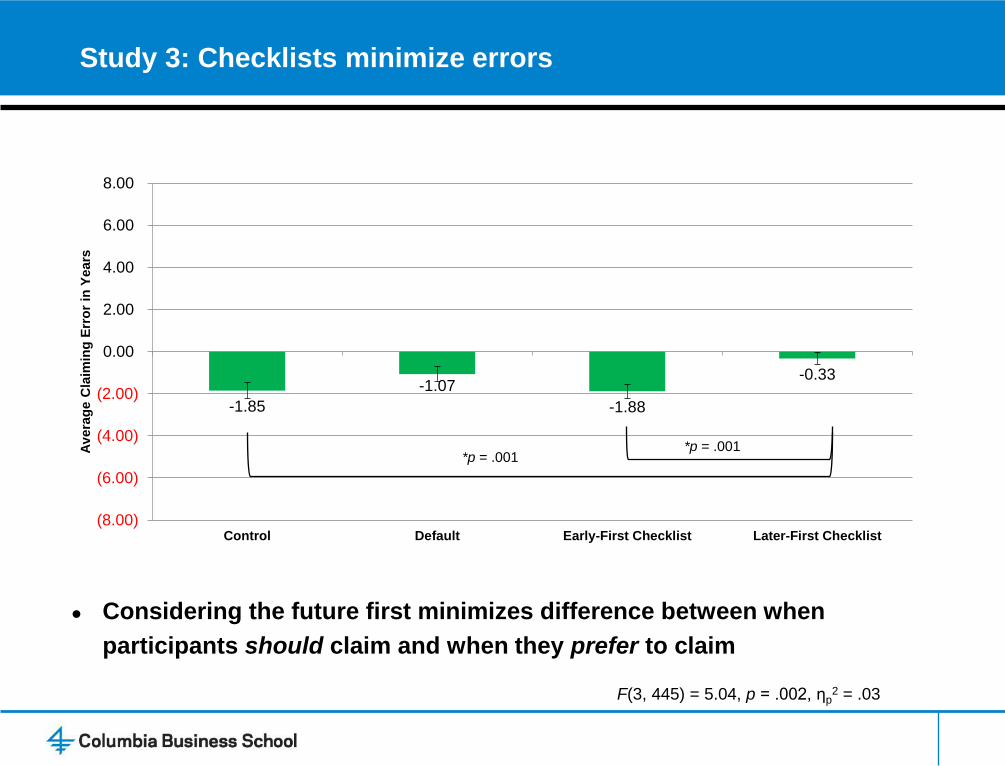
Study 3: Checklists minimize errors
F(3, 445) = 5.04, p = .002, ηp2 = .03
*p = .001 *p = .001
● Considering the future first minimizes difference between when
participants should claim and when they prefer to claim

Future Directions and Implications
● Checklists are not perfectly selective, BUT
● Provide promise for “smart” architecture
● Give the right people the right checklist to minimize errors
● For average 62-year-old SS retirement benefit claimant
– Delaying claiming for 18 months
extra $122 per month ($1,220 vs $1,098 at age 62)
– Translates to roughly extra $53,000 in expected lifetime benefits

Thank you!
Questions?

Bonus Slides

Study 1
● Web-based sample of 309 older Americans (ages 45-70) who are
already eligible or expect to become eligible for SS benefits
● Scenario asks Ps to imagine they are approaching retirement and are
eligible for SS benefits
● Use both text and a graph to explain how claiming benefits at different
ages between 62 and 70 affects the monthly benefit amount
● Checklist items clustered into two sets of eight reasons each
– Early first
– Late first
– Interspersed
● Read each item and check whether it is something you would
consider when making the claiming decision: “yes, no, I don’t know”
– Intentionally non-evaluative responses draw attention to each reason
without asking Ps to consider its relevance

Study 1: Results
● ANOVA shows main effect of checklist order:
F(2,306) = 4.00, p = .02, η2 = 0.03
● Reverse order: M = 66.70, SD = 2.60
● Typical order: M = 65.57, SD = 2.83
● Neutral order: M = 66.17, SD = 2.89
● Asking participants to consider a pro-later list before a pro-early list delays preferred
claiming age by, on average, 13.6 months.
● Neutral condition does not impact preferred claiming age, ruling out a simple reminder
explanation.
● Checklists are effective
*p < .01
p > .05

Study 2:
● Reverse order: M = 65.91, SD = 2.83
● Typical order: M = 65.28, SD = 2.96
● Output interference account
– Items (whether pro-early or pro-later) in first checklist are more accessible (processed faster, log-
transformed) than reasons in second checklist
• First checklist: M = 63.51 seconds
• Second checklist: M = 77.81 seconds
– Linear mixed-effects model predicting sum of these times as a function of:
• Checklist order (typical vs. reverse)
p < .01 Checklist order changes accessibility
• Checklist type (pro-early vs. pro-later)
p = .02 Ps takes longer to respond to later claiming reasons
• Interaction
*p = .04

Study 2: Mediation
● Do differences in accessibility (as measured by response time) mediate
the effect of checklist order on claiming preferences?
– Regress preferred claiming age onto condition: p = .03
– Regress the difference in response times onto condition: p < .001
– Regress preferred claiming age onto condition and the difference in
response times.
• Condition is no longer a significant predictor: p = .06
– Bootstrapping tests indicate that difference in response times fully mediates
the relationship between order and preferred claiming age: p = .04
● Ps presented with checklists in reverse order respond more quickly to
thoughts favoring later claiming and this leads to preference for later
claiming

Study 3: Interventions versus Normative Predictors
● Between-subjects ANCOVA with condition as a predictor and normative predictors as covariates
● Condition remains strong predictor of preferred claiming age, even compared to traditional factors
(eligibility, education, wealth, perceived longevity risk, perceived health, job satisfaction, job security)
Preferred claiming agea
Predictor Bb SEb
Constant
66.78 *** 0.38 Early-first checklist condition
0.14
0.37
Default condition
0.64 ƚ 0.37 Later-first checklist condition
1.53 *** 0.37
Eligibility (dummy coded)
-0.84 ** 0.28 Female (dummy coded)
0.09
0.27
Married or living together (dummy coded)
-0.59 * 0.27 Standardized education
0.07
0.14
Standardized household income
0.42 ** 0.16 Standardized retirement savings
-0.18
0.17
Standardized perceived longevity risk
0.25
0.16 Standardized perceived health
0.00
0.14
Standardized job satisfaction
0.40 ** 0.14 Standardized job security
-0.06
0.14
Note. The dependent variable is preferred claiming age (62-70).
a N = 451. b Parameter estimates from an ANCOVA
† p < .10, * p < .05, ** p < .01, *** p < .001