
PREFEASIBILITY STUDY MUYOVOZI - World...
78
Small Hydro Resource Mapping in Tanzania PREFEASIBILITY STUDY: MUYOVOZI January 2018 Public Disclosure Authorized Public Disclosure Authorized Public Disclosure Authorized Public Disclosure Authorized
Transcript of PREFEASIBILITY STUDY MUYOVOZI - World...
Small Hydro Resource Mapping in Tanzania
PREFEASIBILITY STUDY: MUYOVOZI
January 2018
Pub
lic D
iscl
osur
e A
utho
rized
Pub
lic D
iscl
osur
e A
utho
rized
Pub
lic D
iscl
osur
e A
utho
rized
Pub
lic D
iscl
osur
e A
utho
rized

This report was prepared by SHER in association with Mhylab, under contract to The World Bank.
It is one of several outputs from the small hydro Energy Resource Mapping and Geospatial Planning Tanzania [Project ID: P145287]. This activity is funded and supported by the Energy Sector Management Assistance Program (ESMAP), a multi-donor trust fund administered by The World Bank, under a global initiative on Renewable Energy Resource Mapping. Further details on the initiative can be obtained from the ESMAP website.
This report is an interim output from the above-mentioned project. Users are strongly advised to exercise caution when utilizing the information and data contained, as this has not been subject to validation using ground measurement data or peer review. The final output from this project will be a validated Tanzania Small Hydro Atlas, which will be published once the project is completed.
Copyright © 2018 THE WORLD BANK
Washington DC 20433
Telephone: +1-202-473-1000
Internet: www.worldbank.org
The World Bank, comprising the International Bank for Reconstruction and Development (IBRD) and the
International Development Association (IDA), is the commissioning agent and copyright holder for this
publication. However, this work is a product of the consultants listed, and not of World Bank staff. The
findings, interpretations, and conclusions expressed in this work do not necessarily reflect the views of The
World Bank, its Board of Executive Directors, or the governments they represent.
The World Bank does not guarantee the accuracy of the data included in this work and accept no
responsibility for any consequence of their use. The boundaries, colors, denominations, and other
information shown on any map in this work do not imply any judgment on the part of The World Bank
concerning the legal status of any territory or the endorsement or acceptance of such boundaries.
The material in this work is subject to copyright. Because The World Bank encourages dissemination of its
knowledge, this work may be reproduced, in whole or in part, for non-commercial purposes as long as full
attribution to this work is given. Any queries on rights and licenses, including subsidiary rights, should be
addressed to World Bank Publications, The World Bank Group, 1818 H Street NW, Washington, DC 20433,
USA; fax: +1-202-522-2625; e-mail: [email protected]. Furthermore, the ESMAP Program Manager
would appreciate receiving a copy of the publication that uses this publication for its source sent in care of
the address above, or to [email protected].
IN ASSOCIATION WITH
Phase 2 - Ground Based Data Collection
PREFEASIBILITY STUDY OF THE
MUYOVOZI HYDROELECTRIC SCHEME Renewable Energy Resource Mapping: Small Hydro - Tanzania [P145271]
January 2018
FINAL OUTPUT

SHER Ingénieurs-conseils s.a. Rue J. Matagne, 15 5020 Namur – Belgium Phone : +32 81 32 79 80 Fax : +32 81 32 79 89 www.sher.be
Project Manager: Rebecca DOTET SHER reference: TNZ01 Phone : +32 (0) 81 327 982 Fax : +32 (0) 81 327 989 E-mail : [email protected]
Rev.n° Date Content Drafted Verified
0 04/12/2017 Prefeasibility Study Report - draft version Damien DUBOIS Quentin GOOR Lionel MATAGNE Alice VANDENBUSSCHE
Pierre SMITS
1 19/01/2018 Prefeasibility Study Report - final version Damien DUBOIS Quentin GOOR
SHER INGÉNIEURS-CONSEILS S.A.
IS ISO 9001 CERTIFIED

Small Hydropower Resource Mapping Tanzania (~1-10 MW) REA / The World Bank Prefeasibility Study of the Muyovozi Hydroelectric Project
SHER / Mhylab January 2018 Page 5
ABREVIATIONS AND ACRONYMS
ASTER GDEM Advanced Spaceborne Thermal Emission and Reflection Radiometer Global Digital Elevation Model
CHIRPS Climate Hazards Group InfradRed Precipitation database DSM Digital Surface Model ESIA Environmental and Social Impact Assessment ESMAP Energy Sector Management Assistance Program EWURA Energy and Water Utilities Regulatory Authority FAO Food and Agricultural Organization GIS Geographic Information System GoT Government of Tanzania GSHAP Global Seismic Hazard Assessment GW Gigawatt GWh Gigawatt hour IFC International Finance Corporation IPP Independent Power Producers kW Kilowatt kWh Kilowatt hour MW Megawatt MWh Megawatt hour NASA United States National Aeronautics and Space Administration OP Operational Polices REA Rural Energy Agency RE Renewable Energy SRTM Shuttle Radar Topography Mission TANESCO Tanzania Electric Supply Company USACE United States Army Corps of Engineers WES Waterways Experimental Station

Small Hydropower Resource Mapping Tanzania (~1-10 MW) REA / The World Bank Prefeasibility Study of the Muyovozi Hydroelectric Project
SHER / Mhylab January 2018 Page 6
TABLE OF CONTENT
TABLE OF CONTENT .................................................................................................................................... 6
TABLE OF FIGURES ..................................................................................................................................... 8
LIST OF TABLES .......................................................................................................................................... 9
1 EXECUTIVE SUMMARY ....................................................................................................................... 10
2 INTRODUCTION ................................................................................................................................. 12
2.1 Overview of the ESMAP Program ........................................................................................................ 12
2.2 Objectives and Phasing of the Study ................................................................................................... 12
2.3 Context and Scope of the Prefeasibility Study ..................................................................................... 12
3 CONTEXT OF THE MUYOVOZI HYDROELECTRIC SCHEME ...................................................................... 14
3.1 Project Area ......................................................................................................................................... 14
3.2 Site Access .......................................................................................................................................... 14
3.3 General Site Description ...................................................................................................................... 17
3.4 Previous Studies .................................................................................................................................. 18
4 TOPOGRAPHY AND MAPPING ............................................................................................................. 19
4.1 Existing Mapping .................................................................................................................................. 19 4.1.1 Topographic Mapping....................................................................................................................................... 19 4.1.2 Thematic Mapping ............................................................................................................................................ 19 4.1.3 Digital Surface Model ....................................................................................................................................... 20
4.2 Mapping Carried out as Part of the Study ............................................................................................ 20 4.2.1 Digitization and geo-referencing....................................................................................................................... 20 4.2.2 Additional surveying ......................................................................................................................................... 21
5 HYDROLOGICAL STUDY ..................................................................................................................... 23
5.1 Objectives and Limits ........................................................................................................................... 23
5.2 Description of the Study Area .............................................................................................................. 23 5.2.1 Physical Context............................................................................................................................................... 23 5.2.2 Land cover........................................................................................................................................................ 25 5.2.3 Climate ............................................................................................................................................................. 26
5.3 Hydro-meteorological database ........................................................................................................... 28 5.3.1 Rainfall and meteorological data ...................................................................................................................... 28 5.3.2 Hydrological data.............................................................................................................................................. 28
5.4 Rainfall and Streamflow Data Analysis ................................................................................................ 29 5.4.1 Annual and monthly rainfall .............................................................................................................................. 29 5.4.2 Inflow analysis .................................................................................................................................................. 29
5.5 Flood Study .......................................................................................................................................... 32 5.5.1 Introduction....................................................................................................................................................... 32 5.5.2 Methodology ..................................................................................................................................................... 32 5.5.3 Extreme rainfall events estimates .................................................................................................................... 32 5.5.4 Hydrological parameters estimates .................................................................................................................. 32 5.5.5 Flood estimates ................................................................................................................................................ 33
5.6 Key Hydrological Parameters of the Muyovozi Project ........................................................................ 33
6 GEOLOGY ........................................................................................................................................ 35
6.1 Introduction .......................................................................................................................................... 35
6.2 Geological Reference Map................................................................................................................... 35
6.3 Geological Setting ................................................................................................................................ 35
6.4 Technical Characteristics ..................................................................................................................... 37
Small Hydropower Resource Mapping Tanzania (~1-10 MW) REA / The World Bank Prefeasibility Study of the Muyovozi Hydroelectric Project
SHER / Mhylab January 2018 Page 7
6.5 Seismicity ............................................................................................................................................. 40
6.6 Conclusions and Recommendations for Additional Investigations ....................................................... 40 6.6.1 Conclusion........................................................................................................................................................ 40 6.6.2 Additional investigations ................................................................................................................................... 41
6.7 References ........................................................................................................................................... 41
7 PRELIMINARY ENVIRONMENTAL AND SOCIAL IMPACT ANALYSIS .............................................................. 42
7.1 Socio-Environmental background ........................................................................................................ 42
7.2 World Bank operational policies and guidelines ................................................................................... 44
7.3 Socio-environmental constraints .......................................................................................................... 45
8 PROPOSED SCHEME AND DESIGN ...................................................................................................... 46
8.1 Proposed Scheme Description ............................................................................................................. 46 8.1.1 Diverting structure, intake, waterway and powerhouse .................................................................................... 46 8.1.2 Type of scheme ................................................................................................................................................ 47 8.1.3 Design flow ....................................................................................................................................................... 47 8.1.4 Design Floods .................................................................................................................................................. 48
8.2 Structures Design ................................................................................................................................ 49 8.2.1 Diverting structure type and characteristics ..................................................................................................... 49 8.2.2 Temporary diversion......................................................................................................................................... 52 8.2.3 Outlet structure ................................................................................................................................................. 52 8.2.4 Waterway ......................................................................................................................................................... 53 8.2.5 Electromechanical Equipment .......................................................................................................................... 55 8.2.6 Power and energy generation performance assessment ................................................................................. 63 8.2.7 Powerhouse ..................................................................................................................................................... 64 8.2.8 Transmission line and substation ..................................................................................................................... 66 8.2.9 Access .............................................................................................................................................................. 66 8.2.10 Temporary infrastructure during the construction period ............................................................................. 67 8.2.11 Permanent camp ......................................................................................................................................... 67
8.3 Key Project Features ........................................................................................................................... 67
9 COSTS AND QUANTITIES ESTIMATES .................................................................................................. 70
9.1 Assumptions ........................................................................................................................................ 70 9.1.1 Unit Costs ......................................................................................................................................................... 70 9.1.2 Reinforcements and concrete .......................................................................................................................... 71 9.1.3 Hydro and electromechanical equipment costs estimate ................................................................................. 71 9.1.4 Indirect costs .................................................................................................................................................... 71 9.1.5 Site facilities costs ............................................................................................................................................ 71 9.1.6 Environmental and Social Impact Assessment Mitigation Costs ...................................................................... 72
9.2 Total Costs (CAPEX) ........................................................................................................................... 72
10 ECONOMIC ANALYSIS ........................................................................................................................ 74
10.1 Methodology ........................................................................................................................................ 74
10.2 Assumptions and Input Data ................................................................................................................ 75
10.3 Economic Analysis and Conclusions ................................................................................................... 76
11 CONCLUSIONS AND RECOMMANDATIONS ............................................................................................. 77
12 APPENDICES .................................................................................................................................... 78
12.1 Detailed proposed scheme and main components .............................................................................. 78
Small Hydropower Resource Mapping Tanzania (~1-10 MW) REA / The World Bank Prefeasibility Study of the Muyovozi Hydroelectric Project
SHER / Mhylab January 2018 Page 8
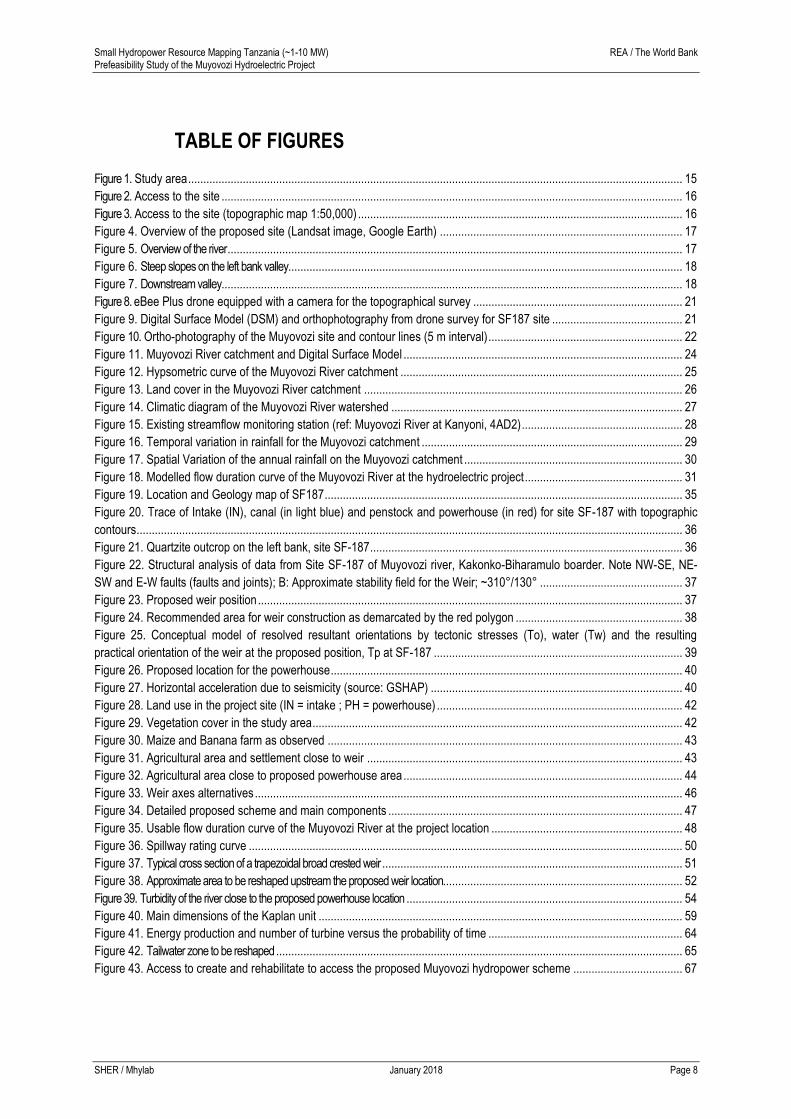
TABLE OF FIGURES
Figure 1. Study area ................................................................................................................................................................... 15 Figure 2. Access to the site ........................................................................................................................................................ 16 Figure 3. Access to the site (topographic map 1:50,000) ........................................................................................................... 16 Figure 4. Overview of the proposed site (Landsat image, Google Earth) ................................................................................ 17 Figure 5. Overview of the river ...................................................................................................................................................... 17 Figure 6. Steep slopes on the left bank valley.................................................................................................................................. 18 Figure 7. Downstream valley ........................................................................................................................................................ 18 Figure 8. eBee Plus drone equipped with a camera for the topographical survey ..................................................................... 21 Figure 9. Digital Surface Model (DSM) and orthophotography from drone survey for SF187 site ........................................... 21 Figure 10. Ortho-photography of the Muyovozi site and contour lines (5 m interval) ................................................................ 22 Figure 11. Muyovozi River catchment and Digital Surface Model ............................................................................................ 24 Figure 12. Hypsometric curve of the Muyovozi River catchment ............................................................................................. 25 Figure 13. Land cover in the Muyovozi River catchment ......................................................................................................... 26 Figure 14. Climatic diagram of the Muyovozi River watershed ................................................................................................ 27 Figure 15. Existing streamflow monitoring station (ref: Muyovozi River at Kanyoni, 4AD2) ..................................................... 28 Figure 16. Temporal variation in rainfall for the Muyovozi catchment ...................................................................................... 29 Figure 17. Spatial Variation of the annual rainfall on the Muyovozi catchment ........................................................................ 30 Figure 18. Modelled flow duration curve of the Muyovozi River at the hydroelectric project .................................................... 31 Figure 19. Location and Geology map of SF187 ...................................................................................................................... 35 Figure 20. Trace of Intake (IN), canal (in light blue) and penstock and powerhouse (in red) for site SF-187 with topographic
contours .................................................................................................................................................................................... 36 Figure 21. Quartzite outcrop on the left bank, site SF-187 ....................................................................................................... 36 Figure 22. Structural analysis of data from Site SF-187 of Muyovozi river, Kakonko-Biharamulo boarder. Note NW-SE, NE-
SW and E-W faults (faults and joints); B: Approximate stability field for the Weir; ~310°/130° ............................................... 37 Figure 23. Proposed weir position ............................................................................................................................................ 37 Figure 24. Recommended area for weir construction as demarcated by the red polygon ....................................................... 38 Figure 25. Conceptual model of resolved resultant orientations by tectonic stresses (To), water (Tw) and the resulting
practical orientation of the weir at the proposed position, Tp at SF-187 .................................................................................. 39 Figure 26. Proposed location for the powerhouse .................................................................................................................... 40 Figure 27. Horizontal acceleration due to seismicity (source: GSHAP) ................................................................................... 40 Figure 28. Land use in the project site (IN = intake ; PH = powerhouse) ................................................................................. 42 Figure 29. Vegetation cover in the study area .......................................................................................................................... 42 Figure 30. Maize and Banana farm as observed ..................................................................................................................... 43 Figure 31. Agricultural area and settlement close to weir ........................................................................................................ 43 Figure 32. Agricultural area close to proposed powerhouse area ............................................................................................ 44 Figure 33. Weir axes alternatives ............................................................................................................................................. 46 Figure 34. Detailed proposed scheme and main components ................................................................................................. 47 Figure 35. Usable flow duration curve of the Muyovozi River at the project location ............................................................... 48 Figure 36. Spillway rating curve ............................................................................................................................................... 50 Figure 37. Typical cross section of a trapezoidal broad crested weir ................................................................................................... 51 Figure 38. Approximate area to be reshaped upstream the proposed weir location............................................................................... 52 Figure 39. Turbidity of the river close to the proposed powerhouse location ........................................................................................... 54 Figure 40. Main dimensions of the Kaplan unit ........................................................................................................................ 59 Figure 41. Energy production and number of turbine versus the probability of time ................................................................ 64 Figure 42. Tailwater zone to be reshaped ...................................................................................................................................... 65 Figure 43. Access to create and rehabilitate to access the proposed Muyovozi hydropower scheme .................................... 67
Small Hydropower Resource Mapping Tanzania (~1-10 MW) REA / The World Bank Prefeasibility Study of the Muyovozi Hydroelectric Project
SHER / Mhylab January 2018 Page 9
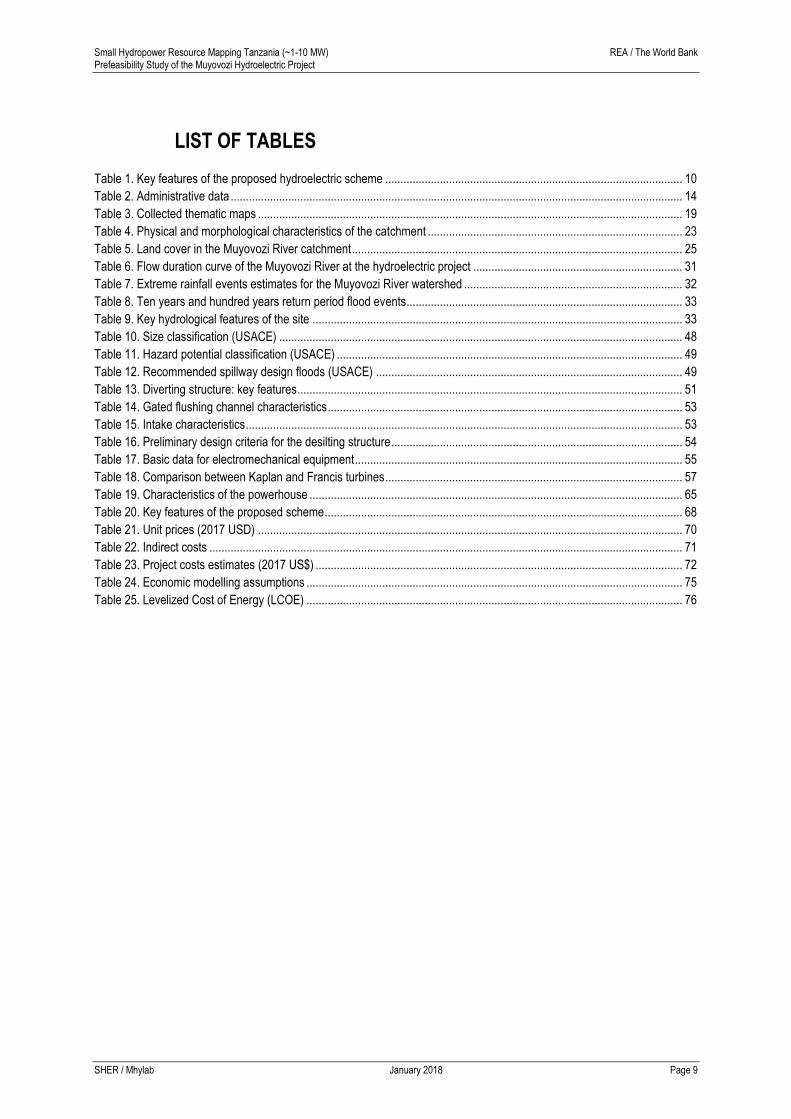
LIST OF TABLES
Table 1. Key features of the proposed hydroelectric scheme .................................................................................................. 10 Table 2. Administrative data ..................................................................................................................................................... 14 Table 3. Collected thematic maps ............................................................................................................................................ 19 Table 4. Physical and morphological characteristics of the catchment .................................................................................... 23 Table 5. Land cover in the Muyovozi River catchment ............................................................................................................. 25 Table 6. Flow duration curve of the Muyovozi River at the hydroelectric project ..................................................................... 31 Table 7. Extreme rainfall events estimates for the Muyovozi River watershed ........................................................................ 32 Table 8. Ten years and hundred years return period flood events ........................................................................................... 33 Table 9. Key hydrological features of the site .......................................................................................................................... 33 Table 10. Size classification (USACE) ..................................................................................................................................... 48 Table 11. Hazard potential classification (USACE) .................................................................................................................. 49 Table 12. Recommended spillway design floods (USACE) ..................................................................................................... 49 Table 13. Diverting structure: key features ............................................................................................................................... 51 Table 14. Gated flushing channel characteristics ..................................................................................................................... 53 Table 15. Intake characteristics ................................................................................................................................................ 53 Table 16. Preliminary design criteria for the desilting structure ................................................................................................ 54 Table 17. Basic data for electromechanical equipment ............................................................................................................ 55 Table 18. Comparison between Kaplan and Francis turbines .................................................................................................. 57 Table 19. Characteristics of the powerhouse ........................................................................................................................... 65 Table 20. Key features of the proposed scheme ...................................................................................................................... 68 Table 21. Unit prices (2017 USD) ............................................................................................................................................ 70 Table 22. Indirect costs ............................................................................................................................................................ 71 Table 23. Project costs estimates (2017 US$) ......................................................................................................................... 72 Table 24. Economic modelling assumptions ............................................................................................................................ 75 Table 25. Levelized Cost of Energy (LCOE) ............................................................................................................................ 76
Small Hydropower Resource Mapping Tanzania (~1-10 MW) REA / The World Bank Prefeasibility Study of the Muyovozi Hydroelectric Project
SHER / Mhylab January 2018 Page 10
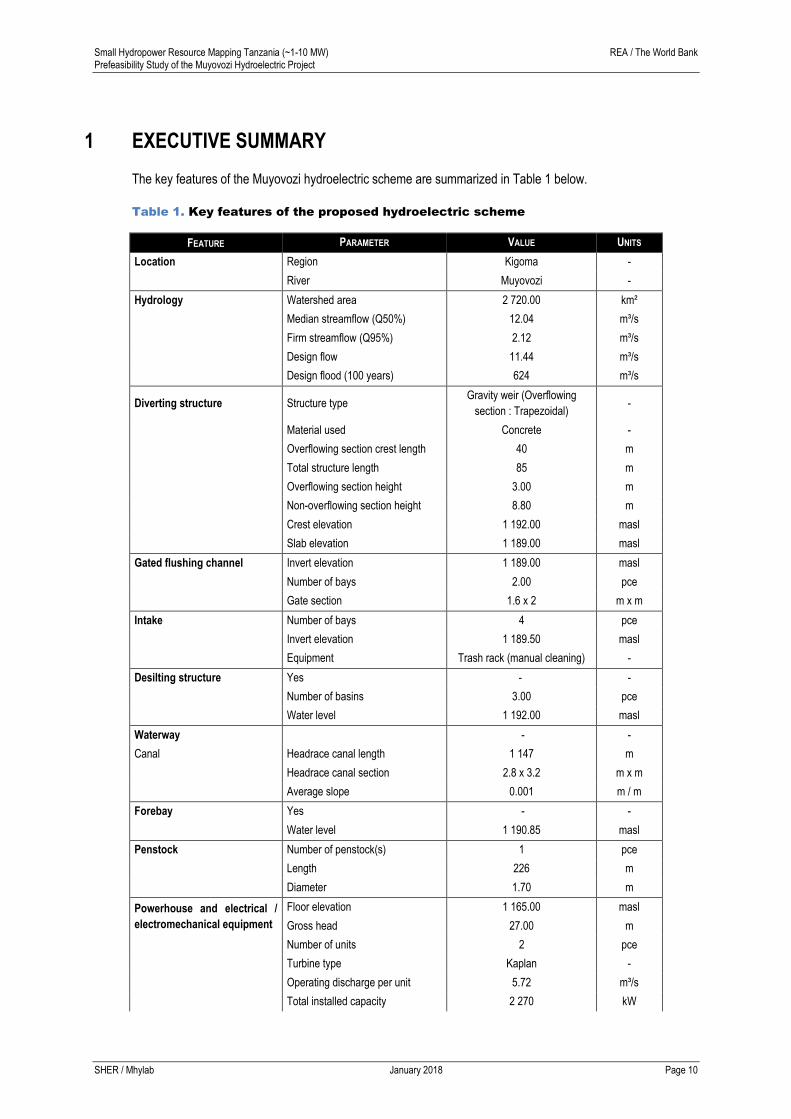
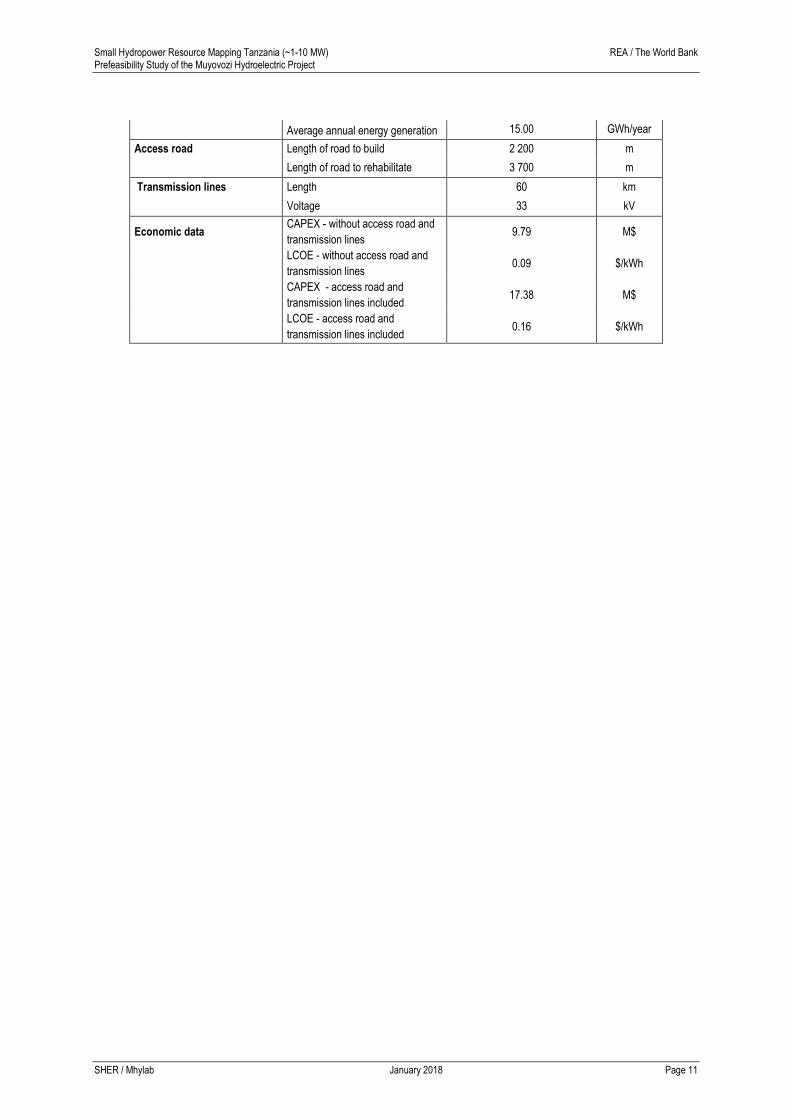
1 EXECUTIVE SUMMARY
The key features of the Muyovozi hydroelectric scheme are summarized in Table 1 below.
Table 1. Key features of the proposed hydroelectric scheme
FEATURE PARAMETER VALUE UNITS
Location Region Kigoma -
River Muyovozi -
Hydrology Watershed area 2 720.00 km²
Median streamflow (Q50%) 12.04 m³/s
Firm streamflow (Q95%) 2.12 m³/s
Design flow 11.44 m³/s
Design flood (100 years) 624 m³/s
Diverting structure Structure type Gravity weir (Overflowing
section : Trapezoidal) -
Material used Concrete -
Overflowing section crest length 40 m
Total structure length 85 m
Overflowing section height 3.00 m
Non-overflowing section height 8.80 m
Crest elevation 1 192.00 masl
Slab elevation 1 189.00 masl
Gated flushing channel Invert elevation 1 189.00 masl
Number of bays 2.00 pce
Gate section 1.6 x 2 m x m
Intake Number of bays 4 pce
Invert elevation 1 189.50 masl
Equipment Trash rack (manual cleaning) -
Desilting structure Yes - -
Number of basins 3.00 pce
Water level 1 192.00 masl
Waterway - -
Canal Headrace canal length 1 147 m
Headrace canal section 2.8 x 3.2 m x m
Average slope 0.001 m / m
Forebay Yes - -
Water level 1 190.85 masl
Penstock Number of penstock(s) 1 pce
Length 226 m
Diameter 1.70 m
Powerhouse and electrical /
electromechanical equipment
Floor elevation 1 165.00 masl
Gross head 27.00 m
Number of units 2 pce
Turbine type Kaplan -
Operating discharge per unit 5.72 m³/s
Total installed capacity 2 270 kW
Small Hydropower Resource Mapping Tanzania (~1-10 MW) REA / The World Bank Prefeasibility Study of the Muyovozi Hydroelectric Project
SHER / Mhylab January 2018 Page 11
Average annual energy generation 15.00 GWh/year
Access road Length of road to build 2 200 m
Length of road to rehabilitate 3 700 m
Transmission lines Length 60 km
Voltage 33 kV
Economic data CAPEX - without access road and
transmission lines 9.79 M$
LCOE - without access road and
transmission lines 0.09 $/kWh
CAPEX - access road and
transmission lines included 17.38 M$
LCOE - access road and
transmission lines included 0.16 $/kWh

Small Hydropower Resource Mapping Tanzania (~1-10 MW) REA / The World Bank Prefeasibility Study of the Muyovozi Hydroelectric Project
SHER / Mhylab January 2018 Page 12
2 INTRODUCTION
2.1 OVERVIEW OF THE ESMAP PROGRAM
ESMAP (Energy Sector Management Assistance Program) is a technical assistance program managed by the
World Bank and supported by 11 bilateral donors. ESMAP launched in January 2013 an initiative to support the
efforts of countries to improve the knowledge of renewable energy (RE) resources, establish appropriate
institutional framework for the development of RE and provide "free access" to geospatial resources and data.
This initiative will also support the IRENA-GlobalAtlas program by improving data availability and quality,
consulted through an interactive atlas.
This "Renewable Energy Mapping: Small Hydro Tanzania" study, is part of a technical assistance project,
ESMAP funded, being implemented by Africa Energy Practice 1 (AFTG1) of the World Bank in Tanzania (the
‘Client’) which aims at supporting resource mapping and geospatial planning for small hydro. It is being
undertaken in close coordination with the Rural Energy Agency (REA) of Tanzania, the World Bank’s primary
Client country counterpart for this study.
The "Provision of Small Hydropower Resource Data and Mapping Services" IDA 8004801 Framework contract
was signed 29th May 2013, while the specific contract " Renewable Energy Mapping: Small Hydro Tanzania",
n. 7169139, is dated 4th November 2013.
2.2 OBJECTIVES AND PHASING OF THE STUDY
The objectives of the study are:
To improve the quality and availability of information on Tanzania’s small hydropower resources. The
project will provide the GoT (Client) and commercial developers with ground-validated maps (at least
70+ sites up to 10 MW) that show the varying levels of hydro potential throughout the country, and
highlight several sites most suited for small hydropower projects.
To contribute to a detailed comprehensive assessment and to a geospatial planning framework of small-
hydro resources in Tanzania; (ii) to verify the potential for the most promising sites and prioritized sites
(~ 20 prioritized sites) to facilitate new small hydropower projects and ideally to guide private
investments into the sector; and (iii) to increase the awareness and knowledge of the Client on RE
potential.
The study is delivered in three phases:
PHASE 1: Preliminary resource mapping based on satellite and site visits.
PHASE 2: Ground-based data collection.
PHASE 3: Production of validated resource atlas that combines satellite and ground-based data.
2.3 CONTEXT AND SCOPE OF THE PREFEASIBILITY STUDY
This report is delivered in the context of PHASE 2 (Ground-based data collection). In accordance with our
Terms of References (Revised Terms of References for the Phase 2 and 3 of the Project, 30 June 2016), the
prefeasibility study covers the following aspects:
Review of the existing data and GIS information ;

Small Hydropower Resource Mapping Tanzania (~1-10 MW) REA / The World Bank Prefeasibility Study of the Muyovozi Hydroelectric Project
SHER / Mhylab January 2018 Page 13
Additional site visit to the sites and main load centers / national grid connection by relevant sector
experts ;
Additional topographic and geotechnical surveys, update of the hydrology, and assessments of
environmental and social impact to reach study results at pre-feasibility level;
Preparation of a conceptual design and drawings at pre-feasibility level; Schematic Layout of Hydro
Powerhouse, weir or dam (when applicable), waterways and Transmission Lines to the main load
centers / national grid connection;
Preparation of a Budgetary Cost Estimate, including costs for environmental and social costs, and
Electricity Generation Estimate for a range of installed capacities;
Preliminary economic analysis.

Small Hydropower Resource Mapping Tanzania (~1-10 MW) REA / The World Bank Prefeasibility Study of the Muyovozi Hydroelectric Project
SHER / Mhylab January 2018 Page 14
3 CONTEXT OF THE MUYOVOZI HYDROELECTRIC SCHEME
3.1 PROJECT AREA
The Muyovosi project is located on the Muyovosi River approximately 7 km upstream of the confluence with the
Muhwazi River. The geographical coordinates (WGS1984) of the proposed weir location are 30.994°East and
3.196°South.
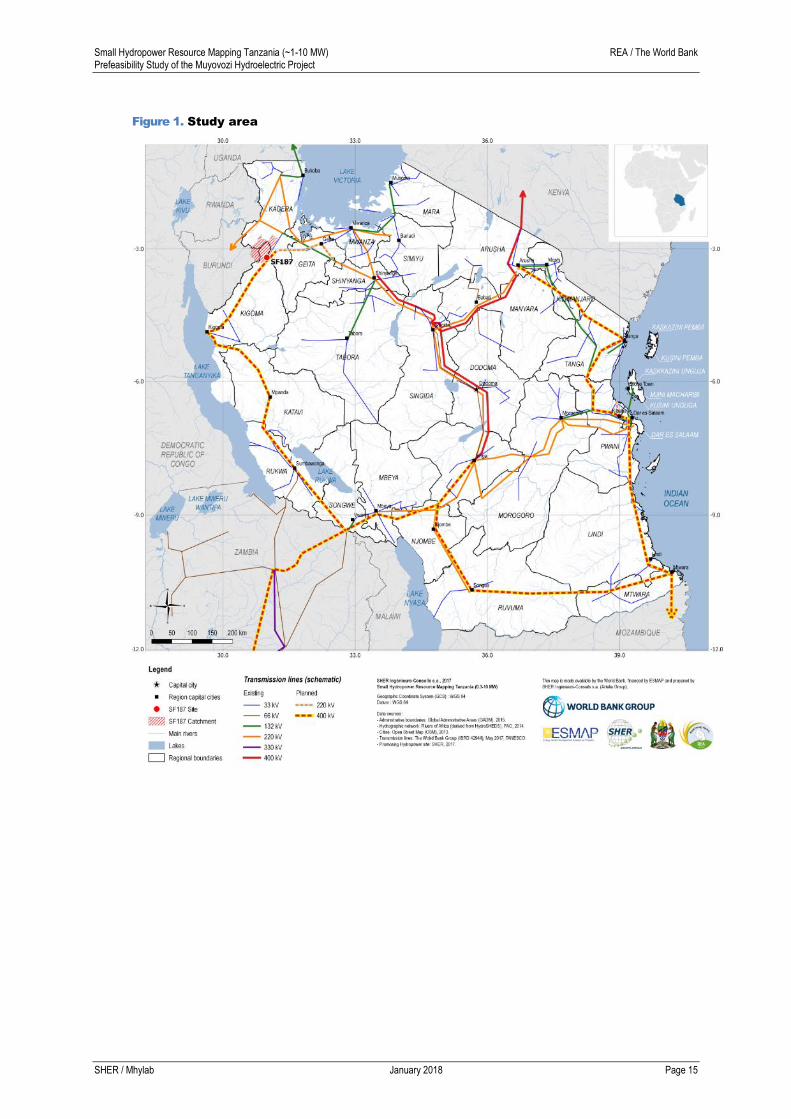
At the proposed intake weir location, the watershed of the Muyovosi River drains an area of 2,720 km². Figure
1 presents the exact location of the proposed site in Tanzania. The administrative and location data are detailed
in Table 2 below.
Table 2. Administrative data
Item Value
Atlas code SF187
Site name Muyovozi
River Muyovozi
Major river basin Malagarasi and Lake Tanganyika
Region Kigoma
District Kibondo
Division Kakonko / Muhange
Village Njomulole / Kanyoni
Reference topographic map Topographic map n° 43/2 and n° 44/1 (scale 1/50,000)
3.2 SITE ACCESS
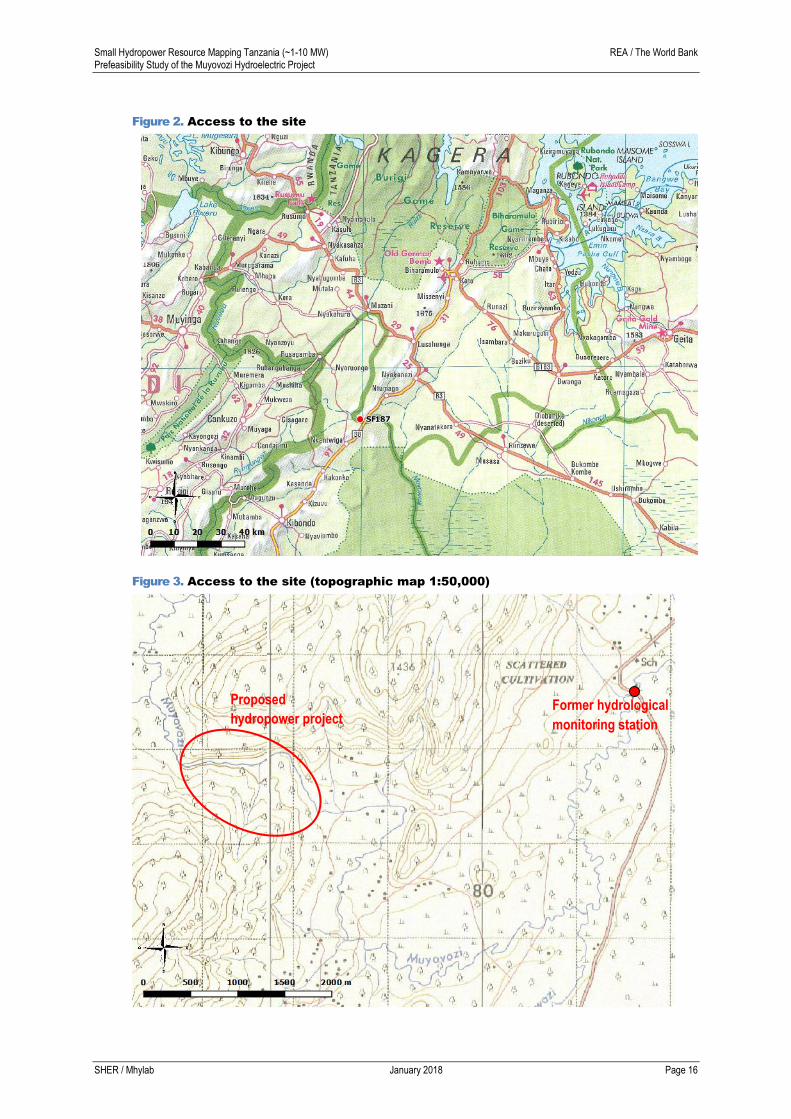
Access to the site is easy by taking the B8 asphalted road (Nyakanazi – Kibondo stretch, Figure 2) and then
taking a good 3km long dirt road. From there, the proposed powerhouse position is accessed from a 1km long
track and the surroundings of the proposed weir with a 2.5km long footpath.
Small Hydropower Resource Mapping Tanzania (~1-10 MW) REA / The World Bank Prefeasibility Study of the Muyovozi Hydroelectric Project
SHER / Mhylab January 2018 Page 15
Figure 1. Study area
Small Hydropower Resource Mapping Tanzania (~1-10 MW) REA / The World Bank Prefeasibility Study of the Muyovozi Hydroelectric Project
SHER / Mhylab January 2018 Page 16
Figure 2. Access to the site
Figure 3. Access to the site (topographic map 1:50,000)
Proposed
hydropower project Former hydrological
monitoring station
Small Hydropower Resource Mapping Tanzania (~1-10 MW) REA / The World Bank Prefeasibility Study of the Muyovozi Hydroelectric Project
SHER / Mhylab January 2018 Page 17
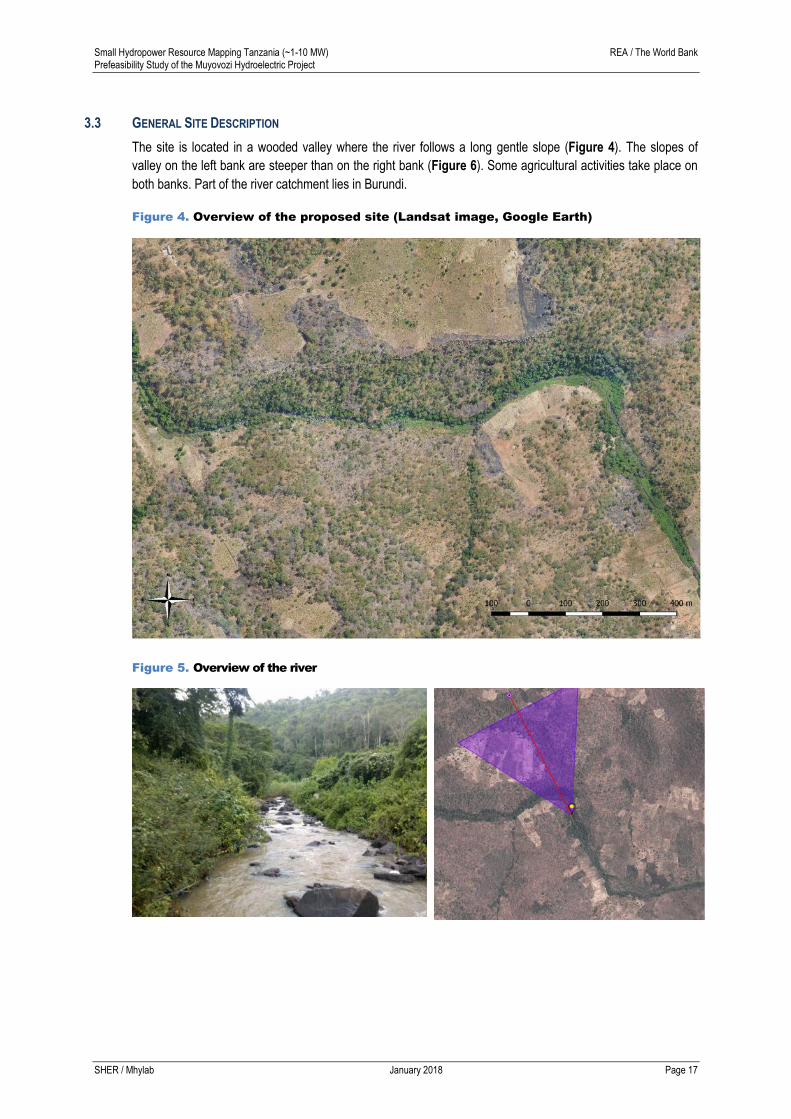
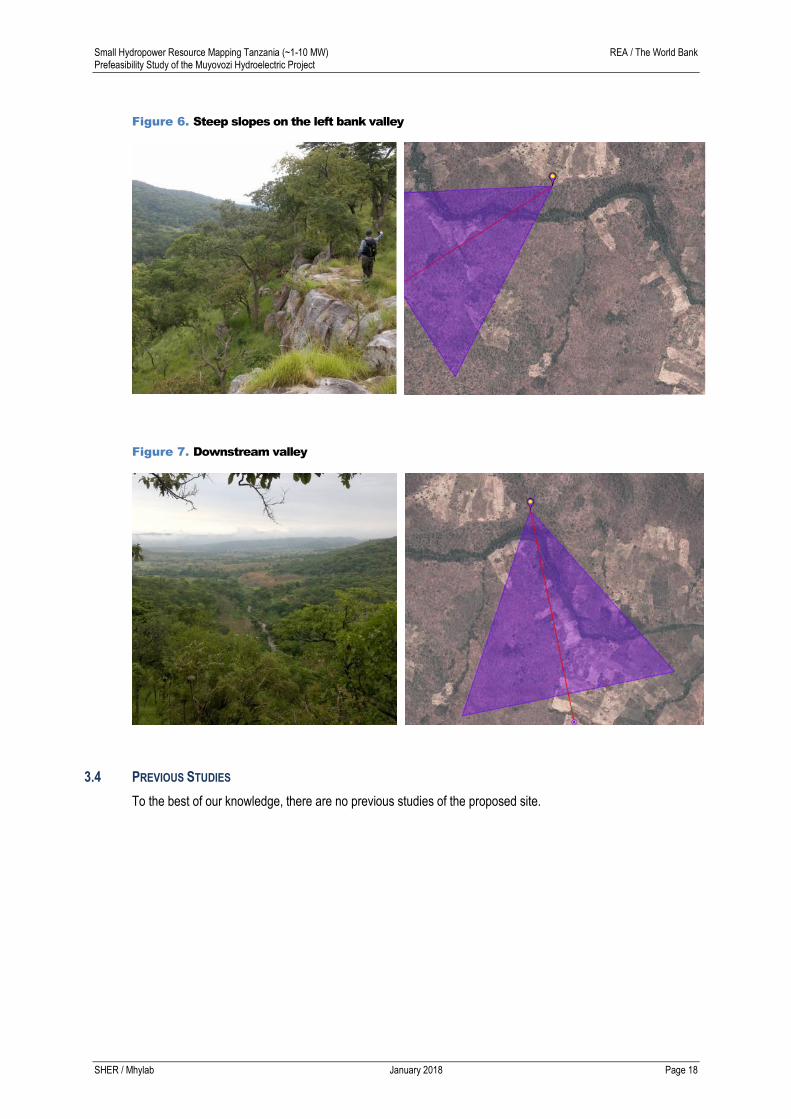
3.3 GENERAL SITE DESCRIPTION
The site is located in a wooded valley where the river follows a long gentle slope (Figure 4). The slopes of
valley on the left bank are steeper than on the right bank (Figure 6). Some agricultural activities take place on
both banks. Part of the river catchment lies in Burundi.
Figure 4. Overview of the proposed site (Landsat image, Google Earth)
Figure 5. Overview of the river
Small Hydropower Resource Mapping Tanzania (~1-10 MW) REA / The World Bank Prefeasibility Study of the Muyovozi Hydroelectric Project
SHER / Mhylab January 2018 Page 18
Figure 6. Steep slopes on the left bank valley
Figure 7. Downstream valley
3.4 PREVIOUS STUDIES
To the best of our knowledge, there are no previous studies of the proposed site.

Small Hydropower Resource Mapping Tanzania (~1-10 MW) REA / The World Bank Prefeasibility Study of the Muyovozi Hydroelectric Project
SHER / Mhylab January 2018 Page 19
4 TOPOGRAPHY AND MAPPING
4.1 EXISTING MAPPING
4.1.1 Topographic Mapping
The JPEG format (not georeferenced) 1:50,000 scale topographic maps have been acquired from the Survey
and Mapping Department of the Ministry of Land in order to cover the entire study area. The JPEG format (not
georeferenced) 1:100,000 scale topographic maps have been also obtained from the Ministry of Land. The
1:50,000 scale map of interest is the sheets 43/2 and 44/1. The contour lines interval is 20m. All the
topographic maps have been georeferenced as described in section 4.2.
4.1.2 Thematic Mapping
Thematic maps and their key features, sources and format are presented in Table 3 below.
Table 3. Collected thematic maps
THEMATIC FORMAT KEY FEATURES SOURCES
Administrative boundaries Vector Country / Regions / Districts /
Divisions
FAO Global Country Boundaries, 2012
REA, 2014
Major cities Vector 32 cities Open Street Map, 2014
Topographical maps
Raster 1:250,000 (64 tiles)
Full country coverage
Ministry of Land, Survey and Mapping
Department
Raster 1:50,000 (1,333 tiles)
Full country coverage
Ministry of Land, Survey and Mapping
Department
Digital Elevation Model
Raster SRTM v4.1
Spatial resolution ~ 90m
NASA, 2014
http://www2.jpl.nasa.gov/srtm/
Raster
ASTER GDEM v2
Spatial resolution ~ 30m
(experimental)
http://www.jspacesystems.or.jp/en_/
Land cover Vector
Protected areas Vector Protected areas, National Parks
and Game reserves
Tourist Board ; Tanzania Conservation
Resource Centre ; Ministry of Land ; World
Database on Protected Areas ; Protected
Planet, 2014
Soil map Raster
IPCC default soil classes derived
from the Harmonized World Soil
Data Base (v1.1)
ISRIC-WISE
http://www.isric.org
Mining activities Vector - Ministry of Energy and Minerals ; World
Bank AICD database ; SHER
Satellite image Raster Image Landsat 2013 Google Earth
Population Shapefile Census data at village and
region levels
National Bureau of Statistics ; Ministry of
Finance, REA
Lakes Vector Inland water bodies in Africa FAO, 2000
http://www.fao.org/geonetwork
River network Vector
River "flow accumulation"
network from the HYDRO1k for
Africa
FAO, 2006
http://www.fao.org/geonetwork
Flow gauging stations Vector Location of the YYY gauging
Small Hydropower Resource Mapping Tanzania (~1-10 MW) REA / The World Bank Prefeasibility Study of the Muyovozi Hydroelectric Project
SHER / Mhylab January 2018 Page 20
THEMATIC FORMAT KEY FEATURES SOURCES
Rainfall Raster Monthly average rainfall grid
Spatial resolution ~ 1km
WorldClim, v1.4
http://www.worldclim.org/
Road network Vector National, regional and other
roads of Tanzania World Bank AICD database
Rail network Vector Main rail network World Bank AICD database
Ports Vector Major ports World Bank AICD database
Airports Vector Major airports World Bank AICD database
Power grid Vector Existing power grid IED, 2013 ; REA
Power grid Vector Planned expansion of the
transmission network World Bank AICD database
Existing thermal power plants Vector
34 thermal power plants
amongst which 10 connected to
the National Power Grid
IED, 2013 ; Power System Master Plan,
2013
Existing hydropower plants Vector 46 hydropower plants REA, TANESCO, Ministry of Energy,
Diocese, Power System Master Plan, 2013
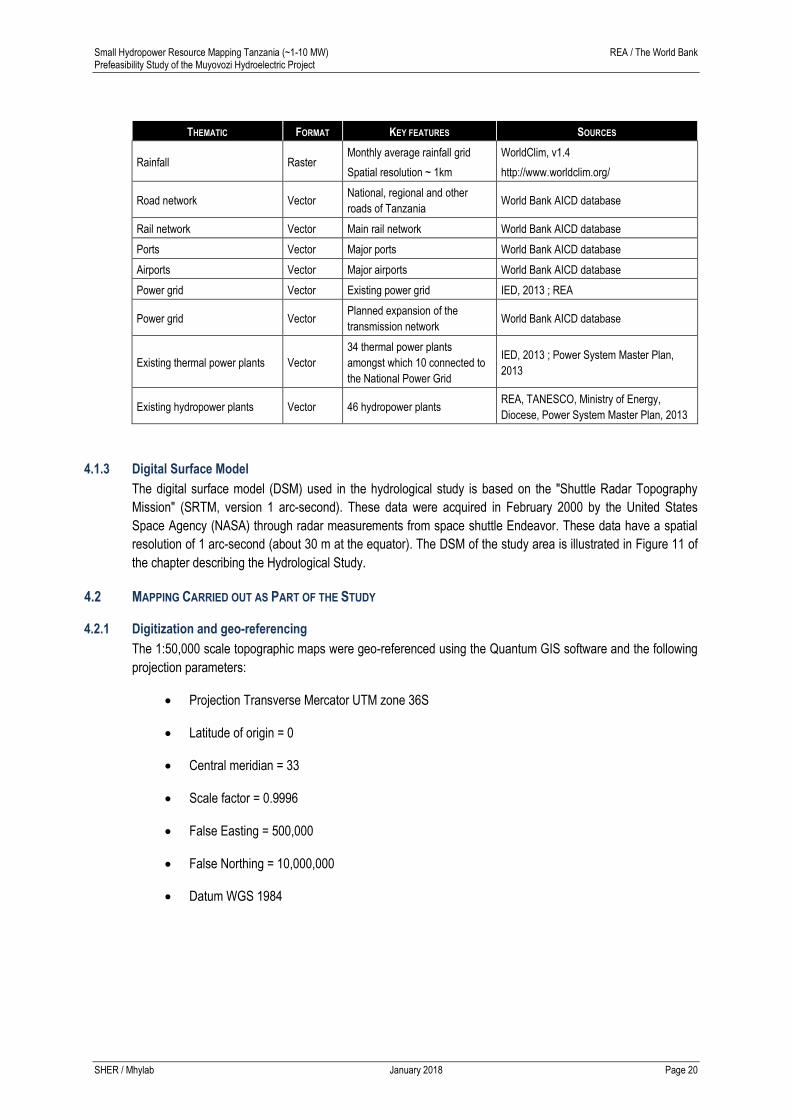
4.1.3 Digital Surface Model
The digital surface model (DSM) used in the hydrological study is based on the "Shuttle Radar Topography
Mission" (SRTM, version 1 arc-second). These data were acquired in February 2000 by the United States
Space Agency (NASA) through radar measurements from space shuttle Endeavor. These data have a spatial
resolution of 1 arc-second (about 30 m at the equator). The DSM of the study area is illustrated in Figure 11 of
the chapter describing the Hydrological Study.
4.2 MAPPING CARRIED OUT AS PART OF THE STUDY
4.2.1 Digitization and geo-referencing
The 1:50,000 scale topographic maps were geo-referenced using the Quantum GIS software and the following
projection parameters:
Projection Transverse Mercator UTM zone 36S
Latitude of origin = 0
Central meridian = 33
Scale factor = 0.9996
False Easting = 500,000
False Northing = 10,000,000
Datum WGS 1984
Small Hydropower Resource Mapping Tanzania (~1-10 MW) REA / The World Bank Prefeasibility Study of the Muyovozi Hydroelectric Project
SHER / Mhylab January 2018 Page 21
4.2.2 Additional surveying
4.2.2.1 Digital surface model
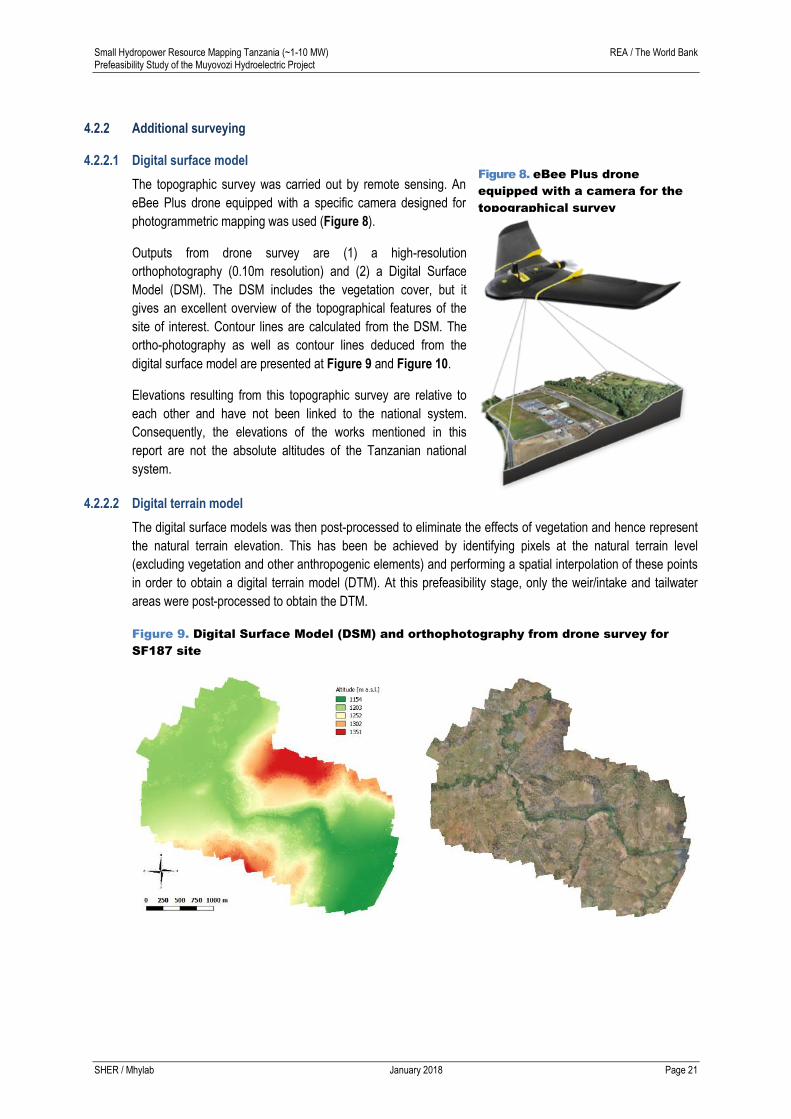
The topographic survey was carried out by remote sensing. An
eBee Plus drone equipped with a specific camera designed for
photogrammetric mapping was used (Figure 8).
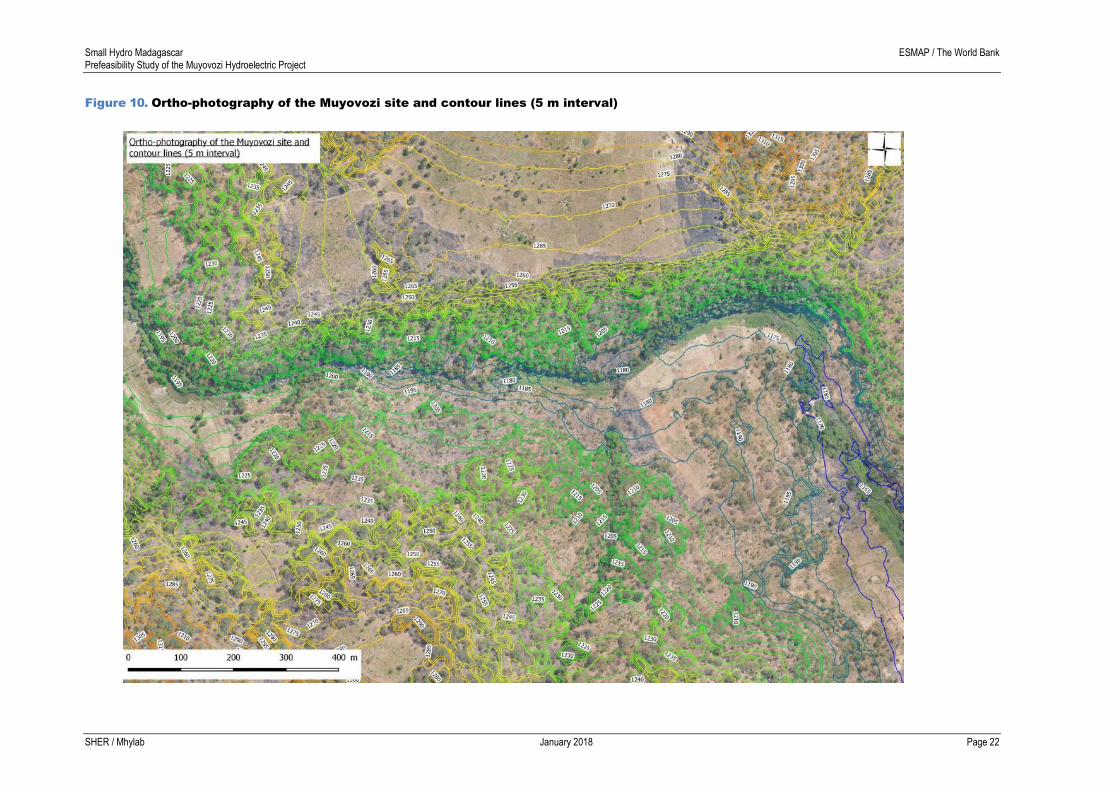
Outputs from drone survey are (1) a high-resolution
orthophotography (0.10m resolution) and (2) a Digital Surface
Model (DSM). The DSM includes the vegetation cover, but it
gives an excellent overview of the topographical features of the
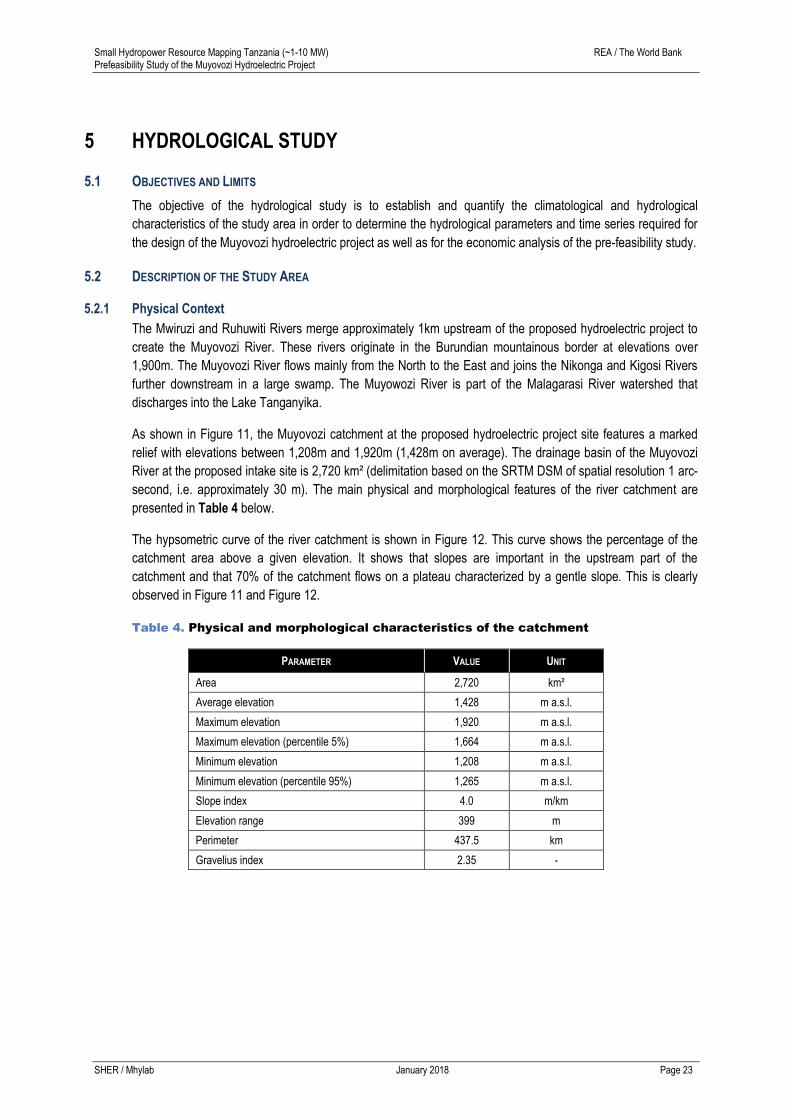
site of interest. Contour lines are calculated from the DSM. The
ortho-photography as well as contour lines deduced from the
digital surface model are presented at Figure 9 and Figure 10.
Elevations resulting from this topographic survey are relative to
each other and have not been linked to the national system.
Consequently, the elevations of the works mentioned in this
report are not the absolute altitudes of the Tanzanian national
system.
4.2.2.2 Digital terrain model
The digital surface models was then post-processed to eliminate the effects of vegetation and hence represent
the natural terrain elevation. This has been be achieved by identifying pixels at the natural terrain level
(excluding vegetation and other anthropogenic elements) and performing a spatial interpolation of these points
in order to obtain a digital terrain model (DTM). At this prefeasibility stage, only the weir/intake and tailwater
areas were post-processed to obtain the DTM.
Figure 9. Digital Surface Model (DSM) and orthophotography from drone survey for
SF187 site
Figure 8. eBee Plus drone
equipped with a camera for the
topographical survey
Small Hydro Madagascar ESMAP / The World Bank Prefeasibility Study of the Muyovozi Hydroelectric Project
SHER / Mhylab January 2018 Page 22
Figure 10. Ortho-photography of the Muyovozi site and contour lines (5 m interval)
Small Hydropower Resource Mapping Tanzania (~1-10 MW) REA / The World Bank Prefeasibility Study of the Muyovozi Hydroelectric Project
SHER / Mhylab January 2018 Page 23
5 HYDROLOGICAL STUDY
5.1 OBJECTIVES AND LIMITS
The objective of the hydrological study is to establish and quantify the climatological and hydrological
characteristics of the study area in order to determine the hydrological parameters and time series required for
the design of the Muyovozi hydroelectric project as well as for the economic analysis of the pre-feasibility study.
5.2 DESCRIPTION OF THE STUDY AREA
5.2.1 Physical Context
The Mwiruzi and Ruhuwiti Rivers merge approximately 1km upstream of the proposed hydroelectric project to
create the Muyovozi River. These rivers originate in the Burundian mountainous border at elevations over
1,900m. The Muyovozi River flows mainly from the North to the East and joins the Nikonga and Kigosi Rivers
further downstream in a large swamp. The Muyowozi River is part of the Malagarasi River watershed that
discharges into the Lake Tanganyika.
As shown in Figure 11, the Muyovozi catchment at the proposed hydroelectric project site features a marked
relief with elevations between 1,208m and 1,920m (1,428m on average). The drainage basin of the Muyovozi
River at the proposed intake site is 2,720 km² (delimitation based on the SRTM DSM of spatial resolution 1 arc-
second, i.e. approximately 30 m). The main physical and morphological features of the river catchment are
presented in Table 4 below.
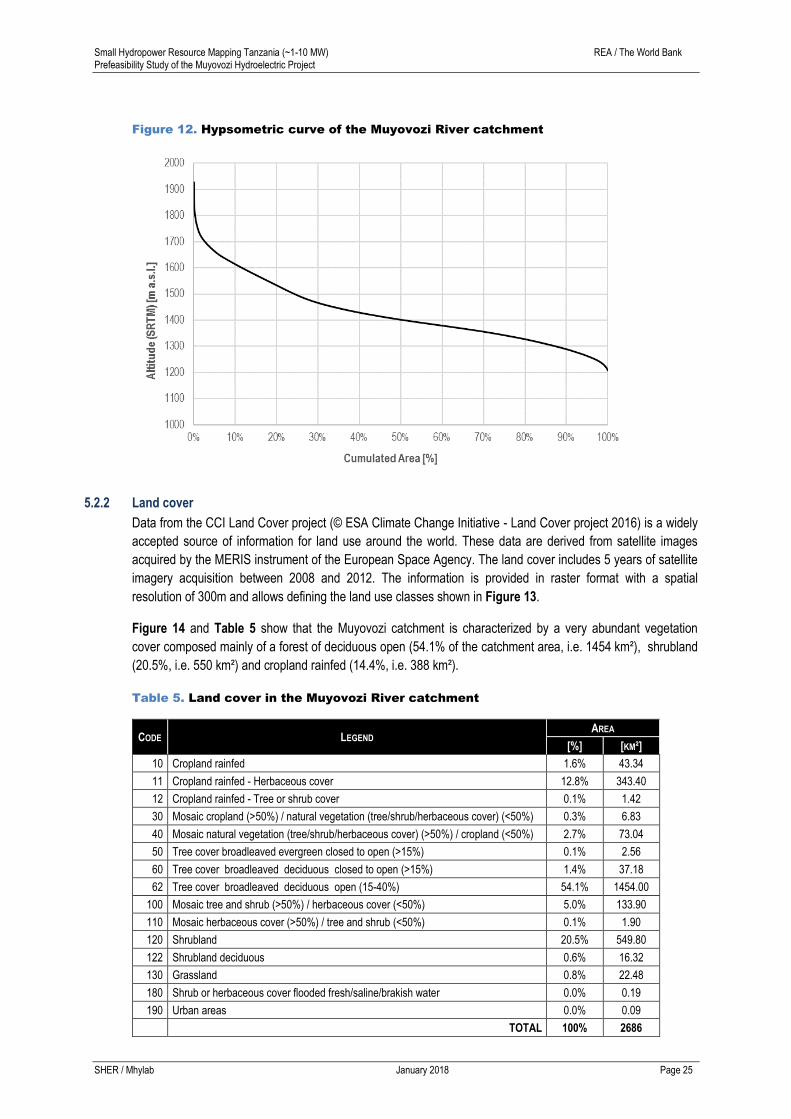
The hypsometric curve of the river catchment is shown in Figure 12. This curve shows the percentage of the
catchment area above a given elevation. It shows that slopes are important in the upstream part of the
catchment and that 70% of the catchment flows on a plateau characterized by a gentle slope. This is clearly
observed in Figure 11 and Figure 12.
Table 4. Physical and morphological characteristics of the catchment
PARAMETER VALUE UNIT
Area 2,720 km²
Average elevation 1,428 m a.s.l.
Maximum elevation 1,920 m a.s.l.
Maximum elevation (percentile 5%) 1,664 m a.s.l.
Minimum elevation 1,208 m a.s.l.
Minimum elevation (percentile 95%) 1,265 m a.s.l.
Slope index 4.0 m/km
Elevation range 399 m
Perimeter 437.5 km
Gravelius index 2.35 -

Small Hydropower Resource Mapping Tanzania (~1-10 MW) REA / The World Bank Prefeasibility Study of the Muyovozi Hydroelectric Project
SHER / Mhylab January 2018 Page 24
Figure 11. Muyovozi River catchment and Digital Surface Model
Small Hydropower Resource Mapping Tanzania (~1-10 MW) REA / The World Bank Prefeasibility Study of the Muyovozi Hydroelectric Project
SHER / Mhylab January 2018 Page 25
Figure 12. Hypsometric curve of the Muyovozi River catchment
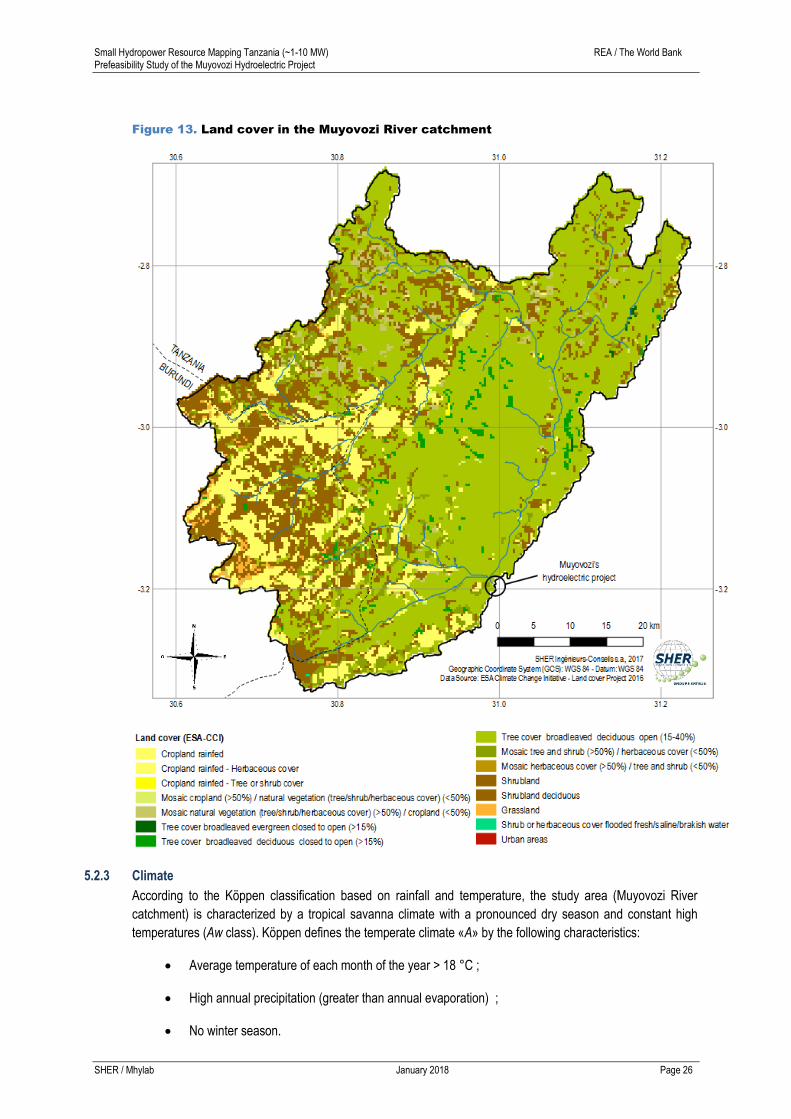
5.2.2 Land cover
Data from the CCI Land Cover project (© ESA Climate Change Initiative - Land Cover project 2016) is a widely
accepted source of information for land use around the world. These data are derived from satellite images
acquired by the MERIS instrument of the European Space Agency. The land cover includes 5 years of satellite
imagery acquisition between 2008 and 2012. The information is provided in raster format with a spatial
resolution of 300m and allows defining the land use classes shown in Figure 13.
Figure 14 and Table 5 show that the Muyovozi catchment is characterized by a very abundant vegetation
cover composed mainly of a forest of deciduous open (54.1% of the catchment area, i.e. 1454 km²), shrubland
(20.5%, i.e. 550 km²) and cropland rainfed (14.4%, i.e. 388 km²).
Table 5. Land cover in the Muyovozi River catchment
CODE LEGEND AREA
[%] [KM²]
10 Cropland rainfed 1.6% 43.34
11 Cropland rainfed - Herbaceous cover 12.8% 343.40
12 Cropland rainfed - Tree or shrub cover 0.1% 1.42
30 Mosaic cropland (>50%) / natural vegetation (tree/shrub/herbaceous cover) (<50%) 0.3% 6.83
40 Mosaic natural vegetation (tree/shrub/herbaceous cover) (>50%) / cropland (<50%) 2.7% 73.04
50 Tree cover broadleaved evergreen closed to open (>15%) 0.1% 2.56
60 Tree cover broadleaved deciduous closed to open (>15%) 1.4% 37.18
62 Tree cover broadleaved deciduous open (15-40%) 54.1% 1454.00
100 Mosaic tree and shrub (>50%) / herbaceous cover (<50%) 5.0% 133.90
110 Mosaic herbaceous cover (>50%) / tree and shrub (<50%) 0.1% 1.90
120 Shrubland 20.5% 549.80
122 Shrubland deciduous 0.6% 16.32
130 Grassland 0.8% 22.48
180 Shrub or herbaceous cover flooded fresh/saline/brakish water 0.0% 0.19
190 Urban areas 0.0% 0.09
TOTAL 100% 2686
Small Hydropower Resource Mapping Tanzania (~1-10 MW) REA / The World Bank Prefeasibility Study of the Muyovozi Hydroelectric Project
SHER / Mhylab January 2018 Page 26
Figure 13. Land cover in the Muyovozi River catchment
5.2.3 Climate
According to the Köppen classification based on rainfall and temperature, the study area (Muyovozi River
catchment) is characterized by a tropical savanna climate with a pronounced dry season and constant high
temperatures (Aw class). Köppen defines the temperate climate «A» by the following characteristics:
Average temperature of each month of the year > 18 °C ;
High annual precipitation (greater than annual evaporation) ;
No winter season.

Small Hydropower Resource Mapping Tanzania (~1-10 MW) REA / The World Bank Prefeasibility Study of the Muyovozi Hydroelectric Project
SHER / Mhylab January 2018 Page 27
The rainfall regime « w » (dry season in winter) is defined by a savanna climate with a precipitation of the driest
winter month < 60 mm and < [100 – (mean annual precipitation) / 25].
Figure 14 shows the climatic diagram as well as the temperature curve for the Muyovozi River watershed.
Precipitations are very low during the dry season (June to September) but significant during the wet season.
July is the driest month with 1 mm of precipitation (on average) whereas the wettest month is April with 169 mm
on average. The average annual precipitation is 1,019 mm.
Figure 14. Climatic diagram of the Muyovozi River watershed
It is observed that the average annual temperature is 21.1°C. Temperature does not varies much throughout
the year with an average amplitude of 1.6°C. The warmest month is September with 22.1°C and March is the
coldest, with an average temperature of 20.5°C.
Figure 14 shows the strong seasonal variability across the year with a dry season from June to August that
features monthly precipitations below 10 mm/month.
Small Hydropower Resource Mapping Tanzania (~1-10 MW) REA / The World Bank Prefeasibility Study of the Muyovozi Hydroelectric Project
SHER / Mhylab January 2018 Page 28
5.3 HYDRO-METEOROLOGICAL DATABASE
5.3.1 Rainfall and meteorological data
Rainfall data from two sources were used in this study: (i) the WorldClim climate database and (ii) the Climate
Hazards Group InfradRed Precipitation database (CHIRPS).
WorldClim is a set of global data representative for the period ~1970-2000 available with a spatial resolution of
about 1 km and at a monthly timestep. The spatial resolution is obtained by interpolation of ground-measured
data.
Climate Hazards Group InfraRed Precipitation with Station data (CHIRPS) is a 30+ year quasi-global rainfall
dataset at a daily timestep. Starting in 1981 to near-present, CHIRPS incorporates 0.05° resolution satellite
imagery with in-situ station data to create gridded rainfall time series for trend analysis and seasonal drought
monitoring. Values extracted from these satellite images are the means of the precipitation that falls each day
on the entire catchment.
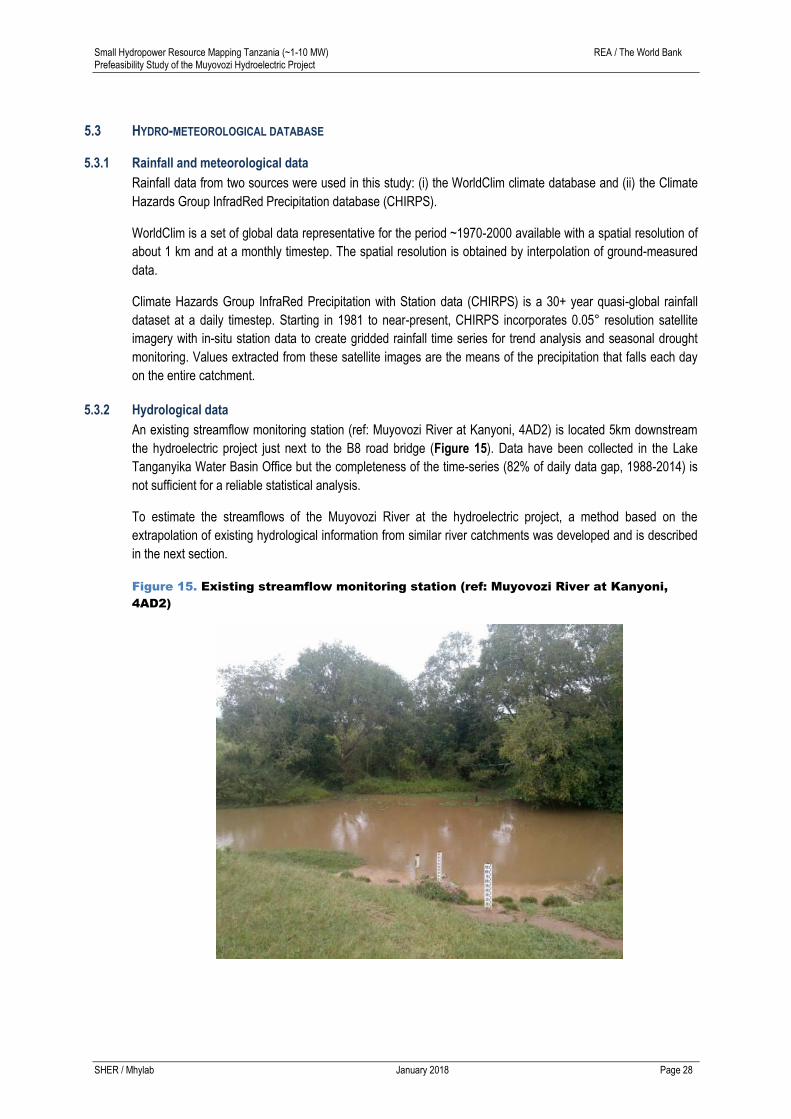
5.3.2 Hydrological data
An existing streamflow monitoring station (ref: Muyovozi River at Kanyoni, 4AD2) is located 5km downstream
the hydroelectric project just next to the B8 road bridge (Figure 15). Data have been collected in the Lake
Tanganyika Water Basin Office but the completeness of the time-series (82% of daily data gap, 1988-2014) is
not sufficient for a reliable statistical analysis.
To estimate the streamflows of the Muyovozi River at the hydroelectric project, a method based on the
extrapolation of existing hydrological information from similar river catchments was developed and is described
in the next section.
Figure 15. Existing streamflow monitoring station (ref: Muyovozi River at Kanyoni,
4AD2)
Small Hydropower Resource Mapping Tanzania (~1-10 MW) REA / The World Bank Prefeasibility Study of the Muyovozi Hydroelectric Project
SHER / Mhylab January 2018 Page 29
5.4 RAINFALL AND STREAMFLOW DATA ANALYSIS
5.4.1 Annual and monthly rainfall
5.4.1.1 Annual and monthly distribution
The analysis of the annual distribution of rainfall within the study area is based on the CHIRPS dataset,
presented in section 5.3.1. The results are presented monthly in the section 5.2.3, Figure 14.
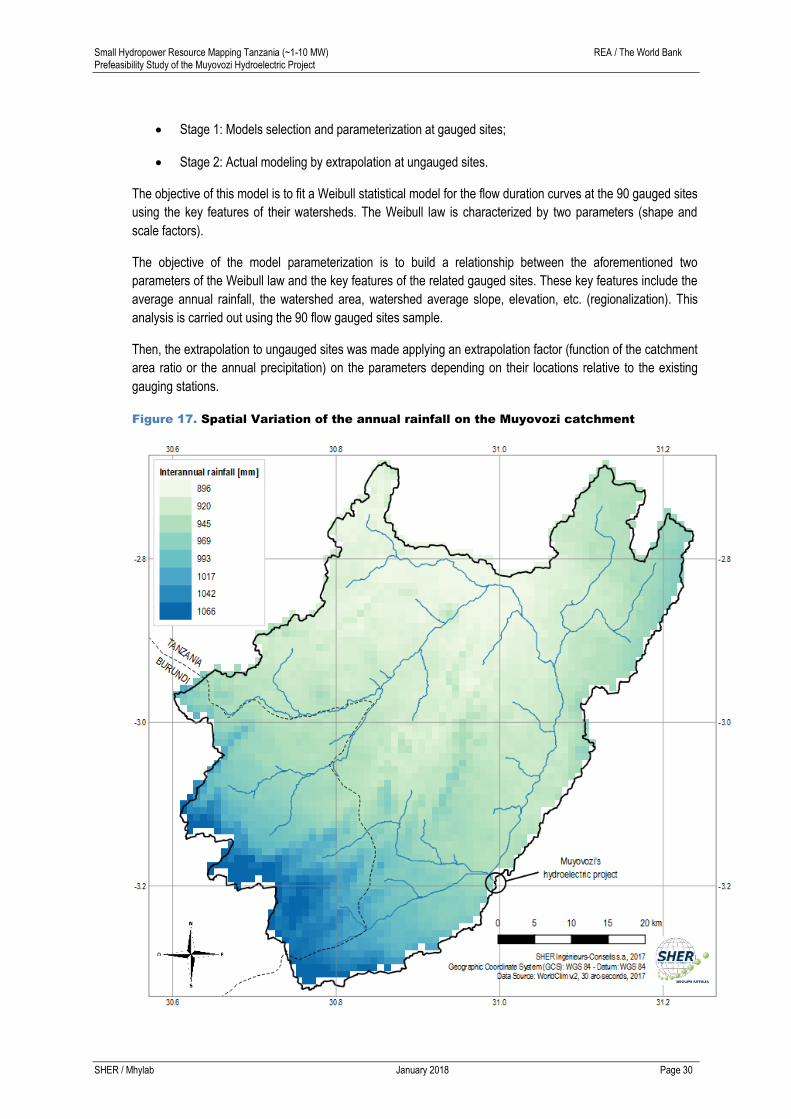
5.4.1.2 Spatial distribution
The analysis of the spatial variation of rainfall within the study area is based on the WorldClim dataset,
presented in section 5.3.1. The spatial variation of average annual rainfall within the watershed is significant
with a minimum of 887 mm in the northern part of the catchment and a maximum of 1,102 mm in its
southwestern part. This is illustrated in Figure 17.
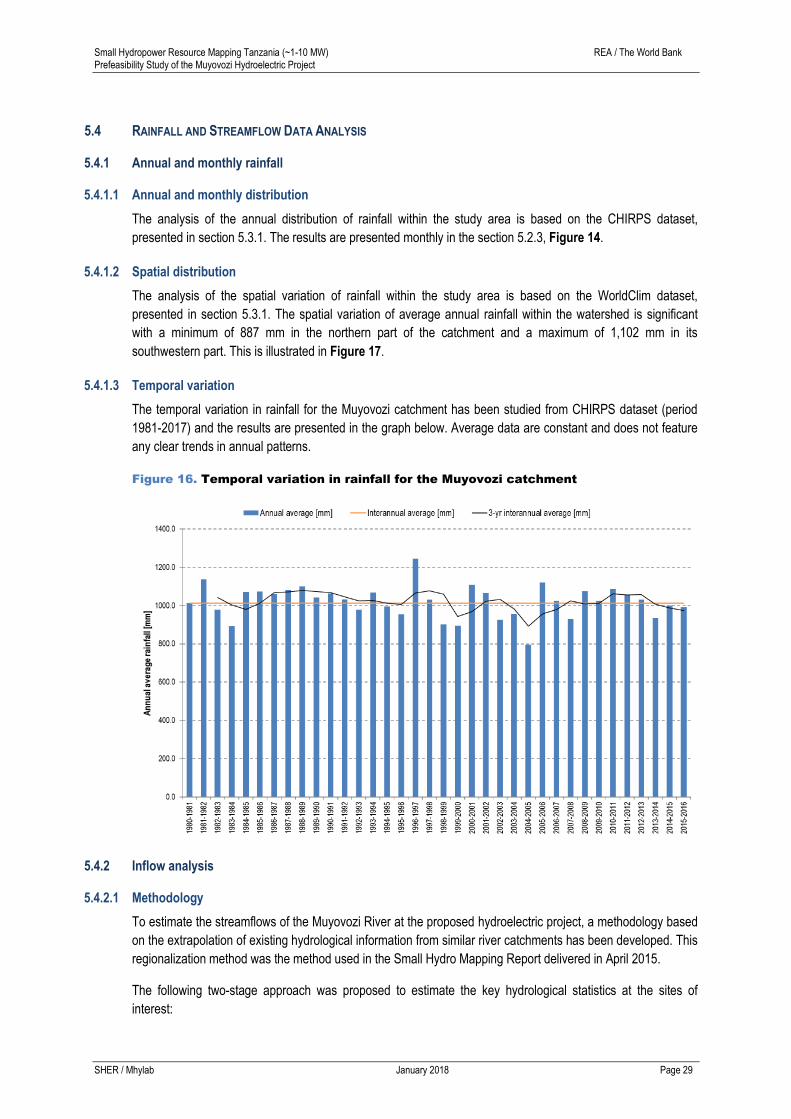
5.4.1.3 Temporal variation
The temporal variation in rainfall for the Muyovozi catchment has been studied from CHIRPS dataset (period
1981-2017) and the results are presented in the graph below. Average data are constant and does not feature
any clear trends in annual patterns.
Figure 16. Temporal variation in rainfall for the Muyovozi catchment
5.4.2 Inflow analysis
5.4.2.1 Methodology
To estimate the streamflows of the Muyovozi River at the proposed hydroelectric project, a methodology based
on the extrapolation of existing hydrological information from similar river catchments has been developed. This
regionalization method was the method used in the Small Hydro Mapping Report delivered in April 2015.
The following two-stage approach was proposed to estimate the key hydrological statistics at the sites of
interest:
Small Hydropower Resource Mapping Tanzania (~1-10 MW) REA / The World Bank Prefeasibility Study of the Muyovozi Hydroelectric Project
SHER / Mhylab January 2018 Page 30
Stage 1: Models selection and parameterization at gauged sites;
Stage 2: Actual modeling by extrapolation at ungauged sites.
The objective of this model is to fit a Weibull statistical model for the flow duration curves at the 90 gauged sites
using the key features of their watersheds. The Weibull law is characterized by two parameters (shape and
scale factors).
The objective of the model parameterization is to build a relationship between the aforementioned two
parameters of the Weibull law and the key features of the related gauged sites. These key features include the
average annual rainfall, the watershed area, watershed average slope, elevation, etc. (regionalization). This
analysis is carried out using the 90 flow gauged sites sample.
Then, the extrapolation to ungauged sites was made applying an extrapolation factor (function of the catchment
area ratio or the annual precipitation) on the parameters depending on their locations relative to the existing
gauging stations.
Figure 17. Spatial Variation of the annual rainfall on the Muyovozi catchment
Small Hydropower Resource Mapping Tanzania (~1-10 MW) REA / The World Bank Prefeasibility Study of the Muyovozi Hydroelectric Project
SHER / Mhylab January 2018 Page 31
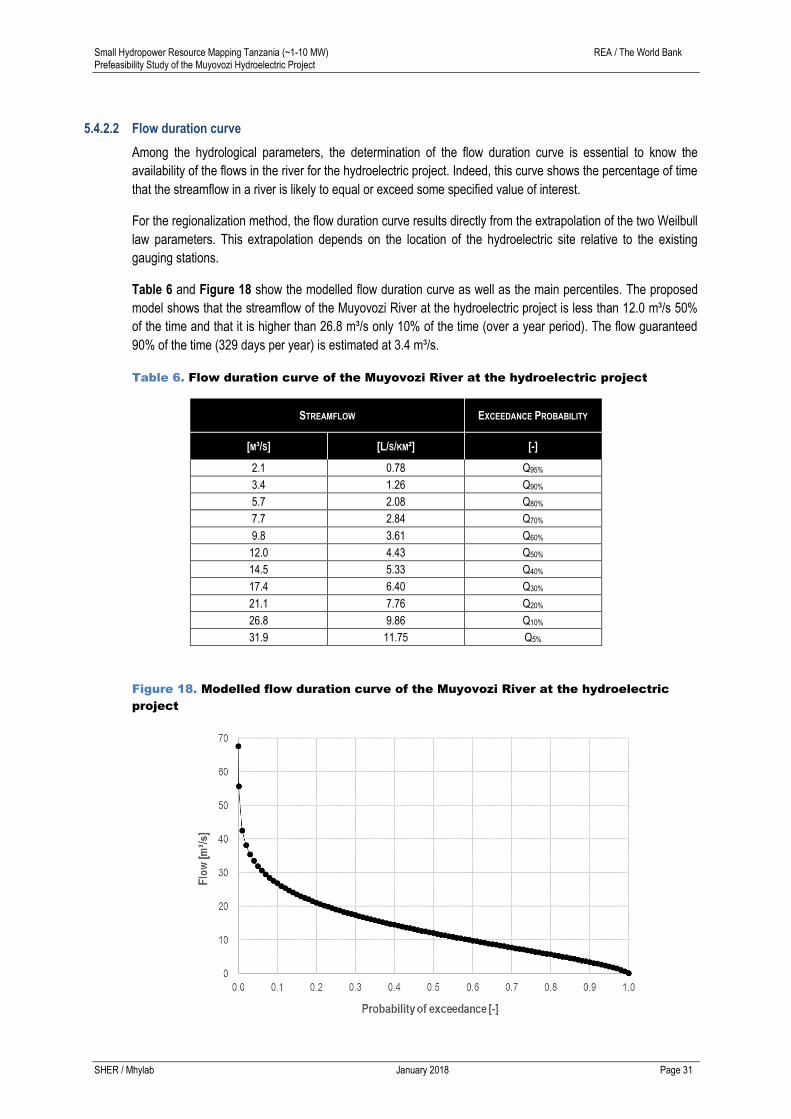
5.4.2.2 Flow duration curve
Among the hydrological parameters, the determination of the flow duration curve is essential to know the
availability of the flows in the river for the hydroelectric project. Indeed, this curve shows the percentage of time
that the streamflow in a river is likely to equal or exceed some specified value of interest.
For the regionalization method, the flow duration curve results directly from the extrapolation of the two Weilbull
law parameters. This extrapolation depends on the location of the hydroelectric site relative to the existing
gauging stations.
Table 6 and Figure 18 show the modelled flow duration curve as well as the main percentiles. The proposed
model shows that the streamflow of the Muyovozi River at the hydroelectric project is less than 12.0 m³/s 50%
of the time and that it is higher than 26.8 m³/s only 10% of the time (over a year period). The flow guaranteed
90% of the time (329 days per year) is estimated at 3.4 m³/s.
Table 6. Flow duration curve of the Muyovozi River at the hydroelectric project
STREAMFLOW EXCEEDANCE PROBABILITY
[M³/S] [L/S/KM²] [-]
2.1 0.78 Q95%
3.4 1.26 Q90%
5.7 2.08 Q80%
7.7 2.84 Q70%
9.8 3.61 Q60%
12.0 4.43 Q50%
14.5 5.33 Q40%
17.4 6.40 Q30%
21.1 7.76 Q20%
26.8 9.86 Q10%
31.9 11.75 Q5%
Figure 18. Modelled flow duration curve of the Muyovozi River at the hydroelectric
project

Small Hydropower Resource Mapping Tanzania (~1-10 MW) REA / The World Bank Prefeasibility Study of the Muyovozi Hydroelectric Project
SHER / Mhylab January 2018 Page 32
5.5 FLOOD STUDY
5.5.1 Introduction
The flood study is essential for designing structures and equipment such as spillways or floodgates but also for
temporary infrastructure such as cofferdams and temporary diversions during the construction period.
The flood study will focus on 10 years and 100 years return period. These floods will be used respectively for
the construction and operation phases. A detailed justification for these return periods can be found in section
8.1.4 of this report.
5.5.2 Methodology
Given the lack of observed streamflow data, the methodology used to estimate the floods is a hydrological
modelling only based on land features (topography, soil type, and land cover). Hence, the results remain flood
estimates and will have to be confirmed at the next stage of the study.
The software used is Hydrological Modelling Software (HEC-HMS v4.2.1) developed by the Hydrologic
Engineering Center of the US Army Corps of Engineer. This program is designed to simulate the complete
hydrologic processes of dendritic watershed systems. The software includes many traditional hydrologic
analysis procedures such as event infiltration, unit hydrographs, and hydrologic routing.
Hydrological modelling aims to represent the hydrologic response of the watershed for specific rainfall events.
Hydrological models are composed by several parameters that can be estimated from land features
(topography, soil type, and land cover) influencing the infiltration (production function) and the dynamic of the
surface flow (transfer function). These parameters must be calibrated on observed streamflow data in order to
establish the best rainfall-runoff relationship to the model. Validated, the model can be used to estimate the
hydrographs for extreme rainfall events.
Given the lack of observed streamflow data, it is not possible to calibrate and validate the hydrological model.
That is why, at this stage of the study, the results of this hydrological study are indicative only.
5.5.3 Extreme rainfall events estimates
The extreme rainfall events have been determined for 10, 25, 50 and 100 years return period from the CHIRPS
dataset by a statistical extrapolation of the observed maximum precipitations (log-normal law1). Then, the 24-hr
precipitations intensity have been statistically distributed to represent a typical event at the simulation time step.
Results are presented in the table below.
Table 7. Extreme rainfall events estimates for the Muyovozi River watershed
Return period 10 years 25 years 50 years 100 years
24-hr precipitation 48.8 mm 55.0 mm 59.5 mm 63.8 mm
5.5.4 Hydrological parameters estimates
Production function2: to estimate the runoff generated for each sub-basin, a “production function” is used.
This function evaluates the precipitation amount that does not infiltrated into the soil. The SCS Curve Number
1 This law is advocated by some hydrologists who justify it by arguing that the appearance of a hydrological event results from the combined action of a large number of factors that multiply. Consequently, the random variable follows a log-normal distribution. Indeed, the product of variables is reduced to the sum of the logarithms of these variables and the central-limit theorem makes it possible to assert the log-normality of the random variable. [Translated from Musy A. (2005). Hydrologie générale. http://echo2.epfl.ch/e-drologie/] 2 For more details about SCS Curve Number method: https://www.hydrocad.net/neh/630ch10.pdf
Small Hydropower Resource Mapping Tanzania (~1-10 MW) REA / The World Bank Prefeasibility Study of the Muyovozi Hydroelectric Project
SHER / Mhylab January 2018 Page 33
method has been selected. The parameter of this method (curve number) is calculated from two land features:
(a) the hydrologic soil group (HSG) determined from soil type and (b) the land cover.
Transfer function3: to estimate the dynamic of the runoff for each sub-basin, a “transfer function” is used. This
function represents how the water coming from the precipitation that is not infiltrated into the soil is moving
within each sub-basin to reach the outlet. The SCS Unit Hydrograph method has been selected. The parameter
of this method (time of concentration) is calculated from topographic land features: (a) the area and slope of the
sub-basin and (b) the length and the slope of the main channel.
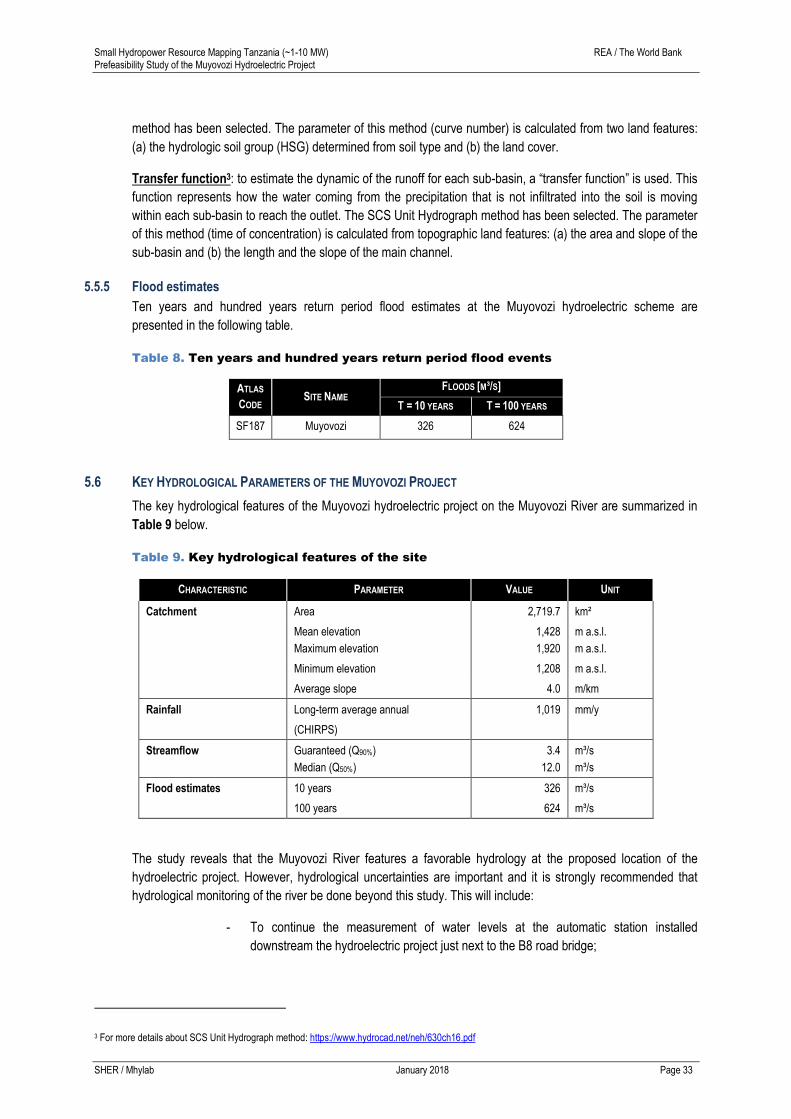
5.5.5 Flood estimates
Ten years and hundred years return period flood estimates at the Muyovozi hydroelectric scheme are
presented in the following table.
Table 8. Ten years and hundred years return period flood events
ATLAS
CODE SITE NAME
FLOODS [M³/S]
T = 10 YEARS T = 100 YEARS
SF187 Muyovozi 326 624
5.6 KEY HYDROLOGICAL PARAMETERS OF THE MUYOVOZI PROJECT
The key hydrological features of the Muyovozi hydroelectric project on the Muyovozi River are summarized in
Table 9 below.
Table 9. Key hydrological features of the site
CHARACTERISTIC PARAMETER VALUE UNIT
Catchment Area 2,719.7 km²
Mean elevation
Maximum elevation
1,428
1,920
m a.s.l.
m a.s.l.
Minimum elevation 1,208 m a.s.l.
Average slope 4.0 m/km
Rainfall Long-term average annual 1,019 mm/y
(CHIRPS)
Streamflow Guaranteed (Q90%)
Median (Q50%)
3.4
12.0
m³/s
m³/s
Flood estimates 10 years 326 m³/s
100 years 624 m³/s
The study reveals that the Muyovozi River features a favorable hydrology at the proposed location of the
hydroelectric project. However, hydrological uncertainties are important and it is strongly recommended that
hydrological monitoring of the river be done beyond this study. This will include:
- To continue the measurement of water levels at the automatic station installed
downstream the hydroelectric project just next to the B8 road bridge;
3 For more details about SCS Unit Hydrograph method: https://www.hydrocad.net/neh/630ch16.pdf

Small Hydropower Resource Mapping Tanzania (~1-10 MW) REA / The World Bank Prefeasibility Study of the Muyovozi Hydroelectric Project
SHER / Mhylab January 2018 Page 34
- To continue the gauging operations of this river in order to improve and validate the
rating curve.
Beyond the development of the Muyovozi hydroelectric project, it is strongly recommended that the
Government of Tanzania set up a hydrological monitoring network for its rivers with high hydropower potential
in order to better understand the available water resources and thus promote the development of hydroelectric
projects across the country. It is only in a context of reduced uncertainties through reliable, recent and long-
term records (more than 20 years) that technical parameters and economic and financial analyzes of
hydroelectric developments can be defined accurately, enabling optimization of their design and their flood
control infrastructure (temporary and permanent).
Small Hydropower Resource Mapping Tanzania (~1-10 MW) REA / The World Bank Prefeasibility Study of the Muyovozi Hydroelectric Project
SHER / Mhylab January 2018 Page 35
6 GEOLOGY
6.1 INTRODUCTION
The purpose of this chapter is to generate preliminary geological datasets and other important baseline
information at the proposed site that will be used for the design of the hydroelectric scheme at the pre-feasibility
study level. These data and information will also be used to define the geotechnical investigations that will have
to be carried out at next stages of the study.
This study aims to inform about the geological conditions and the types of materials existing in the region, as
well as to give an initial overview of the geotechnical properties of these materials. Recommendations are also
formulated regarding the need for further studies and investigations if necessary.
6.2 GEOLOGICAL REFERENCE MAP
The area is just east of 10-12km east of the geological sheet QDS43 (not available). However, the geology of
the site is the same, i.e. quartzitic sandstone and quartzites.
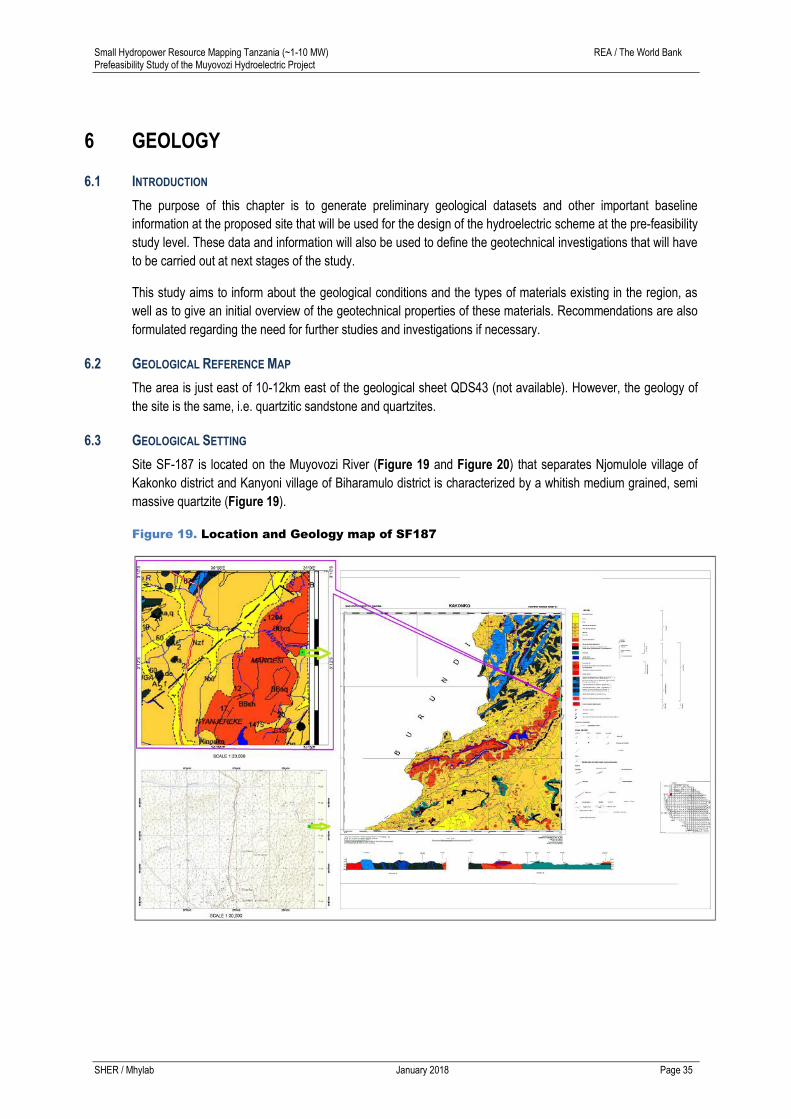
6.3 GEOLOGICAL SETTING
Site SF-187 is located on the Muyovozi River (Figure 19 and Figure 20) that separates Njomulole village of
Kakonko district and Kanyoni village of Biharamulo district is characterized by a whitish medium grained, semi
massive quartzite (Figure 19).
Figure 19. Location and Geology map of SF187

Small Hydropower Resource Mapping Tanzania (~1-10 MW) REA / The World Bank Prefeasibility Study of the Muyovozi Hydroelectric Project
SHER / Mhylab January 2018 Page 36
Figure 20. Trace of Intake (IN), canal (in light blue) and penstock and powerhouse (in
red) for site SF-187 with topographic contours
Figure 21. Quartzite outcrop on the left bank, site SF-187
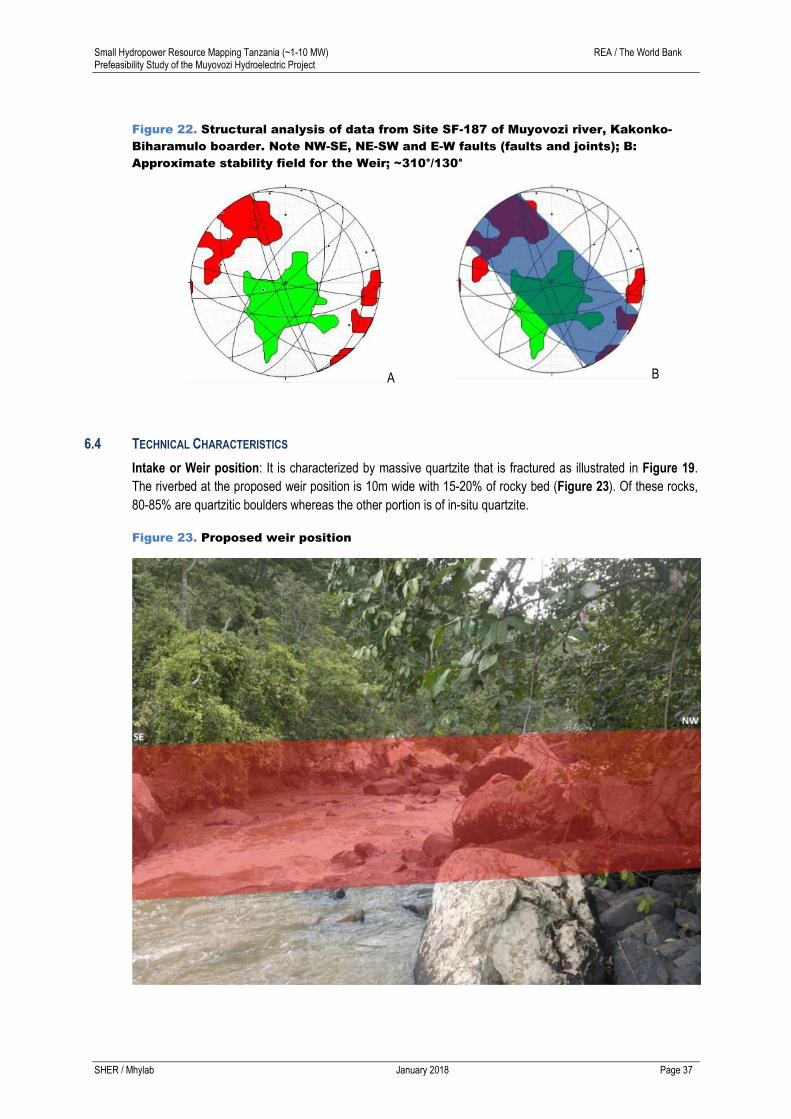
The quartzite is fractured, the fractures being mainly NW-SE and NE-SW. Few E-W structures are also present
(Figure 22).
Small Hydropower Resource Mapping Tanzania (~1-10 MW) REA / The World Bank Prefeasibility Study of the Muyovozi Hydroelectric Project
SHER / Mhylab January 2018 Page 37
Figure 22. Structural analysis of data from Site SF-187 of Muyovozi river, Kakonko-
Biharamulo boarder. Note NW-SE, NE-SW and E-W faults (faults and joints); B:
Approximate stability field for the Weir; ~310°/130°
A B
6.4 TECHNICAL CHARACTERISTICS
Intake or Weir position: It is characterized by massive quartzite that is fractured as illustrated in Figure 19.
The riverbed at the proposed weir position is 10m wide with 15-20% of rocky bed (Figure 23). Of these rocks,
80-85% are quartzitic boulders whereas the other portion is of in-situ quartzite.
Figure 23. Proposed weir position
Small Hydropower Resource Mapping Tanzania (~1-10 MW) REA / The World Bank Prefeasibility Study of the Muyovozi Hydroelectric Project
SHER / Mhylab January 2018 Page 38
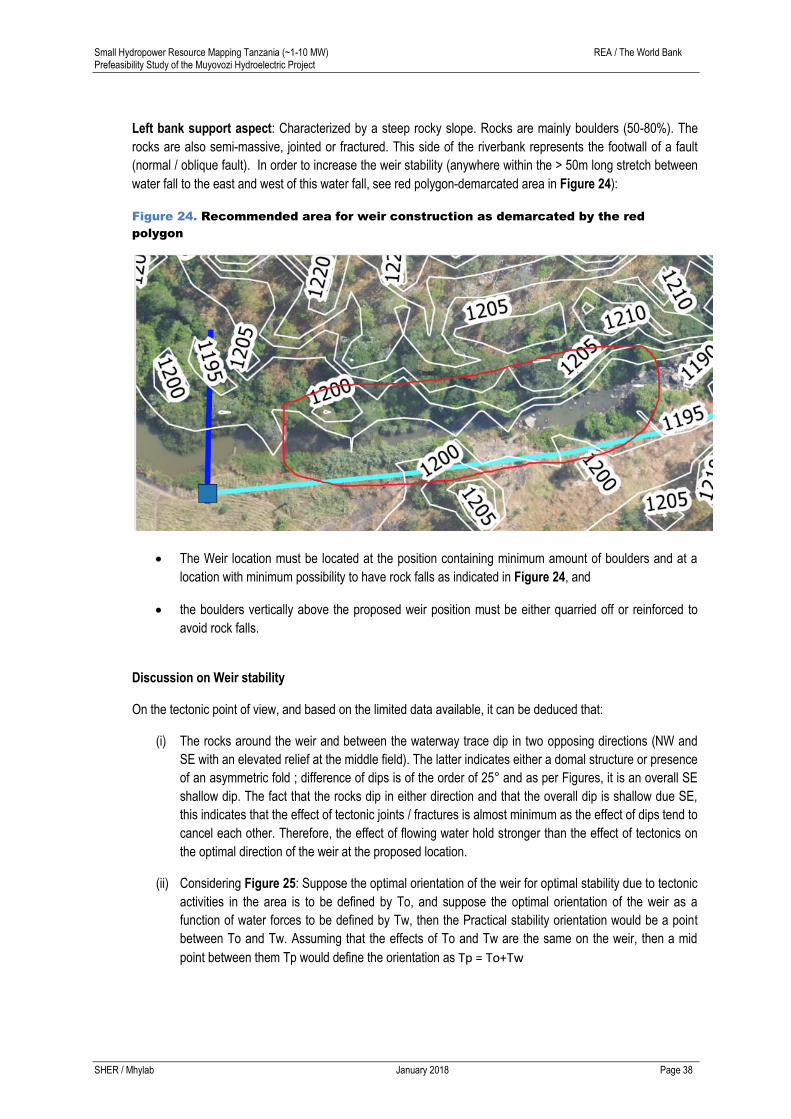
Left bank support aspect: Characterized by a steep rocky slope. Rocks are mainly boulders (50-80%). The
rocks are also semi-massive, jointed or fractured. This side of the riverbank represents the footwall of a fault
(normal / oblique fault). In order to increase the weir stability (anywhere within the > 50m long stretch between
water fall to the east and west of this water fall, see red polygon-demarcated area in Figure 24):
Figure 24. Recommended area for weir construction as demarcated by the red
polygon
The Weir location must be located at the position containing minimum amount of boulders and at a
location with minimum possibility to have rock falls as indicated in Figure 24, and
the boulders vertically above the proposed weir position must be either quarried off or reinforced to
avoid rock falls.
Discussion on Weir stability
On the tectonic point of view, and based on the limited data available, it can be deduced that:
(i) The rocks around the weir and between the waterway trace dip in two opposing directions (NW and
SE with an elevated relief at the middle field). The latter indicates either a domal structure or presence
of an asymmetric fold ; difference of dips is of the order of 25° and as per Figures, it is an overall SE
shallow dip. The fact that the rocks dip in either direction and that the overall dip is shallow due SE,
this indicates that the effect of tectonic joints / fractures is almost minimum as the effect of dips tend to
cancel each other. Therefore, the effect of flowing water hold stronger than the effect of tectonics on
the optimal direction of the weir at the proposed location.
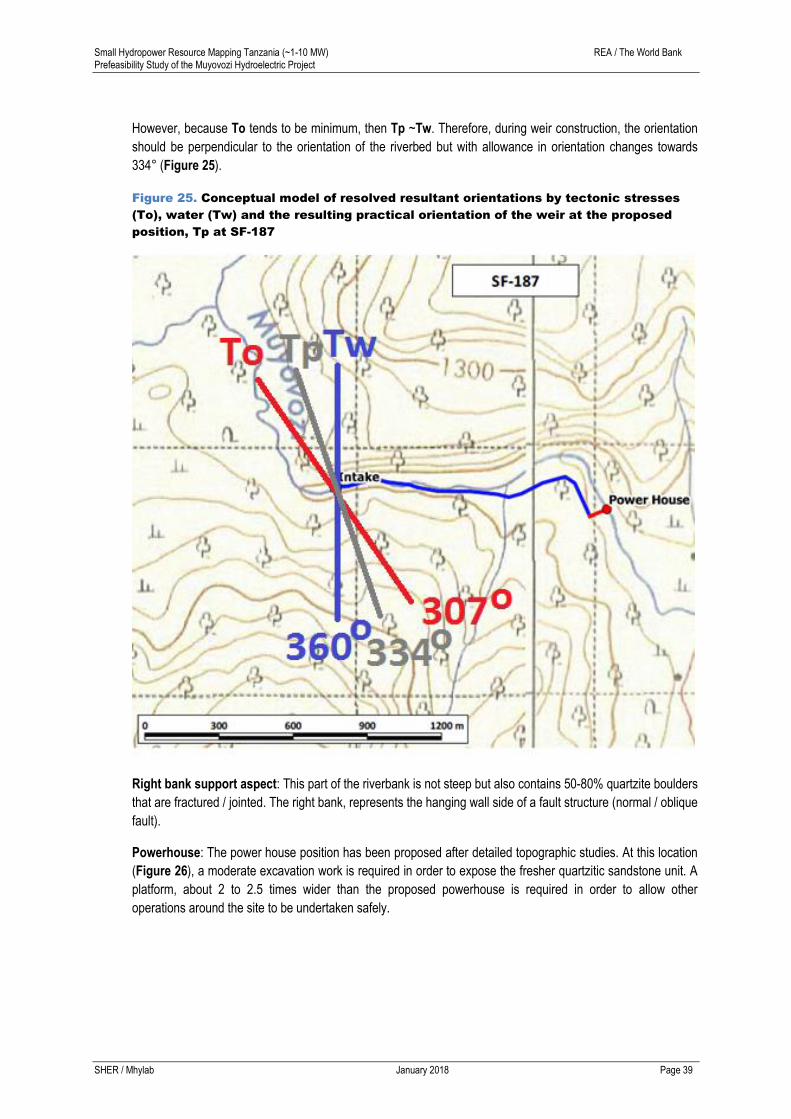
(ii) Considering Figure 25: Suppose the optimal orientation of the weir for optimal stability due to tectonic
activities in the area is to be defined by To, and suppose the optimal orientation of the weir as a
function of water forces to be defined by Tw, then the Practical stability orientation would be a point
between To and Tw. Assuming that the effects of To and Tw are the same on the weir, then a mid
point between them Tp would define the orientation as Tp = To+Tw
Small Hydropower Resource Mapping Tanzania (~1-10 MW) REA / The World Bank Prefeasibility Study of the Muyovozi Hydroelectric Project
SHER / Mhylab January 2018 Page 39
However, because To tends to be minimum, then Tp ~Tw. Therefore, during weir construction, the orientation
should be perpendicular to the orientation of the riverbed but with allowance in orientation changes towards
334° (Figure 25).
Figure 25. Conceptual model of resolved resultant orientations by tectonic stresses
(To), water (Tw) and the resulting practical orientation of the weir at the proposed
position, Tp at SF-187
Right bank support aspect: This part of the riverbank is not steep but also contains 50-80% quartzite boulders
that are fractured / jointed. The right bank, represents the hanging wall side of a fault structure (normal / oblique
fault).
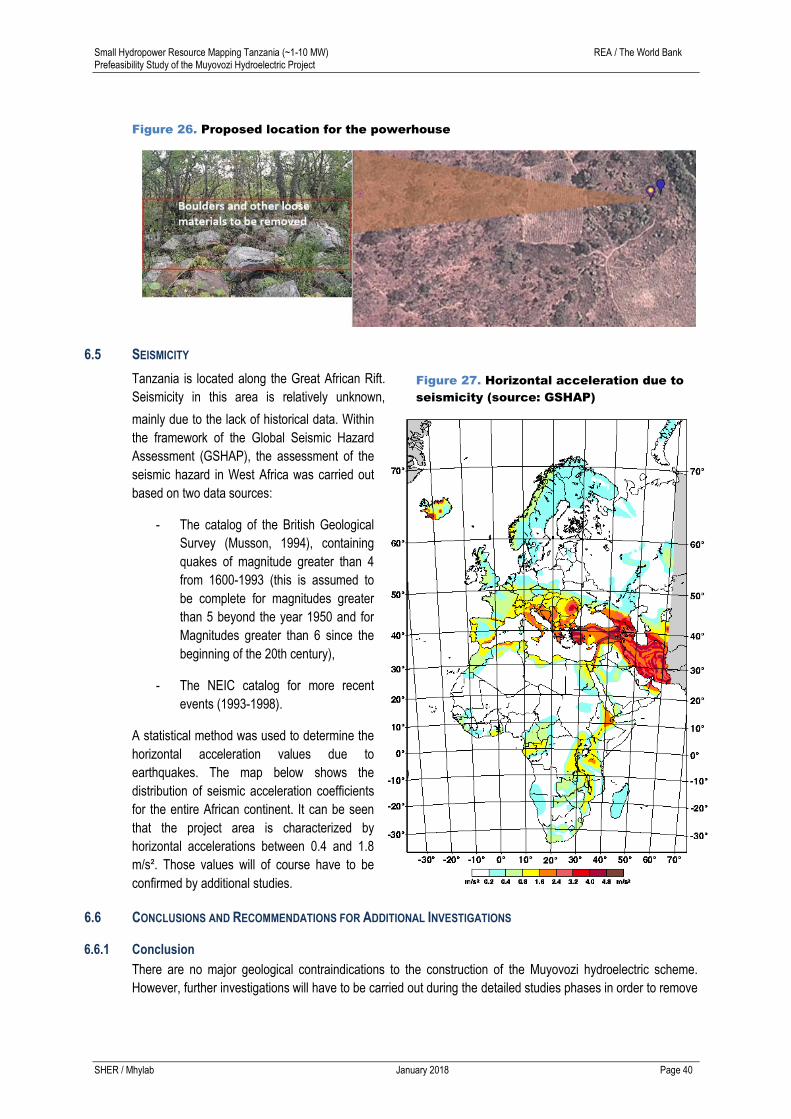
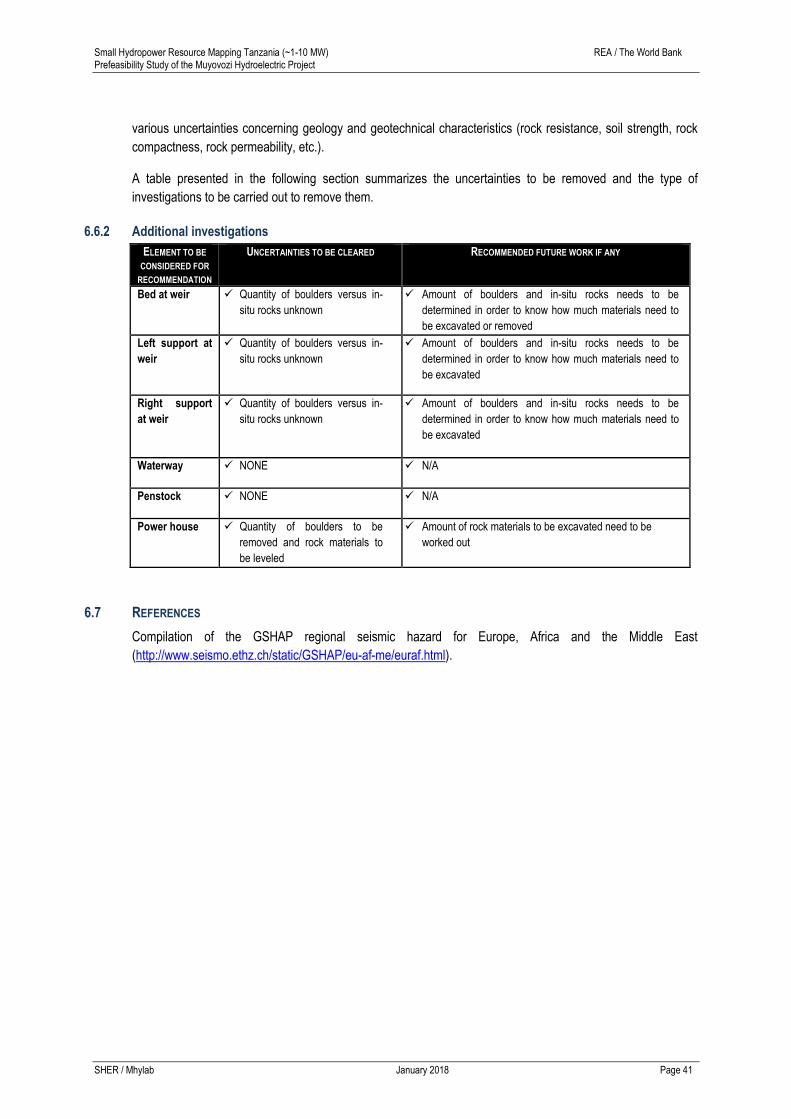
Powerhouse: The power house position has been proposed after detailed topographic studies. At this location
(Figure 26), a moderate excavation work is required in order to expose the fresher quartzitic sandstone unit. A
platform, about 2 to 2.5 times wider than the proposed powerhouse is required in order to allow other
operations around the site to be undertaken safely.
Small Hydropower Resource Mapping Tanzania (~1-10 MW) REA / The World Bank Prefeasibility Study of the Muyovozi Hydroelectric Project
SHER / Mhylab January 2018 Page 40
Figure 26. Proposed location for the powerhouse
6.5 SEISMICITY
Tanzania is located along the Great African Rift.
Seismicity in this area is relatively unknown,
mainly due to the lack of historical data. Within
the framework of the Global Seismic Hazard
Assessment (GSHAP), the assessment of the
seismic hazard in West Africa was carried out
based on two data sources:
- The catalog of the British Geological
Survey (Musson, 1994), containing
quakes of magnitude greater than 4
from 1600-1993 (this is assumed to
be complete for magnitudes greater
than 5 beyond the year 1950 and for
Magnitudes greater than 6 since the
beginning of the 20th century),
- The NEIC catalog for more recent
events (1993-1998).
A statistical method was used to determine the
horizontal acceleration values due to
earthquakes. The map below shows the
distribution of seismic acceleration coefficients
for the entire African continent. It can be seen
that the project area is characterized by
horizontal accelerations between 0.4 and 1.8
m/s². Those values will of course have to be
confirmed by additional studies.
6.6 CONCLUSIONS AND RECOMMENDATIONS FOR ADDITIONAL INVESTIGATIONS
6.6.1 Conclusion
There are no major geological contraindications to the construction of the Muyovozi hydroelectric scheme.
However, further investigations will have to be carried out during the detailed studies phases in order to remove
Figure 27. Horizontal acceleration due to
seismicity (source: GSHAP)
Small Hydropower Resource Mapping Tanzania (~1-10 MW) REA / The World Bank Prefeasibility Study of the Muyovozi Hydroelectric Project
SHER / Mhylab January 2018 Page 41
various uncertainties concerning geology and geotechnical characteristics (rock resistance, soil strength, rock
compactness, rock permeability, etc.).
A table presented in the following section summarizes the uncertainties to be removed and the type of
investigations to be carried out to remove them.
6.6.2 Additional investigations
ELEMENT TO BE
CONSIDERED FOR
RECOMMENDATION
UNCERTAINTIES TO BE CLEARED RECOMMENDED FUTURE WORK IF ANY
Bed at weir Quantity of boulders versus in-
situ rocks unknown
Amount of boulders and in-situ rocks needs to be
determined in order to know how much materials need to
be excavated or removed
Left support at
weir
Quantity of boulders versus in-
situ rocks unknown
Amount of boulders and in-situ rocks needs to be
determined in order to know how much materials need to
be excavated
Right support
at weir
Quantity of boulders versus in-
situ rocks unknown
Amount of boulders and in-situ rocks needs to be
determined in order to know how much materials need to
be excavated
Waterway NONE N/A
Penstock NONE N/A
Power house Quantity of boulders to be
removed and rock materials to
be leveled
Amount of rock materials to be excavated need to be
worked out
6.7 REFERENCES
Compilation of the GSHAP regional seismic hazard for Europe, Africa and the Middle East
(http://www.seismo.ethz.ch/static/GSHAP/eu-af-me/euraf.html).
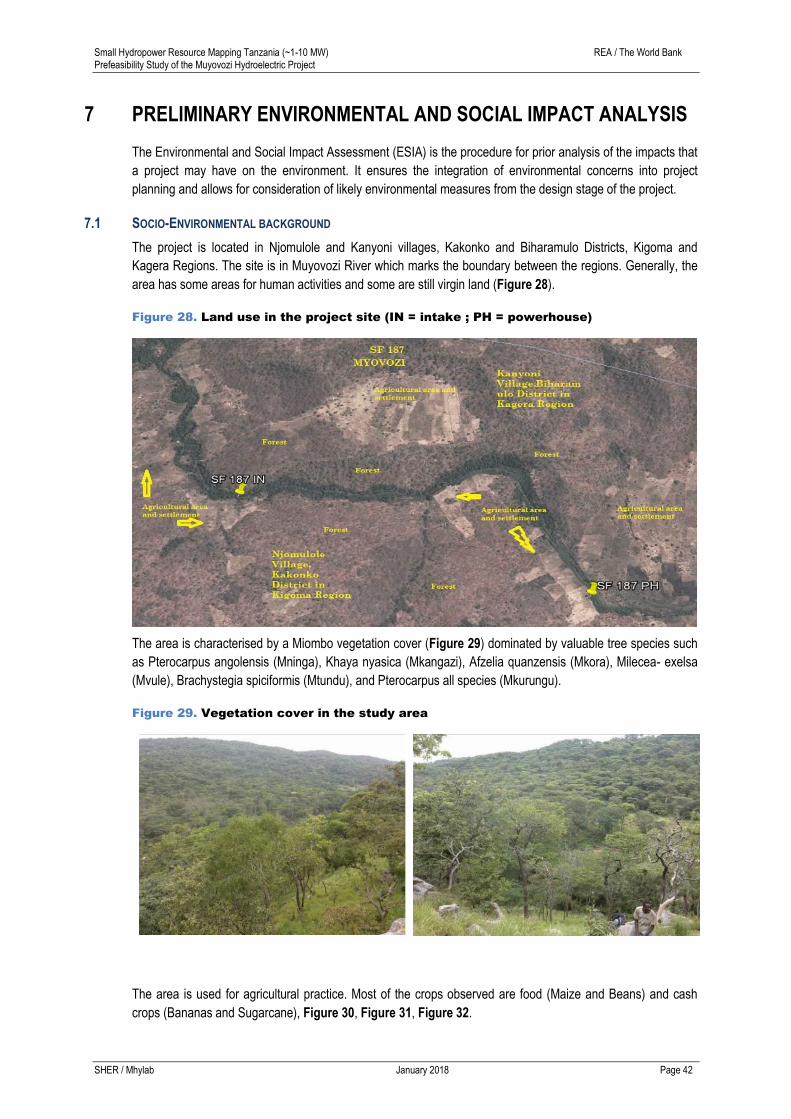
Small Hydropower Resource Mapping Tanzania (~1-10 MW) REA / The World Bank Prefeasibility Study of the Muyovozi Hydroelectric Project
SHER / Mhylab January 2018 Page 42
7 PRELIMINARY ENVIRONMENTAL AND SOCIAL IMPACT ANALYSIS
The Environmental and Social Impact Assessment (ESIA) is the procedure for prior analysis of the impacts that
a project may have on the environment. It ensures the integration of environmental concerns into project
planning and allows for consideration of likely environmental measures from the design stage of the project.
7.1 SOCIO-ENVIRONMENTAL BACKGROUND
The project is located in Njomulole and Kanyoni villages, Kakonko and Biharamulo Districts, Kigoma and
Kagera Regions. The site is in Muyovozi River which marks the boundary between the regions. Generally, the
area has some areas for human activities and some are still virgin land (Figure 28).
Figure 28. Land use in the project site (IN = intake ; PH = powerhouse)
The area is characterised by a Miombo vegetation cover (Figure 29) dominated by valuable tree species such
as Pterocarpus angolensis (Mninga), Khaya nyasica (Mkangazi), Afzelia quanzensis (Mkora), Milecea- exelsa
(Mvule), Brachystegia spiciformis (Mtundu), and Pterocarpus all species (Mkurungu).
Figure 29. Vegetation cover in the study area
The area is used for agricultural practice. Most of the crops observed are food (Maize and Beans) and cash
crops (Bananas and Sugarcane), Figure 30, Figure 31, Figure 32.
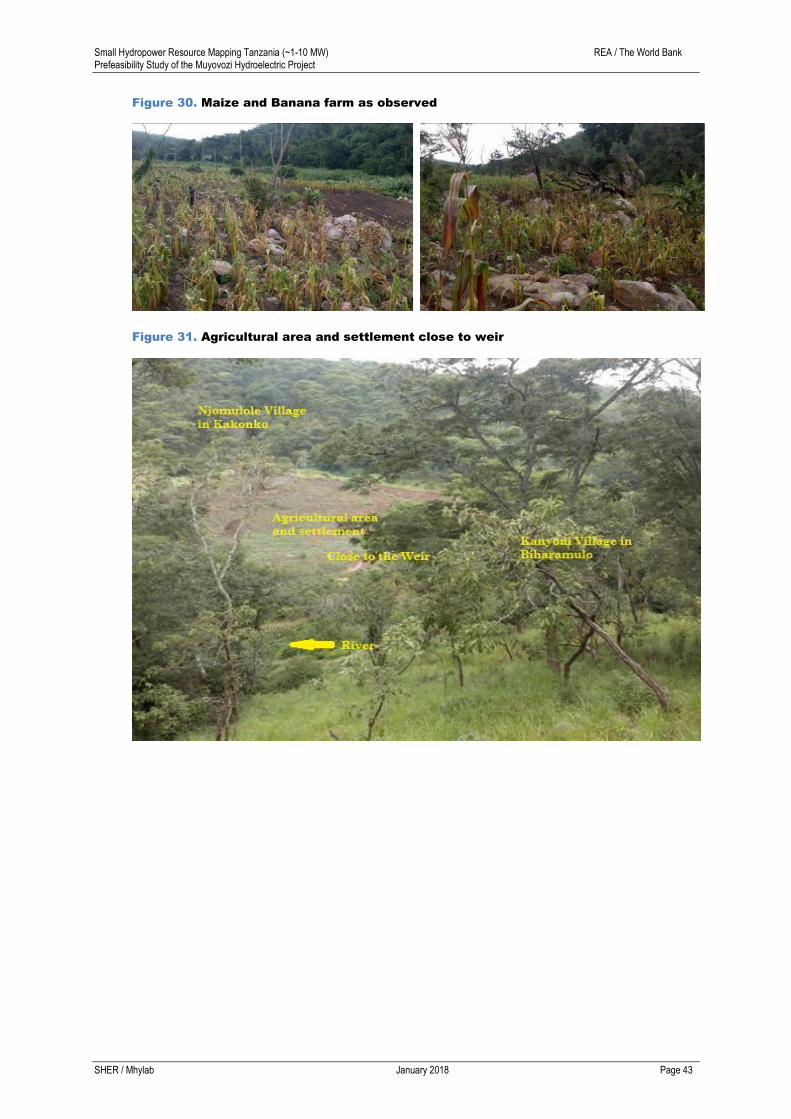
Small Hydropower Resource Mapping Tanzania (~1-10 MW) REA / The World Bank Prefeasibility Study of the Muyovozi Hydroelectric Project
SHER / Mhylab January 2018 Page 43
Figure 30. Maize and Banana farm as observed
Figure 31. Agricultural area and settlement close to weir
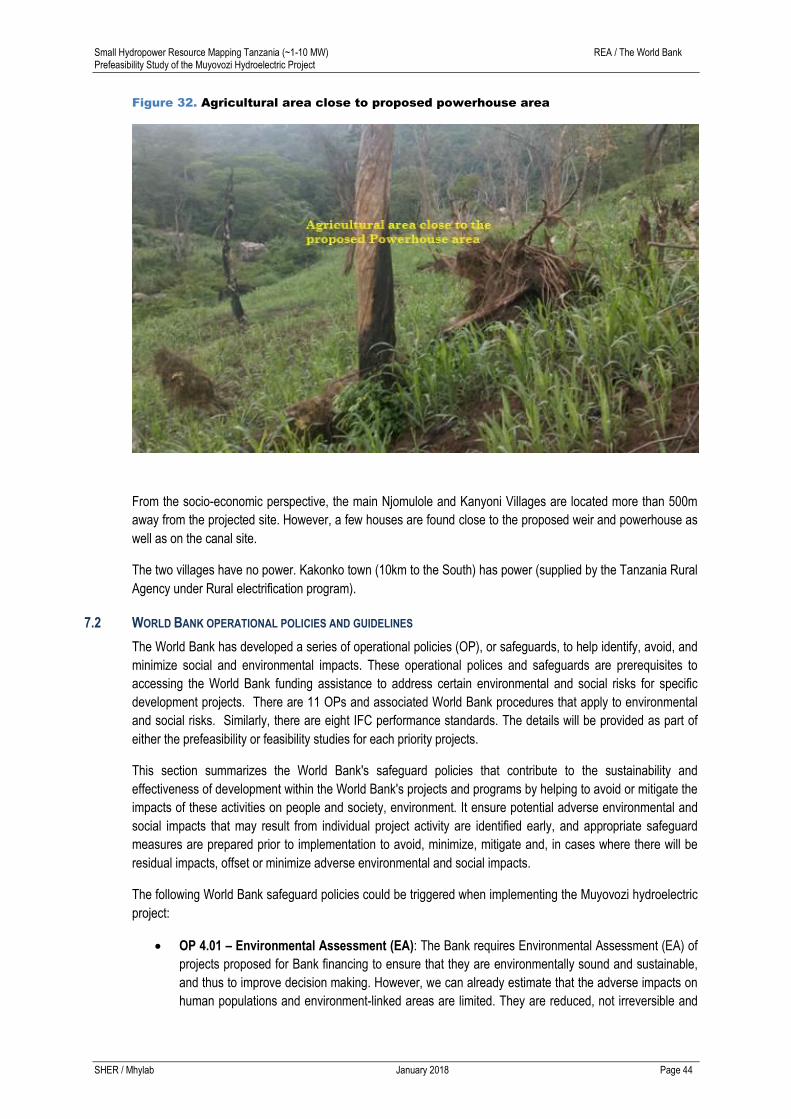
Small Hydropower Resource Mapping Tanzania (~1-10 MW) REA / The World Bank Prefeasibility Study of the Muyovozi Hydroelectric Project
SHER / Mhylab January 2018 Page 44
Figure 32. Agricultural area close to proposed powerhouse area
From the socio-economic perspective, the main Njomulole and Kanyoni Villages are located more than 500m
away from the projected site. However, a few houses are found close to the proposed weir and powerhouse as
well as on the canal site.
The two villages have no power. Kakonko town (10km to the South) has power (supplied by the Tanzania Rural
Agency under Rural electrification program).
7.2 WORLD BANK OPERATIONAL POLICIES AND GUIDELINES
The World Bank has developed a series of operational policies (OP), or safeguards, to help identify, avoid, and
minimize social and environmental impacts. These operational polices and safeguards are prerequisites to
accessing the World Bank funding assistance to address certain environmental and social risks for specific
development projects. There are 11 OPs and associated World Bank procedures that apply to environmental
and social risks. Similarly, there are eight IFC performance standards. The details will be provided as part of
either the prefeasibility or feasibility studies for each priority projects.
This section summarizes the World Bank's safeguard policies that contribute to the sustainability and
effectiveness of development within the World Bank's projects and programs by helping to avoid or mitigate the
impacts of these activities on people and society, environment. It ensure potential adverse environmental and
social impacts that may result from individual project activity are identified early, and appropriate safeguard
measures are prepared prior to implementation to avoid, minimize, mitigate and, in cases where there will be
residual impacts, offset or minimize adverse environmental and social impacts.
The following World Bank safeguard policies could be triggered when implementing the Muyovozi hydroelectric
project:
OP 4.01 – Environmental Assessment (EA): The Bank requires Environmental Assessment (EA) of
projects proposed for Bank financing to ensure that they are environmentally sound and sustainable,
and thus to improve decision making. However, we can already estimate that the adverse impacts on
human populations and environment-linked areas are limited. They are reduced, not irreversible and

Small Hydropower Resource Mapping Tanzania (~1-10 MW) REA / The World Bank Prefeasibility Study of the Muyovozi Hydroelectric Project
SHER / Mhylab January 2018 Page 45
some measures can prevent, mitigate or minimize them. Moreover, these measures can improve the
environmental performance.
OP 4.12 – Involuntary Resettlement: The project needs new use of some areas (implementation of
the plant, renovation of the access roads to the site…) that can be crop zones.
The projected weir (3m high) is classified as a small dam (<15m high); the usual generic safety measures for
dams are appropriate and do not need the implementation of OP 4.37 – Safety of Dams (for large dams).
The triggering process of the policies will be completed by the World Bank during dedicated projects appraisal.
7.3 SOCIO-ENVIRONMENTAL CONSTRAINTS
Overall, the project does not feature any major environmental or social constraints that cannot be mitigated by
appropriate measures and that would jeopardize its development.
Some hamlets are situated in the vicinity of the proposed scheme (weir, canal, penstock pipes and
powerhouse). Potential impacts (noise, traffic, atmospheric emissions) on the riparians during the construction
phase will have to be mitigated by appropriate measures.
Overall, the development of the project will lead to positive externalities by the use of local labor during the
construction phase, increase local skills and bring electricity to local communities that will eventually foster local
economic development.
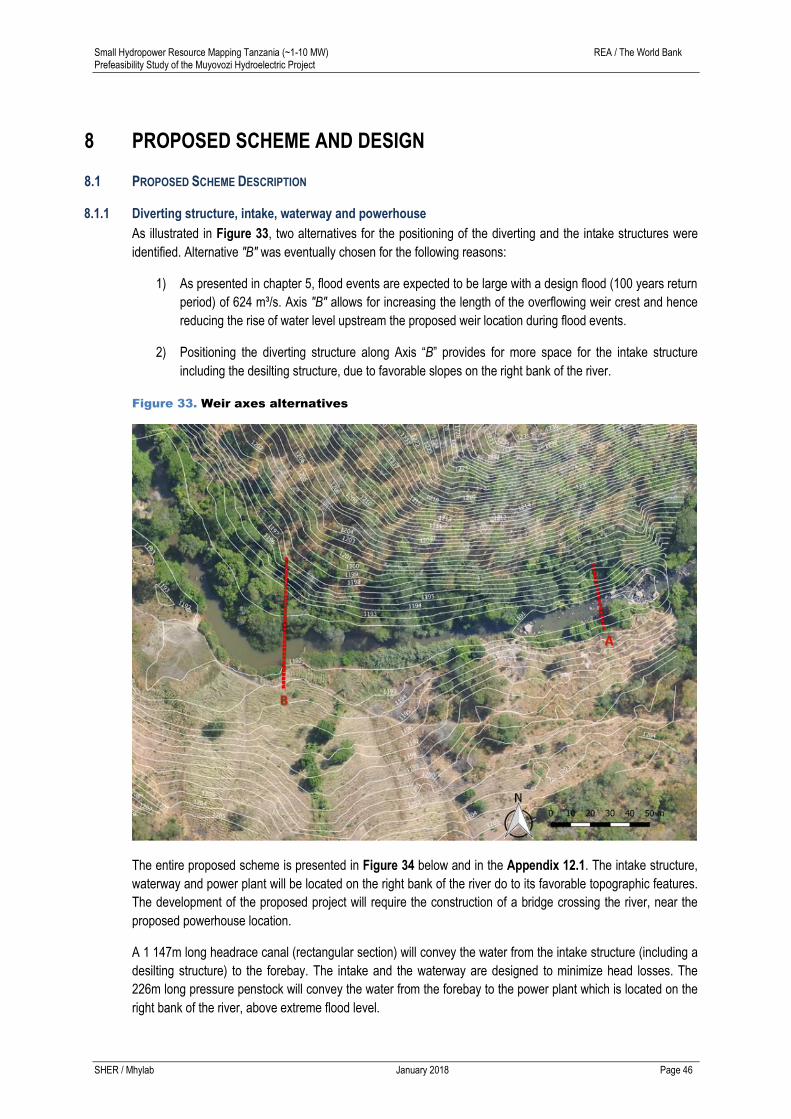
Small Hydropower Resource Mapping Tanzania (~1-10 MW) REA / The World Bank Prefeasibility Study of the Muyovozi Hydroelectric Project
SHER / Mhylab January 2018 Page 46
8 PROPOSED SCHEME AND DESIGN
8.1 PROPOSED SCHEME DESCRIPTION
8.1.1 Diverting structure, intake, waterway and powerhouse
As illustrated in Figure 33, two alternatives for the positioning of the diverting and the intake structures were
identified. Alternative "B" was eventually chosen for the following reasons:
1) As presented in chapter 5, flood events are expected to be large with a design flood (100 years return
period) of 624 m³/s. Axis "B" allows for increasing the length of the overflowing weir crest and hence
reducing the rise of water level upstream the proposed weir location during flood events.
2) Positioning the diverting structure along Axis “B” provides for more space for the intake structure
including the desilting structure, due to favorable slopes on the right bank of the river.
Figure 33. Weir axes alternatives
The entire proposed scheme is presented in Figure 34 below and in the Appendix 12.1. The intake structure,
waterway and power plant will be located on the right bank of the river do to its favorable topographic features.
The development of the proposed project will require the construction of a bridge crossing the river, near the
proposed powerhouse location.
A 1 147m long headrace canal (rectangular section) will convey the water from the intake structure (including a
desilting structure) to the forebay. The intake and the waterway are designed to minimize head losses. The
226m long pressure penstock will convey the water from the forebay to the power plant which is located on the
right bank of the river, above extreme flood level.
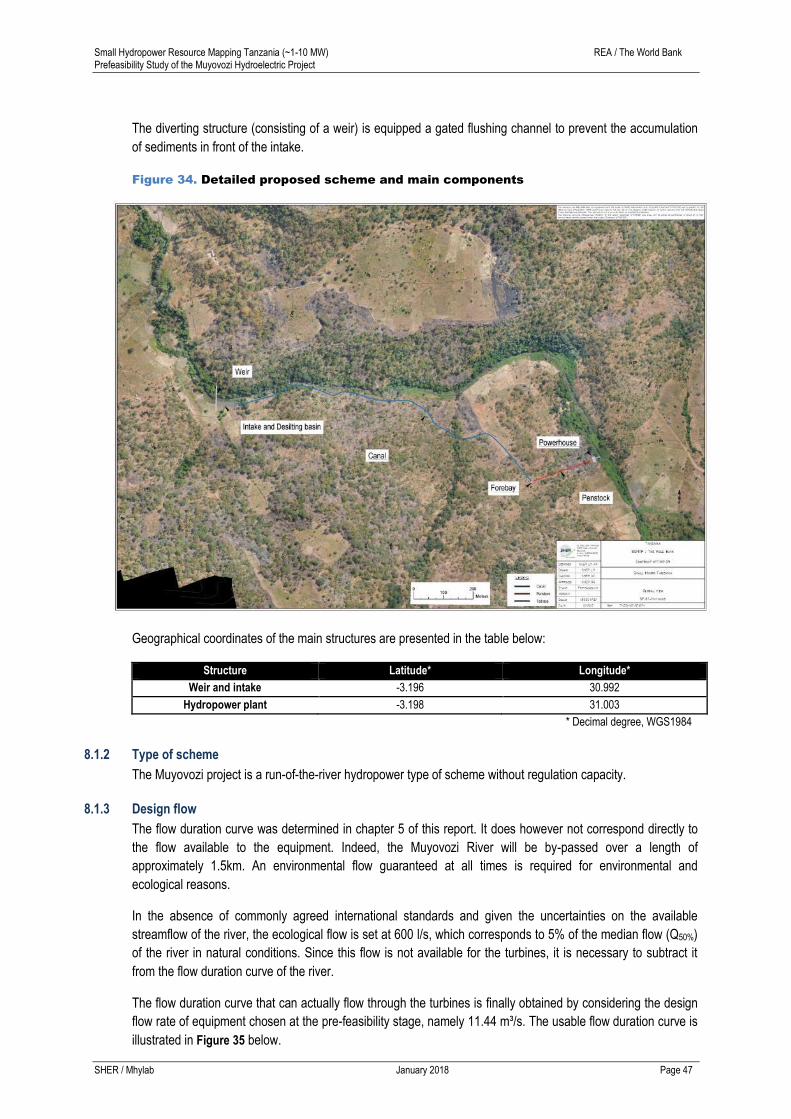
Small Hydropower Resource Mapping Tanzania (~1-10 MW) REA / The World Bank Prefeasibility Study of the Muyovozi Hydroelectric Project
SHER / Mhylab January 2018 Page 47
The diverting structure (consisting of a weir) is equipped a gated flushing channel to prevent the accumulation
of sediments in front of the intake.
Figure 34. Detailed proposed scheme and main components
Geographical coordinates of the main structures are presented in the table below:
Structure Latitude* Longitude*
Weir and intake -3.196 30.992
Hydropower plant -3.198 31.003
* Decimal degree, WGS1984
8.1.2 Type of scheme
The Muyovozi project is a run-of-the-river hydropower type of scheme without regulation capacity.
8.1.3 Design flow
The flow duration curve was determined in chapter 5 of this report. It does however not correspond directly to
the flow available to the equipment. Indeed, the Muyovozi River will be by-passed over a length of
approximately 1.5km. An environmental flow guaranteed at all times is required for environmental and
ecological reasons.
In the absence of commonly agreed international standards and given the uncertainties on the available
streamflow of the river, the ecological flow is set at 600 l/s, which corresponds to 5% of the median flow (Q50%)
of the river in natural conditions. Since this flow is not available for the turbines, it is necessary to subtract it
from the flow duration curve of the river.
The flow duration curve that can actually flow through the turbines is finally obtained by considering the design
flow rate of equipment chosen at the pre-feasibility stage, namely 11.44 m³/s. The usable flow duration curve is
illustrated in Figure 35 below.
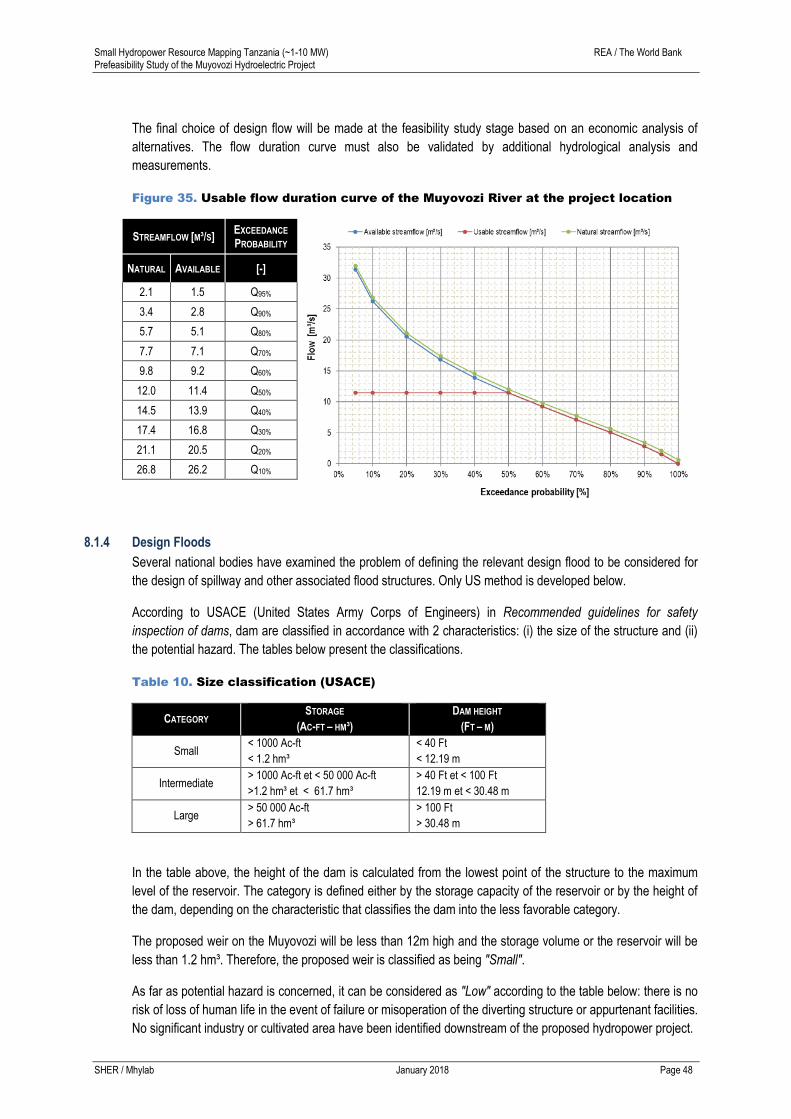
Small Hydropower Resource Mapping Tanzania (~1-10 MW) REA / The World Bank Prefeasibility Study of the Muyovozi Hydroelectric Project
SHER / Mhylab January 2018 Page 48
The final choice of design flow will be made at the feasibility study stage based on an economic analysis of
alternatives. The flow duration curve must also be validated by additional hydrological analysis and
measurements.
Figure 35. Usable flow duration curve of the Muyovozi River at the project location
STREAMFLOW [M³/S] EXCEEDANCE
PROBABILITY
NATURAL AVAILABLE [-]
2.1 1.5 Q95%
3.4 2.8 Q90%
5.7 5.1 Q80%
7.7 7.1 Q70%
9.8 9.2 Q60%
12.0 11.4 Q50%
14.5 13.9 Q40%
17.4 16.8 Q30%
21.1 20.5 Q20%
26.8 26.2 Q10%
8.1.4 Design Floods
Several national bodies have examined the problem of defining the relevant design flood to be considered for
the design of spillway and other associated flood structures. Only US method is developed below.
According to USACE (United States Army Corps of Engineers) in Recommended guidelines for safety
inspection of dams, dam are classified in accordance with 2 characteristics: (i) the size of the structure and (ii)
the potential hazard. The tables below present the classifications.
Table 10. Size classification (USACE)
CATEGORY STORAGE
(AC-FT – HM³)
DAM HEIGHT
(FT – M)
Small < 1000 Ac-ft
< 1.2 hm³
< 40 Ft
< 12.19 m
Intermediate > 1000 Ac-ft et < 50 000 Ac-ft
>1.2 hm³ et < 61.7 hm³
> 40 Ft et < 100 Ft
12.19 m et < 30.48 m
Large > 50 000 Ac-ft
> 61.7 hm³
> 100 Ft
> 30.48 m
In the table above, the height of the dam is calculated from the lowest point of the structure to the maximum
level of the reservoir. The category is defined either by the storage capacity of the reservoir or by the height of
the dam, depending on the characteristic that classifies the dam into the less favorable category.
The proposed weir on the Muyovozi will be less than 12m high and the storage volume or the reservoir will be
less than 1.2 hm³. Therefore, the proposed weir is classified as being "Small".
As far as potential hazard is concerned, it can be considered as "Low" according to the table below: there is no
risk of loss of human life in the event of failure or misoperation of the diverting structure or appurtenant facilities.
No significant industry or cultivated area have been identified downstream of the proposed hydropower project.
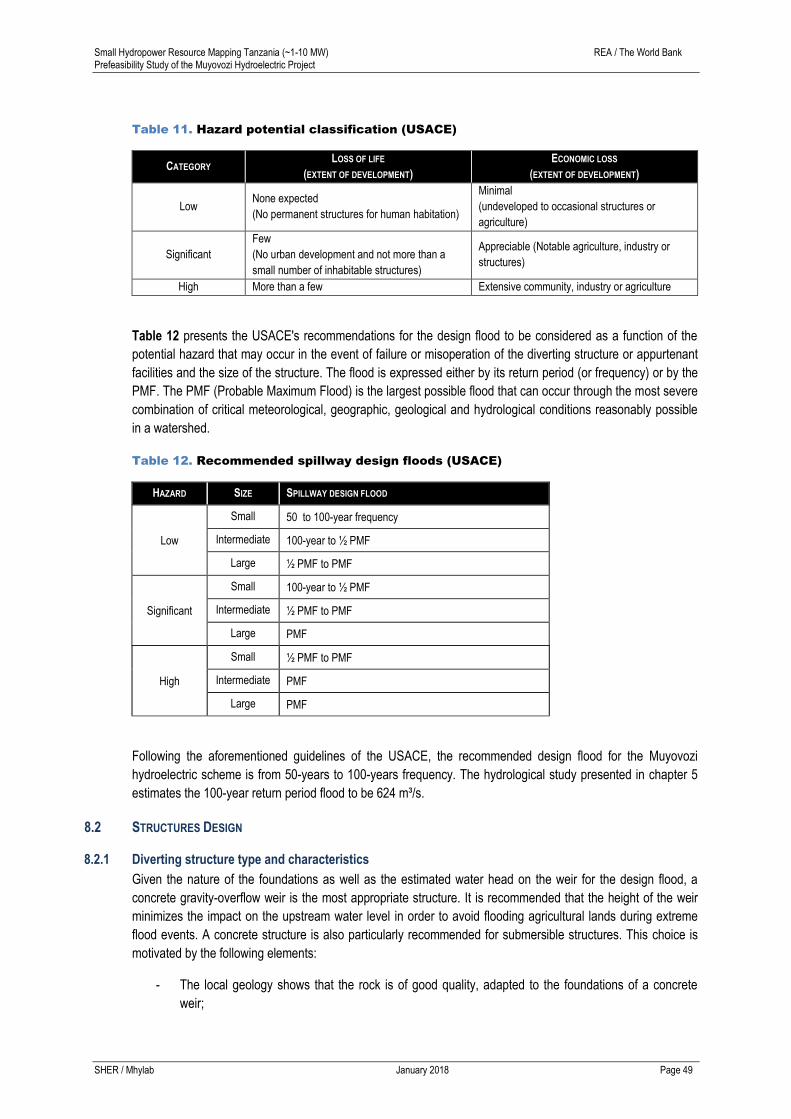
Small Hydropower Resource Mapping Tanzania (~1-10 MW) REA / The World Bank Prefeasibility Study of the Muyovozi Hydroelectric Project
SHER / Mhylab January 2018 Page 49
Table 11. Hazard potential classification (USACE)
CATEGORY LOSS OF LIFE
(EXTENT OF DEVELOPMENT)
ECONOMIC LOSS
(EXTENT OF DEVELOPMENT)
Low None expected
(No permanent structures for human habitation)
Minimal
(undeveloped to occasional structures or
agriculture)
Significant
Few
(No urban development and not more than a
small number of inhabitable structures)
Appreciable (Notable agriculture, industry or
structures)
High More than a few Extensive community, industry or agriculture
Table 12 presents the USACE's recommendations for the design flood to be considered as a function of the
potential hazard that may occur in the event of failure or misoperation of the diverting structure or appurtenant
facilities and the size of the structure. The flood is expressed either by its return period (or frequency) or by the
PMF. The PMF (Probable Maximum Flood) is the largest possible flood that can occur through the most severe
combination of critical meteorological, geographic, geological and hydrological conditions reasonably possible
in a watershed.
Table 12. Recommended spillway design floods (USACE)
HAZARD SIZE SPILLWAY DESIGN FLOOD
Low
Small 50 to 100-year frequency
Intermediate 100-year to ½ PMF
Large ½ PMF to PMF
Significant
Small 100-year to ½ PMF
Intermediate ½ PMF to PMF
Large PMF
High
Small ½ PMF to PMF
Intermediate PMF
Large PMF
Following the aforementioned guidelines of the USACE, the recommended design flood for the Muyovozi
hydroelectric scheme is from 50-years to 100-years frequency. The hydrological study presented in chapter 5
estimates the 100-year return period flood to be 624 m³/s.
8.2 STRUCTURES DESIGN
8.2.1 Diverting structure type and characteristics
Given the nature of the foundations as well as the estimated water head on the weir for the design flood, a
concrete gravity-overflow weir is the most appropriate structure. It is recommended that the height of the weir
minimizes the impact on the upstream water level in order to avoid flooding agricultural lands during extreme
flood events. A concrete structure is also particularly recommended for submersible structures. This choice is
motivated by the following elements:
- The local geology shows that the rock is of good quality, adapted to the foundations of a concrete
weir;
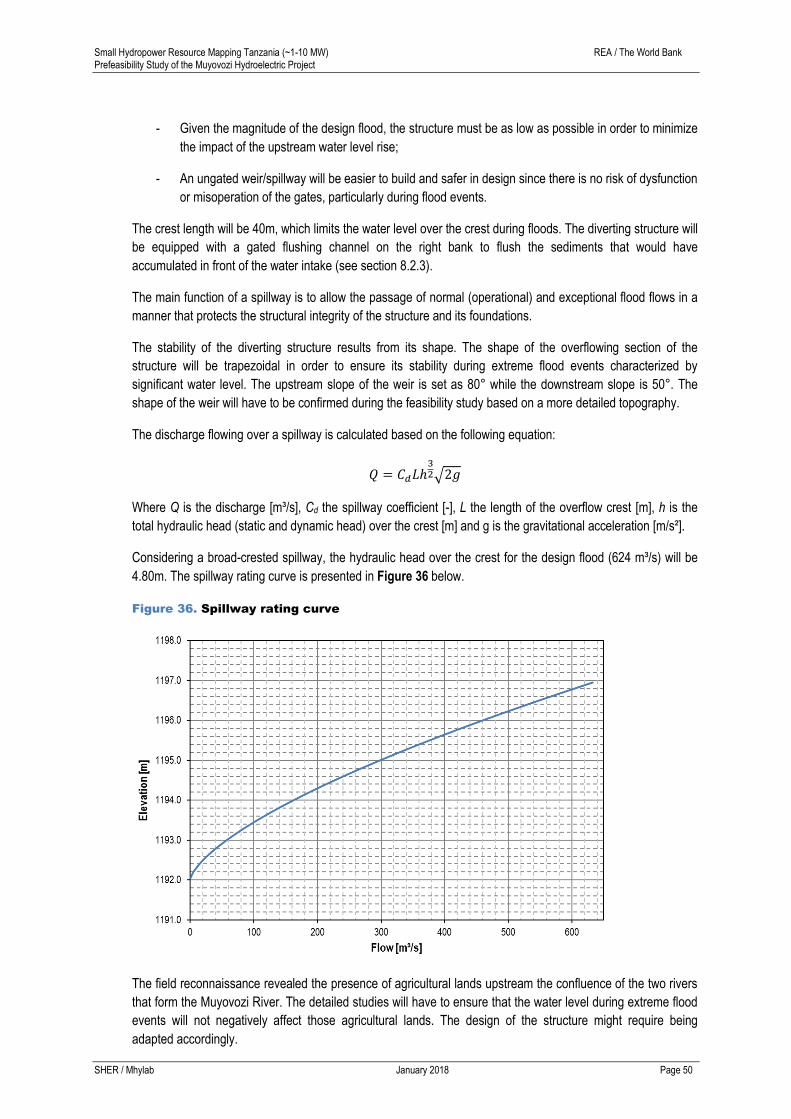
Small Hydropower Resource Mapping Tanzania (~1-10 MW) REA / The World Bank Prefeasibility Study of the Muyovozi Hydroelectric Project
SHER / Mhylab January 2018 Page 50
- Given the magnitude of the design flood, the structure must be as low as possible in order to minimize
the impact of the upstream water level rise;
- An ungated weir/spillway will be easier to build and safer in design since there is no risk of dysfunction
or misoperation of the gates, particularly during flood events.
The crest length will be 40m, which limits the water level over the crest during floods. The diverting structure will
be equipped with a gated flushing channel on the right bank to flush the sediments that would have
accumulated in front of the water intake (see section 8.2.3).
The main function of a spillway is to allow the passage of normal (operational) and exceptional flood flows in a
manner that protects the structural integrity of the structure and its foundations.
The stability of the diverting structure results from its shape. The shape of the overflowing section of the
structure will be trapezoidal in order to ensure its stability during extreme flood events characterized by
significant water level. The upstream slope of the weir is set as 80° while the downstream slope is 50°. The
shape of the weir will have to be confirmed during the feasibility study based on a more detailed topography.
The discharge flowing over a spillway is calculated based on the following equation:
𝑄 = 𝐶𝑑𝐿ℎ32√2𝑔
Where Q is the discharge [m³/s], Cd the spillway coefficient [-], L the length of the overflow crest [m], h is the
total hydraulic head (static and dynamic head) over the crest [m] and g is the gravitational acceleration [m/s²].
Considering a broad-crested spillway, the hydraulic head over the crest for the design flood (624 m³/s) will be
4.80m. The spillway rating curve is presented in Figure 36 below.
Figure 36. Spillway rating curve
The field reconnaissance revealed the presence of agricultural lands upstream the confluence of the two rivers
that form the Muyovozi River. The detailed studies will have to ensure that the water level during extreme flood
events will not negatively affect those agricultural lands. The design of the structure might require being
adapted accordingly.
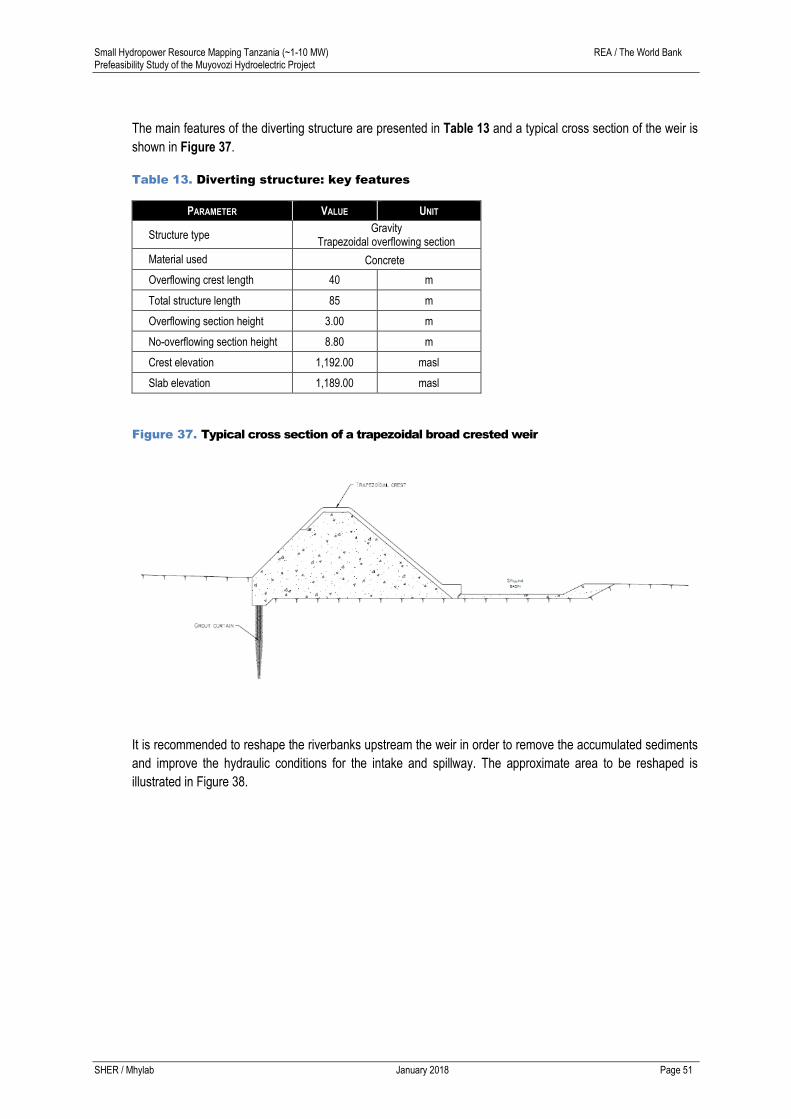
Small Hydropower Resource Mapping Tanzania (~1-10 MW) REA / The World Bank Prefeasibility Study of the Muyovozi Hydroelectric Project
SHER / Mhylab January 2018 Page 51
The main features of the diverting structure are presented in Table 13 and a typical cross section of the weir is
shown in Figure 37.
Table 13. Diverting structure: key features
PARAMETER VALUE UNIT
Structure type Gravity
Trapezoidal overflowing section
Material used Concrete
Overflowing crest length 40 m
Total structure length 85 m
Overflowing section height 3.00 m
No-overflowing section height 8.80 m
Crest elevation 1,192.00 masl
Slab elevation 1,189.00 masl
Figure 37. Typical cross section of a trapezoidal broad crested weir
It is recommended to reshape the riverbanks upstream the weir in order to remove the accumulated sediments
and improve the hydraulic conditions for the intake and spillway. The approximate area to be reshaped is
illustrated in Figure 38.
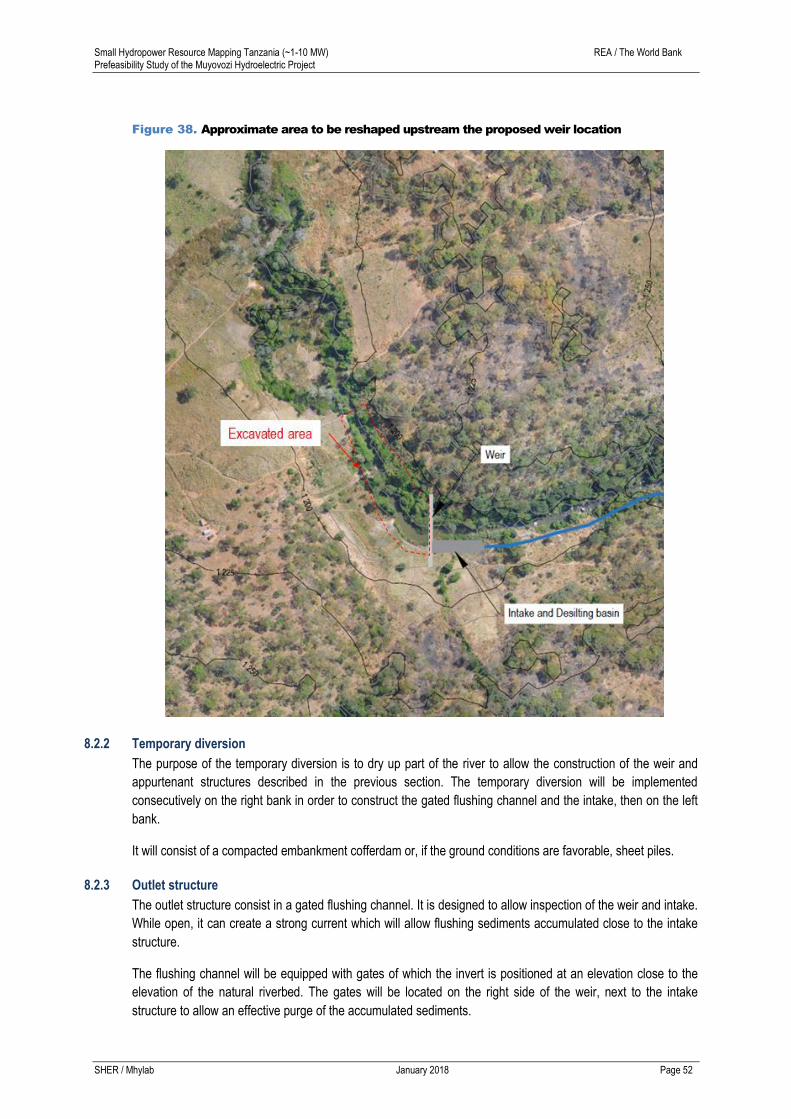
Small Hydropower Resource Mapping Tanzania (~1-10 MW) REA / The World Bank Prefeasibility Study of the Muyovozi Hydroelectric Project
SHER / Mhylab January 2018 Page 52
Figure 38. Approximate area to be reshaped upstream the proposed weir location
8.2.2 Temporary diversion
The purpose of the temporary diversion is to dry up part of the river to allow the construction of the weir and
appurtenant structures described in the previous section. The temporary diversion will be implemented
consecutively on the right bank in order to construct the gated flushing channel and the intake, then on the left
bank.
It will consist of a compacted embankment cofferdam or, if the ground conditions are favorable, sheet piles.
8.2.3 Outlet structure
The outlet structure consist in a gated flushing channel. It is designed to allow inspection of the weir and intake.
While open, it can create a strong current which will allow flushing sediments accumulated close to the intake
structure.
The flushing channel will be equipped with gates of which the invert is positioned at an elevation close to the
elevation of the natural riverbed. The gates will be located on the right side of the weir, next to the intake
structure to allow an effective purge of the accumulated sediments.
Small Hydropower Resource Mapping Tanzania (~1-10 MW) REA / The World Bank Prefeasibility Study of the Muyovozi Hydroelectric Project
SHER / Mhylab January 2018 Page 53
The number of bays and their size were calculated to ensure outflow corresponding to twice the median
streamflow of the river (24 m³/s). This objective is achieved with the installation of two 1.60m wide and 2.00m
high radial gates.
Table 14. Gated flushing channel characteristics
PARAMETER UNIT VALUE
Invert elevation m 1189
Number of bays - 2
Width m 1.60
Height m 2.00
8.2.4 Waterway
8.2.4.1 Intake structure
The intake will be located on the right bank in the continuity of the weir.
The intake will be equipped with a screen and an automatic screen cleaning system upstream of the intake
gates, to prevent floating debris or large stones from obstructing the intake gates. The section of the bars and
their spacing will be determined at the feasibility study stage. A flushing gate will be installed at the end of the
transition zone from the intake structure to the desilting structure to allow for the removal of sediments that
would have entered the intake.
The intake is designed taking into account the following constraints:
- The invert elevation will be set at least 0.50m above the invert of the flushing channel gates;
- The velocity of water at the entrance of the screen should not be greater than 0.7 m/s to minimize
turbulence and facilitate screening of debris. That will also minimize head losses.
Hence, the intake will consist of 4 bays of 2.10m wide and 2.50m high, followed by a free inlet that will guide the
current lines gradually towards the desilting structure. The invert of the intake will be set at elevation 1189.50m.
Details are presented in Table 15 below.
Table 15. Intake characteristics
PARAMETER UNIT VALUE
Intake invert elevation m 1189.5
Intake top elevation m 1193.0
Screen inclination ° 15
Design flow m³/s 11.4
Number of bays - 4
Bay width m 2.10
Bay height m 2.50
Type of gate - radial
Flow velocity at intake m/s 0.7
The free inlet which objective is to allow smooth converging of the current lines to the desilting structure will, for
hydraulic reasons, be approximately 2.5 times the width of the intake, i.e. 25m. The feasibility study will study
the hydraulic behavior of the intake in detail and adapt its design accordingly.
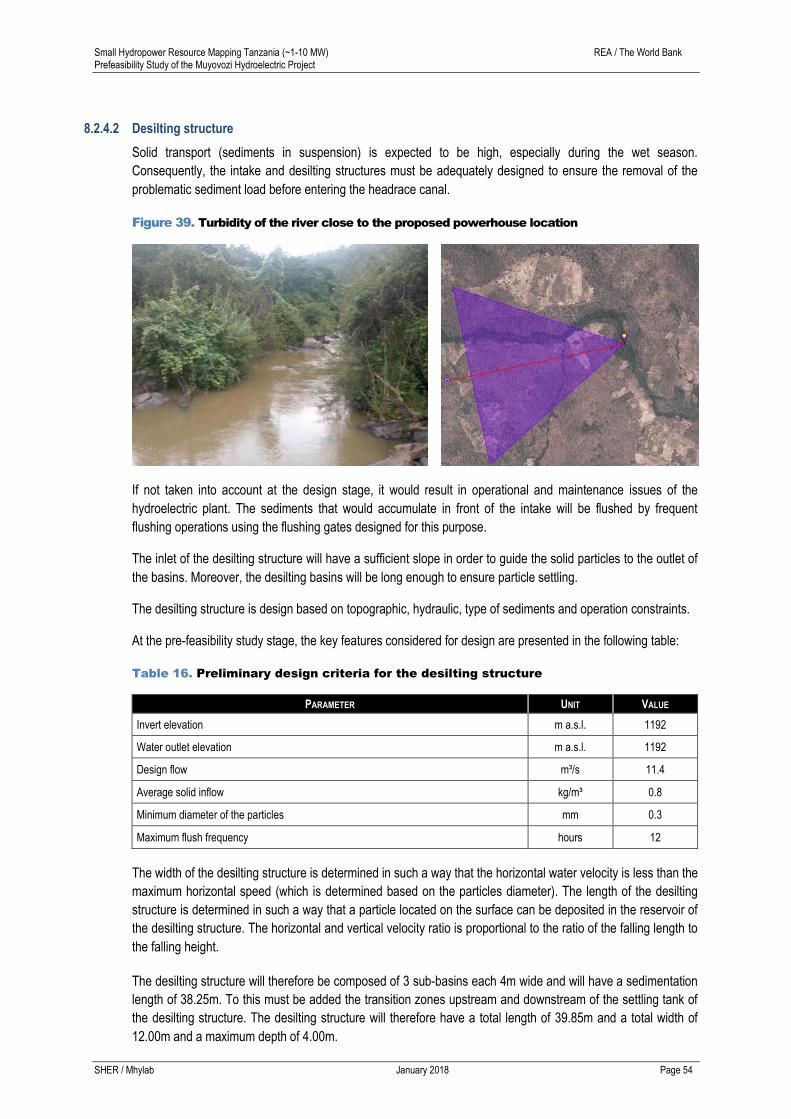
Small Hydropower Resource Mapping Tanzania (~1-10 MW) REA / The World Bank Prefeasibility Study of the Muyovozi Hydroelectric Project
SHER / Mhylab January 2018 Page 54
8.2.4.2 Desilting structure
Solid transport (sediments in suspension) is expected to be high, especially during the wet season.
Consequently, the intake and desilting structures must be adequately designed to ensure the removal of the
problematic sediment load before entering the headrace canal.
Figure 39. Turbidity of the river close to the proposed powerhouse location
If not taken into account at the design stage, it would result in operational and maintenance issues of the
hydroelectric plant. The sediments that would accumulate in front of the intake will be flushed by frequent
flushing operations using the flushing gates designed for this purpose.
The inlet of the desilting structure will have a sufficient slope in order to guide the solid particles to the outlet of
the basins. Moreover, the desilting basins will be long enough to ensure particle settling.
The desilting structure is design based on topographic, hydraulic, type of sediments and operation constraints.
At the pre-feasibility study stage, the key features considered for design are presented in the following table:
Table 16. Preliminary design criteria for the desilting structure
PARAMETER UNIT VALUE
Invert elevation m a.s.l. 1192
Water outlet elevation m a.s.l. 1192
Design flow m³/s 11.4
Average solid inflow kg/m³ 0.8
Minimum diameter of the particles mm 0.3
Maximum flush frequency hours 12
The width of the desilting structure is determined in such a way that the horizontal water velocity is less than the
maximum horizontal speed (which is determined based on the particles diameter). The length of the desilting
structure is determined in such a way that a particle located on the surface can be deposited in the reservoir of
the desilting structure. The horizontal and vertical velocity ratio is proportional to the ratio of the falling length to
the falling height.
The desilting structure will therefore be composed of 3 sub-basins each 4m wide and will have a sedimentation
length of 38.25m. To this must be added the transition zones upstream and downstream of the settling tank of
the desilting structure. The desilting structure will therefore have a total length of 39.85m and a total width of
12.00m and a maximum depth of 4.00m.
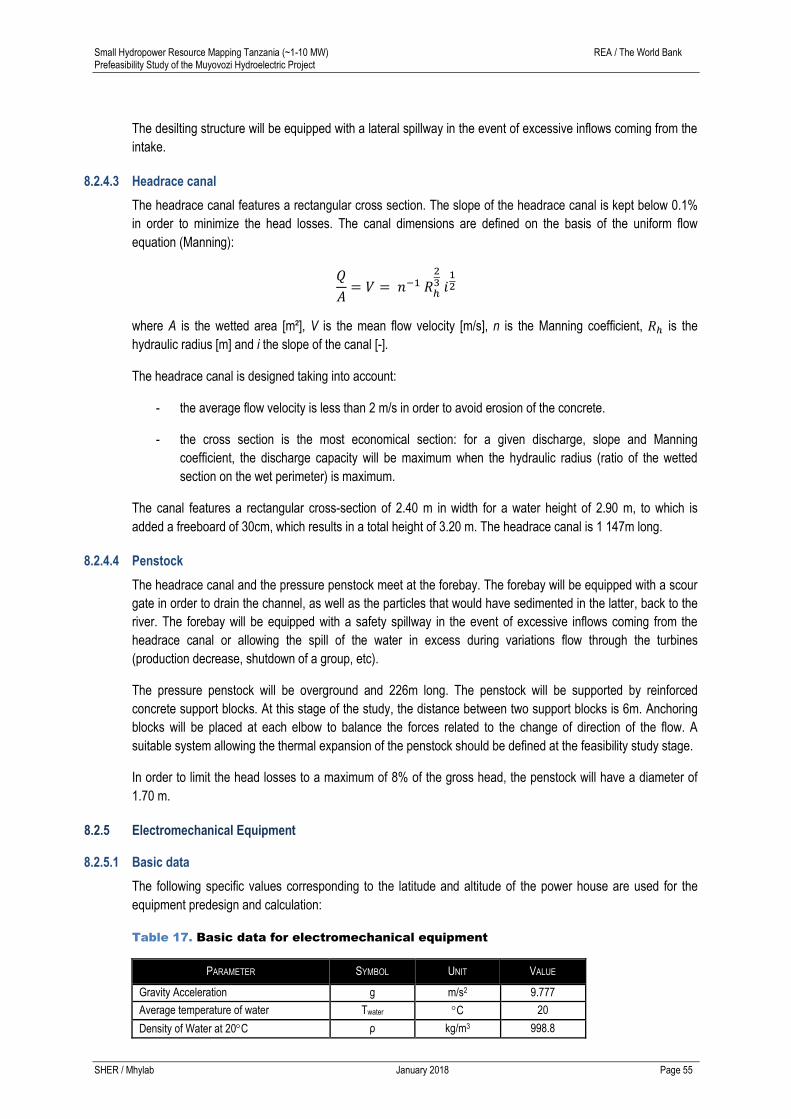
Small Hydropower Resource Mapping Tanzania (~1-10 MW) REA / The World Bank Prefeasibility Study of the Muyovozi Hydroelectric Project
SHER / Mhylab January 2018 Page 55
The desilting structure will be equipped with a lateral spillway in the event of excessive inflows coming from the
intake.
8.2.4.3 Headrace canal
The headrace canal features a rectangular cross section. The slope of the headrace canal is kept below 0.1%
in order to minimize the head losses. The canal dimensions are defined on the basis of the uniform flow
equation (Manning):
𝑄
𝐴= 𝑉 = 𝑛−1 𝑅ℎ
23 𝑖
12
where A is the wetted area [m²], V is the mean flow velocity [m/s], n is the Manning coefficient, 𝑅ℎ is the
hydraulic radius [m] and i the slope of the canal [-].
The headrace canal is designed taking into account:
- the average flow velocity is less than 2 m/s in order to avoid erosion of the concrete.
- the cross section is the most economical section: for a given discharge, slope and Manning
coefficient, the discharge capacity will be maximum when the hydraulic radius (ratio of the wetted
section on the wet perimeter) is maximum.
The canal features a rectangular cross-section of 2.40 m in width for a water height of 2.90 m, to which is
added a freeboard of 30cm, which results in a total height of 3.20 m. The headrace canal is 1 147m long.
8.2.4.4 Penstock
The headrace canal and the pressure penstock meet at the forebay. The forebay will be equipped with a scour
gate in order to drain the channel, as well as the particles that would have sedimented in the latter, back to the
river. The forebay will be equipped with a safety spillway in the event of excessive inflows coming from the
headrace canal or allowing the spill of the water in excess during variations flow through the turbines
(production decrease, shutdown of a group, etc).
The pressure penstock will be overground and 226m long. The penstock will be supported by reinforced
concrete support blocks. At this stage of the study, the distance between two support blocks is 6m. Anchoring
blocks will be placed at each elbow to balance the forces related to the change of direction of the flow. A
suitable system allowing the thermal expansion of the penstock should be defined at the feasibility study stage.
In order to limit the head losses to a maximum of 8% of the gross head, the penstock will have a diameter of
1.70 m.
8.2.5 Electromechanical Equipment
8.2.5.1 Basic data
The following specific values corresponding to the latitude and altitude of the power house are used for the
equipment predesign and calculation:
Table 17. Basic data for electromechanical equipment
PARAMETER SYMBOL UNIT VALUE
Gravity Acceleration g m/s2 9.777
Average temperature of water Twater C 20
Density of Water at 20C ρ kg/m3 998.8
Small Hydropower Resource Mapping Tanzania (~1-10 MW) REA / The World Bank Prefeasibility Study of the Muyovozi Hydroelectric Project
SHER / Mhylab January 2018 Page 56
8.2.5.2 Selection of the type of turbine and the number of units
8.2.5.2.1 Methodology
The selection of the turbines type is made on the basis of the sites parameters such as the gross and net
heads, and the plant design flow.
With a plant design discharge equal to Q50%, which is guaranteed 50% of the year, unit flexibility is needed to
follow the river flow variations all along the year, as the hydropower scheme is a run-of-the river one. Moreover,
the Muyuvozi site being connected to the Kibundo mini-grid, flexibility will also be needed to follow the demand
during the day.
In order to make a preliminary selection of the most suitable turbine type and of the number of units, a first
selection is made according to the available head.
The choice of the number of units is based on several criterion:
Flexibility and reliability: Even if some turbine types allow a strong flexibility, it is chosen to
consider at least two units per site. This choice will prevent possible electricity delivery
shortage as, at least, one unit will remain on the grid in case of maintenance or break.
Standardization or systemization: Considering the expected installed turbine capacities
(<10MW per turbine) for ESMAP project, units will be standardized or systemized. In one
hand, the best efficiency points will be a little lower than for large units, but, in the other
hand, the cost and delivery time will be reduced. Moreover, the maintenance will be easier
than for custom made products.
Access to the site and powerhouse infrastructure: As the site access can be a problem for
larges equipment or equipment parts, it can be mandatory to increase the number of unit in
order to allow their transport from the nearest harbor. The number of units also has a direct
impact on the powerhouse. The greater the number, the bigger the power house, but the
bigger the crane capacity and the unit weight leading to high loads on the power house
structure. Finally, the erection of smaller units will be easier than for bigger ones.
The preliminary turbine design is based on statistical values. The detailed analysis of the other alternatives and
the optimization of the choice must be made during feasibility study if the site is selected at the end of the
prefeasibility phase.
The power and rotation speed of the generators depend on the turbine hydraulic design. The selection process
aims in finding the higher rotation speed (which reduces the size of the rotating parts and then price of the unit),
taking into consideration hydraulic phenomenon as for instance cavitation.
The efficiency of the generators is assessed according to their power and speed.
At the prefeasibility stage, the power factor of the generators is considered as equal to 0.9.
All the technical data (preliminary dimensions, rotation speeds, efficiency level, etc.) are given for information
only. They have to be understood as orders of magnitude and can vary in further studies steps in function of the
requested accuracy level.
8.2.5.2.2 Selection process results
According to the net head (~23.8 m) and the available flow, two types of turbines can be considered:
Two or more Kaplan turbines with a rotational speed of 500 or 600 rpm or,

Small Hydropower Resource Mapping Tanzania (~1-10 MW) REA / The World Bank Prefeasibility Study of the Muyovozi Hydroelectric Project
SHER / Mhylab January 2018 Page 57
Two or more Francis turbine with a rotational speed of 428.57 or 500 rpm.
Considering the installed capacity and the previous criterion, it is better to select at least 2 units to increase the
reliability and the availability of the production.
A brief comparison of the Francis and Kaplan alternatives is given hereafter:
The flexibility of the Francis is significantly lower than the one of a Kaplan. When considering
two units, the minimum discharge will be around 2.3 m3/s for the Francis and 1.4 m3/s for a
Kaplan.
At nominal and maximal discharge the efficiency of a Francis turbine is of the same order of
magnitude than he one of a Kaplan turbine. However, the efficiency at part load is
decreasing faster for the Francis than for the Kaplan.
Due to a higher rotational speed, the generator of the Kaplan unit should be less expensive
than the one of the Francis unit. However, the generator shaft for the Kaplan turbine needs
to be a hollow shaft to allow the passage of the runner blade control rod, which is more
expensive than a standard generator. Finally, the price of this part will be slightly the same
for both alternatives.
The size of the Kaplan and Francis units will be slightly the same.
The penstock will be protected by a trash rack associated with a manual cleaning. Even with
these equipment, it is not possible to exclude that solid materials, vegetal and other floating
materials will pass through the rack and reach the turbine. The Francis geometry is more
sensitive to the floating material than Kaplan, as it can, for instance, be blocked in the
labyrinths, what will block the runner and lead to a runner dismantling.
The Kaplan, having less blades than a Francis is less sensitive to that kind of floating
material.
The frequency regulation with a double regulated Kaplan will be more accurate than with a
Francis turbine. It will then be a strong advantage to control the frequency of the grid if the
Muyovozi power plant output is high compared to the grid total power.
If the demand from the grid is low, it could be a problem to supply it with one Francis unit.
The Kaplan turbine, with its double regulation and complex runner is more expensive and
more complicated to operate and maintain than a Francis.
The hereafter table gives an overview of the comparison
Table 18. Comparison between Kaplan and Francis turbines
Kaplan Francis
Answer to discharge variations Excellent Medium
Answer to demand variation Excellent Medium
Start-up and synchronization Easy Easy
Sensitivity to floating material Low to
medium Medium
Sensitivity to solid material Low to
medium High
Frequency regulation Excellent Good
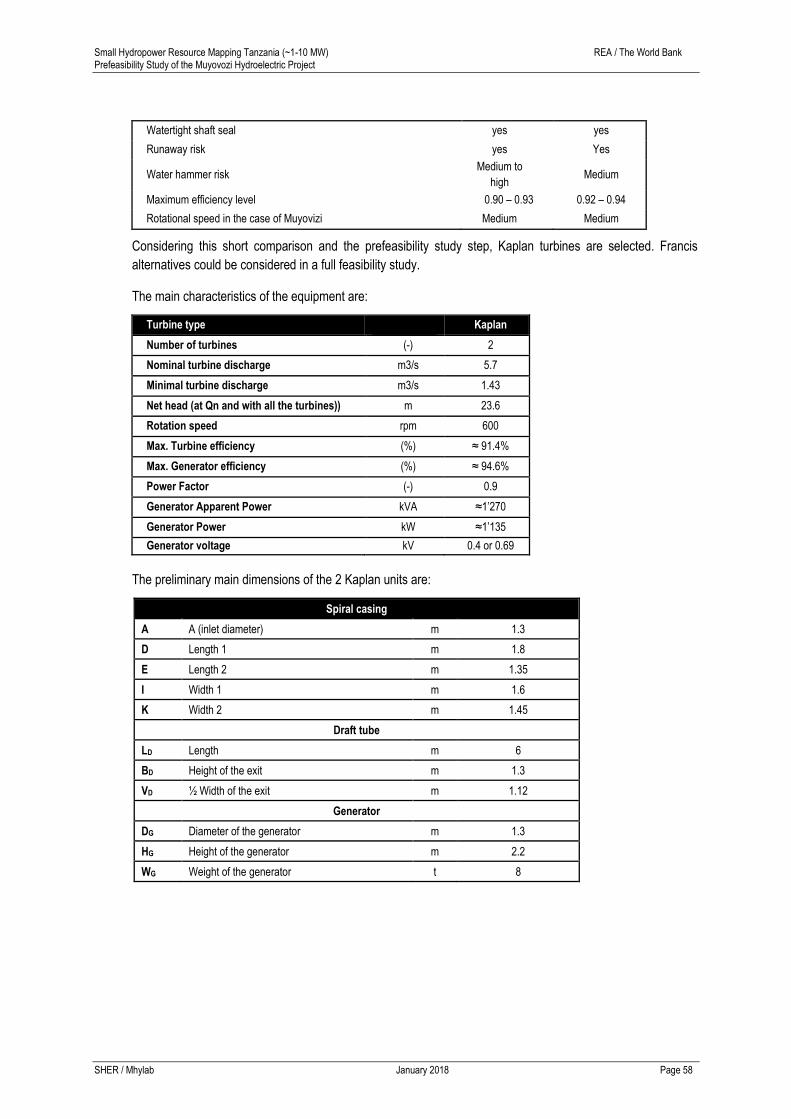
Small Hydropower Resource Mapping Tanzania (~1-10 MW) REA / The World Bank Prefeasibility Study of the Muyovozi Hydroelectric Project
SHER / Mhylab January 2018 Page 58
Watertight shaft seal yes yes
Runaway risk yes Yes
Water hammer risk Medium to
high Medium
Maximum efficiency level 0.90 – 0.93 0.92 – 0.94
Rotational speed in the case of Muyovizi Medium Medium
Considering this short comparison and the prefeasibility study step, Kaplan turbines are selected. Francis
alternatives could be considered in a full feasibility study.
The main characteristics of the equipment are:
Turbine type
Kaplan
Number of turbines (-) 2
Nominal turbine discharge m3/s 5.7
Minimal turbine discharge m3/s 1.43
Net head (at Qn and with all the turbines)) m 23.6
Rotation speed rpm 600
Max. Turbine efficiency (%) ≈ 91.4%
Max. Generator efficiency (%) ≈ 94.6%
Power Factor (-) 0.9
Generator Apparent Power kVA ≈1’270
Generator Power kW ≈1’135
Generator voltage kV 0.4 or 0.69
The preliminary main dimensions of the 2 Kaplan units are:
Spiral casing
A A (inlet diameter) m 1.3
D Length 1 m 1.8
E Length 2 m 1.35
I Width 1 m 1.6
K Width 2 m 1.45
Draft tube
LD Length m 6
BD Height of the exit m 1.3
VD ½ Width of the exit m 1.12
Generator
DG Diameter of the generator m 1.3
HG Height of the generator m 2.2
WG Weight of the generator t 8
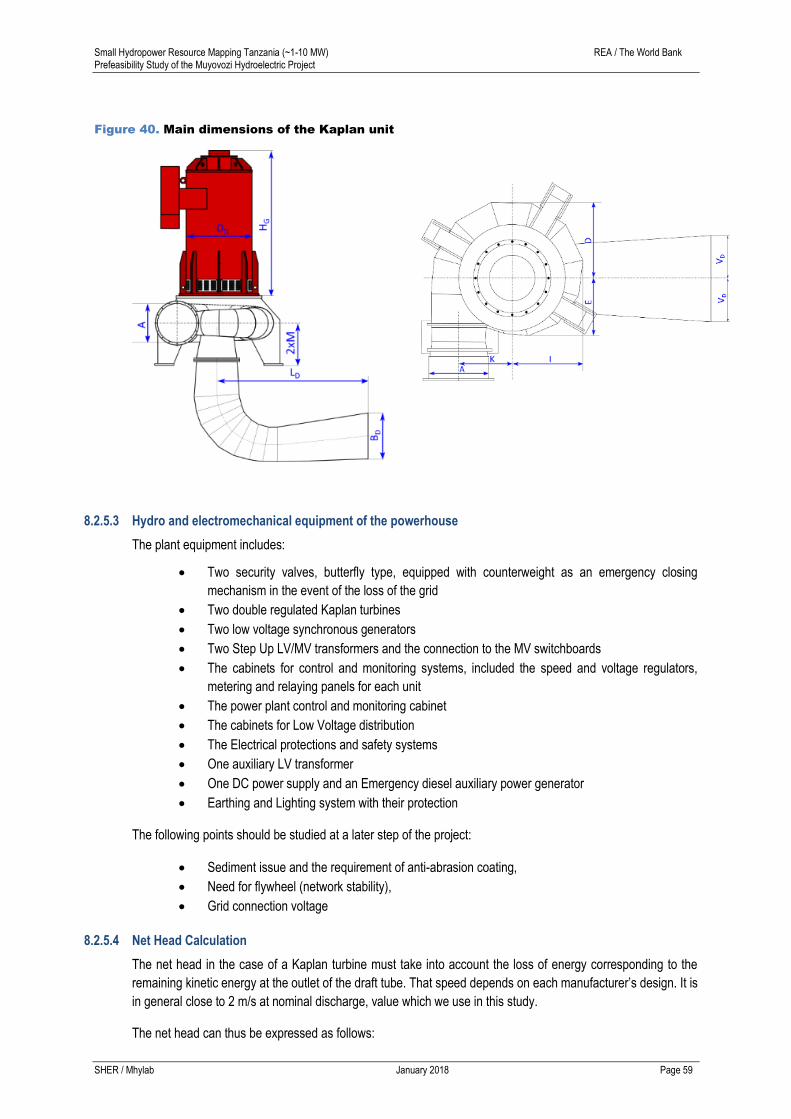
Small Hydropower Resource Mapping Tanzania (~1-10 MW) REA / The World Bank Prefeasibility Study of the Muyovozi Hydroelectric Project
SHER / Mhylab January 2018 Page 59
Figure 40. Main dimensions of the Kaplan unit
8.2.5.3 Hydro and electromechanical equipment of the powerhouse
The plant equipment includes:
Two security valves, butterfly type, equipped with counterweight as an emergency closing
mechanism in the event of the loss of the grid
Two double regulated Kaplan turbines
Two low voltage synchronous generators
Two Step Up LV/MV transformers and the connection to the MV switchboards
The cabinets for control and monitoring systems, included the speed and voltage regulators,
metering and relaying panels for each unit
The power plant control and monitoring cabinet
The cabinets for Low Voltage distribution
The Electrical protections and safety systems
One auxiliary LV transformer
One DC power supply and an Emergency diesel auxiliary power generator
Earthing and Lighting system with their protection
The following points should be studied at a later step of the project:
Sediment issue and the requirement of anti-abrasion coating,
Need for flywheel (network stability),
Grid connection voltage
8.2.5.4 Net Head Calculation
The net head in the case of a Kaplan turbine must take into account the loss of energy corresponding to the
remaining kinetic energy at the outlet of the draft tube. That speed depends on each manufacturer’s design. It is
in general close to 2 m/s at nominal discharge, value which we use in this study.
The net head can thus be expressed as follows:
Small Hydropower Resource Mapping Tanzania (~1-10 MW) REA / The World Bank Prefeasibility Study of the Muyovozi Hydroelectric Project
SHER / Mhylab January 2018 Page 60
g
vQHZQH f
2)()(
2
[m]
With:
- H(Q) : net head, function of the turbines’ discharge [m]
- Z : gross head [m]
- Hf (Q) : penstock frictions losses [m]
- v: speed at the outlet of the draft tube, [m]
- g: acceleration due to gravity [m/s2]
The choice of 2 m/s as exit speed is a compromise between the kinetic energy recovered in the draft tube and
flow conditions at turbine exit. At this prefeasibility stage, we will moreover consider that kinetic loss remains
constant in the draft tube, whatever the turbine’s discharge.
The Kaplan turbine is a reaction turbine, then no dewatering of the runner is needed. The level to be considered
for the suction height is the tail water level.
The gross head is the difference between the upstream water level in the forebay tank and the downstream
water lever in the tailrace channel. The floor elevation of the powerhouse is 1’165 masl. At the prefeasibility
step, the tail race water and floor levels are not accurately defined. Then the tail water level is considered as
equal to the powerhouse floor level.
The water level in the forebay tank is 1’190.9 masl, and thus the gross head is 25.9 m. Taking into
consideration the head losses between the forebay tank and the inlet of the turbine spiral case and the kinetic
energy losses at the outlet of the draft tube, the net head at nominal discharge is then equal to 23.6 m.
8.2.5.5 Overview of the units operation
The turbine governor will be controlled by the forebay tank level and the frequency measurement. The units
operation is as follows:
If the available discharge is lower than the minimal discharge of one turbine, the plant is in
shutdown state;
As long as the available discharge is between the minimal and maximal discharge of one
turbine, only one unit is operating;
If the available discharge is over the maximal discharge of one turbine and the demand is
exceeding one unit capacity, a second unit is started. The discharge of the first turbine is
reduced and the discharge of the second one increases until both turbines operate at the
same opening.
Then, the two turbines can operate in parallel with the same opening until they reach their
maximum power.
If the available discharge is larger than the maximal discharge of the hydropower plant, the
excess water is released in the river at the intake location.
If the discharge decreases, the automatic control system reduces the opening of the turbines
in reversed order.
In case of shutdown of one or more turbine, the excess water is released in the river at the intake location.
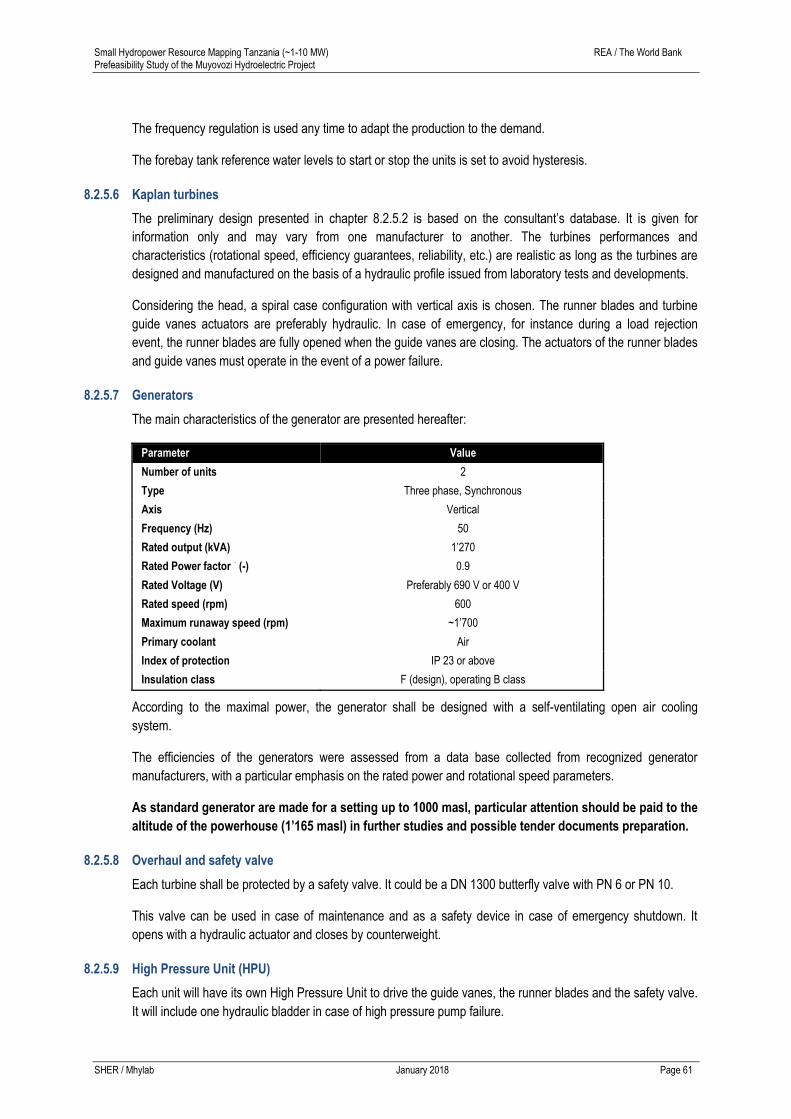
Small Hydropower Resource Mapping Tanzania (~1-10 MW) REA / The World Bank Prefeasibility Study of the Muyovozi Hydroelectric Project
SHER / Mhylab January 2018 Page 61
The frequency regulation is used any time to adapt the production to the demand.
The forebay tank reference water levels to start or stop the units is set to avoid hysteresis.
8.2.5.6 Kaplan turbines
The preliminary design presented in chapter 8.2.5.2 is based on the consultant’s database. It is given for
information only and may vary from one manufacturer to another. The turbines performances and
characteristics (rotational speed, efficiency guarantees, reliability, etc.) are realistic as long as the turbines are
designed and manufactured on the basis of a hydraulic profile issued from laboratory tests and developments.
Considering the head, a spiral case configuration with vertical axis is chosen. The runner blades and turbine
guide vanes actuators are preferably hydraulic. In case of emergency, for instance during a load rejection
event, the runner blades are fully opened when the guide vanes are closing. The actuators of the runner blades
and guide vanes must operate in the event of a power failure.
8.2.5.7 Generators
The main characteristics of the generator are presented hereafter:
Parameter Value
Number of units 2
Type Three phase, Synchronous
Axis Vertical
Frequency (Hz) 50
Rated output (kVA) 1’270
Rated Power factor (-) 0.9
Rated Voltage (V) Preferably 690 V or 400 V
Rated speed (rpm) 600
Maximum runaway speed (rpm) ~1’700
Primary coolant Air
Index of protection IP 23 or above
Insulation class F (design), operating B class
According to the maximal power, the generator shall be designed with a self-ventilating open air cooling
system.
The efficiencies of the generators were assessed from a data base collected from recognized generator
manufacturers, with a particular emphasis on the rated power and rotational speed parameters.
As standard generator are made for a setting up to 1000 masl, particular attention should be paid to the
altitude of the powerhouse (1’165 masl) in further studies and possible tender documents preparation.
8.2.5.8 Overhaul and safety valve
Each turbine shall be protected by a safety valve. It could be a DN 1300 butterfly valve with PN 6 or PN 10.
This valve can be used in case of maintenance and as a safety device in case of emergency shutdown. It
opens with a hydraulic actuator and closes by counterweight.
8.2.5.9 High Pressure Unit (HPU)
Each unit will have its own High Pressure Unit to drive the guide vanes, the runner blades and the safety valve.
It will include one hydraulic bladder in case of high pressure pump failure.

Small Hydropower Resource Mapping Tanzania (~1-10 MW) REA / The World Bank Prefeasibility Study of the Muyovozi Hydroelectric Project
SHER / Mhylab January 2018 Page 62
8.2.5.10 Control and monitoring system
The plant operation being expected to be entirely automatic, its control and monitoring system has to be as
simple as possible, so as to reduce human intervention to a minimum.
The discharge will be controlled by the water level in the forebay tank, which will be measured by mean of a
level gauge connected to the plant by optical fiber or other means.
Each unit will have its own control and monitoring cabinet with its own PLC. One additional control and
monitoring cabinet and PLC will be installed to control the whole power plant.
It will be possible to operate the units either automatically or manually. In order to prevent untimely operations,
manual controls must be locked with a key.
The plant will restart automatically in case of power outage. However, for safety reasons both with regards to
the plant’s operation and maintenance staff and to the electric grid, the plant will not restart automatically after
an alarm, even if it would disappear without human action.
The electric cabinets will at least include the following elements: runner blade and guide vanes, opening, safety
valve opening, Power Factor regulation, voltage and frequency controls, and emergency power supply.
The following measurement instruments will be used: Grid and generator voltmeters, wattmeter, frequency
meter, power factor measurement, synchroscope, speed sensor, headrace level, hours counter, start-up
counter, bearings and alternator coils’ temperatures, emergency shut-down, emergency power-supply charge
level.
The following alarms will have to be considered: Insufficient water level, insufficient head, too low or too high
frequency, alternator overload, overspeed, emergency shut-down, start-up fault, bearing defect, coils defect,
current return, battery overload, battery defect.
The plant could be remote-controlled.
8.2.5.11 Emergency power-supply
A 48, or 110 V emergency power supply consisting in batteries, battery chargers, inverters, load indicators,
protections, etc., will insure safety in case of power failure. Battery alarms for defects or overloads will be
transmitted to the power plant control system. Under normal conditions, the emergency power supply will be
powered by the low tension grid. The energy storage must be sufficient to ensure a safe turbine shutdown.
An emergency diesel set will maintain power supply to essential feeders of the power house, weir and intake
and eventually to enable black start of the HPP (to be studied in the feasibility studies).
8.2.5.12 MV transformer and switchboard
Each generator will be connected to a step up transformer enabling the outlet voltage to be increased to 30 kV.
The main specifications of the LV/MV transformer area:
Number of units 2
Type Dry
Rated Power (kVA) 1’400
Number of phases 3
Primary voltage (V) 400 or 690
Secondary voltage (V) 30’000
On the medium voltage side of the power transformers, a single 30kV/630A circuit breaker will be installed for
each generator. This circuit breaker will be strong enough to stand the continuous operating current, as well as
Small Hydropower Resource Mapping Tanzania (~1-10 MW) REA / The World Bank Prefeasibility Study of the Muyovozi Hydroelectric Project
SHER / Mhylab January 2018 Page 63
the peak short circuits. Its mechanism will allow the interruption of the short circuit to avoid any damage to the
transformers, generators, and other electrical equipment.
8.2.5.13 Auxiliary Transformer
Ancillary services of the hydropower plants will be supplied by an auxiliary LV transformer with the following
characteristics:
Number of units 1
Rated Power (kVA) 250
Number of phases 3
Primary voltage (V) 30’000
Secondary voltage (V) 400 or 690
A circuit breaker shall be installed to protect the auxiliary equipment.
The own consumption of the powerplant could be estimated roughly to 0.5% of the generated energy. This
consumption is not taken into account in the energy production calculation and must be included as an expense
in the financial analysis.
8.2.5.14 Overhead travelling crane
The power house will be equipped with an overhead crane that will be able to carry and place turbines,
generators and other large devices during construction and maintenance operations.
8.2.5.15 Abrasion
Solid transport is expected to be high, especially during the wet season. The scheme is equipped with a
desilting structure to limit or remove most of the sediment. It is recommended that the feasibility study includes
a solid transport study. According to the results of this study, especially the composition of the transported
particles, the decision to add a protective coating for the critical turbine parts could be adopted.
8.2.6 Power and energy generation performance assessment
The yearly electricity production is calculated by compiling the energy generation according to the flow duration
curve and using the following expression:
Eetot = 10-3 ∫ g Qt η(Qt) H(Qt) dt [kWh/year]
Where Eetot = total yearly energy production [kWh/year]
= water specific weight [kg/m3]
g = acceleration due to gravity [m/s2]
η(Qt) = Overall unit efficiency, product of turbine, generator and transformer efficiencies,
function of discharge [-]
H(Qt) = Net head, function of global discharge of the power plant [m]
The used turbine efficiencies come from statistical curves based on real turbines of similar type, power and
specific speed, taking into account the head and discharge variation.
The used generator efficiencies come from statistical curves based on real generators and taking into account
the influence of the generator type, the rated output and the number of poles.
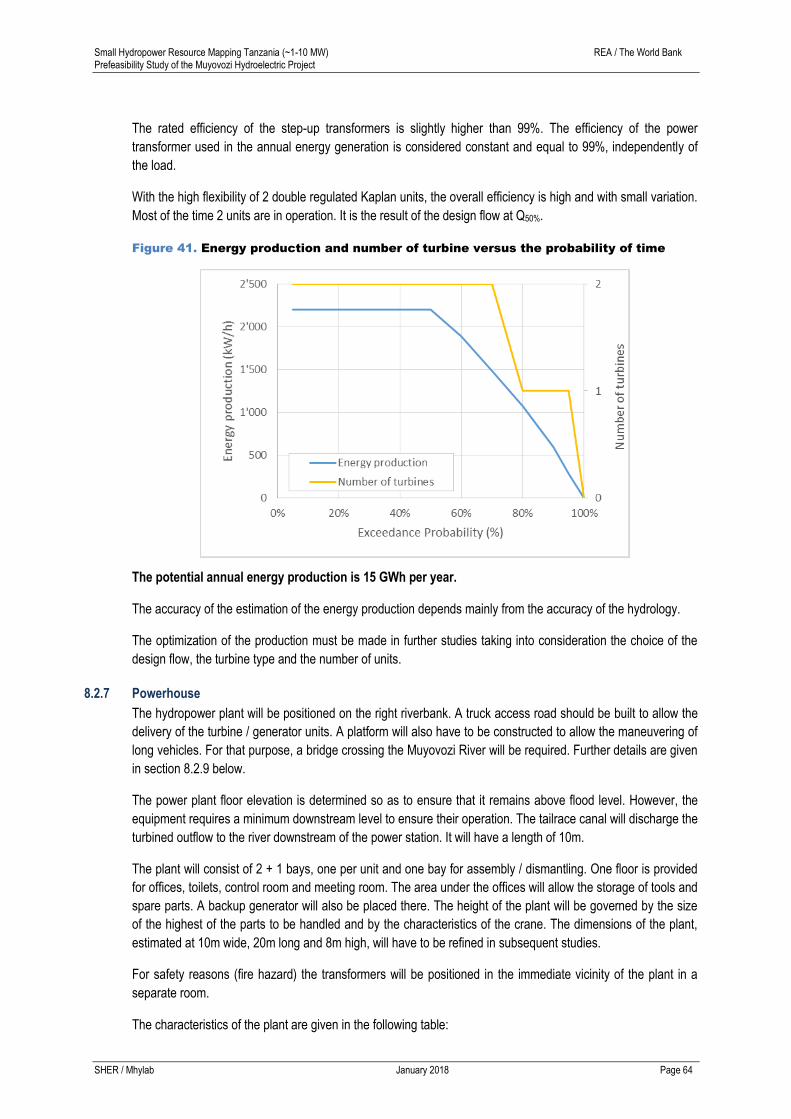
Small Hydropower Resource Mapping Tanzania (~1-10 MW) REA / The World Bank Prefeasibility Study of the Muyovozi Hydroelectric Project
SHER / Mhylab January 2018 Page 64
The rated efficiency of the step-up transformers is slightly higher than 99%. The efficiency of the power
transformer used in the annual energy generation is considered constant and equal to 99%, independently of
the load.
With the high flexibility of 2 double regulated Kaplan units, the overall efficiency is high and with small variation.
Most of the time 2 units are in operation. It is the result of the design flow at Q50%.
Figure 41. Energy production and number of turbine versus the probability of time
The potential annual energy production is 15 GWh per year.
The accuracy of the estimation of the energy production depends mainly from the accuracy of the hydrology.
The optimization of the production must be made in further studies taking into consideration the choice of the
design flow, the turbine type and the number of units.
8.2.7 Powerhouse
The hydropower plant will be positioned on the right riverbank. A truck access road should be built to allow the
delivery of the turbine / generator units. A platform will also have to be constructed to allow the maneuvering of
long vehicles. For that purpose, a bridge crossing the Muyovozi River will be required. Further details are given
in section 8.2.9 below.
The power plant floor elevation is determined so as to ensure that it remains above flood level. However, the
equipment requires a minimum downstream level to ensure their operation. The tailrace canal will discharge the
turbined outflow to the river downstream of the power station. It will have a length of 10m.
The plant will consist of 2 + 1 bays, one per unit and one bay for assembly / dismantling. One floor is provided
for offices, toilets, control room and meeting room. The area under the offices will allow the storage of tools and
spare parts. A backup generator will also be placed there. The height of the plant will be governed by the size
of the highest of the parts to be handled and by the characteristics of the crane. The dimensions of the plant,
estimated at 10m wide, 20m long and 8m high, will have to be refined in subsequent studies.
For safety reasons (fire hazard) the transformers will be positioned in the immediate vicinity of the plant in a
separate room.
The characteristics of the plant are given in the following table:
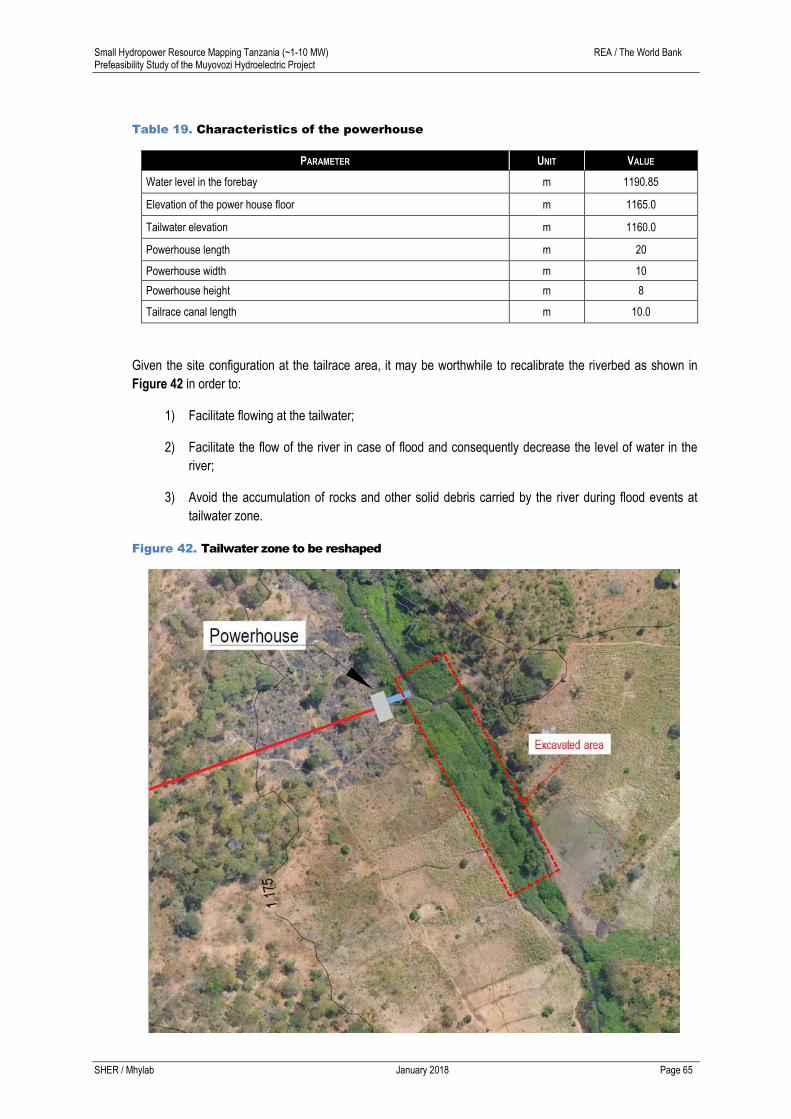
Small Hydropower Resource Mapping Tanzania (~1-10 MW) REA / The World Bank Prefeasibility Study of the Muyovozi Hydroelectric Project
SHER / Mhylab January 2018 Page 65
Table 19. Characteristics of the powerhouse
PARAMETER UNIT VALUE
Water level in the forebay m 1190.85
Elevation of the power house floor m 1165.0
Tailwater elevation m 1160.0
Powerhouse length m 20
Powerhouse width m 10
Powerhouse height m 8
Tailrace canal length m 10.0
Given the site configuration at the tailrace area, it may be worthwhile to recalibrate the riverbed as shown in
Figure 42 in order to:
1) Facilitate flowing at the tailwater;
2) Facilitate the flow of the river in case of flood and consequently decrease the level of water in the
river;
3) Avoid the accumulation of rocks and other solid debris carried by the river during flood events at
tailwater zone.
Figure 42. Tailwater zone to be reshaped
Small Hydropower Resource Mapping Tanzania (~1-10 MW) REA / The World Bank Prefeasibility Study of the Muyovozi Hydroelectric Project
SHER / Mhylab January 2018 Page 66
8.2.8 Transmission line and substation
The mini-grid of Kibondo is currently supplied by a 2.5 MW diesel-fired power station operated by TANESCO.
Hence, the proposed Muyovozi hydroelectric project (2.27 MW) is a relevant alternative to the (costly) energy
generation by that thermal power station.
The connection of the Muyovozi hydroelectric project and Kibondo would require the construction of an
approximately 60 km long high voltage (33 kV) transmission line. An alternative would be to connect the
powerhouse to the 33 kV mini-grid of Lusahunga (North) that require the construction of an approximately 50
km long high voltage (33 kV) transmission line.
However, the Power Supply Master Plan (2016) proposes the construction of a 400 kV transmission line
between Nyakanazi and Kigoma at horizon 2020. As a consequence, the required length of the transmission
line to evacuate the power generated from the Muyovozi scheme could be much lower than 60 km (or 50 km),
depending on the feasibility to connect directly to the 400 kV line with a dedicated substation.
As the surroundings of the proposed project are currently not supplied by the electricity grid, the detailed
studies shall analyze the technical and economic feasibility of supplying electricity to those villages directly from
the power plant.
8.2.9 Access
A comprehensive description of existing access is presented and illustrated in Section 3.2 of this report.
For the development of the site, it will be necessary to create 2.2 km of access track and a bridge over the river
to access the proposed scheme located on the right riverbank. The proposed new track will connect the existing
track, the powerhouse and the weir, following the headrace canal. It will also be necessary to rehabilitate the
track between the B8 Road (currently under rehabilitation) and the proposed new access track. The different
accesses to be rehabilitated and to create are illustrated in Figure 43 below.
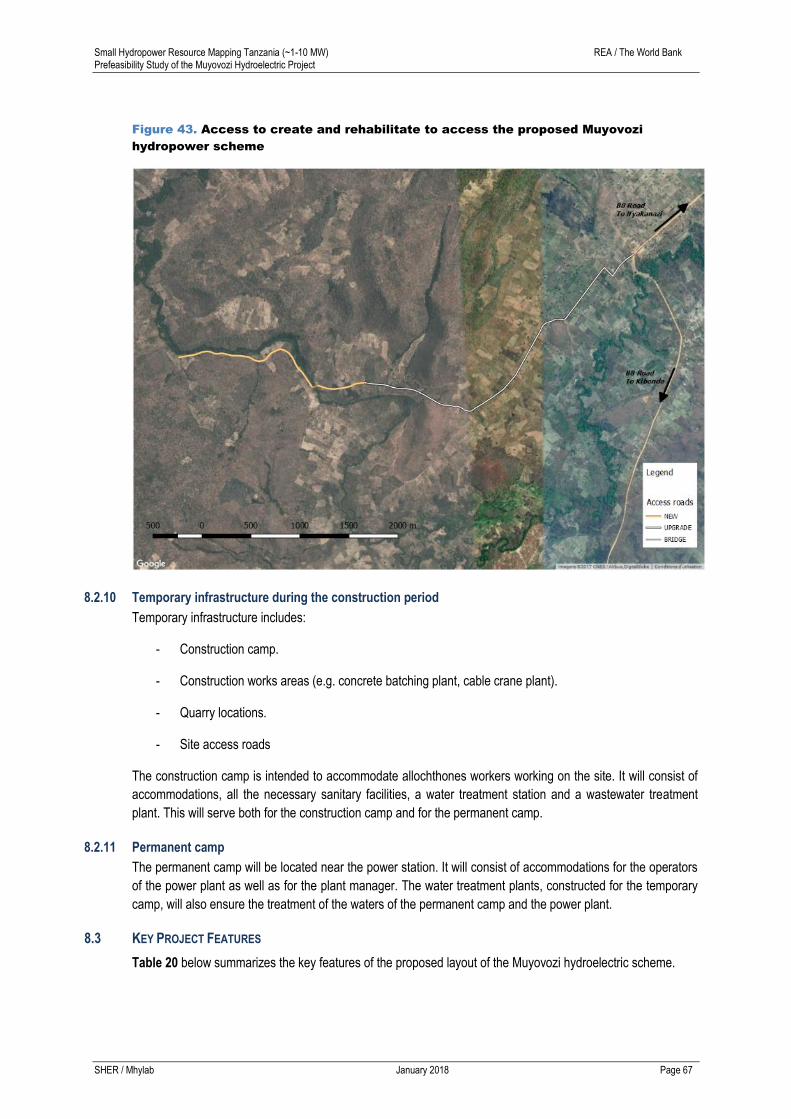
Small Hydropower Resource Mapping Tanzania (~1-10 MW) REA / The World Bank Prefeasibility Study of the Muyovozi Hydroelectric Project
SHER / Mhylab January 2018 Page 67
Figure 43. Access to create and rehabilitate to access the proposed Muyovozi
hydropower scheme
8.2.10 Temporary infrastructure during the construction period
Temporary infrastructure includes:
- Construction camp.
- Construction works areas (e.g. concrete batching plant, cable crane plant).
- Quarry locations.
- Site access roads
The construction camp is intended to accommodate allochthones workers working on the site. It will consist of
accommodations, all the necessary sanitary facilities, a water treatment station and a wastewater treatment
plant. This will serve both for the construction camp and for the permanent camp.
8.2.11 Permanent camp
The permanent camp will be located near the power station. It will consist of accommodations for the operators
of the power plant as well as for the plant manager. The water treatment plants, constructed for the temporary
camp, will also ensure the treatment of the waters of the permanent camp and the power plant.
8.3 KEY PROJECT FEATURES
Table 20 below summarizes the key features of the proposed layout of the Muyovozi hydroelectric scheme.
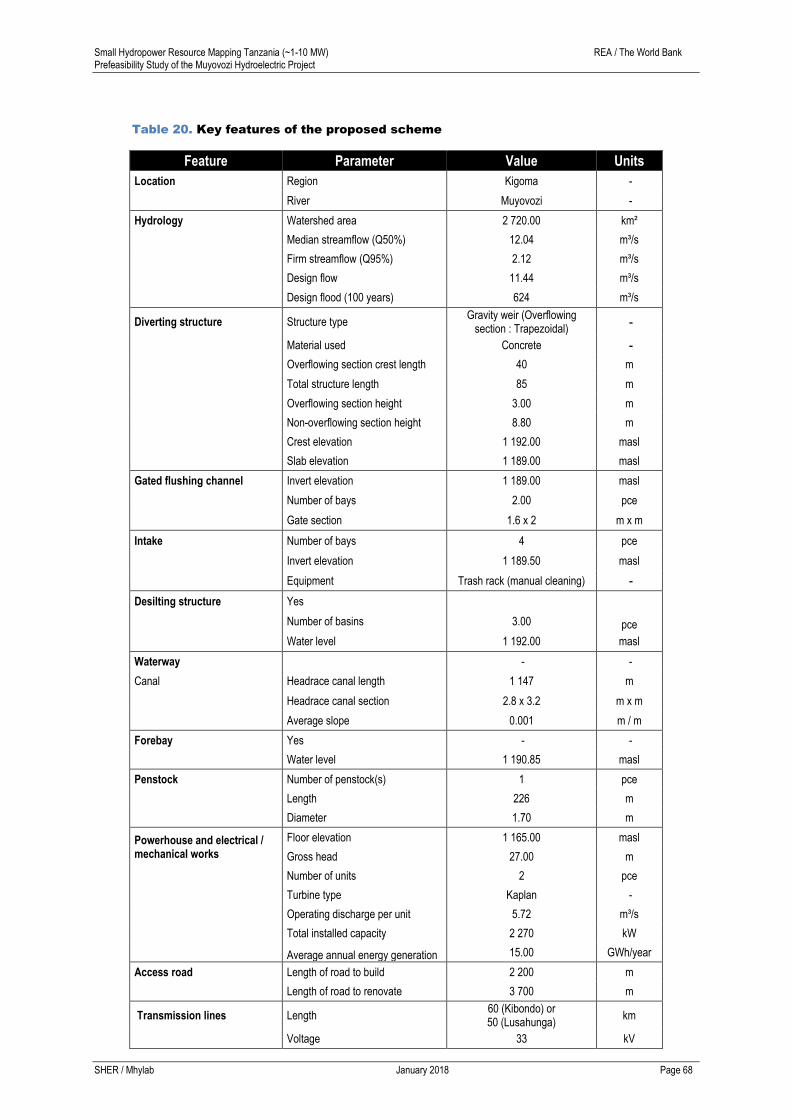
Small Hydropower Resource Mapping Tanzania (~1-10 MW) REA / The World Bank Prefeasibility Study of the Muyovozi Hydroelectric Project
SHER / Mhylab January 2018 Page 68
Table 20. Key features of the proposed scheme
Feature Parameter Value Units
Location Region Kigoma -
River Muyovozi -
Hydrology Watershed area 2 720.00 km²
Median streamflow (Q50%) 12.04 m³/s
Firm streamflow (Q95%) 2.12 m³/s
Design flow 11.44 m³/s
Design flood (100 years) 624 m³/s
Diverting structure Structure type Gravity weir (Overflowing
section : Trapezoidal) -
Material used Concrete -
Overflowing section crest length 40 m
Total structure length 85 m
Overflowing section height 3.00 m
Non-overflowing section height 8.80 m
Crest elevation 1 192.00 masl
Slab elevation 1 189.00 masl
Gated flushing channel Invert elevation 1 189.00 masl
Number of bays 2.00 pce
Gate section 1.6 x 2 m x m
Intake Number of bays 4 pce
Invert elevation 1 189.50 masl
Equipment Trash rack (manual cleaning) -
Desilting structure Yes
Number of basins 3.00 pce
Water level 1 192.00 masl
Waterway - -
Canal Headrace canal length 1 147 m
Headrace canal section 2.8 x 3.2 m x m
Average slope 0.001 m / m
Forebay Yes - -
Water level 1 190.85 masl
Penstock Number of penstock(s) 1 pce
Length 226 m
Diameter 1.70 m
Powerhouse and electrical / mechanical works
Floor elevation 1 165.00 masl
Gross head 27.00 m
Number of units 2 pce
Turbine type Kaplan -
Operating discharge per unit 5.72 m³/s
Total installed capacity 2 270 kW
Average annual energy generation 15.00 GWh/year
Access road Length of road to build 2 200 m
Length of road to renovate 3 700 m
Transmission lines Length 60 (Kibondo) or 50 (Lusahunga)
km
Voltage 33 kV

Small Hydropower Resource Mapping Tanzania (~1-10 MW) REA / The World Bank Prefeasibility Study of the Muyovozi Hydroelectric Project
SHER / Mhylab January 2018 Page 69
Economic data CAPEX - without access road and transmission lines
9.79 M$
LCOE - without access road and transmission lines
0.09 $/kWh
CAPEX - access road and transmission lines included
17.38 (Kibondo) or 16.41 (Lusahunga)
M$
LCOE - access road and transmission lines included
0.16 (Kibondo) or 0.15 (Lusahunga)
$/kWh
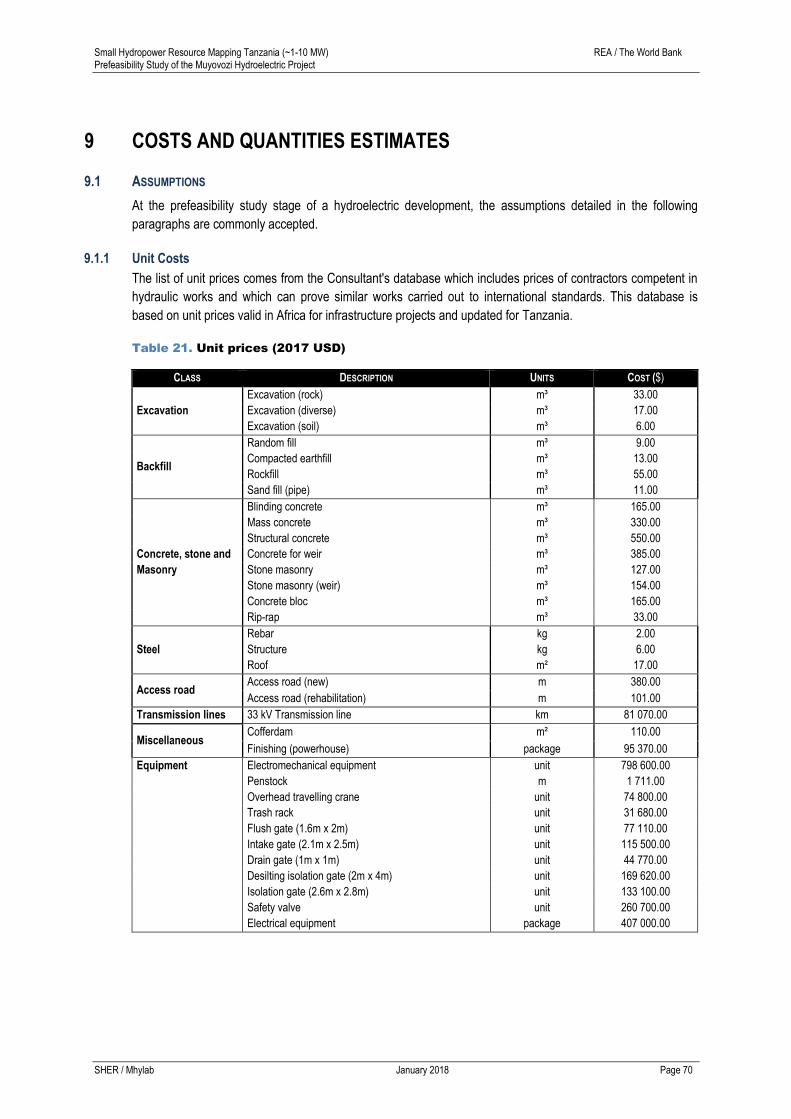
Small Hydropower Resource Mapping Tanzania (~1-10 MW) REA / The World Bank Prefeasibility Study of the Muyovozi Hydroelectric Project
SHER / Mhylab January 2018 Page 70
9 COSTS AND QUANTITIES ESTIMATES
9.1 ASSUMPTIONS
At the prefeasibility study stage of a hydroelectric development, the assumptions detailed in the following
paragraphs are commonly accepted.
9.1.1 Unit Costs
The list of unit prices comes from the Consultant's database which includes prices of contractors competent in
hydraulic works and which can prove similar works carried out to international standards. This database is
based on unit prices valid in Africa for infrastructure projects and updated for Tanzania.
Table 21. Unit prices (2017 USD)
CLASS DESCRIPTION UNITS COST ($)
Excavation
Excavation (rock) m³ 33.00
Excavation (diverse) m³ 17.00
Excavation (soil) m³ 6.00
Backfill
Random fill m³ 9.00
Compacted earthfill m³ 13.00
Rockfill m³ 55.00
Sand fill (pipe) m³ 11.00
Concrete, stone and
Masonry
Blinding concrete m³ 165.00
Mass concrete m³ 330.00
Structural concrete m³ 550.00
Concrete for weir m³ 385.00
Stone masonry m³ 127.00
Stone masonry (weir) m³ 154.00
Concrete bloc m³ 165.00
Rip-rap m³ 33.00
Steel
Rebar kg 2.00
Structure kg 6.00
Roof m² 17.00
Access road Access road (new) m 380.00
Access road (rehabilitation) m 101.00
Transmission lines 33 kV Transmission line km 81 070.00
Miscellaneous Cofferdam m² 110.00
Finishing (powerhouse) package 95 370.00
Equipment Electromechanical equipment unit 798 600.00
Penstock m 1 711.00
Overhead travelling crane unit 74 800.00
Trash rack unit 31 680.00
Flush gate (1.6m x 2m) unit 77 110.00
Intake gate (2.1m x 2.5m) unit 115 500.00
Drain gate (1m x 1m) unit 44 770.00
Desilting isolation gate (2m x 4m) unit 169 620.00
Isolation gate (2.6m x 2.8m) unit 133 100.00
Safety valve unit 260 700.00
Electrical equipment package 407 000.00
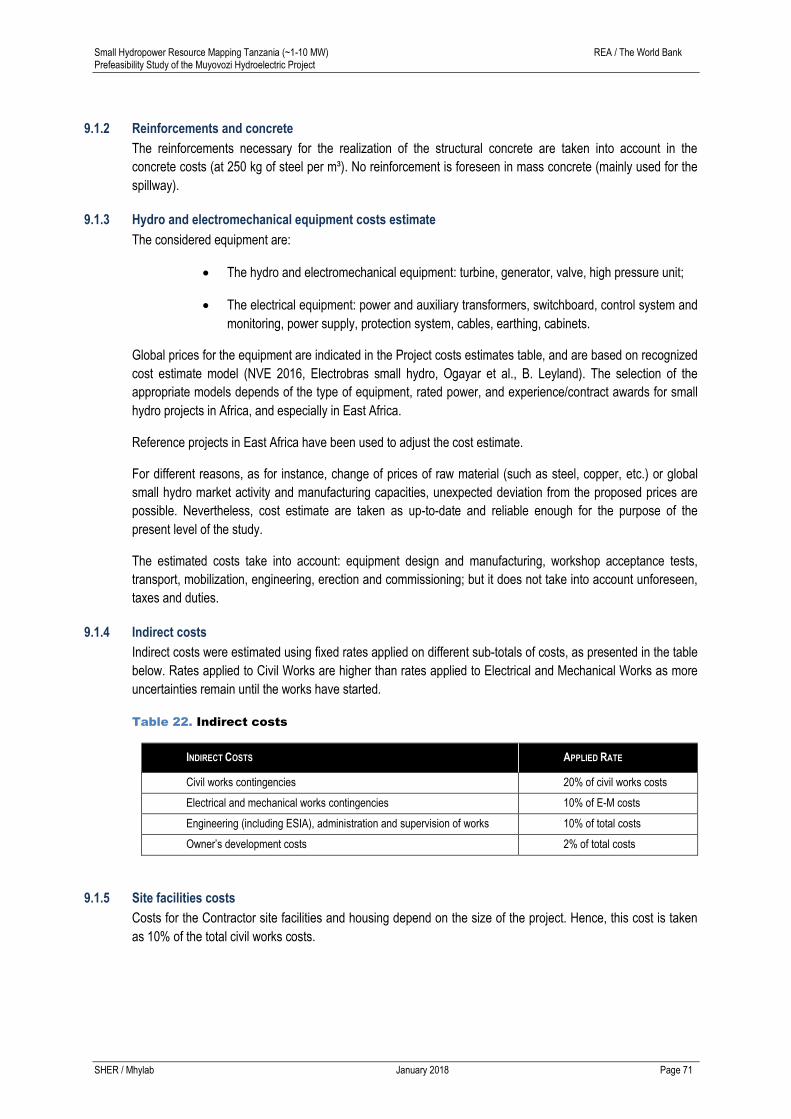
Small Hydropower Resource Mapping Tanzania (~1-10 MW) REA / The World Bank Prefeasibility Study of the Muyovozi Hydroelectric Project
SHER / Mhylab January 2018 Page 71
9.1.2 Reinforcements and concrete
The reinforcements necessary for the realization of the structural concrete are taken into account in the
concrete costs (at 250 kg of steel per m³). No reinforcement is foreseen in mass concrete (mainly used for the
spillway).
9.1.3 Hydro and electromechanical equipment costs estimate
The considered equipment are:
The hydro and electromechanical equipment: turbine, generator, valve, high pressure unit;
The electrical equipment: power and auxiliary transformers, switchboard, control system and
monitoring, power supply, protection system, cables, earthing, cabinets.
Global prices for the equipment are indicated in the Project costs estimates table, and are based on recognized
cost estimate model (NVE 2016, Electrobras small hydro, Ogayar et al., B. Leyland). The selection of the
appropriate models depends of the type of equipment, rated power, and experience/contract awards for small
hydro projects in Africa, and especially in East Africa.
Reference projects in East Africa have been used to adjust the cost estimate.
For different reasons, as for instance, change of prices of raw material (such as steel, copper, etc.) or global
small hydro market activity and manufacturing capacities, unexpected deviation from the proposed prices are
possible. Nevertheless, cost estimate are taken as up-to-date and reliable enough for the purpose of the
present level of the study.
The estimated costs take into account: equipment design and manufacturing, workshop acceptance tests,
transport, mobilization, engineering, erection and commissioning; but it does not take into account unforeseen,
taxes and duties.
9.1.4 Indirect costs
Indirect costs were estimated using fixed rates applied on different sub-totals of costs, as presented in the table
below. Rates applied to Civil Works are higher than rates applied to Electrical and Mechanical Works as more
uncertainties remain until the works have started.
Table 22. Indirect costs
INDIRECT COSTS APPLIED RATE
Civil works contingencies 20% of civil works costs
Electrical and mechanical works contingencies 10% of E-M costs
Engineering (including ESIA), administration and supervision of works 10% of total costs
Owner’s development costs 2% of total costs
9.1.5 Site facilities costs
Costs for the Contractor site facilities and housing depend on the size of the project. Hence, this cost is taken
as 10% of the total civil works costs.

Small Hydropower Resource Mapping Tanzania (~1-10 MW) REA / The World Bank Prefeasibility Study of the Muyovozi Hydroelectric Project
SHER / Mhylab January 2018 Page 72
9.1.6 Environmental and Social Impact Assessment Mitigation Costs
At this stage of the study and given the conclusions of the preliminary socio-environmental study, 3% of the
total project costs are planned for the Environmental and Social Impact Assessment and mitigation (ESIA
costs). This amount shall cover:
- Expropriation costs (compensation or allocation of new land);
- Mitigation cost of environmental impacts.
These costs should be specified in the full Environmental and Social Impact Assessment Study which will be
carried out at a later stage of the project development. The costs of this study are taken into account in the
indirect engineering costs presented in the previous section (section 9.1.4).
9.2 TOTAL COSTS (CAPEX)
Table 23 below presents a summary of costs for civil works and electromechanical equipment. It also includes
indirect costs related to studies, site supervision, project administration and environmental and social mitigation
measures.
Table 23. Project costs estimates (2017 US$)
Item (%) Costs ($)
Civil Works 11 279 000
Mobilization, installation, demobilization 275 000
Access 1 465 000
Dam/weir, spillway, purge and intake 805 000
Waterway (headrace channel, silting basin, forebay and penstock) 3 298 000
Powerhouse and tailrace channel 572 000
Transmission line (to Kibondo) 4 864 000
(Alternative: Transmission line (to Lusahunga)) (4 054 000)
Electromechanical equipment 3 495 000
Electromechanical equipment 1 597 000
Hydro mechanical equipment
909 000
Electrical equipment and ancillaries
407 000
Transport 10% 291 000
Installation 10% 291 000
Sub Total (excl. contingencies) 14 774 000
(Alternative: Sub Total (excl. contingencies)) (13 964 000)
Contingencies 2 606 000
Civil works contingencies 20% 2 256 000
Equipment contingencies 10% 350 000
Total direct project cost (incl. contingencies) 17 380 000
(Alternative: Total direct project cost (incl. contingencies)) (16 408 000)
Indirect Costs 2 608 000
Social and environmental mitigation costs 3.0% 522 000
Administration fees 2.0% 348 000

Small Hydropower Resource Mapping Tanzania (~1-10 MW) REA / The World Bank Prefeasibility Study of the Muyovozi Hydroelectric Project
SHER / Mhylab January 2018 Page 73
Studies (incl. EIES) and works supervision 10.0% 1 738 000
Total cost of the project 19 988 000
(Alternative: Total cost of the project) (18 871 000)
Small Hydropower Resource Mapping Tanzania (~1-10 MW) REA / The World Bank Prefeasibility Study of the Muyovozi Hydroelectric Project
SHER / Mhylab January 2018 Page 74
10 ECONOMIC ANALYSIS
10.1 METHODOLOGY
The economic analysis is based on the results of the field investigations and various studies presented in the
previous chapters, which includes an estimate of the quantities and the construction costs of the project
(Chapter 9) and the definition of the installed capacity and power output. Based on these results, the Consultant
has estimated the cost to deliver energy from the development of the Muyovozi hydroelectric project.
The energy generation alternatives (currently thermal units, fossil fuel-fired) will be compared based on their
costs per kWh, the latter being expressed in terms Levelized Cost Of Energy (LCOE) which is a stream of equal
payments, normalized over the expected energy production periods that would allow a project owner to recover
all costs, an assumed return on investment, over a predetermined life span.
The LCOE is defined from investment costs (CAPEX - Capital Expenditure), operating costs (OPEX -
Operational Expenditure) and the expected production of energy.
Investment costs are:
Study and work supervision costs, hereafter called “Studies and engineering costs” which include:
o Civil works study and supervision costs
o Electromechanical works study and supervision costs
o Owner’s development costs
Civil works and equipment costs, hereafter called “HPP costs”
Resettlement and environmental impact costs, hereafter called “ESIA costs”
Annual operating costs are:
Operation and maintenance costs, hereafter called “O&M costs” which include:
o Fixed operation and maintenance costs (annual scheduled maintenance)
o Costs related to interim replacement and refurbishments of major items in the course of
the project’s life
o Insurance costs
The LCOE is then calculated based on expected production and costs from the following formula:
𝐿𝐶𝑂𝐸 =𝑁𝑃𝑉(𝐶𝐴𝑃𝐸𝑋 + 𝑂𝑃𝐸𝑋)
𝑁𝑃𝑉(𝐸𝑛𝑒𝑟𝑔𝑦 𝑝𝑟𝑜𝑑𝑢𝑐𝑡𝑖𝑜𝑛)
Where NPV is the Net Present Value which is obtained by: 𝑁𝑃𝑉(𝑣𝑎𝑙𝑢𝑒) = ∑𝑣𝑎𝑙𝑢𝑒𝑟𝑖
(1+𝑛)𝑖𝑖 where n is the
discount rate.
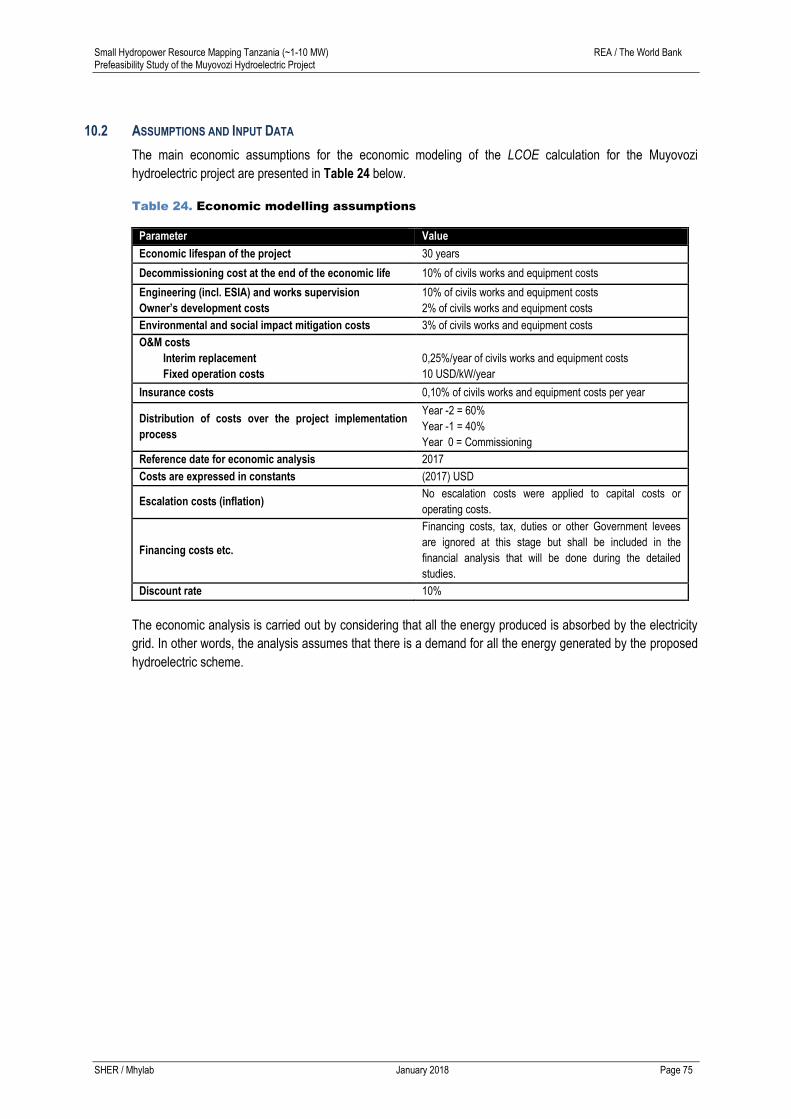
Small Hydropower Resource Mapping Tanzania (~1-10 MW) REA / The World Bank Prefeasibility Study of the Muyovozi Hydroelectric Project
SHER / Mhylab January 2018 Page 75
10.2 ASSUMPTIONS AND INPUT DATA
The main economic assumptions for the economic modeling of the LCOE calculation for the Muyovozi
hydroelectric project are presented in Table 24 below.
Table 24. Economic modelling assumptions
Parameter Value
Economic lifespan of the project 30 years
Decommissioning cost at the end of the economic life 10% of civils works and equipment costs
Engineering (incl. ESIA) and works supervision
Owner’s development costs
10% of civils works and equipment costs
2% of civils works and equipment costs
Environmental and social impact mitigation costs 3% of civils works and equipment costs
O&M costs
Interim replacement
Fixed operation costs
0,25%/year of civils works and equipment costs
10 USD/kW/year
Insurance costs 0,10% of civils works and equipment costs per year
Distribution of costs over the project implementation
process
Year -2 = 60%
Year -1 = 40%
Year 0 = Commissioning
Reference date for economic analysis 2017
Costs are expressed in constants (2017) USD
Escalation costs (inflation) No escalation costs were applied to capital costs or
operating costs.
Financing costs etc.
Financing costs, tax, duties or other Government levees
are ignored at this stage but shall be included in the
financial analysis that will be done during the detailed
studies.
Discount rate 10%
The economic analysis is carried out by considering that all the energy produced is absorbed by the electricity
grid. In other words, the analysis assumes that there is a demand for all the energy generated by the proposed
hydroelectric scheme.
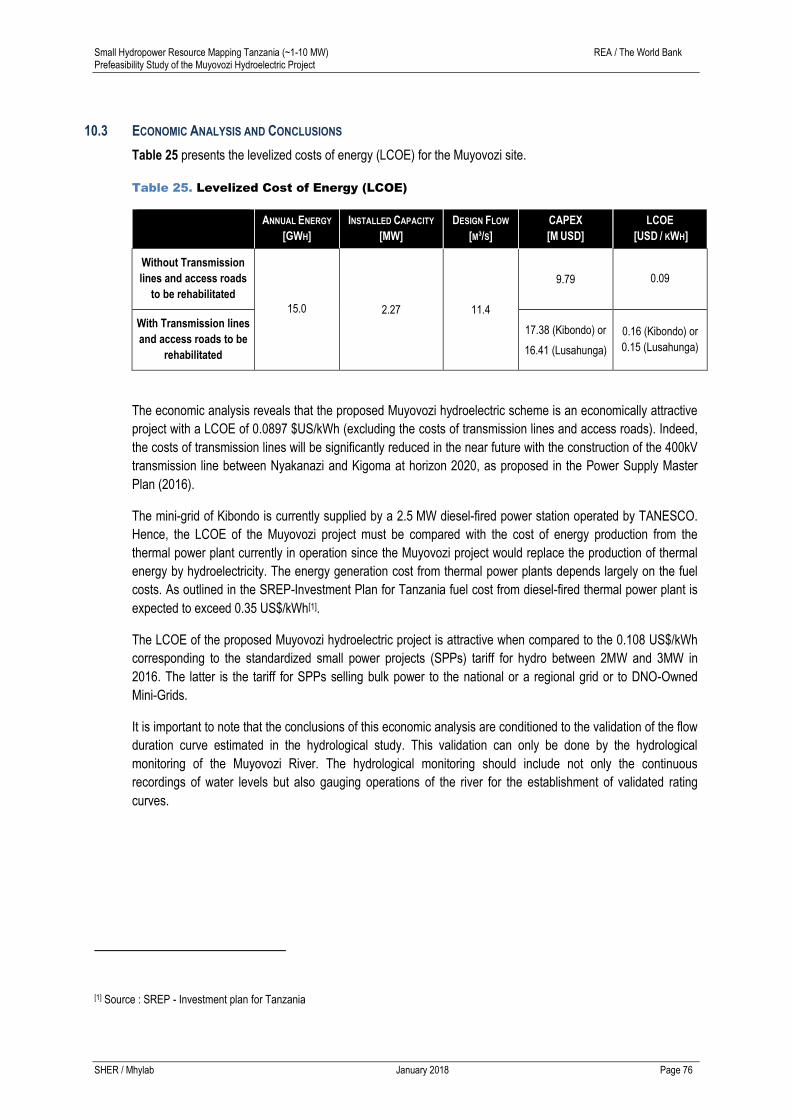
Small Hydropower Resource Mapping Tanzania (~1-10 MW) REA / The World Bank Prefeasibility Study of the Muyovozi Hydroelectric Project
SHER / Mhylab January 2018 Page 76
10.3 ECONOMIC ANALYSIS AND CONCLUSIONS
Table 25 presents the levelized costs of energy (LCOE) for the Muyovozi site.
Table 25. Levelized Cost of Energy (LCOE)
ANNUAL ENERGY
[GWH]
INSTALLED CAPACITY
[MW]
DESIGN FLOW
[M³/S]
CAPEX
[M USD]
LCOE
[USD / KWH]
Without Transmission
lines and access roads
to be rehabilitated
15.0 2.27 11.4
9.79 0.09
With Transmission lines
and access roads to be
rehabilitated
17.38 (Kibondo) or
16.41 (Lusahunga)
0.16 (Kibondo) or
0.15 (Lusahunga)
The economic analysis reveals that the proposed Muyovozi hydroelectric scheme is an economically attractive
project with a LCOE of 0.0897 $US/kWh (excluding the costs of transmission lines and access roads). Indeed,
the costs of transmission lines will be significantly reduced in the near future with the construction of the 400kV
transmission line between Nyakanazi and Kigoma at horizon 2020, as proposed in the Power Supply Master
Plan (2016).
The mini-grid of Kibondo is currently supplied by a 2.5 MW diesel-fired power station operated by TANESCO.
Hence, the LCOE of the Muyovozi project must be compared with the cost of energy production from the
thermal power plant currently in operation since the Muyovozi project would replace the production of thermal
energy by hydroelectricity. The energy generation cost from thermal power plants depends largely on the fuel
costs. As outlined in the SREP-Investment Plan for Tanzania fuel cost from diesel-fired thermal power plant is
expected to exceed 0.35 US$/kWh[1].
The LCOE of the proposed Muyovozi hydroelectric project is attractive when compared to the 0.108 US$/kWh
corresponding to the standardized small power projects (SPPs) tariff for hydro between 2MW and 3MW in
2016. The latter is the tariff for SPPs selling bulk power to the national or a regional grid or to DNO-Owned
Mini-Grids.
It is important to note that the conclusions of this economic analysis are conditioned to the validation of the flow
duration curve estimated in the hydrological study. This validation can only be done by the hydrological
monitoring of the Muyovozi River. The hydrological monitoring should include not only the continuous
recordings of water levels but also gauging operations of the river for the establishment of validated rating
curves.
[1] Source : SREP - Investment plan for Tanzania
Small Hydropower Resource Mapping Tanzania (~1-10 MW) REA / The World Bank Prefeasibility Study of the Muyovozi Hydroelectric Project
SHER / Mhylab January 2018 Page 77
11 CONCLUSIONS AND RECOMMANDATIONS
The hydrological study revealed that the Muyovozi River is characterized by a good guaranteed low-flow which
should be confirmed by hydrological monitoring of the River.
The preliminary investigation of the surface geology concludes that the site is favorable for the construction of
the project as long as appropriate mitigation measures are put in place. The site has no major problems of
stability and leakages. Further investigations will however have to be undertaken in further studies.
Preliminary socio-environmental studies show that the development of the Muyovozi project has no major
impacts that cannot be mitigated by appropriate measures.
The economic analysis reveals that the construction costs of the 33kV transmission line to Kibondo (or
Lusahunga) mini-grid are high. However, those costs will be significantly reduced in the near future with the
construction of the 400kV transmission line between Nyakanazi and Kigoma at horizon 2020, as proposed in
the Power Supply Master Plan (2016). The Muyovozi hydroelectric project is an economically attractive scheme
with a LCOE of 0.0897 US$/kWh if the costs of the costs of the transmission line and access roads are
excluded. The Muyovozi Project features a production costs significantly lower than the standardized small
power projects (SPPs) tariff for hydro between 2MW and 3MW, as approved by EWURA in 2016 (0.108
US$/kWh).
It is important to note that the conclusions of this economic analysis are conditioned to the validation of the flow
duration curve estimated in the hydrological study. This validation can only be achieved by hydrological
monitoring of the Muyovozi River at the hydrometric station a few kilometers downstream from the proposed
project site. This hydrological monitoring should include not only the continuous water level monitoring but also
the gauging operations of the river for the establishment of a validated rating curve.
Beyond the development of the Muyovozi hydroelectric project, it is strongly recommended that the
Government of Tanzania further develop the existing hydrological monitoring network for its rivers with high
hydropower potential in order to better understand the available water resources and thus promote the
development of hydroelectric projects across the country. It is only in a context of reduced uncertainties through
reliable, recent and long-term records (more than 20 years) that technical parameters and economic and
financial analyzes of hydroelectric developments can be defined accurately, enabling optimization of their
design and their flood control infrastructure (temporary and permanent).
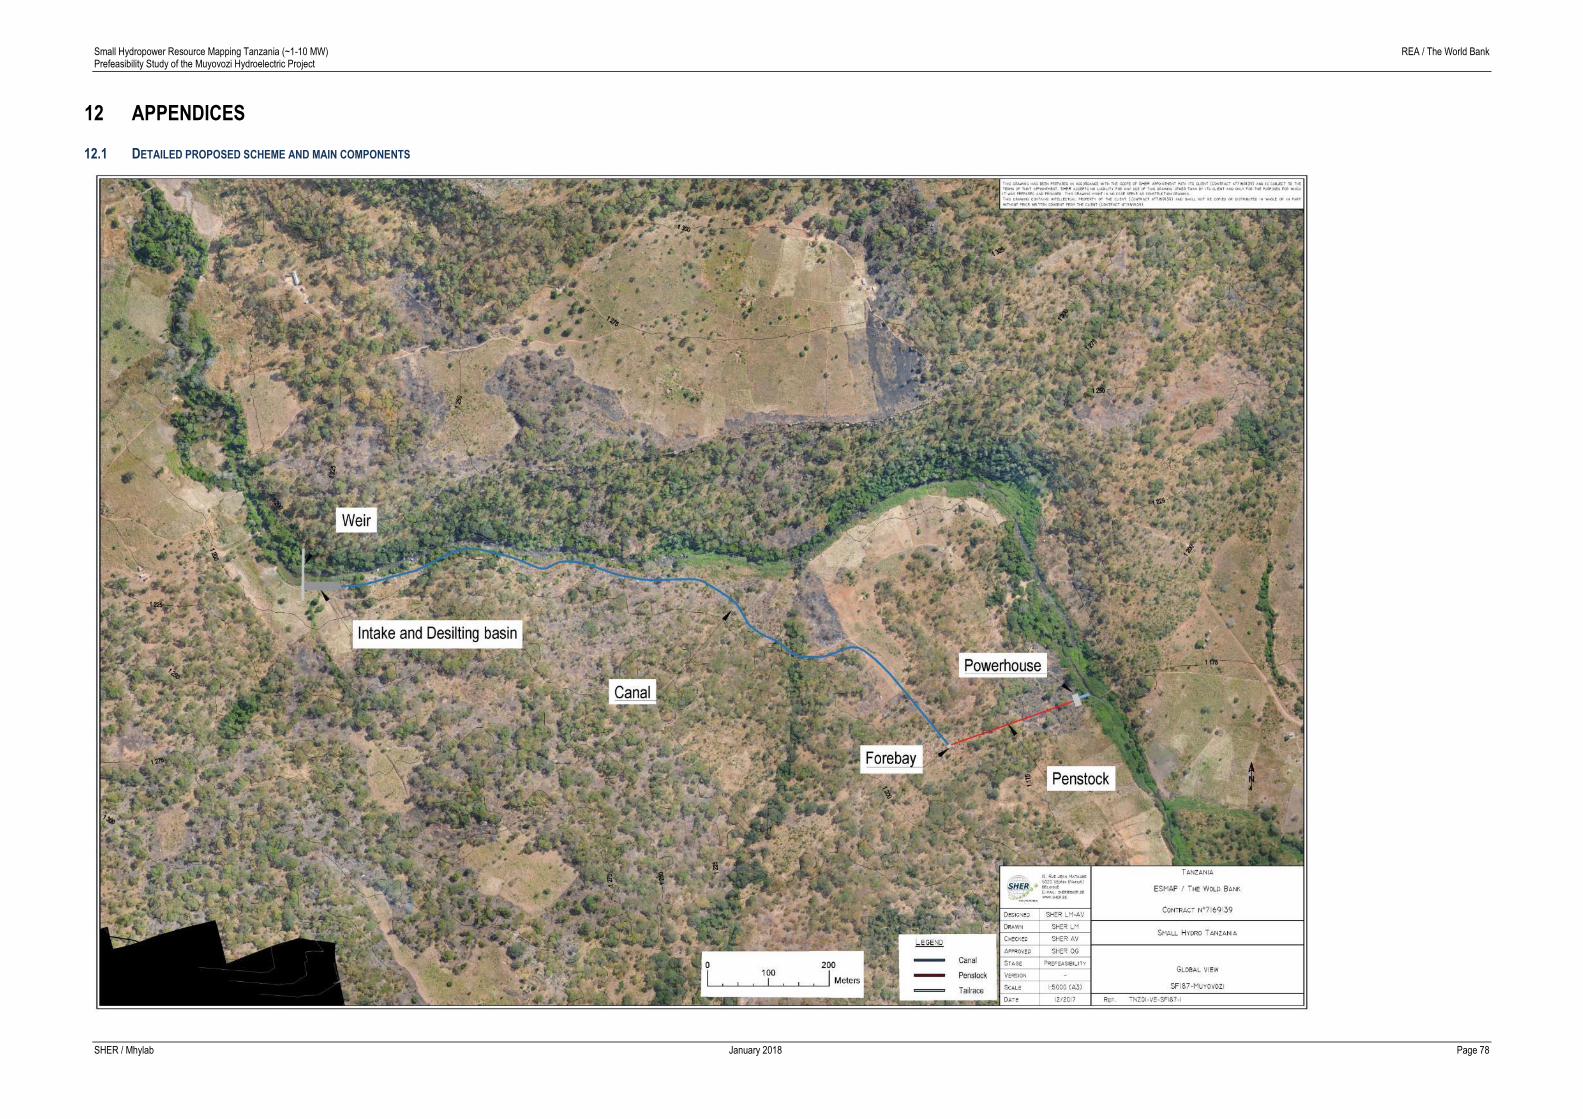
Small Hydropower Resource Mapping Tanzania (~1-10 MW) REA / The World Bank Prefeasibility Study of the Muyovozi Hydroelectric Project
SHER / Mhylab January 2018 Page 78
12 APPENDICES
12.1 DETAILED PROPOSED SCHEME AND MAIN COMPONENTS