Preem Annual report 2018 · barrel the previous year to USD 4.88 per barrel for the full year. ......
48
PREEM ANNUAL REPORT 2018
Transcript of Preem Annual report 2018 · barrel the previous year to USD 4.88 per barrel for the full year. ......

PREEM ANNUAL REPORT 2018

1 | Preem 2018
TABLE OF CONTENTS
DIRECTORS’ REPORT 2
CONSOLIDATED FINANCIAL STATEMENTS 7
NOTES TO THE CONSOLIDATED FINANCIAL STATEMENTS 12
PARENT COMPANY FINANCIAL STATEMENTS 31
PARENT COMPANY NOTES 36
BOARD SIGNATURES 42
AUDITOR’S REPORT 43
OTHER 46

DIRECTORS’ REPORT
2 | Preem 2018
2018
Directors’ Report Preem AB
Preem AB is Sweden’s largest fuel company and accounts for about 80 percent of Swedish refinery capacity and about 30 percent of refinery capacity in the Nordic Region. Preem’s two refineries in Gothenburg and Lysekil are among the most energy-efficient and modern in Europe. They have a total refining capacity of over 18 million m3 per year. Preem conducts refinement of crude oil and renewable feedstocks. A majority of the production is exported to the international market, mainly in Northwestern Europe. In Sweden and Norway Preem sells fuel, heating oil and lubricating oil, as well as other products to both businesses and private individuals. Sales of our products in the Swedish market take place through Preem’s nationwide station network of around 570 filling stations for private and commercial traffic, as well as certified resellers. In Norway, Preem’s products are mainly sold through resellers and in bulk through direct sales.
Profit/lossPreem’s sales revenue rose from SEK 68,752 million in 2017 to SEK 92,553 million in 2018, a 35 percent increase.
Gross profit decreased by SEK 1,288 million to SEK 4,024 million (5,312), including price effects on inventories in the amount of SEK –356 million (1,064). The decrease in profit compared with the previous year is primarily due to declining market prices for crude oil and products.
The average refining margin decreased from USD 5.58 per barrel the previous year to USD 4.88 per barrel for the full year. The lower refining margin was primarily attributable to shrinking margins on gasoline and heavy fuel oil.
Crude oil prices dropped in 2018 from USD 66.54 per barrel at the beginning of the year to USD 50.21 per barrel at year-end. The price gradually increased during the first three quarters to then turned downwards in the fourth quarter. The SEK/USD exchange rate rose during the year with the SEK weakening from SEK 8.15/USD at the start of the year to SEK 8.97 at the end of the year. The average exchange rate to the USD was SEK 8.69 in 2018, compared with SEK 8.54 in 2017.
Total production was 18.9 million m3 (17.5), an increase of almost 8 percent compared with 2017. The proportion of products exported was 60 percent (62), with a value of SEK 55,113 million (42,768).
The Marketing and Sales segment reported a continued strong operating profit of SEK 499 million, compared with SEK 581 million in the previous year. Overhead costs increased by 8 percent, driven by an expanded organization, upgrades to the IT systems and higher insurance costs.
Operating profit dropped to SEK 2,431 million (4,047). Profit before tax amounted to SEK 1,746 million (3,971).
A table of key ratios including definitions is presented on the last page under the Preem Group’s operations in summary.
FactsPreem AB (publ)Corporate ID number 556072-6977.Preem AB (publ) is wholly-owned by Corral Petroleum Holdings AB (publ).Corral Petroleum Holdings AB is a wholly-owned subsidiary of Moroncha Holdings Co. Limited (Cyprus).Preem AB (publ), with its registered office in Stockholm, Sweden and its subsidiary, is Sweden’s largest fuel company. The Parent Company’s address is Warfvinges väg 45, SE-112 80 STOCKHOLM.Figures in parentheses refer to the previous year.
OIL PRICE TREND 2018USD/barrel
REFINING MARGINSUSD/barrel
40
60
80
100
–3
0
3
6
9
12
J F M A M J J A S O N D 2017 2018
– IEA Cracking Ural– IEA Cracking Brent– IEA Hydroskim Brent

DIRECTORS’ REPORT
3 | Preem 2018
Market The average price of crude oil in 2018 was USD 71 per barrel, which was higher than the average price for 2017 of USD 54 per barrel. The year began with a price of USD 66 per barrel. Due to production decreases by OPEC and a number of other countries of which Russia is the most important actor, combined with decreasing inventories, strong global economic growth and higher demand for fuel, the price rose to the top quote for the year of USD 86 per barrel at the beginning of October.
OPEC+, as the group is called, gradually loosened the production restrictions, the United States’ crude oil production set new records during the year and an increasing concern for global economic growth reversed the price curve. Several geopolitical trouble spots affected the view of the world economy, including the greater tension in trade issues between China and the U.S., the development of the UK’s exit from the EU and a higher risk of and actual acts of war in the Middle East. The price dropped and ended up at USD 50 per barrel at the end of the year. OPEC+ again took action in December and decided to reduce production beginning in 2019.
The higher crude oil production in the U.S., through so-called “fracking”, has meant that it has occasionally been at the same actual production level as Saudi Arabia and Russia. The crude oil from the U.S. is relatively low sulfur and light, which has changed the average global quality of crude oil. When OPEC+ limits its production, it is mainly high-sulfur and heavy crude oil that does not reach the market. This means that the global production of heavier oil products, such as high-sulfur heavy fuel oil decreases and the percentage of light products, such as gasoline, increases. The sharply decreased production from Venezuela also leads to a decrease in high-sulfur crude oil.
At the same time, there is some adjustment in the global refinery industry prior to what is called IMO 2020 (International Maritime Organization), which means that the sulfur content of marine fuel is being limited to 0.5 percent if the sulfur is not removed from exhaust gases. This will sharply reduce demand for high-sulfur heavy fuel oil.
Crude oil is normally priced against the “Dated Brent”. The premiums against Dated Brent for low-sulfur crude oil were under pressure in 2018 from higher exports from the U.S. High-sulfur crude oil was strengthened by the reduced global
production. The high-sulfur crude oil that Preem buys the most of had a rising premium during the year and was traded with a positive premium at the end of the year even if the average for the year was USD –1.5 USD per barrel, which is close to the average for 2017.
Demand for biodiesel in Europe had a stable increase during the first half of the year while the margins for the producers in Central and Northern Europe were hard pressed by high feedstock prices, primarily for rape seed. The influx of inexpen-sive imported soy- and palm-based biodiesel from Argentina and Asia forced major cut-backs in the production of rape methyl ester (RME) in the second quarter and part of the third quarter. The EU’s threat of and subsequent introduction of import duties on soy methyl ester (SME) from Argentina and palm methyl ester (PME) from Indonesia and the poor harvest of rape due to the drought in Europe caused a major shortage of RME which in turn resulted in record high premiums, up to around USD 800/mt more than diesel in the last four-month period. A higher mandate and need for RME for the UK for the winter season was also a contributing cause of the price trend.
High demand for waste-based feedstock, such as Used Cooking Oil (UCO) in Europe was met by record high exports, mainly from China. In many European countries, UCO can be counted double in the mandate and often has high Green House Gases (GHG) savings, which is attractive to many buyers in both Southern and Northern Europe. The import of esterified UCO (UCOME) and hydrated vegetable oil (HVO) with the same feedstock origin demonstrated an increasing trend. The large influx competed with domestic production of biodiesel based on animal fat, which was reflected in a somewhat modest price increase during the year.
The HVO market in Sweden was characterized by an inventory build-up in the first half of the year prior to the introduction of required reductions at mid-year. The expected large price increase in connection with the introduction did not materialize and the price of diesel at the pump only rose moderately by SEK 0.25 per liter. The entirely tax-free B100 product (pure RME) grew in volume during the year when it became competitive with regular diesel for heavy traffic despite more frequent service intervals in connection with exemption from taxation beginning on January 1, 2018. The volume of
PURCHASES OF CRUDE OIL 2018Distribution in %
n Russia 42%n North Sea 25%n Other 33%
PURCHASES OF CRUDE OIL 2017Distribution in %
n Russia 49%n North Sea 23%n Other 28%

DIRECTORS’ REPORT
4 | Preem 2018
tax-free HVO 100 in Sweden increased steadily in the first part of 2018, but turned sharply downward after the reduction requirements were introduced. The cause is difficult to interpret, but is probably due to the increased need for HVO to be mixed with diesel to meet the demands of the required reductions.
The difference in value for a refinery’s products and the cost of the crude oil, the margin, is the basis of its profitability. In 2018, the margin for gasoline decreased compared with 2017 especially towards the end of the year. Gasoline production was high and global demand was not at the same level, which meant that inventories increased at the end of the year. The production of diesel was well matched by demand, which meant that global inventories decreased and the margin was strengthened in 2018 compared with 2017.
The margin for heavy fuel oil is likely to remain at a high level for the next year even if the margin decreased in 2018 com-pared with 2017. Global demand is still good for marine fuel, as fuel for electricity production and for the production of bitumen at the same time that a globally lighter crude oil mix and investments in existing refineries and new refineries with low production of heavy fuel oils is reducing the supply. The price for heavy fuel oil will be affected in 2019 by the large change that IMO 2020 (International Maritime Organization) will entail.
In summary, the refineries of the world can be said to have had good profitability during 2018 even if price fluctuations during the year meant some decline compared with 2017.
Production The Group’s operations consist mainly of refining crude oil in its refineries in Lysekil and Gothenburg. Total production for the year amounted to 18.9 million m3, compared with 17.5 million m3 in 2017. The bulk of the crude oil originates from Russia, the North Sea and West Africa. Renewable feedstocks amounting to 204 thousand m3 were used at the refinery in Gothenburg to produce hydrogenated vegetable oil (HVO) for Preem Evolution Diesel, which generated the highest renewable fuel production in Preem’s history.
At the middle of the year, a plant fire occurred in a visbreaker in Lysekil. It affected the second half of the year’s operations in Lysekil. In addition, planned maintenance stops were imple-mented on the Fluid Catalytic Cracker (FCC) and Iso Cracker
(ICR) in Lysekil in spring 2018 and the Green Hydro Treater (GHT) in Gothenburg during the summer. Not counting this, operations during the year were stable with a high plant capacity utilization where January was the month in the refinery in Lysekil’s history with the very highest process utilisation.
Marketing and Sales The Marketing and Sales segment reported strong 2018 earnings with an operating profit of SEK 499 million, compared with SEK 581 million in the previous year. A large positive non-recurring effect from the sale of Preem Gas of SEK 103 million, was included in the previous year’s figures. There was a good volume growth during the year at 6 percent compared with the previous year. It is largely driven by higher sales of heavy fuel oil and fuel oil, which have continued to increase despite the adoption of conversion to other fuels. In September 2017, the operations of Preem Norge AS (YX Bulk) were acquired in Norway, which did not provide a large earnings effect for the 2017 financial year, but in 2018 contributed to higher volumes and earnings.
In 2018, Marketing and Sales changed transport provider. On June 1, the new contract began with the three new transporters: Skanol, Sundfrakt and BDX. The implementation of the new transporters took place in three phases at the same time that the previous transporter Hoyer was phased out. The goal of the new agreement is better control and simplified follow-up.
On July 1, 2018, a new law was introduced, requiring a reduction obligation for gasoline and diesel sales in Sweden. The law demands that fuel suppliers reduce the fuel’s climate impact by gradually increasing the percentage of renewable feedstock in gasoline and diesel. This means that the proportion of renewable feedstocks will increase in both gasoline and diesel.
Consumer gasoline and diesel prices were SEK 14.70 and 14.55 per liter, respectively, at the start of the year and rose until the autumn when they reached the year-high levels of SEK 16.21 and 16.68 per liter, respectively, in October. The prices then dropped somewhat in the last two months of the year. Gasoline and diesel prices closed out the year at SEK 14.64 and 15.66 per liter, respectively. A part of the rising consumer price of diesel can be traced to the introduction of required reductions.
SALES IN SEK 2018Distribution in %
SALES IN SEK 2017Distribution in %
n Sweden 38%n Netherlands 22%n Other countries 18%n UK 12%n Rest of Nordic region 6%n Norway 4%
n Sweden 38%n UK 21%n Netherlands 17%n Other countries 13%n Rest of Nordic region 7%n Norway 4%

DIRECTORS’ REPORT
5 | Preem 2018
Environment Preem operates several businesses that are subject to permit-ting or reporting under the Swedish Environmental Code. The main environmental impact is from atmospheric emissions of carbon dioxide, nitrogen oxides, sulfur oxides and volatile hydrocarbons, as well as emissions to water and noise.The overall focus of Preem’s safety, health and environment efforts is described in a new integrated policy, the Safety, Health and Environment Policy. Policy compliance is secured by using procedures and instructions in the Company’s manage-ment system. Compliance checks for the management system take the form of safety rounds, internal and external audits, and deviation reporting and management.
The refineries in Lysekil and Gothenburg have permits for so-called A operations. The permits are subject to conditions and an associated inspection program. In 2018, Preem achieved all limits, except an operating limit that was marginally exceed without effect on the emissions values. A few target values were not met, so remedial action was taken, and the regulatory authority was informed.
Preem submitted an environmental application for expan-sion of the Lysekil refinery to the Land and Environment Court in December 2016. The proceedings were held before the court in autumn 2017. After the summer of 2018, the application documents were supplemented with an inventory of the potential occurrence of the species Natterer’s bat in the area and, in November 2018, the permit was granted. Thereafter, appeals were filed with the Land and Environmental Court of Appeal, which will determine whether a leave to appeal will be granted. Until the review is completed, the permit is postponed.
Carbon dioxide emissions from the refineries are included in the EU emission rights trading system, and the number of freely allocated emission rights covered a total of 1.96 million metric tons per year on average for the current trading period, 2013-2020, according to a decision by the Swedish Environ-mental Protection Agency. The Group’s two refineries in Lysekil and Gothenburg have been allocated emission rights free of charge for one year at a time. Unutilized emission rights may be carried forward to subsequent years within the relevant period. Any deficit is covered by a purchase of emission rights on a market or through improvements in energy efficiency.
The depots have permits for so-called B operations with associated conditions and inspection programmes. The limits for hydrocarbon emissions to water were exceeded on a few occasions in 2018 at the depot in Norrköping and on one occasion at the depot in Skarvik. The regulatory authority was notified of this and actions were taken. On one occasion, the Vapor Recovery Unit (VRU) at the depot in Skarvik was struck by an unplanned stop in connection with the unloading of class-1 products. The supervisory authority was notified, but chose not to act further in the matter.
Most Preem filling stations and diesel facilities handle more than 1,000 m3 of fuel per calendar year, which means they are subject to reporting requirements for C operations. Such reporting occurs continuously to the appropriate municipality. Preem maintains ongoing communication with the regulatory authority on environmental matters at our filling stations
Remediation of contaminated soil at closed depots, filling stations and Såifa facilities is ongoing and continued in 2018.
Sustainability reportPreem has prepared a sustainability report in line with the requirements of Chapter 6 of the Swedish Annual Accounts Act. It is published as a PDF-file at preem.se/om-preem/finansiell_info and can be ordered as a printed report.
Investments Preem's net capital expenditures on intangible assets and property, plant and equipment totaled SEK 2,084 million (2,347). The expenditure attributable to the maintenance shutdown totaled SEK 84 million, and an additional SEK 662 million was invested in operational improvements on top of that. SEK 1,071 million was invested in profitability improvements, SEK 146 million in establishing and renovating stations and SEK 121 million on environmental and safety improvement measures.
Product development For many years, Preem has had a vision of leading the transi-tion to a sustainable society. Since 2016, we have set an objective of producing 3 million cubic meters of renewable fuel per year by 2030. Sweden’s intentions in the transport sector are ambitious, with an objective of reducing emissions from the transport sector by 70 percent compared with the level of 2010.
During the year, Preem made a number of decisions leading to this goal. Among other things, Preem decided to build a plant together with Bergene Holm AS to produce renewable feedstock from remains from the forest industry. The plant will be built adjacent to one of Bergene Holm’s large sawmills in Åmli Municipality in Southern Norway. The plant will be planned in 2019 and is scheduled for completion in 2022. Preem is investing NOK 250 million in this project. The technology comes from Shell’s subsidiary CRI and is based on hydrogen pyrolysis.
In the same area, Preem has also initiated a cooperation with the semi-state-owned Setra Group, which through the joint company Pyrocell, is planning on building an initial pyrolysis plant adjacent to the Kastet sawmill in Gävle harbor. This technology differs from the technology being tested in Norway, and the product needs more catalytic processing before it can be used as a transport fuel, but will also be able replace fossil fuel oils.
At Preemraff, the expansion of the production capacity of hydrated vegetable oils (HVO) is now being planned from today’s 200,000 cubic meters to 1,300,000 cubic meters by 2023. The environmental review is under way and in parallel with this the existing Green HydroTreater (GHT) is being converted to handle a larger through-put. These two projects will be the largest investment in the refinery since the expan-sion was done in the mid-90s.
In Lysekil, various plants are being planned to be able to jointly process renewable feedstocks in the same facilities as fossil products are produced. Minor adjustments are planned and will be implemented during the stop in 2019. Preem wants capacity to produce renewable products at both of our refineries to meet a growing demand from Sweden, Norway and the rest of Northern Europe.

DIRECTORS’ REPORT
6 | Preem 2018
The cooperation with Vattenfall is continuing and project planning of a first electrolytic hydrogen gas plan is remains under way and is a part of the expansion in Gothenburg. This means that renewable electricity will be converted to renewable hydrogen gas by splitting water. The hydrogen gas will be used to make HVO production even more renewable and at the same time, be able to support a power grid that is increasingly dependent on renewable power sources, such as wind and solar power.
In research and development, the initiatives in lignin extraction and upgrading are continuing through the coopera-tion with RenFuel, where Preem together with Rottneros is project planning an initial lignin facility for biofuel at the transition for biofuel and at the pulp mill in Vallvik. The plant is estimated to produce an annual volume of 25,000–30,000 ton of lignin and will be finished by 2021.
Financing and liquidity In the spring of 2016, all of the company’s financial liabilities were extended. The new loans have 4.5-year terms, maturing in November 2020. At the end of the period, consolidated net debt totaled SEK 7,096 million, compared with SEK 5,129 million at December 31, 2017.
Personnel The average number of employees of the Group was 1,483 (1,458), of whom 1,454 (1,439) worked at the Parent Company.
OutlookThe geopolitical risks remain and may be brought to a head in connection with the situation concerning the trade issues between the USA and China. In addition, uncertainty is extensive in the Middle East, which affects the oil market, as does the situation in Venezuela, Libya and others. The forecast for global trade is, despite this, still positive with growth of 3 percent. This growth will continue to increase the consumption of energy, not least of oil products even if there will be a growth of electrical vehicles in Europe. This continued strong demand is assumed to lead to an oil price that will be slowly rising. There being sharp increases during brief periods is not unlikely considering geopolitical circumstances and quickly arising crises.
In 2019, Preem will implement a major stop in the Lysekil refinery. This is a recurring stop that is performed once every six years and will entail a total overhaul of the refinery. For the refinery in Gothenburg, no major stop is planned as the latest major stop took place in 2017. In addition, the major invest-ments in the Vacuum Distillation Unit (VDU) in Lysekil and the Hydrogen Production Unit (HPU) in Gothenburg will be concluded and commissioned and thereby begin to contribute positively to the refinery margin.
The principal for Preem, Mohammed Al-Amoudi, regained his freedom at the end of January and is now back in his home in Jeddah, Saudi Arabia. As far as Preem is aware, there are no charges directed at Mohammed and the Preem Group is continuing its business operations as before.
Proposed appropriation of profits The Parent Company’s non-restricted equity amounted to SEK 10,909,709,144.
The Board of Directors proposes that this amount be appropriated as follows (SEK thousands)Carried forward 10,909,709 Total 10,909,709
Basis for decision by Board of Directors This annual report discloses that a Group contribution amount-ing to SEK 1,048 million was paid to the Parent Company, Corral Petroleum Holdings AB (publ), and that the Board of Directors proposes that the non-restricted equity be carried forward. Corral Petroleum Holdings AB (publ) has provided an uncondi-tional shareholders’ contribution to Preem AB (publ) in the amount of SEK 400 million. In addition, a dividend of SEK 380 million was paid to Corral Petroleum Holdings AB in June 2018.
Motivation The Company’s equity has been calculated in compliance with Swedish law in accordance with Recommendation RFR2 of the Swedish Financial Reporting Board. The Board of Directors has found that the Company’s and the Group’s restricted equity is fully covered following the Group contribution paid.
In light of the financial position at December 31, 2017, and the 2018 business plan, the Board of Directors found that the Group contribution paid to the shareholder is justifiable in consideration of the parameters specified in Chapter 17 Section 3 Paragraphs 2 and 3 of the Swedish Companies Act (type, scope and risks of operations, the Company and Group’s consolidation needs, liquidity and financial position in other respects, and the forecast performance of the Company and Group in 2018).
Please see the following financial statements and their notes for more information about the Company’s financial position and performance.

CONSOLIDATED FINANCIAL STATEMENTS
7 | Preem 2018
Income statement and statement of other comprehensive incomeAMOUNTS IN SEK MILLIONS
Income statement Note 2018 2017
Net sales 103,641 78,581
Excise duties1) –11,087 –9,829
Sales revenue 4, 14 92,553 68,752
Cost of goods sold 8, 10, 14 –88,529 –63,440
Gross profit 5 4,024 5,312
Selling expenses –913 –866
Administrative expenses –1,123 –864
Other operating income 11 443 465
Operating profit 6-11, 33 2,431 4,047
Financial income 11 311
Financial expenses –697 –386
Net financial items 12, 14 –685 –75
Profit before tax 1,746 3,971
Tax on profit for the year 13 –271 –890
Profit for the year 1,475 3,081
PROFIT/LOSS FOR THE YEAR ATTRIBUTABLE TO:
Parent Company shareholders 1,475 3,081
Non-controlling interests 0 0
1,475 3,081
Statement of comprehensive income
Profit for the year 1,475 3,081
OTHER COMPREHENSIVE INCOME
Items that may be reclassified to the income statement:
Translation difference –1 –1
Items that will not be reclassified to the income statement:
Actuarial gains/losses on defined benefit pension plans 23 –47 –2
Tax attributable to the item above 10 0
Changed tax rate 1 –
Total other comprehensive income for the year, net of tax –37 –3
Total comprehensive income for the year 1,438 3,079
TOTAL COMPREHENSIVE INCOME FOR THE YEAR ATTRIBUTABLE TO:
Parent Company shareholders 1,438 3,079
Non-controlling interests 0 0
1,438 3,079
1) Excise duties refer to energy tax, carbon dioxide tax, sulfur tax and alcohol tax

CONSOLIDATED FINANCIAL STATEMENTS
8 | Preem 2018
AMOUNTS IN SEK MILLIONS
ASSETS Note 12/31/2018 12/31/2017
NON-CURRENT ASSETS
Intangible assets
Goodwill 15 308 308
Construction in progress 15 779 521
Other intangible assets 15 129 153
1,215 981
Property, plant and equipment
Land and buildings 16, 30 1,613 1,366
Plant and machinery 16 5,200 5,313
Capitalized turnaround costs 16 439 638
Equipment, tools, fixtures and fittings 16 347 386
Construction in progress 16 2,974 1,978
10,573 9,681
Financial assets
Participations in associates 17 238 194
Receivables from associates 33 0 0
Receivables from affiliates 18, 33 0 0
Other shares and participations 19, 32 11 26
Other non-current receivables 34 124 91
373 312
Total non-current assets 12,161 10,974
CURRENT ASSETS
Inventories 20 10,543 10,691
Trade receivables 21, 30, 32 4,322 4,674
Derivatives 27, 32 2 –
Receivables from Parent Company 32, 33 55 55
Other receivables 32, 33 1,018 568
Prepaid expenses and accrued income 700 372
16,639 16,360
Cash and cash equivalents 22, 32 292 256
Total current assets 16,931 16,616
TOTAL ASSETS 29,092 27,591
Balance sheet

CONSOLIDATED FINANCIAL STATEMENTS
9 | Preem 2018
AMOUNTS IN SEK MILLIONS
EQUITY AND LIABILITIES Note 12/31/2018 12/31/2017
EQUITY
Equity attributable to Parent Company shareholders
Share capital 610 610
Other paid-in capital 2,482 2,482
Profit brought fwd. including profit for the year 9,798 9,158
12,890 12,250
Non-controlling interests 0 0
Total equity 12,890 12,250
LIABILITIES
Non-current liabilities
Pension obligations 23 159 109
Deferred tax liabilities 13 853 841
Other provisions 24 244 142
Borrowings 25, 26, 32 6,711 4,191
7,967 5,283
Current liabilities
Borrowings 25, 26, 32 488 903
Advance payments from customers 5 5
Trade payables 32, 33 2,709 3,529
Liabilities to associates 32, 33 96 89
Current tax liabilities 13 17 –
Derivatives 27, 32 1 3
Other liabilities 28, 32 1,472 1,413
Accrued expenses and deferred income 29 3,448 4,116
8,239 10,057
Total liabilities 16,202 15,341
TOTAL EQUITY AND LIABILITIES 29,092 27,591
Pledged assets and contingent liabilities 30
Balance sheet
CONSOLIDATED FINANCIAL STATEMENTS
10 | Preem 2018
AMOUNTS IN SEK MILLIONS
Attributable to Parent Company shareholders Non- controlling
interests Total equityShare capitalOther paid-in
capitalTranslation
reserveProfit brought
forward Total
Opening equity 1/1/2017 610 2,482 – 5,870 8,962 0 8,962
Profit for the year – – – 3,081 3,081 0 3,081
Other comprehensive income – – –1 –2 –3 – –3
Comprehensive income for the year – – –1 3,080 3,079 0 3,079
Group contributions paid – – – –4,200 –4,200 – –4,200
Tax attributable to Group contribution paid – – – 924 924 – 924
Shareholder’s contribution received – – – 3,840 3,840 – 3,840
Dividends – – – –355 –355 – –355
Closing equity 12/31/2017 610 2,482 –1 9,159 12,250 0 12,250
Opening equity 1/1/2018 610 2,482 –1 9,159 12,250 0 12,250
Adjustment according to IFRS 9 – – – 0 0 0 0
Profit for the year – – – 1,475 1,475 0 1,475
Other comprehensive income – – –1 –36 –37 – –37
Comprehensive income for the year – – –1 1,439 1,438 0 1,438
Group contributions paid – – – –1,048 –1,048 – –1,048
Tax attributable to Group contribution paid – – – 231 231 – 231
Shareholder’s contribution received – – – 400 400 – 400
Dividends – – – –380 –380 – –380
Closing equity 12/31/2018 610 2,482 –2 9,800 12,890 0 12,890
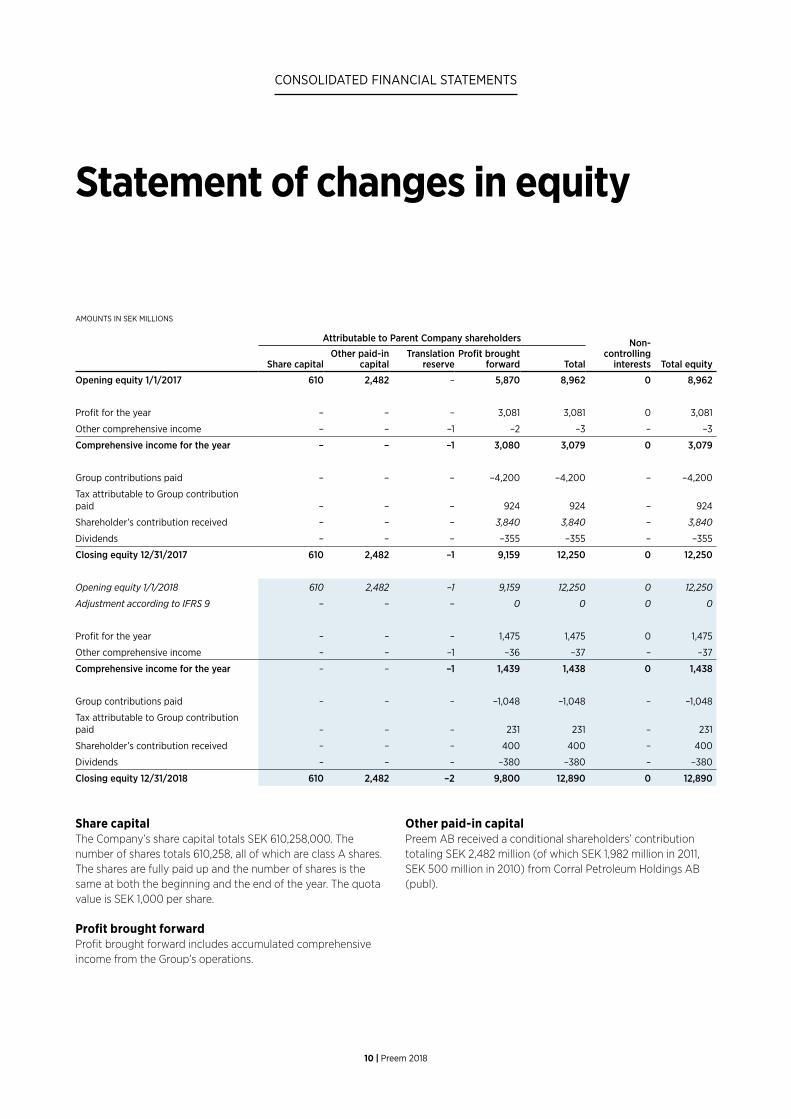
Statement of changes in equity
Share capitalThe Company’s share capital totals SEK 610,258,000. The number of shares totals 610,258, all of which are class A shares. The shares are fully paid up and the number of shares is the same at both the beginning and the end of the year. The quota value is SEK 1,000 per share.
Profit brought forwardProfit brought forward includes accumulated comprehensive income from the Group’s operations.
Other paid-in capitalPreem AB received a conditional shareholders’ contribution totaling SEK 2,482 million (of which SEK 1,982 million in 2011, SEK 500 million in 2010) from Corral Petroleum Holdings AB (publ).

CONSOLIDATED FINANCIAL STATEMENTS
11 | Preem 2018
AMOUNTS IN SEK MILLIONS
Note 2018 2017
OPERATING ACTIVITIES
Profit before tax 1,746 3,971
Adjustments for non-cash items 31 1,112 1,065
2,858 5,036
Tax paid –5 –4
Cash flow from operating activities before changes in working capital 2,852 5,032
CASH FLOW FROM CHANGES IN WORKING CAPITAL
Increase (–)/Decrease (+) in inventories –263 –2,232
Increase (–)/Decrease (+) in operating receivables 60 –885
Increase (+)/Decrease (–) in operating payables –1,517 1,049
Cash flow from operating activities 1,133 2,964
INVESTING ACTIVITIES
Acquisition of subsidiaries –26 –123
Disposal of subsidiaries – 103
Acquisition of intangible assets –265 –268
Acquisition of property, plant and equipment –1,798 –2,069
Disposal of property, plant and equipment 34 21
Investment in financial assets –54 –36
Disposal of financial assets 25 25
Cash flow from investing activities –2,084 –2,347
FINANCING ACTIVITIES
Dividends paid –380 –355
Borrowings 9,894 6,957
Repayment of loans –7,869 –6,731
Group contributions paid –648 –360
Cash flow from financing activities 997 –490
Cash flow for the year 46 127
Opening cash and cash equivalents 256 123
Exchange gains/losses on cash and cash equivalents –10 6
Closing cash and cash equivalents 22 292 256
For supplementary disclosures, see Note 31
Cash flow statement

NOTES TO THE CONSOLIDATED FINANCIAL STATEMENTS
12 | Preem 2018
NOTE 1. Significant accounting policiesOn March 13, 2019, the Board of Directors approved this annual report and these consolidated financial statements for publication and will sub-mit them to the Annual General Meeting for adoption on April 18, 2019.
The most important accounting policies applied in preparing these consolidated financial statements are described below. Unless otherwise specified, these policies have been applied consistently.
BASIS ON WHICH THE FINANCIAL STATEMENTS HAVE BEEN PREPAREDThe consolidated financial statements for the Preem AB Group (Preem) have been prepared in accordance with the International Financial Reporting Standards (IFRS) as adopted by the EU, apart from IAS 33, Earnings per Share, since Preem AB is not listed on a regulated market. In addition, RFR 1 “Supplementary Accounting Rules for Groups” issued by the Swedish Financial Reporting Board was applied. The consolidated financial statements have been prepared using the cost method, apart from other shares and participations and financial assets and liabilities at fair value through profit or loss.
The preparation of financial statements in conformity with IFRS requires the use of certain critical accounting estimates. It also requires management to exercise its judgment in the process of applying the Group’s accounting policies. For areas that involve a high degree of assessment, which are complex or where assumptions and estimates are significant to the consolidated financial statements, see Note 3.
The financial statements are presented in the Swedish krona (SEK), which is the Parent Company’s functional currency. Unless otherwise stated, all figures are rounded to the nearest million. Amounts in the Group consolidation system are based on SEK thousands. Due to the rounding of figures in the tables to the nearest SEK million, the total amount is not exactly equal to the sum of all components in some cases.
STANDARDS, AMENDMENTS AND INTERPRETATIONS THAT CAME INTO EFFECT IN 2018The Group applies IFRS 15 Revenue from Contracts with Customers and IFRS 9 Financial Instruments for the first time beginning on 1 January 2018. It has not had any significant impact on the Group’s financial state-ments. No restatement of comparative information was necessary.
Notes to the consolidated financial statements
Other upcoming amendments that came into effect are not expected to have any significant impact on the Group’s financial statements.
IFRS 9 FINANCIAL INSTRUMENTSIFRS 9 establishes principles for the recognition and measurement of financial assets, financial liabilities and some contracts for the purchase and sale of non-financial instruments. This standard replaces IAS 39 Financial Instruments: Recognition and Measurement.
It has not had any significant impact on the Group’s financial state-ments. Restatement of expected credit losses according to IFRS 9 reduced profit brought forward by SEK 0.4 million.
Classification and measurement of financial assets and financial liabilitiesIFRS 9 contain three principle classification categories for financial assets. Measured at amortised cost, at fair value through other compre-hensive income and at fair value through profit or loss. The classifica-tion of financial assets according to IFRS 9 is generally based on the company’s business model for the management of the financial assets and the characteristics of the contractual cash flows from the financial asset. IFRS 9 eliminates the earlier IAS 39 categories of investments held to maturity, loans and receivables, and available-for-sale financial assets. The introduction of IFRS 9 has not had a material impact on the Group’s accounting policies related to financial assets.
IFRS 9 generally retains the existing requirements in IAS 39 for the classification and measurement of financial liabilities. The introduction of IFRS 9 has not had a material impact on the Group’s accounting policies related to financial liabilities and derivatives.
The following table explains original measurement categories ac-cording to IAS 39 and the new measurement categories according to IFRS 9 for each class of the Group’s financial assets and liabilities as of January 1, 2018.
The effect of the introduction of IFRS 9 on the carrying amounts of the financial assets as of January 1, 2018 relates solely to the new impair-ment requirements.
NoteOriginal classification
according to IAS 39New classification
according to IFRS 9Financial assetsDerivatives Fair value through profit or loss Fair value through profit or lossOther shares and participations1) Fair value through profit or loss Mandatory at fair value
through profit or lossTrade receivables and other receivables2) Loans and receivables Amortized costCash and cash equivalents Loans and receivables Amortized cost
Financial liabilitiesDerivatives Fair value through profit or loss Fair value through profit or lossBorrowings Other financial liabilities Other financial liabilitiesTrade payables and other liabilities Other financial liabilities Other financial liabilities
1) According to IAS 39, these securities were identified as financial instruments at fair value through profit or loss since they were managed on a fair value basis and their development was followed up on this basis. These assets have been classified as mandatory measurement at fair value through profit or loss according to IFRS 9.
2) Trade receivables and other receivables that under IAS 39 were classified as loans and receivables are now classified as financial assets measured at amortized cost. An increase of SEK 0.4 million in the provision for impairment losses for these receivables is recognized in the opening balance for profit brought forward as of January 1, 2018 at the transition to IFRS 9.

NOTES TO THE CONSOLIDATED FINANCIAL STATEMENTS
13 | Preem 2018
IFRS 15 REVENUE FROM CONTRACTS WITH CUSTOMERSIFRS 15 is a comprehensive standard for determining how much revenue should be recognized and when. It replaces IAS 18 Revenue, IAS 11 Con-struction Contracts and associated interpretations. According to IFRS 15, revenue is recognized when the customer takes control over the goods or services. Determining the time for transfer of control, i.e. at a certain point in time or over time, requires assessments.
The Group has reviewed sales contracts in accordance with the five-step model in IFRS 15. The contracts pertain to specific goods and the revenue is recognized when control is transferred, which happens at a specific time. The transition has not had any material impact on the Group’s financial statements.
NEW IFRS AND INTERPRETATIONS THAT HAVE NOT YET ENTERED INTO EFFECTSeveral new or amended IFRS that will enter into effect during future financial years have not been subject to early adoption in the prepara-tion of these financial statements. There are no plans for early adoption of new or amended standards that enter into effect in the future.
Upcoming amendments which are currently estimated to potentially have an impact on the consolidated financial statements are described below.
IFRS 16 LeasesThe Group will apply IFRS 16 Leases as of January 1, 2019. IFRS 16 intro-duces a uniform lease recognition model for lessees. A lessee recognizes a right of use (ROU) asset that represents a right to use the underlying asset and a lease liability that represents an obligation to make lease payments. There are exceptions for short-term leases and the leasing of assets of a low value. The recognition for lessors is similar to the current standard, i.e. lessors continue to classify leases as finance or operating leases.
IFRS 16 Leases replaces existing IFRS related to the recognition of leases, such as IAS 17 Leases, IFRIC 4 Determining whether an Arrange-ment contains a Lease, SIC 15 Incentives in connection with signing operating leases and SIC 27 Evaluating the Substance of Transactions in the Legal Form of a Lease.
Leases where the Group is the lesseeThe Group will recognize new assets and liabilities for leases previously recognized as operating leases for properties, tankers and other minor assets. The costs for these leases will change since the Group will recognize amortization for ROU assets and interest expenses for lease liabilities.
Previously, the Group recognized operating lease costs on a straight-line basis over the lease term and recognized assets (prepaid lease payments) and liabilities (accrued lease payments) only insofar as there was a difference between actual lease payments and recognized costs.
Based on the information available, the Group estimates that on 1 January 2019 it will recognize a lease liability of approximately SEK 500 million. The ROU asset will amount to the value of the liability plus the prepaid lease expenses recognized on 31 December 2018.
The Group does not expect the introduction of IFRS 16 to impact its ability to meet the revised maximal debt/equity ratio that exists in the loan terms for the Group.
Leases where the Group is the lessorNo material impact is expected for leases where the Group is the lessor.
Transition and exemption rulesThe Group will apply the modified retroactive method. This means that the accumulated effect of the IFRS 16 introduction will be recognized in profit brought forward in the opening balance as of 1 January 2019 with-out the restatement of comparative figures. The ROU assets attributable to earlier operating leases will be recognized at the liability’s value on January 1, 2019 with addition for prepaid lease payments recognized on the balance sheet as of December 31, 2018.
Leases of low value (assets of a value of less than around SEK 50,000 in new condition) – which is mainly comprised of tools, computers, printers/ copiers and coffee machines – will not be included in the lease liability, but will continue to be recognized with straight-line expensing over the lease term. The occurrence of leases with a lease term of a maximum of 12 months, so-called short-term leases, are not deemed to be material to the Group.
Because the lease payments for low-value leases are included in the disclosures in this annual report regarding minimum lease payments for operating leases, the aforementioned lease liability increase amounts to a sum below the present value of these minimum lease payments by around SEK 32 million.
Other new and amended IFRS with future application are not expect-ed to have any material effect on the company’s financial statements.
BALANCE SHEET CLASSIFICATIONNon-current assets and non-current liabilities essentially consist of amounts that are expected to be recovered or paid more than 12 months after the balance sheet date.
Current assets and current liabilities essentially consist of amounts that are expected to be recovered or paid within 12 months of the balance sheet date.
BASIS OF CONSOLIDATION AND BUSINESS COMBINATIONSSubsidiariesSubsidiaries are companies (including structured entities) that are under the controlling influence of Preem. “Controlling influence” means having a direct or indirect right to formulate a company’s financial and operational strategies for the purpose of receiving economic bene-fits. When assessing whether control exists, consideration is given to potential shares providing entitlement to vote that can be immediately used or converted. Subsidiaries are included in the consolidated financial statements as of the date on which control was transferred to the Group. They are excluded from the consolidated financial statements as of the date on which control ceases.
The acquisition method is used to recognize the Group’s acquisitions of subsidiaries. The cost comprises the fair value of assets given as payment, equity instruments issued, and liabilities arising or assumed as of the transfer date. Transaction expenses directly attributable to the acquisition are recorded as an expense as they arise. Identifiable acquired assets and assumed liabilities and contingent liabilities in a business combination are initially measured at the fair values on the ac-quisition date, regardless of the extent of any non-controlling interests. The surplus that comprises the difference between the cost and the fair value of the Group’s share of identifiable acquired assets, liabilities and contingent liabilities is recognized as goodwill. When the difference is negative, this is recognized in profit/loss for the year.
Internal Group transactions, balance sheet items and unrealized gains on transactions between Group companies are eliminated. Unrealized losses are also eliminated, although any losses are viewed as an indica-tion that there is a need for an impairment of the transferred asset. The accountingpolicies for subsidiaries have been amended as appropriate to guarantee consistent application of the Group’s policies.
AssociatesAssociates are all companies in which the Group has significant but not controlling influence, which mainly applies to shareholdings of between 20 percent and 50 percent of votes. As of the date on which significant influence is obtained, participations in associates are recognized in the consolidated financial statements in accordance with the equity method and are measured initially at cost. The Group’s carrying amount of par-ticipations in associates includes goodwill identified upon acquisition, net of any necessary impairment losses.
Any difference upon acquisition between the cost of the holding and the investors share of the fair value of the associate’s net identifiable assets, liabilities and contingent liabilities is recognized using the same principles as used for the acquisition of subsidiaries.
The Group’s share of profit/loss in associates arising after the acquisi-tion is recognized in profit/loss for the year. Accumulated changes after the acquisition are recognized as a change in the carrying amount of the holding. When the Group’s share in an associate’s losses is equal to or exceeds its holding in the associate, including any unsecured receivables, the Group does not recognize any additional losses unless the Group has assumed obligations or made payments on behalf of the associate.
Unrealized gains on transactions between the Group and its associates are eliminated in proportion to the Group’s holding in the associate. Unrealized losses are also eliminated, unless the transaction constitutes evidence that there is a need for impairment of the transferred asset. The equity method is applied until the date on which significant influ-ence ceases.
Note 1. Cont.

NOTES TO THE CONSOLIDATED FINANCIAL STATEMENTS
14 | Preem 2018
Joint venturesJoint ventures, usually conducted in corporate form, are cooperative arrangements where the Group and one or more partners have a right to all economic benefits related to the venture’s assets. In addition, the settlement of the venture’s liabilities is dependent on the parties purchases of output from the venture or capital contributions to the venture. Joint ventures are recognized according to the “proportional consolidation principle”, which means that the respective party in a joint venture recognizes its share of assets, liabilities, income and expenses.
SEGMENT REPORTINGAn operating segment is a part of the Group that runs operations from which it can generate revenues and incur costs for which separate financial information is available. An operating segment’s results are monitored by the Group’s senior executives to evaluate performance and to allocate resources to the operating segment. See Note 4 for more information on the classification and presentation of segments.
TRANSLATION OF FOREIGN CURRENCY Transactions and balance sheet items Transactions in foreign currency are translated into the functional currency at the exchange rates prevailing on the date of the transaction. Exchange rate gains/losses arising on payment of such transactions and when translating monetary assets and liabilities in foreign currency at the exchange rate on the balance sheet date are recognized in profit/loss for the year. Exchange rate changes that arise during the time between invoicing and payment for products affect the Group’s gross profit/loss. Other exchange rate changes affect the Group’s net financial items. The Company does not hedge transactions or investments in foreign currency. Non-monetary assets and liabilities are recognized at the exchange rates prevailing on the date of the transaction.
Group companiesThe financial performance and financial position of all Group companies that have different functional and reporting currencies are translated into the Group’s presentation currency as follows: assets and liabilities are translated at the exchange rate on the balance sheet date, revenue and expenses are translated at the average exchange rate, and all exchange differences that arise are recognized in other comprehensive income.
In connection with consolidation, exchange differences arising from the translation of net investments in a foreign operation are posted to other comprehensive income with an accumulated effect in equity. On the partial or complete disposal of a foreign operation, the exchange rate differences recognized in equity are posted to profit/loss for the year and recognized as a component of the capital gain/loss.
Goodwill and fair value adjustments arising on the acquisition of a foreign operation are treated as assets and liabilities in this operation and are translated at the exchange rate on the balance sheet date.
INTANGIBLE ASSETSGoodwillGoodwill consists of the amount at which cost exceeds the fair value of the Group’s share of the acquired subsidiary’s/associate’s net identifia-ble assets on the acquisition date. Goodwill on acquisition of subsidiar-ies is recognized as an intangible asset. Goodwill is tested at least on an annual basis to identify any impairment requirements and is recognized at cost less accumulated impairment losses. Impairment of goodwill is not reversed. Gains or losses on disposal of a unit include the remaining carrying amount of the goodwill relating to the disposed unit.
Goodwill is allocated among cash-generating units in connection with impairment testing. This allocation is applied to cash-generating units or groups of cash-generating units that are expected to benefit from the business combination which gave rise to the goodwill item. The Group allocates goodwill among segments. The Group’s carrying amount of goodwill of SEK 308 million (308) is allocated in its entirety to the Supply and Refining segment.
Other intangible assetsOther intangible assets comprise customer contracts, proprietary IT sys-tems and licenses. These assets are measured at cost less amortization and impairment losses. Borrowing costs are included in proprietary IT systems in the same manner as for property, plant and equipment. The intangible asset is amortized on a straight-line basis over the useful life of the asset, and amortization begins when the asset is commissioned. The value of the asset is tested at least once a year for impairment and an impairment loss is recognized on it if this impairment testing shows that its value in use is less than its carrying amount.
The Group has no other intangible assets that can be capitalized. As a result, expenses such as those for internally generated goodwill and trademarks are recognized as incurred.
Construction in progressConstruction in progress refers to proprietary IT systems and licenses.
PROPERTY, PLANT AND EQUIPMENTAll property, plant and equipment are recognized at cost less accumulat-ed depreciation and impairment losses. Property, plant and equipment consisting of elements with different useful lives are treated as separate components of property, plant and equipment.
Cost includes expenses that can be directly attributed to the ac-quisition of the assets. Additional expenses are added to the asset’s carrying amount or are recognized as a separate asset, as applicable. The expenses are added to the asset’s carrying amount only if it is likely that the future economic benefits associated with the asset will flow to the Group and the asset’s cost can be measured reliably. The carrying amount of the replaced element is derecognized from the balance sheet. All other kinds of repairs and maintenance are recognized as expenses during the period in which they arise.
To adjust their cost down to their estimated residual value over their estimated useful life, other assets are depreciated on a straight-line basis as follows:
Buildings and storage chambers 20–50 yearsLand improvements 20 yearsPlant and machinery 10–30 yearsCapitalized turnaround costs for refineries 6 yearsEquipment, tools, fixtures and fittings 3–10 years
The refinery facilities consist of several components with different useful lives. The main classification is into plant and machinery. There are, however, several components that have different useful lives within this main classification. The following main component groups have been identified and form the basis for depreciation of refinery facilities.
Electrical installations and instruments 15 yearsHeat exchangers 15 yearsSteam boilers 20 yearsSteel structures 30 yearsPressure vessels 30 years
Land and precious metals (which are recognized under Plant and machinery) are not depreciated because their useful lives are considered unlimited.
The residual values and useful lives of the assets are reviewed on each balance sheet date and adjusted as required. An asset’s carrying amount is impaired immediately to its recoverable amount if the asset’s carrying amount exceeds its estimated recoverable amount. This is tested in the event of an indication of such a need.
The carrying amount for property, plant and equipment is removed from the balance sheet upon scrapping or disposal or when no future economic benefits are expected from the use or the scrapping or disposal of the asset. Gains and losses on disposal are determined by means of a comparison between sales revenue and the carrying amount and are recognized at their net amounts in the statement of other comprehensive income depending on the function to which the asset belongs.
Note 1. Cont.

NOTES TO THE CONSOLIDATED FINANCIAL STATEMENTS
15 | Preem 2018
Borrowing costs attributable to the construction of qualified assets are capitalized as a part of the cost of the qualified asset. A qualified asset is an asset which necessarily takes a substantially long time to complete. Firstly, the borrowing costsincurred for loans specific to the qualified asset are capitalized. Secondly, the borrowing costs incurred for general loans that are not specific to a qualified asset are capitalized.
IMPAIRMENT OF NON-FINANCIAL ASSETSGoodwill is not amortized, but is tested at least annually for impairment. Assets that are amortized are assessed for loss of value whenever events or changes in circumstances indicate that the carrying amount may not be re-coverable. Assets are impaired by the amount at which the asset’s carrying amount exceeds its recoverable amount. Impairment impacts profit/loss for the year. The recoverable amount is the higher of the as-set’s fair value less costs of disposal and its value in use. When assessing impairment, assets are grouped at the lowest levels where there are separate identifiable cash flows (cash-generating units). For assets other than financial assets and goodwill that have previously been impaired, a test is performed on each balance sheet date to determine whether there should be a reversal. The carrying amount after reversal of impair-ment losses must not exceed the carrying amount that would have been recognized if there had not been any impairment losses.
INVENTORIESInventories are measured at the lower of cost and net realizable value. Cost is determined using the first-in-first-out method. Cost for petrole-um products, which is expressed in USD, is recognized at the exchange rate prevailing on the date of the bill of lading.
The cost of finished goods and work in progress consists of raw materials, direct wages, other direct expenses and attributable indirect manufacturing expenses (based on normal manufacturing capacity). Net realizable value is the estimated selling price from operating activities less the costs of production and disposal.
For crude oil, replacement cost is used as the best available measure of net realizable value. In cases where the net realizable value is less than the cost of crude oil and the products are impaired as a result, the impairment amount is reduced in cases where the net realizable value of the products exceeds cost. The reduction in the impairment amount for crude oil consists of the difference between the net realizable value of the products and cost.
Borrowed inventories are not included in the value of inventories, and, correspondingly, lent inventories are included in the value of inventories, as significant risks and benefits have not been transferred.
CURRENT AND DEFERRED TAX Current tax expenses are calculated based on the tax laws enacted or substantially enacted at the balance sheet date in the countries where the Parent Company’s subsidiaries and associates operate and generate taxable income. Management conducts regular assessments of claims lodged in tax returns with regard to situations in which applicable tax laws are subject to interpretation and, where appropriate, makes provi-sions for amounts that will probably have to be paid to the Swedish Tax Agency. Taxes are recognized in the statement of other comprehensive income except when the underlying transaction is recognized in other comprehensive income or directly in equity. In this case, the related tax effect is recognized in other comprehensive income or in equity. Current tax is tax that must be paid or received for the current year. This also includes any adjustment of current tax attributable to previous periods.
Deferred tax is recognized in full, using the balance sheet method, for all temporary differences arising between the tax base of assets and liabilities and their carrying amounts in the consolidated financial statements. However, deferred tax is not recognized if it arises from a transaction that constitutes initial recognition of an asset or liability that is not a business combination and which, at the time of the transac-tion, impacts profit/loss neither for accounting purposes nor for tax purposes. Deferred income tax is calculated by applying the tax rates (and laws) that have been enacted or announced at the balance sheet date and are expected to be in force when the relevant deferred tax assets are realized, or the deferred tax liabilities are settled. Deferred tax assets are recognized to the extent that it is probable that future taxable profit will be available against which the temporary differences can be offset. The value of deferred tax assets is reduced when it is no longer considered likely that they can be utilized.
PROVISIONSProvisions for environmental remediation measures and legal require-ments are recognized when the Group has a legal or constructive obliga-tion due to earlier events, it is likely that an outflow of resources will be required to settle the obligation and the amount can be calculated reliably.
Provisions are measured at the present value of the amount that is expected to be required to settle the obligation. A discount rate before tax is used for this which reflects a current market assessment of the time-based value of money and the risks associated with the provision.
CONTINGENT LIABILITIESA contingent liability is recognized when there is a possible obligation that originates from past events and when the existence of which has only been confirmed by one or more uncertain future events or when there is an obligation that is not recognized as a liability or a provision because it is not likely that an outflow of resources will be required or that the outflow cannot be calculated.
EMPLOYEE BENEFITSPension obligationsThe Group has defined benefit and defined contribution pension plans. A defined contribution pension plan is a pension plan under which the Group pays fixed contributions to a separate legal entity. The Group has no legal or constructive obligations to pay additional contributions if this legal entity does not have sufficient assets to pay all employee benefits associated with the employees’ service during the current or previous periods. A defined benefit pension plan is a pension plan that is not a defined contribution plan. The distinguishing factor of defined benefit plans is that they specify an amount for the pension benefit that an employee receives after retirement based on length of service and salary at retirement. These pension plans are usually financed by payments to insurance companies or managedfunds in accordance with periodic actuarial calculations. Pension commitments have been secured by means of occupational pension insurance, liabilities entered into an account allocated for pensions (FPG/PRI) or payment to a pension fund (KP-stiftelsen) in accordance with the provisions of the Swedish Pension Obligations Vesting Act. The defined benefit pension plans are both funded and unfunded. If the plans are funded, assets have been separated in the pension fund (KP-stiftelsen). These plan assets can only be used to make payments under pension agreements. Plan assets are measured at fair value as of the reporting date.
The liability that is recognized in the balance sheet under defined benefit pension plans is the present value of the defined commitment at the balance sheet date. The defined benefit pension obligation is calculated annually by independent actuaries who apply the projected unit credit method. The present value of the defined benefit obligation is determined by the discounted cash flow method using the interest rate for first class mortgage bonds issued in the same currency as the pay-ments will be made in and with maturities comparable to the relevant pension liability.
The revaluation effects comprise actuarial gains and losses, the differ-ence between the actual yield on plan assets and the amount included in net interest income/expenses and any changes in effects of asset restrictions (excl. interest included in net interest income/expenses). The revaluation effects are recognized in other comprehensive income.
The special payroll tax forms part of the actuarial assumptions and is therefore recognized as part of net obligations/assets.
Expenses in respect of service during earlier periods are recognized in profit/loss for the year, unless the changes in the pension plan are conditional upon the employees remaining in service for a specified period (qualification period). In such cases, expenses for past service are allocated on a straight-line basis over the qualification period.
For defined contribution pension plans, the Group pays contribu-tions into publicly or privately managed pension insurance plans on a mandatory, contractual or voluntary basis. The Group has no additional payment obligations once the contributions have been paid. The cost is recognized in consolidated profit or loss as the benefits are earned. Prepaid contributions are recognized as an asset to the extent that cash repayment or a reduction in future payments may benefit the Group.
Note 1. Cont.

NOTES TO THE CONSOLIDATED FINANCIAL STATEMENTS
16 | Preem 2018
Severance paySeverance pay is paid when notice is served by the Group to terminate an employee’s employment before the normal retirement age or when an employee accepts voluntary termination in exchange for such compensa-tion. The Group recognizes severance payments when it is documented that the Group either is obliged to terminate an employee in accordance with a detailed, formal plan that cannot be revoked, or to pay severance pay because of an offer made to encourage voluntary termination. Profit-sharing plansThe Group recognizes a liability and an expense for profit shares based on the return on working capital. The Group recognizes a provision when there is a legal obligation, or a constructive obligation based on previous practice.
REVENUE RECOGNITION Revenue is measured based on the compensation specified in the contract with the customer. The Group recognizes the revenue when control over a good or service is transferred to the customer. Revenue is recognized excluding VAT, returns and discounts, and after the elimina-tion of internal Group sales. Net sales include excise taxes deducted and recognized on a separate line before sales revenue.
Sale of goodsThe Group’s main revenue originates from the sale of goods in the form of petroleum products. Our Supply and Refining segment sells products to oil companies operating in Sweden and on the international market, primarily in Northwestern Europe. A large proportion of these sales of products take place by ship and are often subject to the CIF (cost, insurance and freight) and FOB (free on board) terms, which means that these revenue items are normally recognized on the date on which the goods are loaded onto the ship, i.e., on the B/L (bill of lading) date.
Our Marketing and Sales segment sells gasoline, diesel, fuel oil and lubricating oil on the Swedish market. The sales take place through Preem’s nationwide gas station network (retail), through certified resellers and in bulk through its own direct sales (energy). In Norway, Preem’s products are mainly sold through resellers and in bulk through direct sales. For these sales, the revenue is recognized in conjunction with delivery to the customer.
Financial income and expensesFinancial income consists of interest income, dividend income, and gains upon value changes of financial assets measured at fair value through profit/loss for the year.
Interest income from financial instruments is recognized using the ef-fective interest method. Dividendincome is recognized when entitlement to receive the dividend has been confirmed. Gains or losses on disposal of a financial instrument are recognized when the risks and rewards of ownership of the instrument are transferred to the buyer and the Group no longer has control over the instrument.
Financial expenses consist of interest expenses on loans including the expensed share of transaction expenses in connection with borrowings for the year, the effect of reversing the present value calculations of pro-visions, fair value losses on financial assets at fair value through profit/loss for the year and impairment of financial assets.
Generally, borrowing costs are charged to profit/loss for the period to which they relate. Borrowing costs that are directly attributable to the purchasing, design or production of an asset and where a significant length of time is needed to make the asset ready for its intended use or sale, must be included in the cost of the asset.
LEASESLesseesLeases where the risks and rewards of ownership are substantially retained by the lessor are classified as operating leases. Payments made during the lease term (less any incentives from the lessor) are recog-nized as expenses on a straight-line basis over the lease term. Variable expenses are recognized as expenses in the periods when they arise. The Group only has operating leases.
LessorsA lease is an agreement under which a lessor grants a lessee the right to use an asset in exchange for payment in accordance with agreed terms
and for an agreed period. Assets that are leased under an operating lease are recognized as an asset in the balance sheet. The lease payment is recognized as revenue on a straight-line basis over the term of the lease. The Group only has operating leases.
Emission rightsThe allocation of emission rights within the period does not involve any cost to the Company and, therefore, neither allocation nor consumption has impacted profit/loss for the year and the balance sheet. Disposals or acquisitions of emission rights are recognized in the statement of other comprehensive income under the headings net sales or cost of goods sold.
FINANCIAL INSTRUMENTS Recognition and initial measurementTrade receivables and issued debt instruments are recognized when issued. Other financial assets and financial liabilities are recognized when the Group becomes a party to the financial instrument’s contractual terms.
A financial asset (except for trade receivables that do not have a sig-nificant financing component) or financial liability is initially measured at fair value plus transaction costs directly attributable to the acquisition or issue for financial instruments not measured at fair value through profit or loss. A trade receivable without a significant financing component is measured at the transaction price.
Classification and subsequent measurementUpon initial recognition, a financial asset is classified as measured at: amortized cost, fair value through other comprehensive income or fair value through profit or loss.
Financial liabilities are classified in the following categories: financial liabilities at fair value through profit/loss for the year and other financial liabilities at amortized cost.
Financial assets measured at amortised costA financial asset shall be measured at amortized cost if it fulfills both of the following conditions and is not identified as measured at fair value via profit or loss:– it is held within the scope of a business model the objective of which
is to hold financial assets for the purpose of receiving contractual cash flows, and
– the contractual terms for the financial asset give rise to cash flows at set times that are only payments of principal amounts and interest on the outstanding principal.
The Group has classified trade receivables, other receivables and cash and cash equivalents as financial assets measured at amortized cost. At initial recognition, they are measured at amortized cost. Any impairment requirements are estimated upon subsequent measurement occasions.
Financial assets are derecognized from the balance sheet when the right to receive cash flows from the instrument has expired or been transferred, and the Group has substantially transferred all risks and rewards of ownership.
Financial assets and liabilities at fair value through profit/loss for the yearFinancial assets and liabilities at fair value through profit/loss for the year are available-for-sale financial assets. A financial asset or liability is classified in this category if it is acquired primarily to be sold within a short period of time.
The Group uses oil derivatives that are short term and are classified in the balance sheet either as current assets or current liabilities under the heading “derivatives” and in the income statement and statement of other comprehensive income under the heading “cost of goods sold”, in contrast to the profit/loss from other financial instruments, which is recognized in net financial items.
The Group holds derivatives, but does not apply hedge accounting.The Group has classified other shares and participations as measured
at fair value through profit/loss for the year.
Other financial liabilitiesThe “other financial liabilities” category includes borrowings, trade payables and other liabilities.
Note 1. Cont.

NOTES TO THE CONSOLIDATED FINANCIAL STATEMENTS
17 | Preem 2018
BorrowingsBorrowings are initially recognized at fair value, net of transaction expenses. Borrowings are subsequently recognized at amortized cost and any difference between the amount received (net of transaction ex-penses) and the repayment amount is recognized as a financial expense accrued over the term of the loan.
Borrowings are classified as current liabilities unless the Group has an unconditional right to defer payment of the debt for at least 12 months after the balance sheet date.
Other liabilitiesOther liabilities are initially recognized at fair value and subsequently at amortized cost.
IMPAIRMENT OF FINANCIAL ASSETSOn each balance sheet date, the Group assesses whether there is objective evidence that a financial asset or group of financial assets is impaired. Provisions for trade receivables are described in Note 21.
NOTE 2. Financial risk management The Group is exposed to several different financial risks during its oper-ations: market risk (which includes currency risk, price risk1 and interest rate risk in fair value and in cash flow), credit risk and liquidity risk. The Board of Directors of the Group annually sets policies for risk manage-ment that focus on the unpredictability of the financial markets and strive to control potential adverse effects on the Group’s financial performance.
RISK POLICY AND OBJECTIVESThe Group’s financial risk management policy aims to reduce volatility in earnings and cash flow while retaining a high level of operational efficiency.
All operations associated with managing financial instrument risks are handled by Preem’s Treasury Department, except for oil derivatives, which are handled by the Supply and Refining segment. Management of financial risks is governed by Group-wide policies established by the Board of Directors or Group-wide committees. The aim of the Compa-ny’s trading in derivatives is to ensure that financial risks are kept within limits determined by the Board of Directors. The Group does not use hedge accounting.
MARKET RISKCurrency riskThe Group operates internationally and is exposed to currency risks aris-ing from exposure to various currencies, especially the USD. Transaction risks within the Group arise from future business transactions. Transla-tion risk arises on remeasurement of recognized assets and liabilities.
Transaction riskTransaction exposure entails a risk that profitability is negatively im-pacted by changed exchange rates, mainly in USD, without a possibility to obtain comparable compensation through commercial operations. Preem’s transaction exposure arises when a sale or purchase of crude oil and refined products takes place in foreign currency and when this affects profit or loss.
Translation risk Translation risk is the risk that the value of the Group’s recognized assets and liabilities in foreign currency is negatively impacted by changes in exchange rates. The Group aims to reduce the translation risk that arises in working capital by balancing assets and liabilities in foreign currency. To reduce the translation risk in the Group’s working capital in USD, the Group takes out loans in USD. The Group also strives to invoice and be invoiced in the same currency if possible, from a business perspective.
The Group has a policy concerning currency hedging that permits the hedging of currency risks, which is only permitted to protect currency flows from significant currency risks.
The table below describes the Group’s net exposure on the balance sheet date in each currency translated into SEK for monetary assets and liabilities in the form of trade receivables, cash and cash equivalents,
trade payables and other borrowings in foreign currency. Working cap-ital includes not only trade receivables and trade payables, but also the Group’s inventory value. As a result, the magnitude of the net exposure on the monetary items must be considered in relation to the value of the inventories in USD as of the balance sheet date. As inventories are a non-monetary asset, inventories are not translated at the exchange rate on the balance sheet date, but at the exchange rate on the purchase date. A change in the exchange rate does not normally affect the inven-tory value, which means that there is no effect in profit/loss for the year until the product is sold. If a change in the exchange rate were to lead to the net realizable value of the inventories in SEK being less than cost because of a fall in the exchange rate, the inventories will be impaired, having a direct effect on profit/loss.
All amounts in SEK millions
Net exposure at balance sheet date 2018 % 2017 %EUR 39 0% –43 1%NOK 121 1% 86 1%USD –8,799 98% –7,869 98%Other –19 0% –19 0%Total –8,658 100% –7,845 100%
The net exposure in USD must be considered in relation to the Group’s normal position in inventories, which amounted to USD 775 million (849) at December 31, 2018, corresponding to SEK 6,950 million (6,989) translated to SEK using the exchange rate on the balance sheet date.
If the Swedish krona were to become stronger/weaker by 10 percent in relation to the US dollar at the balance sheet date while all other variables remained constant, profit/loss for the year after tax as at December 31 would have been SEK -144 million (-69) higher/lower as a consequence of gains/losses on translation of monetary assets and liabilities according to the table above, taking into account the indirect price effect on the Group’s normal position for inventories.
Price riskThe Group is exposed to price risk regarding inventories of crude oil and refined products. Price changes in crude oil and refined oil products af-fect the Group’s sales revenue, cost of goods sold, gross profit/loss and operating profit/loss. The Group has a defined normal position for inven-tories1), which is the volume of priced oilrequired to maximize the con-tribution from the refining system in the most efficient way. The normal position is defined as 1,840,000 m3. The price risk at this volume is the Company’s commercial risk that the Board of Directors has accepted. The Group trades in oil derivatives to counteract the price risk that arises when priced inventories deviate from the normal position. In addition to the above price risk management policy, the Group used oil derivatives during the past year to also hedge parts of its normal position.
SENSITIVITY ANALYSISThe Board of Directors has established risk limits that define the extent to which volume exposure may deviate from the normal position, as well as the maximum risk expressed in USD that the Group is prepared to accept in volume deviations from the normal position. The volume devi-ation may be +140,000 m3 or –190,000 m3. Preem uses the value at risk method to measure the raw material price risk on the deviation position divided by product line. Using this method, the maximum potential loss is calculated with a certain probability during a set period of time.
The table below describes how the position would change in SEK million if the price were to rise/fall by 10 percent as at the balance sheet date. How such a change would have impacted the Company’s financial performance depends on whether the effect on financial performance arises in the physical position or the derivatives position. The reason for this is that inventories and derivatives are measured using different accounting policies. Over time, however, the price change in the total position will affect the Company’s financial performance. As a result, the total position constitutes the Company’s price risk, but accrual effects arise over time in profit/loss for the year, because of the differing meas-urement policies for inventories and derivatives.
1) Only priced inventories are exposed to a price risk. Purchases of crude oil and products are only included in the position when the purchased oil has been priced. The products leave the position when they are priced in connection with their sale. If a product is priced for a number of days, a percentage of the load will be included in or taken out of the position in relation to the number of days that the load is priced. This means that the Group’s physical inventories can differ somewhat from the Company’s physical position.
Note 1. Cont.

NOTES TO THE CONSOLIDATED FINANCIAL STATEMENTS
18 | Preem 2018
YearChange in
pricePhysicalposition
Derivativesposition
Totalposition
Of whichnormal
position2018 10% 768 –120 649 6042018 –10% –768 199 –570 –604
2017 10% 881 –176 704 7002017 –10% –881 180 –701 –700
A change in the value of the derivatives position will always have a direct effect in profit/loss for the year, as derivatives are measured at market value at the balance sheet date and the gain/loss is recognized through profit/loss for the year.
A change in the value of the physical position has a direct effect on profit/loss in some cases, and in other cases profit/loss is only affected in subsequent periods. This is because inventories are measured at the lower of cost and net realizable value.
In the event of a price rise, profit/loss is usually not affected until a sale is made, i.e. the price gains are not recognized in profit/loss for the year until they have been realized. A price rise may, however, have a direct effect in profit/loss for the year if the original net realizable value is less than cost. However, this effect may not exceed the previously impaired value of inventories.
If prices fall, profit/loss is normally affected directly, which means that inventories are impaired, and a product expense is recognized in the statement of other comprehensive income. However, inventories will only be impaired to the amount at which the changed net realizable value is less than the inventory’s previous carrying amount as of the balance sheet date.
In addition to price risk management of the inventories position, the Board of Directors has defined the scope for speculative trading in oil deriv-atives. These transactions are limited by setting a ceiling on the maximum gain or loss in such trading.
INTEREST RATE RISKGroup interest rate risk for negative change resulting from interest fluctuations of interest-bearing assets and liabilitiesLoans with a floating interest rate expose the Group to interest rate risk with regard to cash flow. Loans with a fixed interest rate expose the Group to an interest rate risk regarding fair value. The Group’s bor-rowings are at floating interest rates. It is the Group’s policy to have a fixed interest period which does not exceed 12 months. As of Decem-ber 31, 2018, the remaining fixed-interest period totaled approximately 0.32 months. In 2018, the Group’s borrowings at floating interest rate terms consisted of SEK and USD. The Group’s interest-bearing assets are in the form of loans to affiliates and, to a lesser extent, short-term investments in cash and cash equivalents.
The Group’s outstanding borrowings as of the balance sheet date for loans taken out from credit institutions totaled SEK 7,371 million (5,366). The Group’s loan terms, effective interest rates and the maturity struc-ture of the loans are described in Note 25.If interest rates for borrowings expressed in SEK during the year had been 1.0 percent higher/lower, with all other variables constant, the profit after tax for the financial year would have been SEK 57 million (42) lower/ higher.
CREDIT RISKCredit risks arise through investments in cash and cash equivalents, de-rivatives and credit exposure to the large number of customers to whom sales are made on credit. To limit this exposure, there are Group-wide credit policies under which only banks and financial institutions with a credit rating of at least "A" by Standard and Poor’s, or by an equivalent independent credit rating agency, are accepted. Individual risk limits are established based on internal or external credit ratings. The Group also uses a range of collateral, including letters of credit, bank guarantees, deposits and Parent Company sureties. There is regular follow-up on the use of credit limits. The credit risk is controlled at the Group level by a Credit Committee.
Most of the credit exposure, in terms of volume, is to financially strong oil companies. Credit quality is considered good based on the Group’s ongoing analysis of its customers. The Group only has one provision for doubtful debts of SEK 10 million (7), compared with sales revenue of SEK 92,553 million (68,752). For further information, see Note 21.
Other oil companies, banks and trading companies are counterparties for trading in oil derivatives. To limit counterparty risks in trading in oil derivatives, the Company signs ISDA agreements.
LIQUIDITY RISKLiquidity risk is the risk that the Group will not have the possibility of conducting its business due to a shortage of liquid assets. The Group manages liquidity risk by maintaining sufficient cash and cash equiv-alents and short-term investments with a liquid market and available financing through contracted credit facilities. Every month, the Group pays approximately SEK1,388 million (1,314) in the form of excise duties and VAT which, combined with fluctuations in purchasing and sales patterns, can place demands on the availability of short-term borrowing facilities.
The table below analyses the Group’s financial liabilities and net settled derivatives that constitute financial liabilities, broken down by the term remaining after the balance sheet date until the contractual maturity date. The amounts specified in the table are the contractual, non-discounted cash flows and therefore do not correspond to the amounts in the balance sheet. The amounts that fall due within 12 months correspond to the carrying amounts, since the discount effect is insignificant.
It is the Group’s policy that loans must be renegotiated no later than 12 months before maturity.
As at December 31, 2018Within 1 year
Between 1 and 2 years
Between 2 and 5 years
More than 5 years
Borrowings 488 6,883 – 18Oil derivatives 1 – – –Trade payables 2,709 – – –Other liabilities 1,573 – – –
As at December 31, 2017Within 1 year
Between 1 and 2 years
Between 2 and 5
yearsMore than
5 yearsBorrowings 903 – 4,482 –Oil derivatives 3 – – –Trade payables 3,529 – – –Other liabilities 1,504 – – –
The Group has syndicated bank loans that are subject to several cove-nants.
MANAGEMENT OF CAPITAL RISKThe Group’s objective for its capital structure is to secure the Group’s access to capital markets and to maintain an optimal capital structure in order to keep down the costs of capital and to balance the Company’s commercial risk with the cost of capital.
The Board of Directors constantly monitors the Group’s financial position and net debt against expected future profitability and cash flow, investment and expansion plans, and developments in the interest rate and credit markets.
The Group’s debt/equity ratio is shown in the table below:
2018 2017Total borrowings 7,388 5,385Less cash and cash equivalents –292 –256Net debt 7,096 5,129Total equity 12,890 12,250Total capitalization 19,987 17,379Net debt/equity ratio 36% 30%
Net debt excludes capitalized borrowing costs SEK 189 million (291).
CALCULATION OF FAIR VALUEThe fair value of derivatives traded on an active market is based on listed market prices on the balance sheet date. The listed market price used for the Group’s financial assets is the current bid price. The fair value of oil derivatives is determined using listed prices of oil futures on the balance sheet date.
The fair value of financial instruments not traded on an active market (e.g. OTC derivatives) is determined using measurement techniques.
Note 2. Cont.

NOTES TO THE CONSOLIDATED FINANCIAL STATEMENTS
19 | Preem 2018
The fair value of interest rate swaps is calculated as the present value of estimated future cash flows. Other unlisted holdings are measured at cost where fair value cannot be measured reliably.
The fair value of borrowings is calculated, for the purposes of disclo-sure, by discounting the future contracted cash flow to the current mar-ket interest rate available to the Group for similar financial instruments.
The carrying amount, after any impairment losses, of trade receivables and trade payables is considered to correspond to their fair values, as these items are current by nature. The fair value of financial liabilities is calculated, for the purposes of disclosure, by discounting the future contracted cash flow to the current market interest rate available to the Group for similar financial instruments.
NOTE 3. Critical accounting estimates and judgments
Estimates and judgments are assessed on an ongoing basis and are based on historical experience and other factors, including expecta-tions of future events that are considered reasonable under the current circumstances.
CRITICAL ACCOUNTING ESTIMATES AND ASSUMPTIONSThe Group makes estimates and assumptions about the future. The resulting accounting estimates will by definition seldom correspond to the actual outcome.
The estimates and assumptions that involve a significant risk of material adjustments in the carrying amounts of assets and liabilities for subsequent financial years are explained in general below.
If the estimated pre-tax discount rate that was applied for discounted cash flows for the cash-generating unit that comprises the Supply and Refining segment had been 2 percent higher than management’s judg-ment, the Group would not have needed to recognize any impairment of goodwill.
InventoriesInventories are measured at the lower of cost and net realizable value. Inventories are sensitive to market price fluctuations. If market prices fall relative to the cost at the end of the accounting period, the Group may need to recognize an impairment loss on the carrying amount of the inventories.
PensionsPension obligations are based on actuarial calculations that are them-selves based on assumptions about discount rates, the expected return on plan assets, inflation and the expected useful life.
The expected return on plan assets is established by reference to the expected return on the assets covered by the current investment policy. The expected return on investments with a fixed interest rate is based on the return received if these securities are held until maturity. The ex-pected return on shares and real estate is based on the long-term return that has occurred in the relevant market.
Provisions for environmental obligationsProvisions are made for environmental obligations for known and planned remediation work. Any future decommissioning of operations within the Group may involve a requirement for remediation and resto-ration work. However, this is considered to be a matter for the distant future, and the Group is of the opinion that the potential expenditure in-volved cannot be calculated reliably. Potential environmental obligations of this type are neither included in provisions in the balance sheet nor as contingent liabilities.
SIGNIFICANT JUDGMENTS ON APPLICATION OF THE COMPANY’S ACCOUNTING POLICIESFunctional currency Preem has significant cash flows in USD. In determining the Company’s functional currency, management has evaluated the criteria contained in IAS 21 on the determination of the functional currency. After giving care-ful consideration to all indicators, management has judged that Preem’s functional currency is SEK.
NOTE 4. Segment reportingOPERATING SEGMENTSThe Group consists of two operating segments:
Supply and RefiningCrude oil is purchased for the two refineries, Preemraff Lysekil and Preemraff Gothenburg.This crude oil is refined to produce finished oil products. Approximately 60 percent (62) of production is exported, mainly to the Northern European market. The proportion of production that is sold in Sweden is sold through the Group’s own market channels and through other oil companies.
MarketingThis segment sells refined oil products, which are purchased from the Supply & Refining segment. Sales are channeled directly to consumers via the Company’s network of filling stations and to companies and consumers via direct sales.
INTERNAL PRICINGPrices are set at market levels at prices based on official listings in the oil market.
PROFIT/LOSS PER SEGMENTThe information that senior executives regularly monitor within the Group is presented below.
2018Sales revenue
Supply & Refining Marketing
Total by segment
Segment’s total sales revenue 89,467 23,875 113,342Sales between segments –20,899 –1 –20,900External sales revenue 68,568 23,874 92,442Exchange differences 111Total external sales revenue 92,553
Operating profitSupply & Refining Marketing
Total by segment
Operating profit/loss per segment 2,646 499 3,146of which depreciation/amortization 876 144 1,020
2017Sales revenue
Supply & Refining Marketing
Total by segment
Segment’s total sales revenue 66,237 18,679 84,916Sales between segments –16,019 –8 –16,027External sales revenue 50,218 18,671 68,889Exchange differences –137Total external sales revenue 68,752
Operating profitSupply & Refining Marketing
Total by segment
Operating profit/loss per segment 4,403 581 4,984of which depreciation/amortization 869 118 988
Reconciliation with consolidated profit/loss before tax 2018 2017Operating profit/loss for reported segments 3,146 4,984Exchange differences on recurring payments –544 349Currency effect on normal inventories 799 –564Corporate Center depreciation/amortization –10 –10Other1) –959 –713Total operating profit/loss 2,431 4,047Interest income 8 6Interest expense –284 –265Exchange differences –291 306Other net financial items –118 –123Profit before tax 1,746 3,971
1) Mainly refers to Corporate Center.
Note 2. Cont.
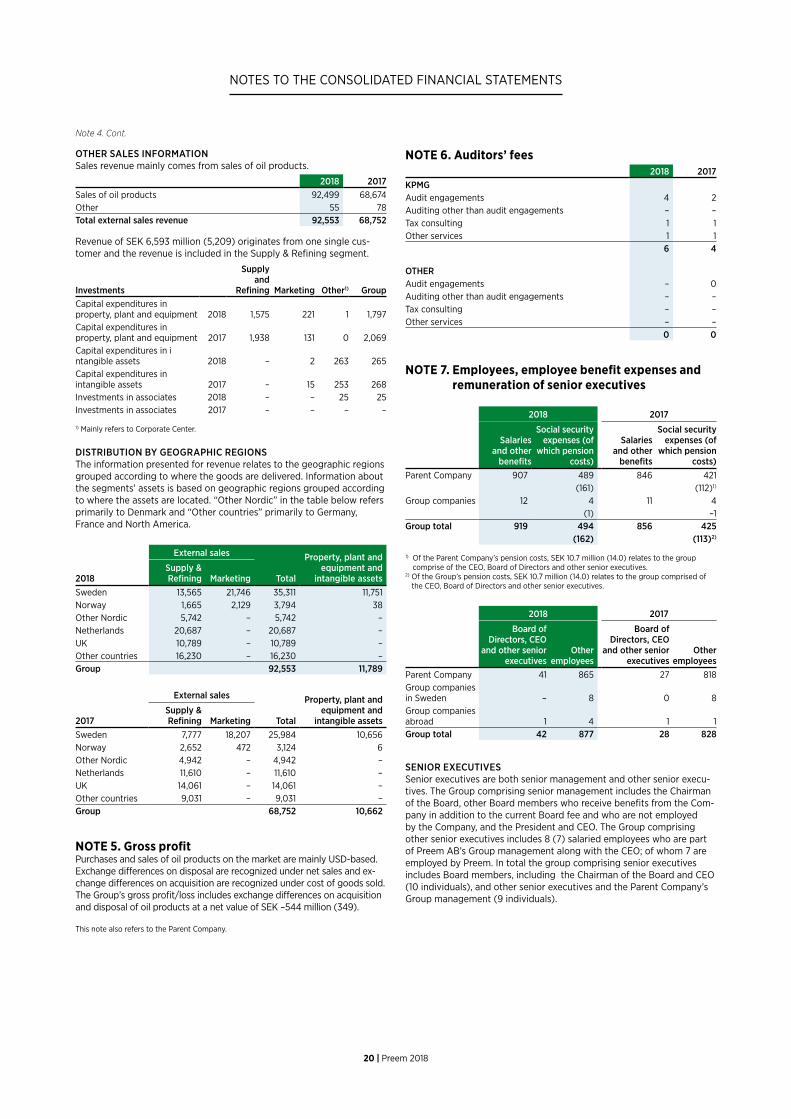
NOTES TO THE CONSOLIDATED FINANCIAL STATEMENTS
20 | Preem 2018
OTHER SALES INFORMATIONSales revenue mainly comes from sales of oil products.
2018 2017Sales of oil products 92,499 68,674Other 55 78Total external sales revenue 92,553 68,752
Revenue of SEK 6,593 million (5,209) originates from one single cus-tomer and the revenue is included in the Supply & Refining segment.
Investments
Supply and
Refining Marketing Other1) GroupCapital expenditures in property, plant and equipment 2018 1,575 221 1 1,797Capital expenditures in property, plant and equipment 2017 1,938 131 0 2,069Capital expenditures in i ntangible assets 2018 – 2 263 265Capital expenditures in intangible assets 2017 – 15 253 268Investments in associates 2018 – – 25 25Investments in associates 2017 – – – –
1) Mainly refers to Corporate Center.
DISTRIBUTION BY GEOGRAPHIC REGIONSThe information presented for revenue relates to the geographic regions grouped according to where the goods are delivered. Information about the segments’ assets is based on geographic regions grouped according to where the assets are located. “Other Nordic” in the table below refers primarily to Denmark and “Other countries” primarily to Germany, France and North America.
2018
External sales
Total
Property, plant and equipment and
intangible assetsSupply & Refining Marketing
Sweden 13,565 21,746 35,311 11,751Norway 1,665 2,129 3,794 38Other Nordic 5,742 – 5,742 –Netherlands 20,687 – 20,687 –UK 10,789 – 10,789 –Other countries 16,230 – 16,230 –Group 92,553 11,789
2017
External sales
Total
Property, plant and equipment and
intangible assetsSupply & Refining Marketing
Sweden 7,777 18,207 25,984 10,656Norway 2,652 472 3,124 6Other Nordic 4,942 – 4,942 –Netherlands 11,610 – 11,610 –UK 14,061 – 14,061 –Other countries 9,031 – 9,031 –Group 68,752 10,662
NOTE 5. Gross profitPurchases and sales of oil products on the market are mainly USD-based. Exchange differences on disposal are recognized under net sales and ex-change differences on acquisition are recognized under cost of goods sold. The Group’s gross profit/loss includes exchange differences on acquisition and disposal of oil products at a net value of SEK –544 million (349).
This note also refers to the Parent Company.
NOTE 6. Auditors’ fees2018 2017
KPMGAudit engagements 4 2Auditing other than audit engagements – –Tax consulting 1 1Other services 1 1
6 4
OTHERAudit engagements – 0Auditing other than audit engagements – –Tax consulting – –Other services – –
0 0
NOTE 7. Employees, employee benefit expenses and remuneration of senior executives
2018 2017
Salaries and other
benefits
Social security expenses (of
which pension costs)
Salaries and other
benefits
Social security expenses (of
which pension costs)
Parent Company 907 489 846 421(161) (112)1)
Group companies 12 4 11 4(1) –1
Group total 919 494 856 425(162) (113)2)
1) Of the Parent Company’s pension costs, SEK 10.7 million (14.0) relates to the group comprise of the CEO, Board of Directors and other senior executives.
2) Of the Group’s pension costs, SEK 10.7 million (14.0) relates to the group comprised of the CEO, Board of Directors and other senior executives.
2018 2017
Board of Directors, CEO
and other senior executives
Otheremployees
Board of Directors, CEO
and other senior executives
Otheremployees
Parent Company 41 865 27 818Group companies in Sweden – 8 0 8Group companies abroad 1 4 1 1Group total 42 877 28 828
SENIOR EXECUTIVESSenior executives are both senior management and other senior execu-tives. The Group comprising senior management includes the Chairman of the Board, other Board members who receive benefits from the Com-pany in addition to the current Board fee and who are not employed by the Company, and the President and CEO. The Group comprising other senior executives includes 8 (7) salaried employees who are part of Preem AB’s Group management along with the CEO; of whom 7 are employed by Preem. In total the group comprising senior executives includes Board members, including the Chairman of the Board and CEO (10 individuals), and other senior executives and the Parent Company’s Group management (9 individuals).
Note 4. Cont.

NOTES TO THE CONSOLIDATED FINANCIAL STATEMENTS
21 | Preem 2018
2018Remuneration and benefits
Base pay/Board fees
Variable remuneration
Other benefits
Pensioncosts
Other remuneration Total
Chairman of the Board 1.0 – – – – 1.0Other Board members (9) 3.6 – – – – 3.6CEO 9.1 4.7 0.1 3.9 – 17.9Other senior executives (8) 15.7 5.4 0.9 6.8 – 28.8
29.4 10.1 1.0 10.7 – 51.3
In total, SEK 5.0 million has been paid in Board fees, which is included in all items, except in other senior executives, of which one member received SEK 1.0, million, one member received SEK 0.75 million, two members received SEK 0.5 million, four members received SEK 0.4 million and two members received SEK 0.3 million.
2017Remuneration and benefits
Base pay/Board fees
Variable remuneration
Other benefits
Pensioncosts
Other remuneration Total
Chairman of the Board 1.0 – – – – 1.0Other Board members (8) 3.6 – – – – 3.6CEO 7.4 – 0.1 6.7 – 14.2Other senior executives (7) 12.1 2.1 0.8 7.3 – 22.3
24.1 2.1 0.9 14.0 – 41.1
In total, SEK 4.6 million has been paid in Board fees, which is included in all items, except in other senior executives, of which one member received SEK 1.0 million, two members received SEK 0.5 million and five members received SEK 0.4 million, and two members received SEK 0.3 million.
The tables above are for the Parent Company.
Note 7. Cont.
PENSIONSThe pension for the CEO is paid as gross salary according to individual agreement. The national pension plan applies to other senior executives and in certain cases there are individual solutions. All pension benefits are vested, i.e. not conditional on future employment. See also Note 23 Pension obligations.
SEVERANCE PAY There is a mutual notice period of 6 months between the Company and the CEO.
There is a mutual notice period between the Company and other senior executives of a maximum of 24 months and 6 months, respec-tively. There is a paid notice period of a maximum of 24 months for termination by the Company. Upon resignation by the senior executive, no severance pay is paid.
Gender distribution in company management
2018Percentage of woman
2017Percentage
of womanBoard of Directors 0% 0%Other senior executives 33% 38%
This table also refers to the Parent Company.
Average number of employees
2018 2017
Number ofemployees
Percentageof men
Number ofemployees
Percentage of men
PARENT COMPANYSweden 1,454 69% 1,439 73%
GROUP COMPANIESSweden 14 21% 17 56%Norway 15 73% 2 86%Group total 1,483 69% 1,458 73%
NOTE 8. DepreciationBreakdown of depreciation 2018 2017Intangible assets 36 10Buildings and land improvements 102 94Plant and machinery 576 585Capitalized turnaround costs 219 202Equipment, tools, fixtures and fittings 105 109
1,037 1,000
Breakdown by functionCost of goods sold 877 870Selling expenses 142 118Administrative expenses 18 12
1,037 1,000
NOTE 9. LeasesLease payments for operating leases 2018 2017Minimum lease payments 202 115Variable payments 41 40Total lease expenses 243 155
Contracted future minimum lease paymentsWithin one year 148 157Between one and five years 445 662More than five years 52 113
Lease revenue from operating leasesMinimum lease payments 86 91Variable payments 28 25Total lease revenue 114 115
Contracted future minimum lease paymentsWithin one year 87 91Between one and five years 443 453More than five years – –
REMUNERATION OF SENIOR EXECUTIVESFees are paid to the Chairman of the Board and members as per resolutions at the AGM. No separate fee is paid for committee work. Re-muneration of the CEO and other senior executives consists of base pay, variable remuneration, other benefits and pensions. The breakdown be-tween base pay and variable remuneration must be in proportion to the
senior executive’s responsibility and authority. For the CEO, the variable remuneration may be a maximum of 30 percent of the base pay. For other senior executives, the variable remuneration is a defined maximum percentage of the base pay. Pension benefits and other benefits for the CEO and other senior executives are paid as part of the overall remuner-ation package. Other benefits consist primarily of a company car.

NOTES TO THE CONSOLIDATED FINANCIAL STATEMENTS
22 | Preem 2018
NOTE 10. Expenses by type of expense2018 2017
Cost of materials 84,851 59,867Cost of employee benefits 1,417 1,334Depreciation and amortization 1,037 1,000Other expenses 3,259 2,969
90,565 65,171Reconciliation with statement of comprehensive incomeCost of goods sold 88,529 63,440Selling expenses 913 866Administrative expenses 1,123 864
90,565 65,171
NOTE 11. Other operating income2018 2017
Heating deliveries 72 64Rental income 114 145Harbor income 71 75Storage certificates 134 63Service compensation 15 23Other 38 96
443 465
NOTE 12. Net financial items2018 2017
Interest income from instruments measured at amortized cost 8 6Net exchange differences – 306Other 3 –2Financial income 11 311
Interest expenses from defined benefit unfunded pension obligation –4 –5Interest expenses from instruments measured at amortized cost1) –280 –260Net exchange differences –291 –Other –121 –122Financial expenses –697 –386Net financial items –685 –751) Of which SEK 102 million (102) in interest expenses from accrued transaction fees in
conjunction with raised loans recognized using the effective interest method.
The net gain from oil derivatives measured at fair value, recognized as a cost of goods sold in profit/loss for the year, totaled SEK 753 million compared with a loss of SEK 308 million the previous year. A provision of SEK 0 million (0) for Preem’s receivable from Corral Morocco Gas & Oil was charged to net financial items. The provision is net of capital-ized interest income of SEK 157 million (157) and a provision of SEK 157 million (157).
NOTE 13. TaxCurrent tax expenses (−)/tax revenue (+) 2018 2017Tax expense for the period –253 –927Tax attributable to previous years 0 –11
–253 –938
DEFERRED TAX EXPENSES (–)/TAX INCOME (+)Deferred tax on temporary differences –36 32Deferred tax as a result of changed tax rates 53 –Deferred tax on tax loss carryforwards –35 16Total reported tax expenses –271 –890
RECONCILIATION OF EFFECTIVE TAXProfit before tax 1,746 3,971Tax calculated at national tax rates applicable for profits in the respective countries –384 –874Other non-deductible expenses –66 –59Non-taxable income 123 32Taxable income not included in profit/loss –4 –Tax attributable to previous years –1 –11Other tax adjustments 60 21Reported tax –271 –890
TAX ITEMS RECOGNIZED DIRECTLY IN EQUITYCurrent tax in Group contributions paid 231 924
The weighted average tax rate was 15.5 percent (22.4).
2018Deferred tax assets and tax liabilities
Deferred tax assets
Deferred tax
liabilitiesIntangible assets – –34Land and buildings – –23Machinery and equipment – –725Tax loss carryforwards 0 –Other 4 –75Net assets/liabilities –853
2017Deferred tax assets and tax liabilities
Deferred tax assets
Deferred tax
liabilitiesIntangible assets – –36Land and buildings 2 –2Machinery and equipment – –817Tax loss carryforwards 34 –Other 4 –25Net assets/liabilities –841
Change in deferred tax in temporary differences and tax loss carryforwards
Openingamount
Recognizedin profit/
loss for the year
Otherchanges
Closingamount
Intangible assets –36 7 –5 –34Land and buildings 0 –23 – –23Machinery and equipment –817 91 – –725Other –21 –60 10 –71Total temporary differences –878 16 5 –857Tax loss carryforwards 34 –34 0 0
–841 –18 5 –853
From 1/1/2019, the tax rate is 21.4 percent in Sweden and 22 percent in Norway.

NOTES TO THE CONSOLIDATED FINANCIAL STATEMENTS
23 | Preem 2018
NOTE 14. Exchange differences in profit/loss for the year
Net exchange differences have been recognized in profit/loss for the year as follows:
2018 2017Net sales 111 –146Cost of goods sold –655 497Financial items –291 306
–835 658
The estimated currency effect on the Group’s normal position in invento-ries was SEK 799 million (–564).
NOTE 15. Intangible assetsGoodwill 2018 2017Opening cost 308 308Closing accumulated cost 308 308
Carrying amount at end of period 308 308
IMPAIRMENT TESTING OF GOODWILLIdentified goodwill is attributable in full to the Group’s cash-generating unit (CGU) Supply & Refining and Sweden.
The recoverable amount of a CGU is defined on the basis of cal-culations of value in use. These calculations are based on estimated future cash flows before tax based on financial budgets that have been approved by Company management and cover a 5-year period. Cash flows beyond the 5-year period are extrapolated using an estimated rate of growth as explained below. The rate of growth does not exceed the long-term rate of growth for the market in which the Supply & Refining segment operates.
Significant assumptions used to calculate value in useSupply and
RefiningAverage refining margin in USD per barrel for the period 6.17–6.51Average rate of growth for extrapolation beyond the budget period 1%Discount rate before tax 8%
Management has determined the budgeted refining margin based on previous profit/loss figures and its expectations of market performance. The weighted average rate of growth used does not exceed the fore-casts contained in industry reports. The discount rates used are specified before tax and reflect specific risks that apply to the various segments.
No impairment has been identified for goodwill, even if a change in conditions is changed as follows: Refining margin 20 percent lower, growth rate of -1 percentage point and a discount rate of 2 percentage points higher for each segment.
Other intangible assets 2018 2017Opening cost 163 0Business combinations – 155Disposals/retirements – –Completion of construction in progress 8 8Exchange-rate differences for the year 3 0Closing accumulated cost 173 163
Opening depreciation 10 0Disposals/retirements – –Depreciation for the year 36 10Exchange-rate differences for the year –1 0Closing accumulated depreciation 44 10
Carrying amount at end of period 129 153
Construction in progress 2018 2017Opening cost 521 261Investments for the year 265 268Completion of construction in progress –8 –8Exchange-rate differences for the year 1 0Carrying amount 779 521
Construction in progress refers to capitalized expenses attributable to a major IT project.
The capitalized interest expenses for the year of SEK 23 million (14) were attributable to intangible assets, relating primarily to one major IT project. The average interest rate is 6.3 percent (4.4).
Opening balance 2018 2,205,316Number of allocated rights for 2018 1,900,914Number of used rights for 2017 which were canceled in 2018 –2,045,086Purchased emission rights 2018 0Sold emission rights 0Profit/loss from swap of emission rights in 2018 0Closing balance 2018 2,061,144Number of allocated rights for 2019 1,857,708Profit/loss from swap transactions 2019 0Balance before cancellation 2019 3,918,852Prel. number of used rights for 2018 which will be canceled on April 30, 2019 –2,126,000Prel. balance after April 30, 2019 1,792,852
The Group’s balance sheet account for emission rights decreases gradually for the current 2013-2020 trading period and is forecast to be at zero by the end of the period. The deficit until the end of 2020 is believed to be 700,000 tonnes, a deficit that is hedged with the purchase of futures. An application for a capacity increase will be made in conjunction with commissioning of the HPU facility in Gothenburg in 2019. Allocation of new emission rights for this facility is expected to be approved and compensate for increased emissions. We therefore maintain our current forecast for the period.
Phase 4, the 2021–2030 trading period, is largely known at his time. As a refining business, Preem will continue to receive free allocation in Phase 4. District heating will continue to receive 30% free allocation until 2030. Allocation for Phase 4 depends on where the industry lands in the given interval: 0.2% to 1.6%.
Operational data will be collected from all industrial enterprises in Europe with free allocation and a decrease will then be determined based on how the industry has performed. The better the industrial enterprises perform, the faster the free allocation will decrease between 2021 and 2030. The futures prices for emission rights increased sharply during the year from EUR 7 to EUR 20. The price increase on emission rights is primarily due to the fundamental changes in the trading system. New political decisions mean that as of January 1, 2019, the large excess offering of rights in the system will begin to decrease.
NOTE 16. Property, plant and equipmentLand and buildings 2018 2017Opening cost 2,969 2,943Investments for the year 46 –Business combinations 6 –Disposals/retirements –55 –58Completion of construction in progress 296 84Exchange-rate differences for the year 5 0Closing accumulated cost 3,267 2,969
Opening depreciation 1,604 1,546Disposals/retirements –51 –36Depreciation for the year 102 94Exchange-rate differences for the year 0 0Closing accumulated depreciation 1,655 1,604
Carrying amount 1,612 1,366

NOTES TO THE CONSOLIDATED FINANCIAL STATEMENTS
24 | Preem 2018
Plant and machinery1) 2018 2017Opening cost 17,885 18,805Disposals/retirements –2,376 –1,431Completion of construction in progress 501 510Closing accumulated cost 16,010 17,885
Opening depreciation 12,572 13,341Disposals/retirements –2,338 –1,354Depreciation for the year 576 585Closing accumulated depreciation 10,810 12,572
Carrying amount 5,200 5,3131) The planned residual value includes precious metals at SEK 143 million (143).
Capitalized turnaround costs 2018 2017Opening cost 1,466 1,489Retirements –402 –477Completion of construction in progress 20 454Closing accumulated cost 1,084 1,466
Opening depreciation 828 1,102Retirements –402 –477Depreciation for the year 219 202Closing accumulated depreciation 645 828
Carrying amount 440 638
Note 16. Cont.
Equipment, tools, fixtures and fittings 2018 2017Opening cost 1,556 1,507Investments for the year 3 2Disposals/retirements –99 –84Completion of construction in progress 67 129Reclassification – 3Exchange-rate differences for the year 0 0Closing accumulated cost 1,526 1,556
Opening depreciation 1,170 1,139Disposals/retirements –96 –79Depreciation for the year 105 108Reclassification – 2Exchange-rate differences for the year 0 0Closing accumulated depreciation 1,180 1,170
Carrying amount 347 386
Construction in progress 2018 2017Opening cost 1,978 1,087Disposals/retirements 0 –Investments for the year 1,771 2,067Completion of construction in progress –774 –1,176Exchange-rate differences for the year 0 0Carrying amount 2,975 1,978
Capitalized interest expenses for the year were SEK 18 million (22), relating primarily to the balance sheet item “Construction in progress”. The average interest rate is 3.4 percent (4.4).
NOTE 17. Participations in associates
Swedish companies Corp. ID no. Reg. OfficeNumber of
sharesParticipating
interest, %Carryingamount
AB Djurgårdsberg 556077-3714 Stockholm 366 37 0Göteborgs Smörjmedelsfabrik, Scanlube AB 556287-6481 Gothenburg 50,000 50 5SunPine AB 556682-9122 Piteå 16,685 25 208Lignolproduktion AB 559095-1116 Stockholm 249,999 25 25
238
2018 Assets Liabilities Equity Revenue Net profit/lossAB Djurgårdsberg 3 3 0 5 0Göteborgs Smörjmedelsfabrik, Scanlube AB 205 190 15 413 –1SunPine AB 1,025 421 604 1,458 179Lignolproduktion AB 75 75 0 – 0
2017 Assets Liabilities Equity Revenue Net profit/lossAB Djurgårdsberg 3 3 0 6 0Göteborgs Smörjmedelsfabrik, Scanlube AB 165 148 17 387 1SunPine AB 772 167 605 1,203 203
The information above refers to 100 percent of the companies’ assets, liabilities, equity, revenue and net profit/loss.
2018 2017Opening balance 194 168Dividends –25 –25Investment for the year 25 –Profit participation 44 51Closing balance 238 194
Goodwill of SEK 79 million is included.
NOTE 18. Receivables from affiliates 2018 2017
Opening value 0 0Capitalized interest for the year 157 157Provision for receivable from CMGO –157 –157Closing value 0 0
The receivables from affiliates line item relates to an interest-bearing re-ceivable from affiliate Corral Morocco Gas & Oil AB (CMGO). In the annual financial statements for 2016, a provision of SEK 1,724 million was made for Preem’s receivable from CMGO based on the estimated value of the company’s assets. The receivable totaled SEK 0 million after the provision but is subject to a market-based fixed interest rate of 5 percent of the original receivable of SEK 3,136 million. A provision of SEK 157 million was made in 2018. No collateral has been pledged for the Group’s receivable from CMGO.

NOTES TO THE CONSOLIDATED FINANCIAL STATEMENTS
25 | Preem 2018
NOTE 19. Other shares and participations2018 2017
Carrying amount at start of period 26 28Impairment losses –20 –Profit/loss 5 –1Carrying amount at end of period 11 26
Company Corp. ID no. Reg. OfficeNumber of
sharesParticipating
interest, %Carryingamount
Släckmedelscentralen - SMC AB 556488-8583 Stockholm 117 12 0SPIMFAB - SPI Miljösaneringsfond AB 556539-4888 Stockholm 1 1 0VindIn AB 556713-5172 Stockholm 100 9 10Götene E.D.F. Elföreningen, cooperative 0SSH Svensk Servicehandel 0
11
This note also refers to the Parent Company.
NOTE 20. Inventories2018 2017
Raw materials 3,465 4,978Finished products 7,079 5,713
10,543 10,691
The cost of inventories in the Group includes the equivalent of SEK 183 million (15) million of volumes of inventories out on loan. Borrowed inventory volumes corresponding to a total inventory value of SEK 78 million (97) are not included in the inventory value.
NOTE 21. Trade receivables 2018 2017
Trade receivables 4,328 4,681Reserve for doubtful debts –10 –7Fair value of trade receivables 4,318 4,674
The impairment principle changed in 2018 in connection with new principles in IFRS. Through a historical analysis in 2017 and 2018, it was established that the uncertainty remains steady at 0.01% of the total trade receivable stock at the time the receivable was generated and this is con-tinuously reserved. All trade receivables over 90 days are reserved in their entirety. The age analysis of trade receivables is shown below:
2018 2017Less than 10 days 148 121Between 10 and 20 days 100 26Between 21 and 30 days 34 5More than 30 days 88 25
371 176
Changes in the reserve for doubtful trade receivables are as follows:
2018 2017At start of period 7 7Provision for impairment of trade receivables/unused amounts reversed for the year 15 7Confirmed losses for the year –12 –7At end of period 10 7
Provisions for and reversals of reserves for doubtful trade receivables are included in the functions to which they relate in the statement of profit or loss and other comprehensive income. Amounts recognized in the impairment account are usually written off when the Group is not expected to recover any additional cash or cash equivalents. Other cat-egories within trade and other receivables do not include any impaired assets. The maximum exposure for credit risk on the balance sheet date is the fair value for each category of receivables mentioned above.
NOTE 22. Cash and cash equivalentsCash and bank balances in the balance sheet and the cash flow state-ment include the following with a maturity date less than three months after acquisition.
2018 2017Cash and bank balances 292 256
292 256
The prospects of CMGO repaying funds to Preem under the aforemen-tioned note are dependent upon success in the legal proceedings, re-garding ownership rights to the Moroccan company SAMIR which CMGO (through its subsidiary Corral Morocco Holdings AB) initiated against Morocco at ICSID (International Center for Settlement of Investment Dis-putes) in Washington in Early 2018. During 2018, the Board of Directors of Preem have adopted a resolution to the effect that Preem, within certain specified boundaries and conditions, should financially support CMGO’s legal proceedings against Morocco at ICSID as well as certain other legal proceedings pertaining to SAMIR. The Board of Directors is of the opinion that these measures are beneficial to Preem as they uphold the possibility of getting repayment from CMGO.
Note 19. Cont.

NOTES TO THE CONSOLIDATED FINANCIAL STATEMENTS
26 | Preem 2018
NOTE 23. Pension commitmentsDefined benefit obligations and the value of plan assets
Wholly or partly funded obligations: 2018 2017Present value of defined-benefits liabilities 654 624Fair value of plan assets –634 –652Net wholly or partially funded obligations 20 –28
Unfunded obligations:Present value of unfunded defined benefit obligations 84 87Provision, endowment insurance 55 50Net amount in the balance sheet (obligation +, asset –) 159 109
THE NET AMOUNT IS RECOGNIZED IN THE FOLLOWING BALANCE SHEET ITEMS:Pension obligations 159 109
THE NET AMOUNT IS DIVIDED AMONG THE FOLLOWING COUNTRIES:Sweden 159 109
PENSION COSTSThe amounts recognized in profit/loss are as follows:Defined benefit plansInterest expenses 16 17Fair value of plan assets –15 –15Total cost of defined benefit plans 1 2
The amount that is recognized in other comprehensive is as follows:Actuarial gains/losses on defined benefit pension plans –47 –2Tax attributable to items in other comprehensive income 10 0Total other comprehensive income for the year, net of tax
–37 –2
THE CHANGE IN THE DEFINED BENEFIT OBLIGATION DURING THE YEAR IS AS FOLLOWS:Opening gross amount in the balance sheet 711 702Payment of benefits –29 –29Interest expenses 16 17Actuarial gain (+) or loss (–) for the year on the obligation for the year:Remeasurement 10 1Actuarial gains and losses on changes in financial assumptions 28 28Experience adjustments 3 –8Closing gross amount in the balance sheet 738 711
THE PRESENT VALUE OF THE OBLIGATION IS DISTRIBUTED BETWEEN THE PLAN’S MEMBERS AS FOLLOWS: Active members: 0% (0%) Vested beneficiaries: 58% (59%) Old-age pensioners: 42% (41%)
Change in fair value of plan assets during the year is as follows: 2018 2017Opening gross amount in the balance sheet –652 –641Payment of benefits 21 21Fair value of plan assets –15 –15Actuarial gain (+) or loss (–) for the year on plan assets 11 –16Closing gross amount in the balance sheet –634 –652
The actual return on plan assets amounted to SEK 4 million (32).
Contributions for defined benefit plans are estimated at SEK 0 million in 2018, as the transition to Alecta took place on January 1, 2008 and the former plan was paid up. The Group pays a fixed fee for the defined benefit pension plan to a separate legal entity (Alecta). The Group has no legal or constructive obligations to pay additional contributions if this legal entity does not have sufficient assets to pay all employee benefits associated with the employees’ service during the current or previous periods.
This note also refers to the Parent Company.
NOTE 24. Other provisionsRestoration of environment1) Other Total
Opening balance 2018 63 79 142Provisions for the year 110 0 110Amounts utilized –4 –4 –8Unutilized amounts that have been reversed – – –Closing balance 2018 169 75 244
Opening balance 2017 66 0 66Provisions for the year 4 79 84Amounts utilized –7 – –7Unutilized amounts that have been reversed – – –Closing balance 2017 63 79 142
1) The closing balance includes a provision made in Preem AB for remediation of soil in connection with the decommissioning of the Loudden depot and remediation of a ditch at the refinery in Gothenburg. The provision has been capitalized as a non-current asset (land and land improvements) with a depreciation period corresponding to the remedia-tion period, which is forecast to be completed in December 2019 for Loudden and 2022 for the ditch at the refinery in Gothenburg. In 2018, further provisions were made in an amount of SEK 110 million for remediation of soil in depots.
Actuarial assumptions 2018 2017Discount rate 2.20% 2.35%Future wage increases Not applicable Not applicableStaff turnover Not applicable Not applicableInflation 2.00% 1.90%Expected average remaining period of service of employees Not applicable Not applicableLife expectancy assumption DUS 14 tjm DUS 14 tjmDuration of obligation 15 16
PLAN ASSETS CONSIST OF THE FOLLOWING:Interest-bearing securities 55% 57%Shares 33% 32%Real estate 12% 11%
100% 100%
The expected return on plan assets is established by reference to the expected return on the assets covered by the current investment policy. The expected return on investments with a fixed interest rate is based on the return received if these securities are held until maturity. The ex-pected return on shares and real estate is based on the long-term return that has occurred in the relevant market.
Sensitivity analysis
Present value of the
obligationPercentage
changeDiscount rate +0.5% 673 –9%Discount rate –0.5% 812 10%Inflation/Pension indexing +0.5% 817 11%Inflation/Pension indexing –0.5% 668 –9%Life expectancy + 1 year 782 6%

NOTES TO THE CONSOLIDATED FINANCIAL STATEMENTS
27 | Preem 2018
NOTE 25. BorrowingsLong-term borrowings 2018 2017Loans in SEK 1,500 1,500Loans in USD 5,383 2,964Total long-term loans 6,883 4,464Capitalized borrowing costs –189 –291Total net long-term loans 6,694 4,173Deposits 18 18Total interest bearing 6,711 4,191
Short-term borrowingsLoans in NOK 105 –Loans in SEK – –Loans in USD 383 903Total short-term loans 488 903Capitalized borrowing costs – –Total net short-term loans 488 903
Total Group borrowings 7,388 5,385Total net Group borrowings 7,200 5,094
Repayment plan 2019 2020 2021 2022- Total488 6,883 – 18 7,388
LOAN TERMS AND CONDITIONS, EFFECTIVE INTEREST RATE AND MATURITY STRUCTURE
Non-current liabilities, credit institutions
Nominal value, local
currencyEffective
interest, %
Maturity structure (in SEK million)
Less than 1 year
1–5 years
– SEK, variable interest 1,500 3.53 – 1,500– USD, variable interest 600 6.08 – 5,383
CURRENT LIABILITIES, CREDIT INSTITUTIONS– NOK, utilized overdraft facilities – – 105 –– SEK, variable interest – – – –– USD, utilized overdraft facilities – – 114 –– USD, variable interest 30 6.36 269 –Total loans 488 6,883Capitalized borrowing costs -189Deposits 18Total borrowings incl. deposits and capitalized borrowing costs
488 6,711
7,200
Remaining average fixed-interest term at December 31, 2018 amounted to around 0.32 months.
Compliance with special loan conditionsBorrowings totaling SEK 7,371 million in both SEK and USD consist of a syndicated loan and are subject to a clause requiring compliance with the terms of the minimum level of equity, the ratio of net debt to equity, the interest coverage ratio and the ratio of net debt to adjusted EBITDA. All conditions have been met as at December 31, 2018.
This note also refers to the Parent Company.
NOTE 26. Overdraft facilities, etc.2018 2017
Authorized line of credit, checking account 628 412Unutilized portion 409 332Utilized credit amount 219 79
Other unutilized lines of credit Authorized line of credit 3,809 4,580
3,809 4,580
Total unutilized lines of credit 4,218 4,912
The line of credit for checking account is divided in NOK and USD.
This note also refers to the Parent Company.
NOTE 27. Derivative instruments2018 2017
Assets Liabilities Assets LiabilitiesOil derivatives 2 1 – 3
Derivatives held for trading are classified as current assets or current liabilities. The full fair value of a derivative is classified as a non-current asset or non-current liability if the item’s outstanding term is more than 12 months, and as a current asset or current liability if the item’s outstanding term is less than 12 months.
The maximum exposure to credit risk as of the balance sheet date is the fair value of the derivatives recognized as assets in the balance sheet.
OIL DERIVATIVESOil derivatives contracts are held primarily to hedge price changes in petroleum products. The nominal amount of outstanding oil derivatives contracts (including strategic hedge of normal position in the form of options) at December 31, 2018 was: Long positions SEK 225 million (52) (including emission right futures) and short positions SEK 1,510 million (1,900).
NOTE 28. Other liabilities2018 2017
VAT 517 465Excise duties1) 771 817Other liabilities 185 131
1,472 1,413
1) Excise duties refer to energy tax, carbon dioxide tax, sulfur tax and alcohol tax.
NOTE 29. Accrued expenses and deferred income2018 2017
Purchases of crude oil and products 2,062 3,159Personnel 323 307Interest 4 2Other 1,059 647
3,448 4,116

NOTES TO THE CONSOLIDATED FINANCIAL STATEMENTS
28 | Preem 2018
NOTE 30. Pledged assets and contingent liabilitiesPledged assets 2018 2017Property mortgages 4,000 4,000Floating charges 8,000 8,000Deposits 118 125Trade receivables 4,076 4,408
16,194 16,533
CONTINGENT LIABILITIESSureties for associates 96 93Guarantees FPG/PRI 1 2
98 94
Property mortgages, floating charges and trade receivables are pledged to serve as collateral in conjunction with fulfillment of the Group’s syndi-cated bank loan obligations.
The deposits relate primarily to guarantees issued in connection with trade in oil derivatives. These amounts fall due for payment if the Group does not meet its obligations.
OTHER CONTINGENT LIABILITIES Any future decommissioning of operations within the Group may involve a requirement for remediation and restoration work. However, this is considered to be a matter for the distant future, and the potential expenditure involved cannot be calculated reliably.
This note also refers to the Parent Company.
Reconciliation of liabilities arising from financing activities
Non-cash changes
Opening balance 2018
Cash flows Exchange rate, unrealized Closing balance 2018
Bank overdraft facilities 80 139 – 219Syndicated bank loans 5,287 1,887 –22 7,152Deposits 18 –1 0 18Total liabilities arising from financing activities 5,385 2,026 –22 7,389
Non-cash changes
Opening balance 2017 Cash flows
Unrealized exchange rate differences
Closing balance 2017
Bank overdraft facilities 103 –24 – 80Syndicated bank loans 5,080 248 –43 5,287Deposits 19 0 – 18Total liabilities arising from financing activities 5,202 224 –43 5,385
Reconciliation of liabilities also refers to the Parent Company.
NOTE 31. Supplementary disclosures to the cash flow statementInterest paid and dividends received 2018 2017Dividends received 25 25Interest received 8 6Interest paid –269 –197
Adjustment for non-cash items, etc.Depreciation and amortization of non-current assets 1,037 1,000Impairment of non-current assets 27 80Impairment losses on inventories 393 –8Unrealized exchange rate losses (+)/exchange rate gains (–) 109 –52Unrealized exchange rate losses (+)/ exchange rate gains (–), net financial items –21 –43Unrealized gains (–)/losses (+) on oil derivatives –484 70Expensed share of capitalized borrowing costs 102 102Provisions –10 74Capital gains/losses on disposal/retirement of non-current assets 5 –3Capital gains/losses on disposal of business/subsidiary – –105Profit participation in associates –49 –50Other 4 –
1,112 1,065
Acquisition of subsidiary - Group 2018 2017Acquired assets and liabilitiesIntangible assets 1 158Property, plant and equipment 33 1Deferred tax assets – 0Prepaid expenses and accrued income – 1Cash and cash equivalents 1 –Total assets 35 160
Current provisions -6 -37Operating liabilities -1 –Total provisions and liabilities -7 -37
Consideration:Consideration paid1) -27 -123Impact on cash and cash equivalents -26 -123
1) See Note 112

NOTES TO THE CONSOLIDATED FINANCIAL STATEMENTS
29 | Preem 2018
NOTE 32. Financial instruments FINANCIAL INSTRUMENTS BY CATEGORY
2018Assets in the balance sheet
Assets measured at fair value
through profit/ loss for the year
Assets measured at fair value through
other compre- hensive income
Financial assets measured at
amortised costCarrying amount
Fair value
Other shares and participations 11 – – 11 11Derivatives 2 – – 2 2Receivables from Parent Company – – 55 55 55Trade payables and other receivables – – 5,339 5,339 5,339Cash and cash equivalents – – 292 292 292
13 – 5,686 5,698 5,698
Liabilities in the balance sheet
Liabilities at fair value through profit/
loss for the year
Liabilities at fair value through other
comprehensive income
Other liabilities
Carrying amount
Fair value
Borrowings – – 7,389 7,389 7,389Derivatives 1 – – 1 1Other liabilities – – 4,282 4,282 4,282
1 – 11,670 11,671 11,671
2017Assets in the balance sheet
Assets measured at fair value
through profit/ loss for the year
Assets measured at fair value through
other compre- hensive income
Financial assets measured at
amortised costCarrying amount
Fair value
Other shares and participations 26 – – 26 26Derivatives – – – – –Receivables from Parent Company – – 55 55 55Trade payables and other receivables – – 5,242 5,242 5,242Cash and cash equivalents – – 256 256 256
26 – 5,554 5,580 5,580
Liabilities in the balance sheet
Liabilities at fair value through profit/
loss for the year
Liabilities at fair value through other
comprehensive income
Other liabilities
Carrying amount
Fair value
Borrowings – – 5,385 5,385 5,385Derivatives 3 – – 3 3Other liabilities – – 5,033 5,033 5,033
3 – 10,418 10,421 10,421
FINANCIAL INSTRUMENTS MEASURED AT FAIR VALUE IN THE BALANCE SHEETThe table below shows financial instruments measured at fair value in the balance sheet, classified into the following three levels:
Level 1: Fair value is based on quoted market prices on an active market for the same instruments.
Level 2: Fair value is based on quoted market prices on an active market for similar instruments or measurement techniques where all variables are based on quoted market prices. This level includes oil derivatives in the form of swaps and options and interest rate swaps.
Level 3: Fair value is based on measurement techniques and the essential variables are not based on quoted market prices.
2018 Level 1 Level 2 Level 3Assets in the balance sheetOil derivatives – 2 –
– 2 –Liabilities in the balance sheetOil derivatives – 1 –
– 1 –
2017 Level 1 Level 2 Level 3Assets in the balance sheetOil derivatives – – –
– – –Liabilities in the balance sheetOil derivatives – 3 –
– 3 –

NOTES TO THE CONSOLIDATED FINANCIAL STATEMENTS
30 | Preem 2018
NOTE 33. Transactions with affiliatesRELATIONSHIPS WITH AFFILIATES INVOLVING CONTROLThe Group is under the control of Corral Petroleum Holdings AB. In addition to the affiliate transactions described for the Group below, the Parent Company has affiliate relationships that involve control with its subsidiaries, see Note 113.
2018Relationships with affiliates Sales Purchases Receivables Dec 31 Liabilities Dec 31Parent Company – – 55 –Associates 10 1,122 0 96Other affiliates 3 215 0 29
2017Relationships with affiliates Sales Purchases Receivables Dec 31 Liabilities Dec 31Parent Company – – 55 –Associates 24 882 0 89Other affiliates 2 239 0 25
NOTE 34. Other non-current receivables2018 2017
AT START OF YEAR 91 47Capital expenditures for the year Endowment insurance 4 8Project Rocc 28 36Carrying amount 124 91
This note also refers to the Parent Company.
NOTE 35. Events after the closing dateIn January 2019, the Iso-Cracker was shut down in the refinery in Lysekil when one of the reactors was damaged in a power outage. Repair work was completed, and the plant restarted in March. The cost of the pro-duction loss for the three months is estimated at USD 36 million or USD 1.4/barrel. In connection with this, a property damage also arose.
The new hydrogen gas unit in the refinery in Gothenburg was started according to plan at the end of February 2019. A total investment of SEK 635 million with an expected short payback period (< 2 years). The unit allows increased capacity for production of fuel based on renewable feedstock and greater desulfurization capacity.
Next up is the start-up of the new vacuum distillation unit (VDU) in Lysekil. This is another important investment with good profitability that reduces the production of HFO and allows increased diesel production. The expected payback period is three to four years.
The work of refinancing the bond in Corral has intensified and a review of the total capital structure has begun. The goal is to carry out a refinancing of the group, when the market permits, with the aim of implementing a spread of the shareholding in Preem when the owner so decides.
This note also refers to the Parent Company.

PARENT COMPANY FINANCIAL STATEMENTS
31 | Preem 2018
Income statement
AMOUNTS IN SEK MILLIONS
Note 2018 2017
Net sales 102,063 78,283
Excise duties1) –10,198 –10,040
Sales revenue 102 91,865 68,243
Cost of goods sold –88,188 –63,060
Gross profit 5 3,677 5,183
Selling expenses –887 –841
Administrative expenses –1,089 –857
Other operating income 107 645 398
Operating profit 7, 103–107 2,346 3,883
Profit from participations in Group companies 5 112
Financial income 48 338
Financial expenses –694 –385
Net financial items 108 –641 65
Profit before tax 1,705 3,948
Tax expenses/revenue for the period 109 –269 –889
Profit for the year2) 1,436 3,059
1) Excise duties refer to energy tax, carbon dioxide tax, sulfur tax and alcohol tax.2) Profit for the year corresponds to comprehensive income for the year.

PARENT COMPANY FINANCIAL STATEMENTS
32 | Preem 2018
AMOUNTS IN SEK MILLIONS
ASSETS Note 12/31/2018 12/31/2017
NON-CURRENT ASSETS
Intangible assets
Other intangible assets 110 5 6
Construction in progress 110 777 514
781 520
Property, plant and equipment
Land and buildings 30, 111 1,557 1,364
Plant and machinery 111 5,200 5,313
Capitalized turnaround costs 111 439 638
Equipment, tools, fixtures and fittings 111 338 381
Construction in progress 111 2,974 1,974
10,509 9,670
Financial assets
Participations in Group companies 112 429 295
Receivables from Group companies 113, 122 3 3
Participations in associates 114 130 103
Receivables from associates 122 0 0
Receivables from affiliates 18, 122 0 0
Other shares and participations 19, 122 11 26
Other non-current receivables 124 91
696 519
Total non-current assets 11,986 10,709
CURRENT ASSETS
Inventories
Raw materials and consumables 115 3,461 4,978
Finished products 115 6,701 5,714
10,162 10,692
Receivables
Trade receivables 30, 116, 122 4,076 4,408
Receivables from Parent Company 122, 33 55 55
Receivables from Group companies 122 401 36
Receivables from associates 122 0 1
Derivatives 27, 123 2 –
Other receivables 122 771 538
Prepaid expenses and accrued income 653 371
5,959 5,410
Cash and bank balances 121, 122 239 132
Total current assets 16,360 16,234
TOTAL ASSETS 28,346 26,943
Balance sheet

PARENT COMPANY FINANCIAL STATEMENTS
33 | Preem 2018
AMOUNTS IN SEK MILLIONS
EQUITY, PROVISIONS AND LIABILITIES Note 12/31/2018 12/31/2017
EQUITY
Restricted equity
Share capital (610,258 shares) 610 610
Statutory reserve 266 266
Other restricted equity 692 430
1,569 1,306
Non-restricted equity
Profit brought forward 9,474 7,476
Profit for the year 1,436 3,059
10,910 10,535
Total equity 12,479 11,841
PROVISIONS
Provisions for pensions 117 128 127
Provisions for deferred tax 109 835 802
Other provisions 24 244 142
1,207 1,071
Total provisions 1,207 1,071
LIABILITIES
Non-current liabilities
Liabilities to credit institutions 25, 122 6,693 4,173
Liabilities to Group companies 122 107 60
Other non-current liabilities 25, 122 18 18
6,818 4,251
Current liabilities
Liabilities to credit institutions 25, 26, 122 488 903
Advance payments from customers 5 5
Trade payables 122 2,667 3,332
Liabilities to Group companies 122 65 21
Liabilities to associates 122 97 90
Derivatives 27, 122 1 3
Current tax liabilities 7 –
Other liabilities 118, 122 1,300 1,408
Accrued expenses and deferred income 119 3,212 4,019
7,843 9,781
Total liabilities 14,660 14,032
TOTAL EQUITY, PROVISIONS AND LIABILITIES 28,346 26,943
Pledged assets and contingent liabilities 30
Balance sheet, cont.

PARENT COMPANY FINANCIAL STATEMENTS
34 | Preem 2018
AMOUNTS IN SEK MILLIONS
Restricted equity Non-restricted equity
Total equity
Share capital
Statutory reserve
Other restricted
equity
Profit brought forward
Profit for the year
Opening equity 1/1/2017 610 266 176 6,848 670 8,571
Appropriation of profits – – – 670 –670 –
Profit for the year – – – – 3,059 3,059
– – – –355 – –355
Shareholder’s contribution received – – – 3,840 – 3,840
Group contributions paid – – – –4,200 – –4,200
Tax attributable to Group contributions paid – – – 924 – 924
Translation difference – – – 2 – 2
Fund for internally generated development expenditure – – 253 –253 – –
Closing equity 12/31/2017 610 266 430 7,476 3,059 11,841
Opening equity 01/01/2018 610 266 430 7,476 3,059 11,841
Adjustment according to IFRS 9 – – – 0 – 0
Appropriation of profits – – – 3,059 –3,059 –
Profit for the year – – – – 1,436 1,436
Dividends paid – – – –380 – –380
Shareholder’s contribution received – – – 400 – 400
Group contributions paid – – – –1,048 – –1,048
Tax attributable to Group contributions paid – – – 231 – 231
Translation difference – – – 0 – 0
Fund for internally generated development expenditure
– – 263 –263 – –
Closing equity 12/31/2018 610 266 693 9,475 1,436 12,479
Statement of changes in equity
Statutory reserveThe statutory reserve comprises restricted equity and is set aside in accordance with the previously applicable Swedish Companies Act (1975:1385).
Other restricted equityOther restricted equity comprises the transfer of an amount corresponding to internally generated development expenses.
Non-restricted equityNon-restricted equity comprises the previous year’s non-re-stricted equity plus the profit/loss for the year and uncondition-al shareholder’s contributions received.
Number of shares and appropriation of profitThe number of shares issued totals 610,258, all of which are class A shares. The shares are fully paid up and the number of shares is the same at both the beginning and the end of the year. The quota value is SEK 1,000 per share.
Conditional shareholders’ contributionsPreem AB received a conditional shareholders’ contribution totaling SEK 2,482 million (of which SEK 1,982 million in 2011, SEK 500 million in 2010) from Corral Petroleum Holdings AB (publ).
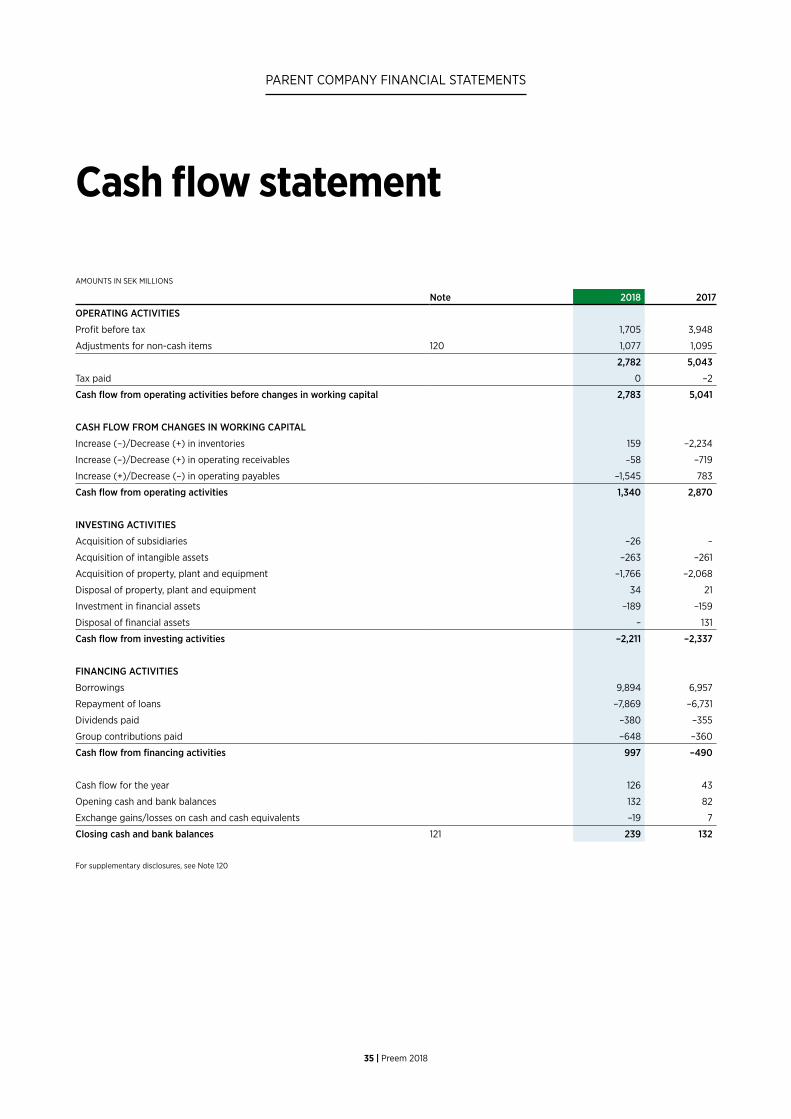
PARENT COMPANY FINANCIAL STATEMENTS
35 | Preem 2018
AMOUNTS IN SEK MILLIONS
Note 2018 2017
OPERATING ACTIVITIES
Profit before tax 1,705 3,948
Adjustments for non-cash items 120 1,077 1,095
2,782 5,043
Tax paid 0 –2
Cash flow from operating activities before changes in working capital 2,783 5,041
CASH FLOW FROM CHANGES IN WORKING CAPITAL
Increase (–)/Decrease (+) in inventories 159 –2,234
Increase (–)/Decrease (+) in operating receivables –58 –719
Increase (+)/Decrease (–) in operating payables –1,545 783
Cash flow from operating activities 1,340 2,870
INVESTING ACTIVITIES
Acquisition of subsidiaries –26 –
Acquisition of intangible assets –263 –261
Acquisition of property, plant and equipment –1,766 –2,068
Disposal of property, plant and equipment 34 21
Investment in financial assets –189 –159
Disposal of financial assets – 131
Cash flow from investing activities –2,211 –2,337
FINANCING ACTIVITIES
Borrowings 9,894 6,957
Repayment of loans –7,869 –6,731
Dividends paid –380 –355
Group contributions paid –648 –360
Cash flow from financing activities 997 –490
Cash flow for the year 126 43
Opening cash and bank balances 132 82
Exchange gains/losses on cash and cash equivalents –19 7
Closing cash and bank balances 121 239 132
Cash flow statement
For supplementary disclosures, see Note 120

PARENT COMPANY NOTES
36 | Preem 2018
NOTE 101. Significant accounting policies for the Parent Company
Preem AB (publ), corp. id no. 556072-6977, is the Parent Company of the Preem AB Group (Preem) and has its head office in Stockholm. The Group’s operations involve extensive refining of crude oil and sales of petroleum products. Operating activities are run primarily by the Parent Company, Preem AB.
Preem has prepared its annual report in accordance with the Swedish Annual Accounts Act and the Swedish Financial Reporting Board’s recommendation RFR 2 "Accounting for Legal Entities", along with the statements issued by the Swedish Financial Reporting Board that apply to publicly listed companies. Under RFR 2, a parent company whose financial statements comply with IFRS must prepare its financial state-ments in accordance with the International Financial Reporting Stand-ards (IFRS) as issued by the International Accounting Standards Board (IASB), as adopted by the European Union, to the extent that these accounting policies and interpretations correspond with the Swedish Annual Accounts Act and the Swedish Pension Obligations Vesting Act, taking into account the relationship between accounting and taxation. The recommendation specifies which exemptions from and amendments to IFRS are to be observed.
The financial statements are presented in the Swedish krona (SEK), rounded off to the nearest million.
DIFFERENCES BETWEEN GROUP AND PARENT COMPANY ACCOUNTING POLICIESDifferences between the accounting policies of the Group and the Parent Company are described below. The accounting policies described below for the Parent Company have been applied consistently to all periods presented in the Parent Company’s financial statements.
A more detailed description of the accounting policies applied by the Group as well as significant estimates and judgments are contained in Note 1 to the consolidated financial statements.
Classification and presentation methodsThe Parent Company’s income statement and balance sheet are present-ed in accordance with the Swedish Annual Accounts Act’s schedule. The difference compared with IAS1 “Presentation of Financial Statements”, which is applied in the presentation of the consolidated financial state-ments, relates primarily to the recognition of financial assets, current assets, equity, a separate heading for provisions in the Parent Compa-ny’s balance sheet, and non-current and current liabilities.
Subsidiaries and associatesParticipations in subsidiaries and associates are recognized by the Par-ent Company using the cost method.
Leased assetsThe Parent Company recognizes all leases under the rules for operating leases.
Employee benefitsThe Parent Company applies different bases for calculating defined ben-efit plans than those described in IAS 19. The Parent Company observes the provisions of the Swedish Pension Obligations Vesting Act and the Swedish Financial Supervisory Authority’s regulations, given that this is a prerequisite for entitlement to tax deductions. The most significant differences compared with the rules of IAS 19 are primarily the setting
Notes to the Parent Companyfinancial statements
of the discount rate, the calculation of defined benefit obligations on the basis of the current salary level with no assumptions about future salary increases and the practice of recognizing all actuarial gains and losses in the income statement as they arise.
Income taxesThe Parent Company recognizes untaxed reserves in the balance sheet including deferred tax liabilities. In contrast, in the consolidated financial statements, untaxed reserves are divided into deferred tax liabilities and equity. There is no allocation of a share of appropriations to deferred tax expenses in the Parent Company’s income statement.
Group contributions and shareholders’ contributions for legal entitiesThe Company recognizes Group contributions and shareholders’ contributions in accordance with RFR 2. Shareholders’ contributions are recognized directly in the equity of the recipient and are capitalized in the shares and participations of the contributor, provided that they are not impaired. The general rule is applied to Group contributions. Group contributions that the Parent Company receives from subsidiaries are recognized as revenue in the Parent Company’s income statement, and Group contributions paid by the Parent Company to a subsidiary are recognized under participations in subsidiaries in the same manner as shareholders’ contributions. Group contributions paid by a subsidiary to the Parent Company are recognized as a distribution from the subsidi-ary, i.e. directly in equity after the recognized tax effect.
Development expenditure fundThe amount capitalized for internally generated development expendi-tures will be transferred from non-restricted equity to the development expenditure fund in restricted equity. The fund decreases as these intangible assets are amortized or impaired.
Branch in NorwayThe current rate method is used for translation of the income state-ment and balance sheet of the Norwegian branch. This means that the balance sheet is translated using the exchange rate at the balance sheet date and the income statement is translated using the average exchange rate. The translation difference is recognized in other comprehensive income and accumulated in a fair value fund in equity.
NOTE 102. Segment reporting
Sales by segmentSupply & Refining Marketing Elim Total
Sales 2018 89,521 21,726 –19,382 91,865Sales 2017 66,236 18,090 –16,083 68,243
Sales by geographical region 2018 2017Sweden 35,259 25,956Norway 3,157 2,643Other Nordic 5,742 4,942Netherlands 20,687 11,610UK 10,789 14,061Other countries 16,230 9,031Parent Company 91,865 68,243

PARENT COMPANY NOTES
37 | Preem 2018
NOTE 103. Auditors’ fees2018 2017
KPMGAudit engagements 3 2Tax consulting 1 1Other services 1 1
5 4OTHERSAudit engagements – 0
– 0
NOTE 104. Depreciation and amortizationBreakdown of depreciation and amortization 2018 2017Intangible assets 2 2Buildings and land improvements 98 95Plant and machinery 576 585Capitalized turnaround costs 219 202Equipment, tools, fixtures and fittings 100 104
995 987
Breakdown by function 2018 2017Cost of goods sold 870 865Selling expenses 114 112Administrative expenses 10 10
995 987
NOTE 105. LeasesLease payments for operating leases 2018 2017Minimum lease payments 215 122Variable payments 41 40Total lease expenses 256 162
CONTRACTED FUTURE MINIMUM LEASE PAYMENTSWithin one year 159 154Between one and five years 446 662More than five years 61 113
Lease revenue from operating leases 2018 2017Minimum lease payments 86 89Variable payments 28 25Total lease revenue 114 114
CONTRACTED FUTURE MINIMUM LEASE PAYMENTSWithin one year 87 90Between one and five years 443 451More than five years – –
NOTE 106. Expenses by type of expense2018 2017
Cost of materials 84,420 59,450Cost of employee benefits 1,396 1,267Depreciation and amortization 995 987Other expenses 3,353 3,054
90,164 64,758
RECONCILIATION WITH INCOME STATEMENTCost of goods sold 88,188 63,060Selling expenses 887 841Administrative expenses 1,089 857
90,164 64,758
NOTE 107. Other operating income2018 2017
Heating deliveries 72 64Rental income 114 144Charter rent 150 30Harbor income 121 75Storage certificates 134 63Service compensation 15 23Other 41 30
645 398
NOTE 108. Net financial items2018 2017
Group contributions received 5 0Gain/loss on disposal of participations in subsidiaries – 112
5 112
Interest income from instruments measured at amortized cost 19 8Net exchange differences – 307Dividends 25 25Other 3 –2Financial income 47 338
Interest expenses from defined benefit unfunded pension obligation –3 –3Interest expenses from instruments measured at amortized cost1) –280 –260Net exchange differences –289 –Other –121 –122Financial expenses –693 –385Net financial items –641 651) Of which SEK 102 million (102) in interest expenses from accrued transaction fees in
conjunction with raised loans recognized using the effective interest method.
The net profit from oil derivatives measured at fair value, recognized as a cost of goods sold in profit/loss for the year, totaled SEK 753 million compared with a loss of SEK 308 million the previous year.
A provision of SEK 0 million (0) for Preem’s receivable from Corral Morocco Gas & Oil was charged to net financial items. The provision is net of capitalized interest income of SEK 157 million (157) and a provi-sion of SEK 157 million (1,724).

PARENT COMPANY NOTES
38 | Preem 2018
NOTE 109. Tax Current tax expense (–)/tax revenue (+) 2018 2017Tax expenses/revenue for the period –236 –924Tax attributable to previous years – –11
–236 –935
Deferred tax expenses (–)/tax income (+) –53Deferred tax on temporary differences 53 32Deferred tax on tax loss carryforwards –34 15Total reported tax expenses –269 –889
Reconciliation of effective tax 2018 2017Profit before tax 1,705 3,948Income tax calculated according to the prevailing tax rate for the Parent Company –375 –869Other non-deductible expenses –58 –61Non-taxable income 114 26Taxable income not included in profit/loss –4 –Tax attributable to previous years –1 –11Other tax adjustments 55 25Reported tax –269 –889
Tax items recognized directly in equityCurrent tax in Group contributions paid/received 231 924
The weighted average tax rate was 15.8 percent (22.5).
2018Deferred tax assets and tax liabilities
Deferred tax assets
Deferred tax liabilities
Land and buildings – –23Machinery and equipment – –725Tax loss carryforwards – 0Other 4 –90Net assets/liabilities –835
2017Deferred tax assets and tax liabilities
Deferred tax assets
Deferred tax liabilities
Land and buildings 2 –2Machinery and equipment – –817Tax loss carryforwards 34 –Other 4 –22Net assets/liabilities –802
Change in deferred tax in temporary differences
Amount at beginning
of year
Recognised in profit/loss
for the yearOther
changes Amount at
end of yearLand and buildings 0 –23 – –23Machinery and equipment –817 91 – –725Other –19 –68 – –87Total temporary differences –836 1 – –835Tax loss carryforwards 34 –34 0 0
–802 –33 0 –835
From 1/1/2019, the tax rate is 21.4 percent in Sweden.
NOTE 110. Intangible assetsOther intangible assets 2018 2017Opening cost 8 0Completion of construction in progress – 8Closing accumulated cost 8 8
Opening amortization 2 0Amortization for the year 2 2Closing accumulated amortization 3 2
Carrying amount at end of period 5 6
Construction in progress 2018 2017Opening cost 514 261Investments for the year 263 261Completion of construction in progress – –8Carrying amount at end of period 777 514
The capitalized interest expenses for the year of SEK 22.8 million (13.5) were attributable to intangible assets, and related primarily to one major IT project. The average interest rate is 6.3 percent (4.4).
NOTE 111. Property, plant and equipmentLand and buildings 2018 2017Opening cost 2,941 2,905Disposals/retirements –54 –48Completion of construction in progress 294 84Closing accumulated cost 3,181 2,941
Opening depreciation 1,576 1,518Disposals/retirements –51 –36Depreciation for the year 98 95Closing accumulated depreciation 1,624 1,576Carrying amount 1,557 1,364
Plant and machinery1) 2018 2017Opening cost 17,885 18,796Disposals/retirements –2,376 –1,421Completion of construction in progress 501 511Closing accumulated cost 16,011 17,885
Opening depreciation 12,572 13,334Disposals/retirements –2,338 –1,346Depreciation for the year 576 585Closing accumulated depreciation 10,811 12,572Carrying amount 5,200 5,3131) The carrying amount includes precious metals at SEK 143 million (143).
Capitalized turnaround costs 2018 2017Opening cost 1,466 1,489Disposals/retirements –402 –477Completion of construction in progress 20 454Closing accumulated cost 1,084 1,466
Opening depreciation 828 1,102Retirements –402 –477Depreciation for the year 219 202Closing accumulated depreciation 645 828Carrying amount 440 639
Equipment, tools, fixtures and fittings 2018 2017Opening cost 1,498 1,442Disposals/retirements –98 –72Completion of construction in progress 61 129Closing accumulated cost 1,460 1,498
Opening depreciation 1,118 1,084Disposals/retirements –95 –70Depreciation for the year 100 104Closing accumulated depreciation 1,122 1,118Carrying amount 338 380
Construction in progress 2018 2017Opening cost 1,974 1,084Investments for the year 1,766 2,067Completion of construction in progress –766 –1,176Carrying amount 2,974 1,974
Capitalized interest expenses for the year were SEK 18 million (22), relating primarily to the balance sheet item “Construction in progress”. The average interest rate is 3.4 percent (4.4).

PARENT COMPANY NOTES
39 | Preem 2018
NOTE 112. Participations in Group companies
Corp. ID no. Reg. OfficeNumber of
sharesParticipating
interest, %Carrying amount
SWEDISH COMPANIESOperatingBensinstation Preem AB 556909-4633 Malmö 1,000 100 1Preem Försäkrings AB 516406-0930 Stockholm 75,000,000 100 170Preem Shipping AB 559110-9052 Stockholm 500 100 0Preem Technology AB 556117-6610 Lysekil 4,000 100 1Svensk Petroleum Förvaltning AB 556067-8459 Stockholm 664 66 0Drivmedelstation Preem AB 556955-3117 Stockholm 1,000 100 0Tibblemarken 3 AB 556915-2571 Stockholm 500 100 0Celkirk AB* 559110-1596 Stockholm 50,000 100 27
DormantSvenska Petroleum AB 556046-4819 Stockholm 1,000 100 0Såifa Drivmedel AB 556039-7001 Stockholm 5,000 100 1
199FOREIGN COMPANIESOperatingPreem Norge AS 919,502,193 Bærum 75,048 100 230
230* See Note 31
NOTE 114. Participations in associates
Swedish companies Corp. ID no. Reg. OfficeNumber of
sharesParticipating
interest, %Carrying amount
AB Djurgårdsberg 556077-3714 Stockholm 366 37 0Göteborgs Smörjmedelsfabrik, Scanlube AB 556287-6481 Gothenburg 50,000 50 5SunPine AB 556682-9122 Piteå 16,685 25 98Lignolproduktion AB 559095-1116 Stockholm 249,999 25 25Pyrocell AB 559167-3784 Gävle 500 50 1
129
2018 Assets Liabilities Equity Revenue Net profit/lossAB Djurgårdsberg 3 3 0 5 0Göteborgs Smörjmedelsfabrik, Scanlube AB 205 190 15 412 –1SunPine AB 1,025 421 604 1,458 179Lignolproduktion AB 75 75 0 – 0Pyrocell AB 80 78 2 – 0
2017 Assets Liabilities Equity Revenue Net profit/lossAB Djurgårdsberg 3 3 0 6 0Göteborgs Smörjmedelsfabrik, Scanlube AB 165 148 17 387 1SunPine AB 772 167 605 1,203 203
The information above refers to 100 percent of the companies’ assets, liabilities, equity, revenue and net profit/loss.
2018 2017Opening balance 103 103Investment for the year 26 –Closing balance 129 103
Accumulated cost 2018 2017At start of year 364 260Acquisitions for the year 28 123Divestment – –19Group contributions 49 0Shareholders’ contributions 106 –
547 364ACCUMULATED IMPAIRMENT LOSSES/AMORTIZATION At start of year 69 60Impairment losses 49 10
118 69Carrying amount at end of period 429 295
NOTE 113. Receivables from Group companies2018 2017
Opening cost 3 2Group contributions receivable – 0Closing accumulated cost 3 3

PARENT COMPANY NOTES
40 | Preem 2018
NOTE 115. Inventories2018 2017
Raw materials 3,465 4,978Finished products 6,697 5,713
10,162 10,691
The cost of inventories in the Group includes the equivalent of SEK 183 million (15) million of volumes of inventories out on loan. Borrowed inventory–volumes corresponding to a total inventory value of SEK 78 million (97) are not included in the inventory value.
NOTE 116. Trade receivables2018 2017
Trade receivables 4,082 4,415Reserve for doubtful debts –6 –7Fair value of trade receivables 4,076 4,408
The impairment principle changed in 2018 in connection with new principles in IFRS. Through a historical analysis in 2017 and 2018, it was established that the uncertainty remains steady at 0.01% of the total trade receivable stock at the time the receivable was generated and this is continuously reserved. All trade receivables over 90 days are reserved in their entirety. The age analysis of trade receivables is shown below:
2018 2017Less than 10 days 109 84Between 10 and 20 days 76 21Between 21 and 30 days 34 4More than 30 days 82 21
300 131
Changes in the reserve for doubtful trade receivables are as follows: 2018 2017At start of period 7 7Provision for impairment of trade receivables/unused amounts reversed for the year 11 7Confirmed losses for the year –12 –7At end of period 6 7
The accounting policies applied are described in Note 21 for the Group.
NOTE 117. Provisions for pensions2018 2017
NET LIABILITY IN THE BALANCE SHEETPresent value of obligation (calculated using Swedish policies)relating to unfunded pension plans 128 127Net amount recognized for pension obligations 128 127
CHANGES IN NET LIABILITIESNet liabilities at start of year for pension obligations 127 124Interest component of pension costs for the year 3 3Provision 6 10Pension payments –8 –8Other changes – 0
128 127
Share of these expenses covered by credit insurance via FPG/PRI 73 77
NOTE 118. Other liabilities2018 2017
VAT 431 461Excise duties1) 725 817Other liabilities 145 130
1,300 1,408
1) Excise duties refer to energy tax, carbon dioxide tax, sulfur tax and alcohol tax.
NOTE 119. Accrued expenses and deferred income2018 2017
Purchases of crude oil and products 2,062 3,159Personnel 321 306Interest 4 2Other 826 552
3,212 4,019
NOTE 120. Supplementary disclosures to the cash flow statement
2018 2017INTEREST PAID AND DIVIDENDS RECEIVEDDividends received 25 25Interest received 19 8Interest paid –267 –194
ADJUSTMENT FOR NON-CASH ITEMS, ETC.Depreciation, amortization and impairment of non-current assets 1,016 1,069Impairment losses on inventories (+)/ Reversal of impairment losses on inventories (–) 376 –8Unrealized exchange rate losses (+)/exchange rate gains (–) 101 –54Unrealized exchange rate losses (+)/ exchange rate gains (–), net financial items –21 –43Unrealized gains (–)/losses (+) on oil derivatives –484 70Expensed share of capitalized borrowing costs 102 102Provisions –12 72Capital gains/losses on disposal/retirement of non-current assets 5 –3Capital gains/losses on disposal of business/subsidiary – –112Capital gains/losses from associates –5 1
1,077 1,095
NOTE 121. Cash and bank balancesCash and bank balances in the balance sheet and the cash flow state-ment include the following with a maturity date less than three months after acquisition.
2018 2017Cash and bank balances 239 132
239 132

PARENT COMPANY NOTES
41 | Preem 2018
NOTE 122. Financial instrumentsFINANCIAL INSTRUMENTS BY CATEGORY
2018 Assets in the balance sheet
Assets measured at fair value
through profit/ loss for the year
Assets measured at fair value through other comprehen-
sive income
Financial assets measured at
amortised costCarrying amount
Fair value
Other shares and participations 11 – – 11 11Derivatives 2 – – 2 2Receivables from Parent Company – – 55 55 55Trade payables and other receivables – – 5,248 5,248 5,248Cash and cash equivalents – – 239 239 239
13 – 5,543 5,555 5,555
Liabilities in the balance sheet
Liabilities at fair value through profit/
loss for the year
Liabilities at fair value through other
comprehensive income
Other liabilities
Carrying amount
Fair value
Borrowings – – 7,389 7,389 7,389Derivatives 1 – – 1 1Other liabilities – – 4,134 4,134 4,134
1 – 11,522 11,523 11,523
2017 Assets in the balance sheet
Assets measured at fair value
through profit/ loss for the year
Assets measured at fair value through other comprehen-
sive income
Financial assets measured at
amortised costCarrying amount
Fair value
Other shares and participations 26 – – 26 26Derivatives 0 – – 0 0Receivables from Parent Company – – 55 55 55Trade payables and other receivables – – 4,983 4,983 4,983Cash and cash equivalents – – 132 132 132
26 – 5,170 5,197 5,197
Liabilities in the balance sheet
Liabilities at fair value through profit/
loss for the year
Liabilities at fair value through other
comprehensive income
Other liabilities
Carrying amount
Fair value
Borrowings – – 5,385 5,385 5,385Derivatives 3 – – 3 3Other liabilities – – 4,871 4,871 4,871
3 – 10,256 10,259 10,259
NOTE 123. Proposed appropriation of profitsThe Parent Company’s non-restricted equity amounts to SEK 10,909,709,145. The Board of Directors proposes that this amount be appropriated as follows:
2018Carried forward (SEK thousand) 10,909,709Total 10,909,709
FINANCIAL INSTRUMENTS MEASURED AT FAIR VALUE IN THE BALANCE SHEETThe table below shows financial instruments measured at fair value in the balance sheet, classified into the following three levels:
Level 1: Fair value is based on quoted market prices on an active market for the same instruments.
Level 2: Fair value is based on quoted market prices on an active market for similar instruments or measurement techniques where all variables are based on quoted market prices. This level includes oil derivatives in the form of swaps and options and interest rate swaps.
Level 3: Fair value is based on measurement techniques and the essential variables are not based on quoted market prices.
2018 Level 1 Level 2 Level 3Assets in the balance sheetOil derivatives – 2 –
– 2 –
Liabilities in the balance sheetOil derivatives – 1 –
– 1 –
2017 Level 1 Level 2 Level 3Assets in the balance sheetOil derivatives – – –
– – –
Liabilities in the balance sheetOil derivatives – 3 –
– 3 –

42 | Preem 2018
BOARD SIGNATURES
Stockholm, March 13, 2019
Per Höjgård Richard Öhman Michael G:son Löw
Petter HollandChief Executive Officer
Jason T. MilazzoChairman of the Board
Erika AnderssonEmployee representative
Lennart Sundén Cristian MattssonEmployee representative
Our audit report was submitted on April 17, 2019
KPMG ABHåkan Olsson Reising
Authorized Public Accountant

43 | Preem 2018
AUDITOR’S REPORT
Auditor’s reportTo the general meeting of the shareholders of Preem AB (publ), corp. ID 556072-6977
Statement on the annual report and consolidated financial statementsOpinionsWe have audited the annual report and consolidated financial statements of Preem AB (publ) for the year 2018, except for the sustainability report which is published at a separate web address.
In our opinion, the annual report has been prepared in accordance with the Annual Accounts Act, and in all material respects provides a true and fair view of the financial position of the Parent Company as of December 31, 2018 and its financial performance and cash flow for the year then ended in accord-ance with the Annual Accounts Act. The consolidated financial statements have been prepared in accordance with the Annual Accounts Act and in all material respects present a true and fair view of the financial position of the Group as of December 31, 2018 and its financial performance and cash flow for the year then ended in accordance with International Financial Report-ing Standards (IFRS), as adopted by the EU, and the Annual Accounts Act. Our opinions do not cover the sustainability report which is accessible via <preem.se/om-preem/finansiell_info/>. The Directors’ Report is consistent with the other parts of the annual report and the consolidated financial statements.
We therefore recommend the general meeting of sharehold-ers to adopt the income statement and balance sheet for the Parent Company and the Group.
Basis for Opinions We conducted our audit in accordance with International Standards on Auditing (ISA) and generally accepted auditing standards in Sweden. Our responsibilities under those stand-ards are further described in the Auditor’s Responsibilities section. We are independent of the Parent Company and the Group in accordance with professional ethics for accountants in Sweden and have otherwise fulfilled our ethical responsibilities in accordance with these requirements.
We believe that the audit evidence we have obtained is suffi-cient and appropriate to provide a basis for our opinions.
Information other than the annual report and consolidated financial statements This document also contains information other than the annual report and consolidated financial statements and is found on <preem.se/ om-preem/finansiell_info/>.
Our opinion on the annual report and consolidated financial statements does not cover this other information and we do not express any form of assurance conclusion regarding this other information.
In connection with our audit of the annual report and consoli-dated financial statements, our responsibility is to read the information identified above and consider whether the information is materially inconsistent with the annual report and consolidated financial statements. In this procedure, we also take into account our knowledge otherwise obtained in the audit and assess whether the information otherwise appears to be materially misstated.
If we, based on the work performed concerning this information, conclude that there is a material misstatement of this other information, we are required to report that fact. We have nothing to report in this regard.
Responsibilities of the Board of Directors and the CEOThe Board of Directors and the CEO are responsible for the preparation of the annual report and consolidated financial statements and that they provide a fair and true presentation in accordance with the Annual Accounts Act and, concerning the consolidated financial statements, in accordance with IFRS as adopted by the EU. The Board of Directors and the CEO are also responsible for such internal control as they determine is necessary to enable the preparation of annual report and consolidated financial statements that are free from material misstatement, whether due to fraud or error.
In preparing the annual report and consolidated financial statements, the Board of Directors and the CEO are responsible for the assessment of the company’s and the Group’s ability to continue as a going concern. They disclose, as applicable, matters related to going concern and using the going concern basis of accounting. The going concern basis of accounting is, however, not applied if the Board of Directors and the CEO intend to liquidate the company, to cease operations, or have no realistic alternative but to do so.
The Audit Committee shall, without prejudice to the Board of Director’s responsibilities and tasks in general, among other things oversee the company’s financial reporting process.
Auditor’s responsibility Our objectives are to obtain reasonable assurance about whether the annual report and consolidated financial state-ments as a whole are free from material misstatement, whether due to fraud or error, and to issue an auditor’s report that includes our opinions. Reasonable assurance is a high level of assurance, but is not a guarantee that an audit conducted in accordance with ISM and generally accepted auditing standards in Sweden will always detect a material misstatement when it exists. Misstatements can arise from fraud or error and are considered material if, individually or in the aggregate, they could reasonably be expected to influence the economic decisions of users taken on the basis of these annual report and consolidated financial statements.

44 | Preem 2018
AUDITOR’S REPORT
As part of an audit in accordance with ISM, we exercise professional judgment and maintain professional scepticism throughout the audit. We also:• Identify and assess the risks of material misstatement of the
annual report and consolidated financial statements, whether due to fraud or error, design and perform audit procedures responsive to those risks, and obtain audit evidence that is sufficient and appropriate to provide a basis for our opinions. The risk of not detecting a material misstatement resulting from fraud is higher than for one resulting from error, as fraud may involve collusion, forgery, intentional omissions, misrepresentations, or the override of internal control.
• Obtain an understanding of the company’s internal control relevant to our audit in order to design audit procedures that are appropriate in the circumstances, but not for the purpose of expressing an opinion on the effectiveness of the compa-ny’s internal control.
• Evaluate the appropriateness of accounting policies used and the reasonableness of accounting estimates and related disclosures made by the Board of Directors and the CEO.
• Conclude on the appropriateness of the Board of Directors’ and the CEO’s use of the going concern basis of accounting in preparing the annual report and consolidated financial statements. We also draw a conclusion, based on the audit evidence obtained, as to whether any material uncertainty exists related to events or conditions that may lead to significant doubt about the company’s and the Group’s ability to continue as a going concern. If we conclude that a material uncertainty exists, we are required to draw attention in our auditor’s report to the related disclosures in the annual report and consolidated financial statements or, if such disclosures are inadequate, to modify our opinion about the annual report and consolidated financial statements. Our conclusions are based on the audit evidence obtained up to the date of our auditor’s report. However, future events or conditions may cause a company and a group to cease to continue as a going concern.
• Evaluate the overall presentation, structure and content of the annual report and consolidated financial statements, including the disclosures, and whether the annual report and consolidated financial statements represent the underlying transactions and events in a manner that achieves fair presentation.
• Obtain sufficient and appropriate audit evidence regarding the financial information of the entities or business activities within the Group to express an opinion on the consolidated financial statements. We are responsible for the direction, supervision and performance of the Group audit. We remain solely responsible for our opinions.
We must inform the Board of Directors of the planned scope and timing of the audit. We must also inform of significant audit findings during our audit, including any significant deficiencies in internal control that we identified.
Statement on other legal and regulatory requirementsOpinionsIn addition to our audit of the annual report and consolidated financial statements, we have also audited the administration of the Board of Directors and the CEO of Preem AB (publ) for the year 2018 and the proposed appropriations of the company’s profit or loss.
We recommend to the general meeting of shareholders that the profit be appropriated in accordance with the proposal in the Directors’ Report and that the members of the Board of Directors and the CEO be discharged from liability for the financial year.
Basis for OpinionsWe conducted the audit in accordance with generally accepted auditing standards in Sweden. Our responsibilities under those standards are further described in the Auditor’s Responsibilities We are independent of the Parent Company and the Group in accordance with professional ethics for accountants in Sweden and have otherwise fulfilled our ethical responsibilities in accordance with these requirements.
We believe that the audit evidence we have obtained is suffi-cient and appropriate to provide a basis for our opinions.
Responsibilities of the Board of Directors and the CEO The Board of Directors is responsible for the proposal for appropriations of the company’s profit or loss. At the proposal of a dividend, this includes an assessment of whether the dividend is justifiable considering the requirements which the company’s and the Group’s type of operations, size and risks place on the size of the Parent Company’s and the Group’s equity, consolidation requirements, liquidity and position in general.
The Board of Directors is responsible for the company’s organization and the administration of the company’s affairs. This includes among other things continuous assessment of the company’s and the Group’s financial situation and ensuring that the company’s organization is designed so that the accounting, management of assets and the company’s financial affairs otherwise are controlled in a reassuring manner.
The CEO shall manage the ongoing administration according to the Board of Directors’ guidelines and instructions and among other matters take measures that are necessary to perform the company’s accounting in accordance with law and handle the management of assets in a reassuring manner.
Auditor’s responsibility Our objective concerning the audit of the administration, and thereby our opinion about discharge from liability, is to obtain audit evidence to assess with a reasonable degree of assurance whether any member of the Board of Directors or the CEO in any material respect:• has undertaken any action or been guilty of any omission
which can give rise to liability to the company, or• in any other way has acted in contravention of the Companies
Act, the Annual Accounts Act or the Articles of Association.

45 | Preem 2018
AUDITOR’S REPORT
Our objective concerning the audit of the proposed appropria-tions of the company’s profit or loss, and thereby our opinion about this, is to assess with reasonable degree of assurance whether the proposal is in accordance with the Companies Act.
Reasonable assurance is a high level of assurance, but is not a guarantee that an audit conducted in accordance with generally accepted auditing standards in Sweden will always detect actions or omissions that can give rise to liability to the company, or that the proposed appropriations of the compa-ny’s profit or loss are not in accordance with the Companies Act.
As part of an audit in accordance with generally accepted auditing standards in Sweden, we exercise professional judgment and maintain professional scepticism throughout the audit. The examination of the administration and the proposed appropriations of the company’s profit or loss is based primarily on the audit of the accounts. Additional audit procedures performed are based on our professional judgment with a starting point in risk and materiality. This means that we focus the examination on such actions, areas and relationships that are material for the operations and where deviations and violations would have particular importance for the company’s situation. We examine and test decisions made, support for decisions, actions taken and other circumstances that are relevant to our opinion concerning discharge from liability. As a basis for our opinion on the Board of Directors’ proposed appropriations of the company’s profit or loss we examined whether the proposal is in accordance with the Companies Act.
The auditor’s opinion regarding the statutory sustainability reportThe Board of Directors is responsible for the sustainability report published outside of this report, and for it being prepared in accordance with the Annual Accounts Act.
Our examination has been conducted in accordance with FAR’s auditing standard RevR 12 The auditor’s opinion regard-ing the statutory sustainability report. This means that our examination of the statutory sustainability report is different and substantially less in scope than an audit conducted in accordance with International Standards on Auditing and generally accepted auditing standards in Sweden. We believe that this examination has provided us with sufficient basis for our opinion.
A statutory sustainability report has been prepared.
Stockholm, April 17, 2019
KPMG ABHåkan Olsson Reising
Authorized Public Accountant

46 | Preem 2018
OTHER
2018 2017 2016 2015 2014
Sales revenue, SEK million 92,553 68,752 56,041 66,006 84,438
Profit/loss before tax, SEK million 1,746 3,971 1,431 1,423 –3,637
Return on capital employed, % 12 29 25 19 0
Return on adjusted equity, % 11 25 8 11 0
Adjusted EBITDA 3,570 4,188 3,399 5,427 2,113
Capital expenditures in plants1), SEK million 2,063 2,337 1,348 968 818
Total assets, SEK million 29,092 27,591 22,980 21,381 24,856
Equity/assets ratio, % 44 44 39 38 30
Average number of employees 1,483 1,458 1,395 1,319 1,2781) Excluding plants acquired through acquisitions
Capital employed Total assets minus interest-free trade payables.
Average adjusted equityEquity including non-controlling interests.
Return on capital employedProfit/loss before borrowing expenses as a percentage of average capital employed.
Return on adjusted equityProfit/loss after tax as a percentage of average adjusted equity.
The Preem Group’s operations in summary
DefinitionsAdjusted EBITDAOperating profit/loss before amortization of intangible assets and depreciation of property, plant and equipment excluding price effects on inventory and exchange rate gains and losses.
Equity/assets ratio Adjusted equity as a percentage of total assets.

Preem AB, 112 80 Stockholm Street address: Warfvinges väg 45 Tel: +46 10 450 10 00 www.preem.se
NARVA


![M1 Garand Barrel Replacement – New Barrel[1]](https://static.fdocuments.in/doc/165x107/577c79801a28abe05492e684/m1-garand-barrel-replacement-a-new-barrel1.jpg)