
Predictive Modeling Summit - Health Care Conference Administrators
46
Using Predictive Models to Move Medicaid Providers Toward Best Practices and Reduce Waste Predictive Modeling Summit Gary Redding, Vice President and Practice Leader, Thomson Reuters Michelle McAllister, Consulting Manager, Thomson Reuters
Transcript of Predictive Modeling Summit - Health Care Conference Administrators
Using Predictive Models to Move Medicaid Providers Toward Best Practices and Reduce WastePredictive Modeling Summit
Gary Redding, Vice President and Practice Leader, Thomson Reuters
Michelle McAllister, Consulting Manager, Thomson Reuters

©20
09 T
hom
son
Reu
ters
HEALTHCARE PAYER SOLUTIONS2
AGENDA• Thomson Reuters
• Using Predictive Models to Move Medicaid Providers Toward Best Practices and Reduce Waste
• Questions and Discussion

Thomson Reuters
Gary Redding, Vice President and Practice Leader, Thomson Reuters

©20
09 T
hom
son
Reu
ters
HEALTHCARE PAYER SOLUTIONS4
OUR FOOTPRINT

©20
09 T
hom
son
Reu
ters
HEALTHCARE PAYER SOLUTIONS5
MEDIA
FINANCIAL
LEGAL
TAX &ACCOUNTING
Knowledge To Act
Thomson Reuters is the world’s leading source of intelligent information for business and professionals.
HEALTHCARE & SCIENCE• Integrated decision support solutions for improving
clinical and business performance
• Insights for better healthcare touching 150 million lives
• We are known for our:• Independence• Objectivity• Reliability

©20
09 T
hom
son
Reu
ters
HEALTHCARE PAYER SOLUTIONS6
GE, FedEx, GM, Ford, Boeing, Corning, Dow
Many U.S. hospitals
All major U.S. pharma companies
CIGNA, Paramount, Emblem, Humana, Numerous BCBS plans
CMS, AHRQ, CDC, SAMHSA, VA, DOD
11 state employers28 Medicaid
agencies8 HHS agencies
UNPARALLELED EXPERTISE ACROSS THE SPECTRUM OF HEALTHCARE
State Government
Federal Government
100+ Health Plans
200+ Employers
3,000+ Hospitals
Pharma

©20
09 T
hom
son
Reu
ters
HEALTHCARE PAYER SOLUTIONS7
28 Medicaid agencies11 state employersState
Government
CMS AHRQ CDC SAMHSA VA DODMedpac
Federal Government
A Trusted Partner to Government and Non-Profits
7
AARPAcademyHealth Bridges to ExcellenceCalifornia Cooperative Healthcare Reporting initiativeIHA (Integrated Healthcare Association)Pacific Business Group on HealthMidwest Health Initiative (St. Louis)Robert Wood Johnson FoundationOthers
Research & Non-Profit

©20
09 T
hom
son
Reu
ters
HEALTHCARE PAYER SOLUTIONS8
Medicaid Customers
AK
HI
WA
OR
ID
MT
WY
ND
SD
NE
CAUT
NV
AZ
CO
NM
KS
OK
TX
MN
IA
WI
IL IN
MO
AR
MI
OH
KY
TN
MS
LAAL GA
SC
VAWV
PA
NY
MEVTNH
MDDC
DENJ
CT
MA
NC
FL
ME
RI
©20
09 T
hom
son
Reu
ters
HEALTHCARE PAYER SOLUTIONS9
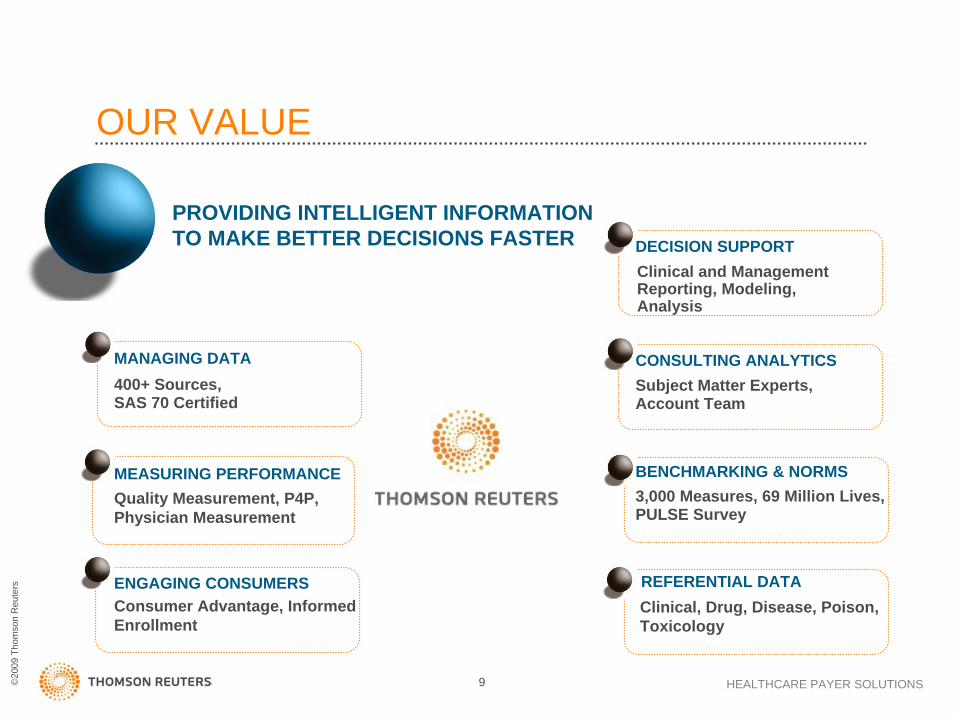
OUR VALUE
PROVIDING INTELLIGENT INFORMATION TO MAKE BETTER DECISIONS FASTER
MANAGING DATA400+ Sources,SAS 70 Certified
MEASURING PERFORMANCEQuality Measurement, P4P, Physician Measurement
ENGAGING CONSUMERSConsumer Advantage, Informed Enrollment
DECISION SUPPORTClinical and Management Reporting, Modeling, Analysis
CONSULTING ANALYTICSSubject Matter Experts, Account Team
BENCHMARKING & NORMS3,000 Measures, 69 Million Lives, PULSE Survey
REFERENTIAL DATAClinical, Drug, Disease, Poison, Toxicology
©20
09 T
hom
son
Reu
ters
HEALTHCARE PAYER SOLUTIONS
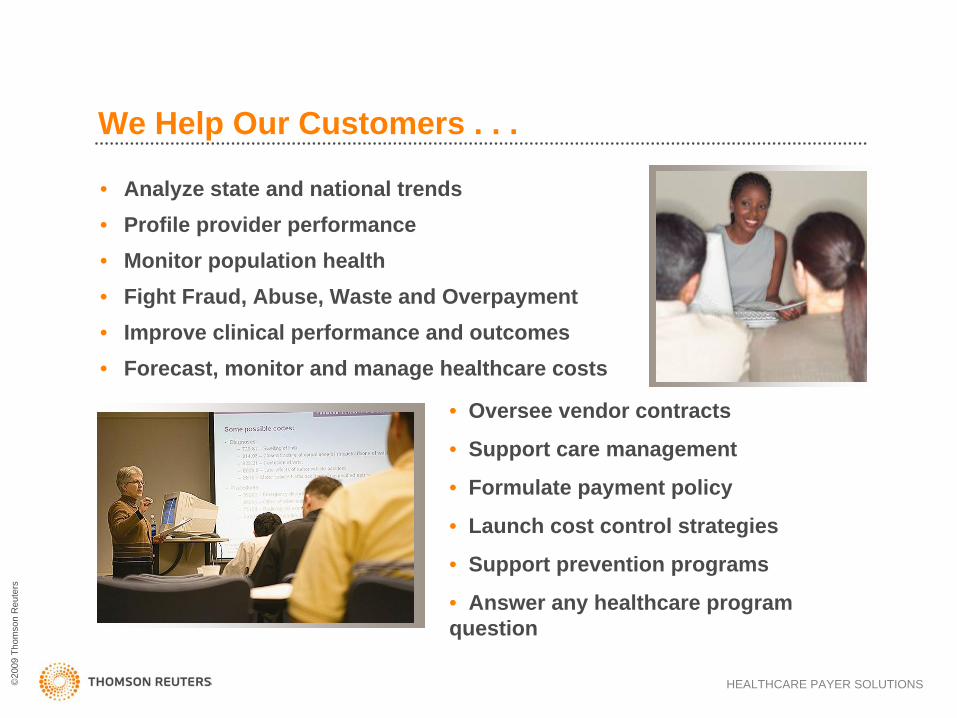
• Analyze state and national trends• Profile provider performance• Monitor population health • Fight Fraud, Abuse, Waste and Overpayment• Improve clinical performance and outcomes • Forecast, monitor and manage healthcare costs
We Help Our Customers . . .
• Oversee vendor contracts
• Support care management
• Formulate payment policy
• Launch cost control strategies
• Support prevention programs
• Answer any healthcare program question
Using Predictive Models to Move Medicaid Providers Toward Best Practices and Reduce Waste
Michelle McAllister, Consulting Manager, Thomson Reuters

©20
09 T
hom
son
Reu
ters
HEALTHCARE PAYER SOLUTIONS12
Overview• Context
– What is Predictive Modeling?– History of Predictive Modeling
• How it Works– Predictive Modeling Basics– A Useful Approach to Predictive Modeling and Targeting
• Case Studies: Applications in Moving Providers Toward Best Practices and Reduce Waste

Context

©20
09 T
hom
son
Reu
ters
HEALTHCARE PAYER SOLUTIONS14
What is Predictive Modeling?• Use of demographic, diagnostic, and utilization
information, with analytic models to predict:– Beneficiaries who will be high-risk/high-cost in the future – Future costs– Future utilization– Influence Best Practices– Help Reduce Waste
… in order to better intervene, manage risk, ensure quality and set rates

©20
09 T
hom
son
Reu
ters
HEALTHCARE PAYER SOLUTIONS15
History of Predictive Modeling
• Research began on health-based risk models
• Health Insurance Plan of California (HIPC) implemented a homegrown risk adjustment model
• State of Washington Employees and State of Colorado’s Medicaid program used risk adjustment for payments
• Balanced Budget Act – mandated risk-adjusted payments for Medicare+Choice for year 2000 (Principal Inpatient Dx Model)
• 1st Society of Actuaries study comparing several different risk models and risk adjusters.

©20
09 T
hom
son
Reu
ters
HEALTHCARE PAYER SOLUTIONS16
History of Predictive Modeling (cont.)
• 2nd Society of Actuaries study comparing several different risk models and risk adjusters. DCGs chosen best in class.
• CMS selects an ‘all encounter model’
• 3rd Society of Actuaries study comparing several different risk models and risk adjusters. DCGs chosen best in class. 12 models tested.
©20
09 T
hom
son
Reu
ters
HEALTHCARE PAYER SOLUTIONS
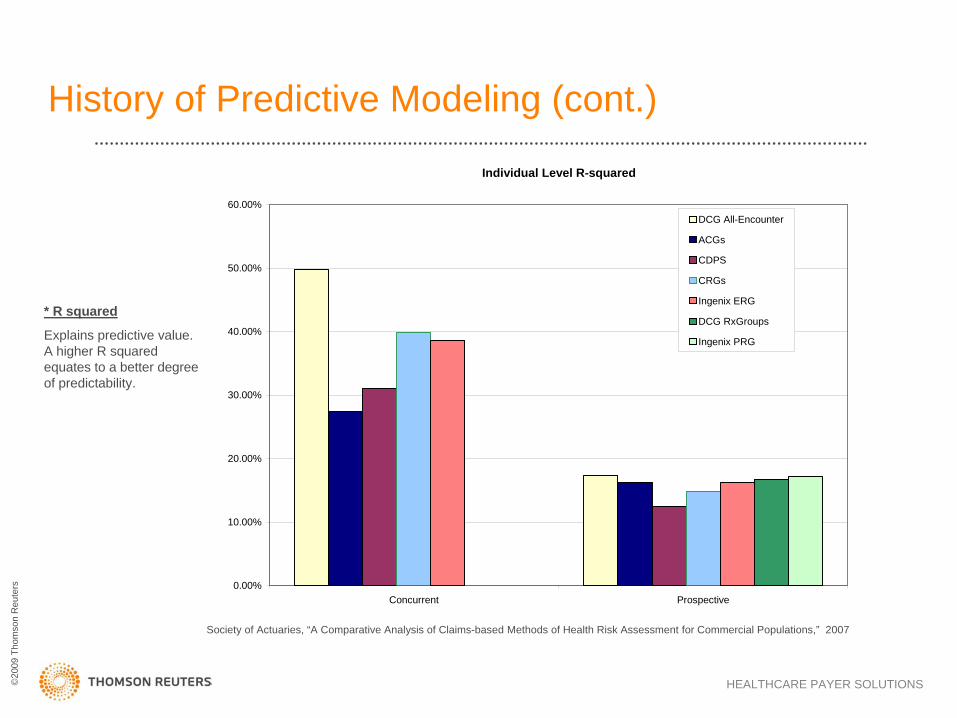
History of Predictive Modeling (cont.)
Society of Actuaries, “A Comparative Analysis of Claims-based Methods of Health Risk Assessment for Commercial Populations,” 2007
* R squared
Explains predictive value. A higher R squared equates to a better degree of predictability.
Individual Level R-squared
0.00%
10.00%
20.00%
30.00%
40.00%
50.00%
60.00%
Concurrent Prospective
DCG All-Encounter
ACGs
CDPS
CRGs
Ingenix ERG
DCG RxGroups
Ingenix PRG

How it works

©20
09 T
hom
son
Reu
ters
HEALTHCARE PAYER SOLUTIONS19
Predictive Modeling Basics• Most models are designed to require 1 year’s worth
of enrollment and medical and/or pharmacy data.
• Purpose Varies– Predictive Modeling in Pricing
• Identify difference in cost between people and groups to price accordingly
– Predictive Modeling in Care Management• Resource use and intensity is the focus

©20
09 T
hom
son
Reu
ters
HEALTHCARE PAYER SOLUTIONS
DCGs
• Thomson Reuters currently utilizes Diagnostic Cost Groups (DCGs)
– DCGs are a population-based classification and risk adjustment methodology
– Developed and licensed by Verisk Health Inc.
– Selected by CMS for the Medicare Choice Program
Population Group
Variant
Medicare All - encounter
Medicaid All - encounter
All – encounter
Commercial Rx Groups – Rx/InpatientRx Groups – Rx OnlyEtc.
DCG Models in Advantage Suite

©20
09 T
hom
son
Reu
ters
HEALTHCARE PAYER SOLUTIONS21
The DCG models work by:• Classifying raw administrative (medical and/or
pharmacy claims as well as eligibility and aid category) data into coherent clinical groupings
• Applying clinically valid hierarchies and interactions to create an aggregated, empirically valid patient score at the individual beneficiary level
• Correlating the scores with the cost of the health burden carried by the beneficiary
• Aggregating individual scores by groups of interest creates group-level predictive results specific to many Medicare/Medicaid applications

©20
09 T
hom
son
Reu
ters
HEALTHCARE PAYER SOLUTIONS22
Medical Episode Grouper (MEG)
• An episode is all care for a course of treatment of a disease– Primary and secondary diagnosis codes grouped into one of 560
disease categories– Stratified by severity of illness– Disease categories and clinical criteria specified by physicians at
Jefferson Medical College
• Includes inpatient, outpatient and drug claims– Not every claim is assigned an episode
• Also includes admissions
• Patients may have more than one episode at any given time
What is an episode?

©20
09 T
hom
son
Reu
ters
HEALTHCARE PAYER SOLUTIONS23
MEG provides clinically relevant
grouping
©20
09 T
hom
son
Reu
ters
HEALTHCARE PAYER SOLUTIONS24
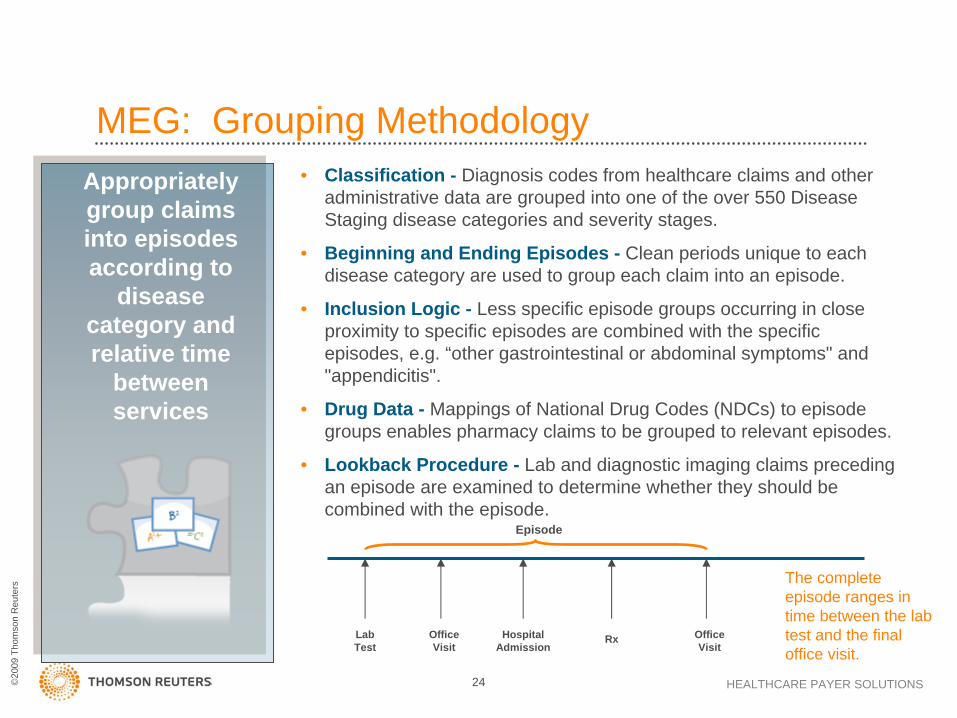
Appropriately group claims into episodes according to
disease category and relative time
between services
• Classification - Diagnosis codes from healthcare claims and other administrative data are grouped into one of the over 550 Disease Staging disease categories and severity stages.
• Beginning and Ending Episodes - Clean periods unique to each disease category are used to group each claim into an episode.
• Inclusion Logic - Less specific episode groups occurring in close proximity to specific episodes are combined with the specific episodes, e.g. “other gastrointestinal or abdominal symptoms" and "appendicitis".
• Drug Data - Mappings of National Drug Codes (NDCs) to episode groups enables pharmacy claims to be grouped to relevant episodes.
• Lookback Procedure - Lab and diagnostic imaging claims preceding an episode are examined to determine whether they should be combined with the episode.
MEG: Grouping Methodology
Lab Test
Office Visit
Hospital Admission
Office Visit
Rx
Episode
The complete episode ranges in time between the lab test and the final office visit.

©20
09 T
hom
son
Reu
ters
HEALTHCARE PAYER SOLUTIONS25
Look-back
Episode 10CAD,
Progressive Angina
Clean Period
Office
Visit
PrescriptionLab Hospital
Admission
Office
Visit
DRUG TRANSACTION FILEPATID NDC SERVDATE01 ISDN 95-01-1501 INSUL 95-02-1501 INSUL 95-04-1501 AMOX 95-04-1501 AMOX 95-11-1501 GRHORM 95-11-15
DRUG TRANSACTION FILEPATID NDC SERVDATE01 ISDN 95-01-1501 INSUL 95-02-1501 INSUL 95-04-1501 AMOX 95-04-1501 AMOX 95-11-1501 GRHORM 95-11-15
LOOKUP TABLENDC EPGRPISDN 10INSUL 359INSUL 360INSUL 361AMOX 484AMOX 86
LOOKUP TABLENDC EPGRPISDN 10INSUL 359INSUL 360INSUL 361AMOX 484AMOX 86
Office
Visit
MEG—Putting it All Together

©20
09 T
hom
son
Reu
ters
HEALTHCARE PAYER SOLUTIONS26
Medical Episode Grouper (MEG)
• Attributes all costs to diseases– Particularly prescription drugs
• Finds a physician that is accountable for treatment– Managing Physician
• Identifies the physician who guided treatment usually providing multiple E & M visits
• Use to identify the decision-maker in a patient’s care– Primary Physician
• Identifies the physician with the highest costs• Use to evaluate if specific episode costs
• Measures and compares the costs of treating disease– Which providers and plans are most efficient– Both price and resource consumption
What is the analytic value of using episodes?

©20
09 T
hom
son
Reu
ters
HEALTHCARE PAYER SOLUTIONS27
MEG: Potential Drug Substitutions – ACEI vs. ARBQuintile 1
12%
88%
ACEI ARB
Quintile 5
41%
59%
ACEI ARB
• ARB has no generic substitute and is more costly than therapeutically similar ACEI.• Quintile 5 patients are more likely to receive an ARB.

©20
09 T
hom
son
Reu
ters
HEALTHCARE PAYER SOLUTIONS28
MEG: Variation and Cost of Antithrombotic Treatment• People prescribe/take antithrombotics for hypertension to lower risk of
ischemic event – “it makes sense.”
• Aspirin/antiplatelet is recommended for secondary prevention of ischemic event.
• However:– Warfarin not recommended.– Antiplatelet therapy not recommended for primary prevention, as risk of
hemorrhage is greater than risk reduction of ischemic event.
Cost of Antithrombotic Drugs for Primary Prevention
Lip GYH, Felmeden DC. Antiplatelet agents and anticoagulants for hypertension. Cochrane Database of Systematic Reviews 2004, Issue 3. Art. No.: CD003186. DOI: 10.1002/14651858.CD003186.pub2
Quintile 1 $3,686Quintile 5 $213,962

©20
09 T
hom
son
Reu
ters
HEALTHCARE PAYER SOLUTIONS29
Episodes and Patient-Level Adjustment
• Diagnostic Cost Groups (DCGs)– Risk adjustment methodology used to predict
current or future patient costs, e.g. relative risk score (RRS)
– Unit of analysis – the patient– Based on all prior or current year claims to identify
patient-level complexity/comorbidities
• Together, MEG and DCGs provide a complete picture of a patient

©20
09 T
hom
son
Reu
ters
HEALTHCARE PAYER SOLUTIONS30
Disease Staging Framework• Initially developed under contract to NCHSR with
ongoing private development by Medstat/Jefferson teams
• Software converts a stream of claims into clinically homogeneous groups
• Takes over 15,000 ICD-9-CM codes to 560 disease categories
• Independent of setting or treatment
• Etiology assigned to each category
• Severity stratification based on robust clinical criteria

©20
09 T
hom
son
Reu
ters
HEALTHCARE PAYER SOLUTIONS31
What is Risk Adjusted Episodes?• An improved method of benchmark adjustment in Decision Analyst
that combines the disease and severity strength of MEG with the population-based risk adjustment power of the DCG grouper
• Basing risk adjustment on average episode costs ignores significant risk factors which physicians take into account when treating a patient.
– Age and gender– Comorbidities
• Basing risk adjustment on a single illness burden score (for the patient) ignores vital information about diseases and severity levels.
– Risk adjustment using illness burden accounts for the risk of a population across all conditions, but is not enough to determine expected costs for a specific condition.
• Combining episodes and illness-burden methodologies addresses the shortcomings of each.
A Useful Approach to Predictive Modeling and Targeting: Risk Adjusted Episodes

©20
09 T
hom
son
Reu
ters
HEALTHCARE PAYER SOLUTIONS32
The Problem
Michael
Progressive Angina2005 Costs ~ $15,323
Michael
Progressive Angina2005 Costs ~ $15,323
Diane
Progressive Angina2005 Costs ~ $5,974
Diane
Progressive Angina2005 Costs ~ $5,974
62 year old, Male
Comorbidities• Renal failure• Deep vein thrombosis• Impaired fasting glucose• Asthma
Relative Risk Score = 56.38
62 year old, Male
Comorbidities• Renal failure• Deep vein thrombosis• Impaired fasting glucose• Asthma
Relative Risk Score = 56.38
58 year old, Female
Comorbidities• Hypertension, minimal
Relative Risk Score = 5.54
58 year old, Female
Comorbidities• Hypertension, minimal
Relative Risk Score = 5.54
Patients at the same severity level within an episode can have significant cost variance….
...due to different comorbidity profiles.

©20
09 T
hom
son
Reu
ters
HEALTHCARE PAYER SOLUTIONS33
Dimensions of Risk that Drive Episode Cost
$0
$5,000
$10,000
$15,000
$20,000
1 2 3 4 5
1 - Stable Angina2 - Progressive Angina3 - AMI
Mean AllowedPayments
Complexity Levels
Episode Severity Levels
Source: Based on ~ 100 Million Claims, 2003-2004
To fairly compare physicians on cost of care, differences in complexity levels need to be considered

©20
09 T
hom
son
Reu
ters
HEALTHCARE PAYER SOLUTIONS34
Risk Adjusted Episodes– The method is intuitive and easy to explain to physicians /
clinicians– It does a better job at an individual physician-level of
accounting for that physician’s mix of patients / severity– It has potential for improvements in predictive power

©20
09 T
hom
son
Reu
ters
HEALTHCARE PAYER SOLUTIONS35
Risk Adjusted Cost Profile for Cardiology Episodes
Physicians
PerformanceRatio
Expected CostsPer Episode
ActualCosts Per Episode
EpisodeCost Scale(avg=100)
# Episodes
Jones 77 159 $6,426 $5,075 $5,196 1.27 1.24
Harris 75 115 $2,106 $3,018 $2,875 0.70 0.73
Davis 72 159 $4,983 $5,690 $5,917 0.88 0.84
Brown 62 80 $838 $1,537 $1,459 0.55 0.57
Wilson 62 83 $1,001 $1,501 $1,492 0.67 0.67
Smith 61 167 $5,667 $5,746 $5,851 0.99 0.97
Gold 58 86 $816 $1,557 $1,592 0.52 0.51
Murphy 57 158 $3,710 $5,646 $5,329 0.66 0.70
Evans 53 110 $2,653 $2,990 $2,858 0.89 0.93
Ford 53 91 $2,671 $1,818 $1,994 1.47 1.34
Before After Before After
Source: Based on subset of Marketscan Commercial data, 2002-2004

©20
09 T
hom
son
Reu
ters
HEALTHCARE PAYER SOLUTIONS36
Risk Adjusted Cost Profile for Dr. Ford
Episode GroupPerformance
RatioExpected Costs
Per EpisodeActualCosts Per Episode
EpisodesStage
Arrhythmias 1.01 1 $226 $1,217 $1,295 0.19 0.17
Congestive Heart Failure
3.01 1 $391 $6,474 $8,525 0.06 0.05
Angina Pectoris 1.01 2 $18,816 $4,632 $4,664 4.06 4.03
Angina Pectoris 1.02 1 $36,638 $7,583 $7,897 4.83 4.64
Angina Pectoris 2.04 1 $23,794 $22,033 $28,480 1.08 0.84
Essential Hypertension, Chronic Maint
1.01 45 $870 $1,057 $1,057 0.82 0.82
Other Cardiovascular
Symptoms
1.01 2 $1,876 $1,128 $1,290 1.66 1.46
TOTALS 53 $2,671 $1,818 $1,994 1.47 1.34
Before After Before After
Source: Based on subset of Marketscan Commercial data, 2002-2004
©20
09 T
hom
son
Reu
ters
HEALTHCARE PAYER SOLUTIONS37
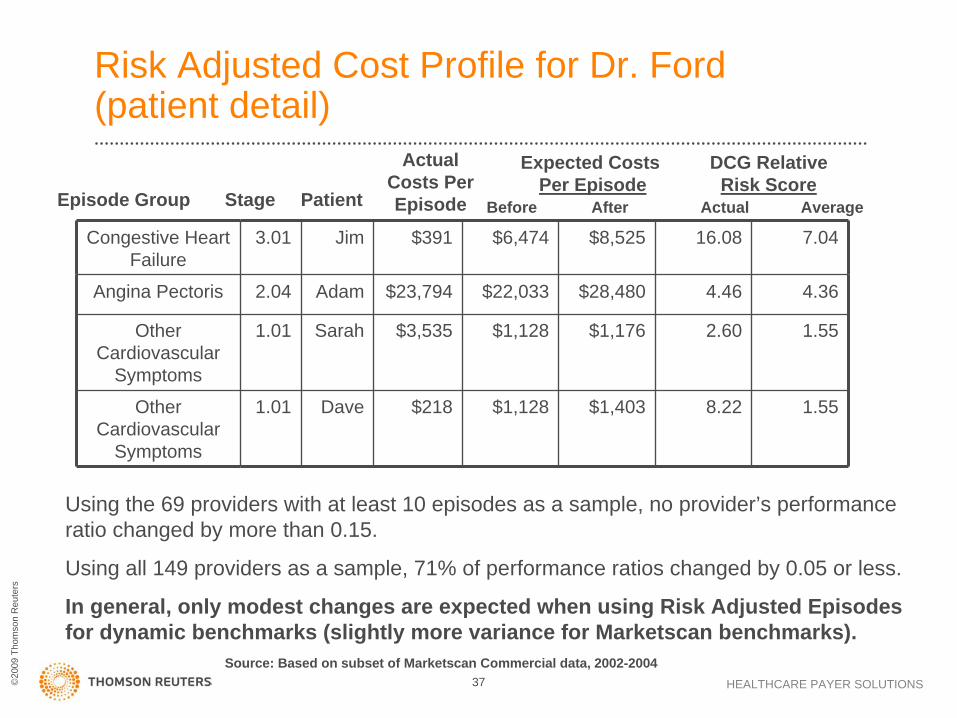
Risk Adjusted Cost Profile for Dr. Ford (patient detail)
Episode Group
DCG RelativeRisk Score
Expected CostsPer Episode
ActualCosts Per EpisodePatientStage
Congestive Heart Failure
3.01 Jim $391 $6,474 $8,525 16.08 7.04
Angina Pectoris 2.04 Adam $23,794 $22,033 $28,480 4.46 4.36
Other Cardiovascular
Symptoms
1.01 Sarah $3,535 $1,128 $1,176 2.60 1.55
Other Cardiovascular
Symptoms
1.01 Dave $218 $1,128 $1,403 8.22 1.55
Before After Actual Average
Source: Based on subset of Marketscan Commercial data, 2002-2004
Using the 69 providers with at least 10 episodes as a sample, no provider’s performance ratio changed by more than 0.15.
Using all 149 providers as a sample, 71% of performance ratios changed by 0.05 or less.
In general, only modest changes are expected when using Risk Adjusted Episodes for dynamic benchmarks (slightly more variance for Marketscan benchmarks).

Case Studies Moving Medicaid Providers Toward Best Practices and Reduce Waste

©20
09 T
hom
son
Reu
ters
HEALTHCARE PAYER SOLUTIONS39
Provider Profiling with Risk Adjusted Episodes• Blue Cross Blue Shield Plan was charged with developing
risk-adjusted provider profiles for both internal and external profiling goals.
• Thomson Reuters combined patient-level risk scores from the Diagnostic Cost Grouper (DCG) with the severity score from Thomson Reuter’s Medical Episode Grouper.
• Eliminates the potential of rewarding physicians who care for patients with few co-morbid diseases while penalizing physicians who care for patients with a significant illness burden.
• Results: BCBS used information during contract negotiations, and supplied providers with actionable goals and recommendations.
©20
09 T
hom
son
Reu
ters
HEALTHCARE PAYER SOLUTIONS40
Provider Performance and Gaps in Care• Thomson Healthcare and APS Health Systems are
partnering to assist a State Medicaid agency in using data to create meaningful internal and external analyses to evaluate provider performance and create an action plan to address any gaps.
• Maintain healthcare utilization review system specific to disease/risk status – based on updated guidelines & evidence based medicine– Advantage Suite with MEG, DCGs, Patient Health Record– Physician Performance Assessment Module

©20
09 T
hom
son
Reu
ters
HEALTHCARE PAYER SOLUTIONS41
• Efficiency (Affordability) Measures– Medical Episode Grouper (MEG)– Disease Staging Severity Model– DCG Risk-Adjusted
• Effectiveness (Quality) Measures– Nationally adopted
evidence-based measures– Custom measures as appropriate
• Analysis and Reporting– Physician Identification– Physician Attribution– Other Methods and Analytics– Measure Reliability and Stability– Reporting and Distribution
PHYSICIAN PERFORMANCE ASSESSMENT: CORE METHODS & CAPABILITIES
Thomson Reuters Analytics
Proven, Fair, Credible Methods for
Performance Evaluation

©20
09 T
hom
son
Reu
ters
HEALTHCARE PAYER SOLUTIONS42
A FRAMEWORK FOR PHYSICIAN PERFORMANCE MEASUREMENT
EffectivenessAssessment
DataEfficiency
Assessment
• Quality Measures- Numerator- Denominator
• Denominator- Episode Grouper- Episode Severity- Patient Risk (comorbidities)
• Numerator- Utilization & Cost MeasuresReporting
• Physician Identification and Attribution
• Outlier Exclusion• Volume Thresholds• Composite Scores

©20
09 T
hom
son
Reu
ters
HEALTHCARE PAYER SOLUTIONS43
Claims Administrative RulesSets of procedures and billing activities governing the administrative rules for payment
FraudAbuseGamingWasteErrorClean Claim
Peer Group Practice NormsComparisons among providers or patients that identify deviations from peer group normative behavior
Evidence-Based MedicineThe conscientious and judicious use of current best evidence from clinical and outcome research for the management of individual patients
Determination of Appropriateness
Administrative Rules
Peer Group Norms
Evidence-Based
Medicine
Thomson Healthcare’s Intelligence: EBM
Gold Standard

©20
09 T
hom
son
Reu
ters
HEALTHCARE PAYER SOLUTIONS44
Predictive Modeling in Program Integrity• There is no application that can “predict” future fraud and abuse
– Providers and Beneficiaries cannot be prosecuted for future possibilities
• When are Program Integrity and Predictive Modeling linked?– By looking at past experience states can predict which types of provider
services, which regions of the state, or other variables that predict more likely yields of fraud or abuse cases
• This type of predictive modeling definition is currently being popularized in law enforcement for deployment of police to areas of the city that have a history of particular crimes at particular times.
– Compiling several red flags or indicators of potential F&A and applying a score to a provider over the multiple indicators
– Prepayment flags that scored providers in various levels of upcoding, unbundling, or improper billings only look at incoming claims and don’t look at the whole picture of paid claims across all databases
– Prepayment Editing predicts inappropriate billings and denies the claims before payment

©20
09 T
hom
son
Reu
ters
HEALTHCARE PAYER SOLUTIONS4545
Questions & Discussion

©20
09 T
hom
son
Reu
ters
HEALTHCARE PAYER SOLUTIONS46
Contact:
David Nelson Director
Thomson Reuters (734) 913-3432 Direct (734) 913-3338 Fax