
Predictive Model Development: Identifying high-risk patients in primary care attendance
27
Predictive Model Development: Identifying high-risk patients in primary care attendance Financed with the help PI 06/1122 (FIS) of ISCIII Antonio Sarría Santamera Mª Auxiliadora Martín Martín Mª del Rocío Carmona Alférez Pilar Gallego Berciano AGENCY EVALUATION OF HEALTH TECHNOLOGIES AGENCY EVALUATION OF HEALTH TECHNOLOGIES INSTITUTO DE SALUD CARLOS III INSTITUTO DE SALUD CARLOS III
description
Antonio Sarría Santamera Mª Auxiliadora Martín Martínez Mª del Rocío Carmona Alférez Pilar Gallego Berciano. Predictive Model Development: Identifying high-risk patients in primary care attendance. Financed with the help PI 06/1122 (FIS) of ISCIII. - PowerPoint PPT Presentation
Transcript of Predictive Model Development: Identifying high-risk patients in primary care attendance
Predictive Model Development:
Identifying high-risk patients in primary care attendance
Financed with the help PI 06/1122 (FIS) of ISCIII
Antonio Sarría Santamera Mª Auxiliadora Martín Martínez Mª del Rocío Carmona AlférezPilar Gallego Berciano
AGENCY EVALUATION OF HEALTH TECHNOLOGIESAGENCY EVALUATION OF HEALTH TECHNOLOGIES
INSTITUTO DE SALUD CARLOS IIIINSTITUTO DE SALUD CARLOS III

Sandín Vázquez MConde Espejo Pde Bustos Guadaño MAsunsolo del Barco ARiesgo Fuertes RGarrido Elustondo SCabello Ballesteros MLEscortell Mayor MESanz Cuesta T
Calvo Parra IVillaitodo Villén PBartolomé Casado MSJiménez Carramiñana JCasado López MParralejo Buendía MBasanta López MBonache Blay MMartínez-Toledano Olaya
P Rico Blázquez M
Utilization of Primary Health Care Research Group
High frequency of attendance is one of the main problems in PC.
Excessive use has been linked to a limited number of patients who have been called frequent user.
Who are they? How many are they?
High frequency of attendance is one of the main problems in PC.
Excessive use has been linked to a limited number of patients who have been called frequent user.
Who are they? How many are they?
INTRODUCTION
There is no agreement on the definition of frequent users.
We propose that the level of use should be linked to the patient risk profile of patients.
Overuse will suppose that patient have a higher number of visits than expected given their risk profile.
There is no agreement on the definition of frequent users.
We propose that the level of use should be linked to the patient risk profile of patients.
Overuse will suppose that patient have a higher number of visits than expected given their risk profile.
INTRODUCTION
1. To identify factors associated with the use of visits to primary care physicians.
1. To identify factors associated with the use of visits to primary care physicians.
2. To assess the frequency of over-use. 2. To assess the frequency of over-use.
OBJECTIVES
METHODOLOGY
Design. location and sources of Design. location and sources of informationinformation
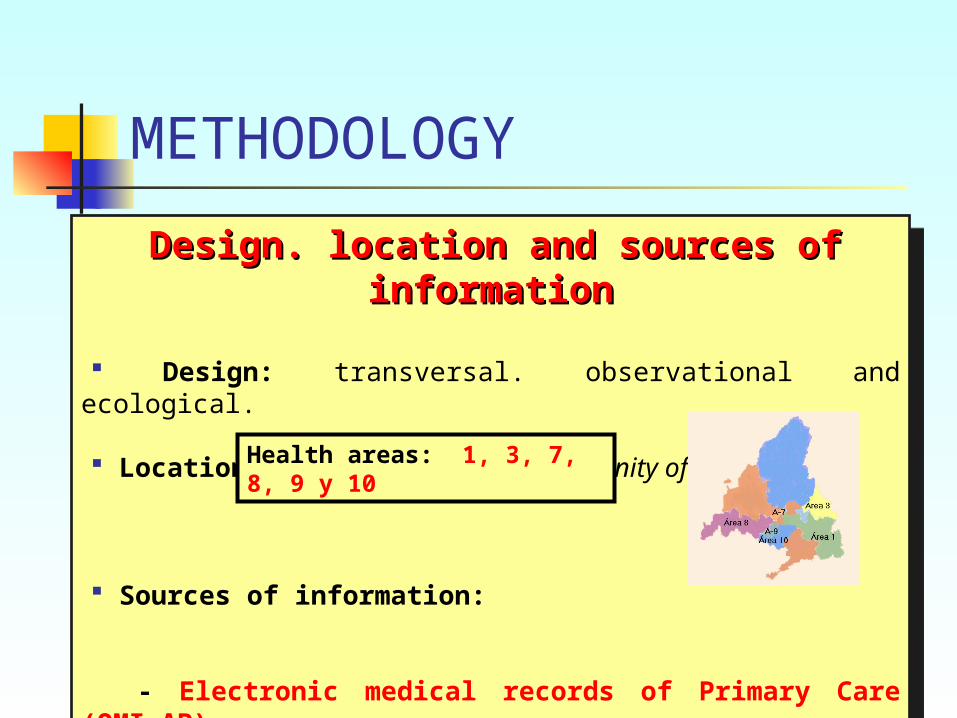
Design: transversal. observational and ecological.
Location: 6 health areas in the Community of Madrid.
Sources of information:
- Electronic medical records of Primary Care (OMI-AP).
- Institute of Statistics of the Community of Madrid.
Design. location and sources of Design. location and sources of informationinformation
Design: transversal. observational and ecological.
Location: 6 health areas in the Community of Madrid.
Sources of information:
- Electronic medical records of Primary Care (OMI-AP).
- Institute of Statistics of the Community of Madrid.
Health areas: 1, 3, 7, 8, 9 y 10
METHODOLOGY
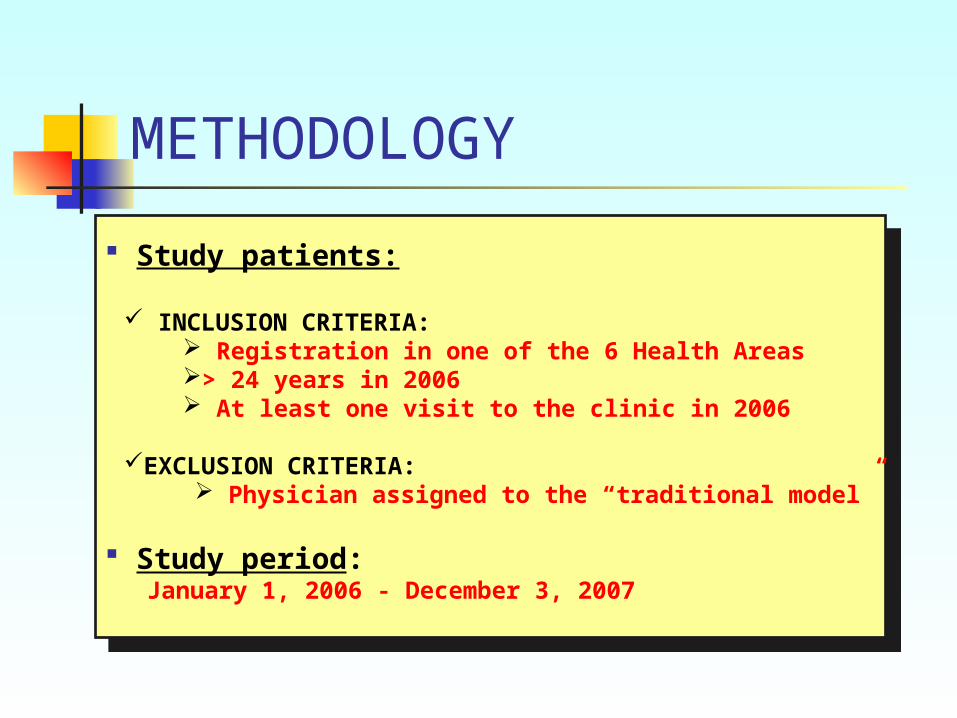
Study patients:
INCLUSION CRITERIA: Registration in one of the 6 Health Areas> 24 years in 2006 At least one visit to the clinic in 2006
EXCLUSION CRITERIA: Physician assigned to the “traditional model”
Study period:January 1, 2006 - December 3, 2007
Study patients:
INCLUSION CRITERIA: Registration in one of the 6 Health Areas> 24 years in 2006 At least one visit to the clinic in 2006
EXCLUSION CRITERIA: Physician assigned to the “traditional model”
Study period:January 1, 2006 - December 3, 2007
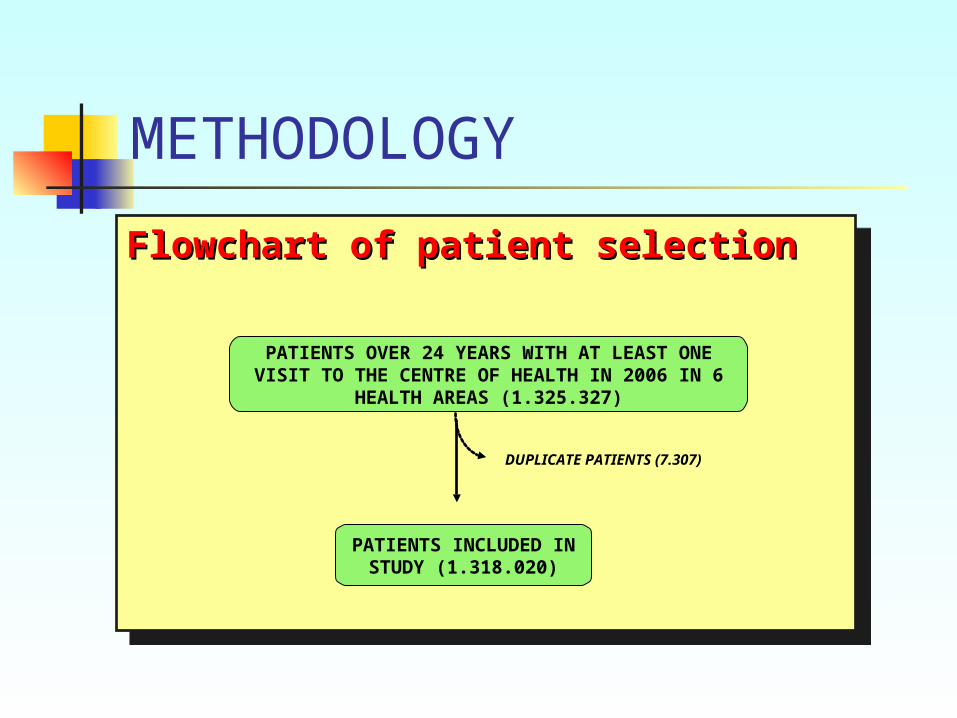
Flowchart of patient selectionFlowchart of patient selectionFlowchart of patient selectionFlowchart of patient selection
PATIENTS OVER 24 YEARS WITH AT LEAST ONE VISIT TO THE CENTRE OF HEALTH IN 2006
IN 6 HEALTH AREAS (1.325.327)
PATIENTS INCLUDED IN STUDY (1.318.020)
DUPLICATE PATIENTS (7.307)
METHODOLOGY

METHODOLOGYPATIENT VARIABLES
Socio-demographic
1. Age2. Sex 3. Nationality4. User Type5. Social Problems
Morbidity
1. Diseases (CIAP-1)2. Temporary Disability3. Patient Overview4. Protocols5. Drugs prescribed
Use of Health Services
1. Total medical PC consultations (2006 and 2007).2. Total nursing PC consultations (2006 and 2007).3. Analytics4. Radiology tests5. Referrals to specialists
PRIMARY CARE TEAM VARIABLES
Organizational Characteristics and Health System Capacity
1. Location of the PCT2. Type of primary health care team3. Time schedule2. Average PC doctor workload3. Average PC nursing workload4. Percentage of patients aged ≥ 65 years of primary care team
Socioeconomic
1. Educational level of the Basic Health Zone (Population and Housing Census 2001 of the CM)2. Per capita Gross Disposable Income of the Basic Health Zone (Statistical Institute of the CM)

SOCIO-ECONOMIC DATA
Patient
Per Capita Gross Disposable Income in 2000 of the basic health area
SOCIO-ECONOMIC DATA
Patient
Per Capita Gross Disposable Income in 2000 of the basic health area
METHODOLOGY
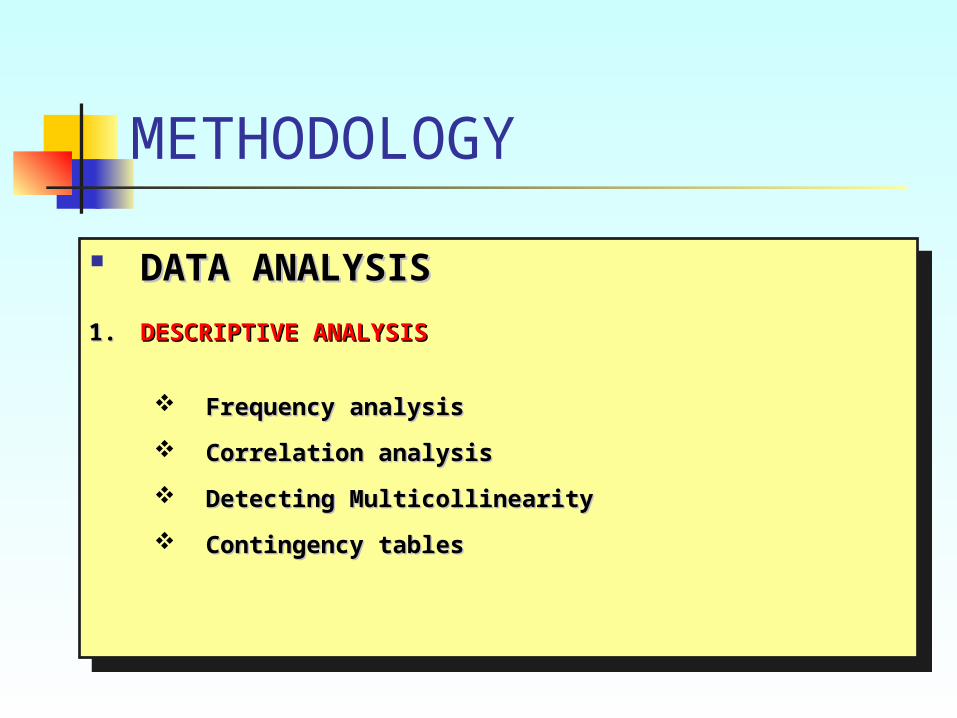
DATA ANALYSISDATA ANALYSIS
1.1. DESCRIPTIVE ANALYSISDESCRIPTIVE ANALYSIS
Frequency analysisFrequency analysis
Correlation analysisCorrelation analysis
Detecting MulticollinearityDetecting Multicollinearity
Contingency tables Contingency tables
DATA ANALYSISDATA ANALYSIS
1.1. DESCRIPTIVE ANALYSISDESCRIPTIVE ANALYSIS
Frequency analysisFrequency analysis
Correlation analysisCorrelation analysis
Detecting MulticollinearityDetecting Multicollinearity
Contingency tables Contingency tables
METHODOLOGY
DATA ANALYSISDATA ANALYSIS
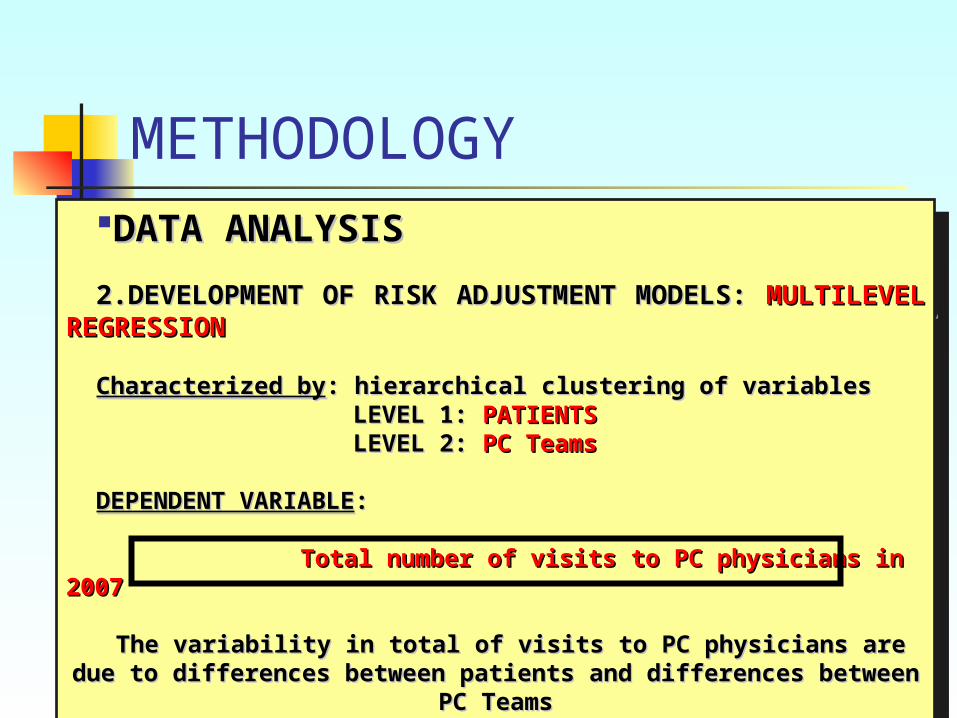
2.2.DEVELOPMENT OF RISK ADJUSTMENT MODELS: DEVELOPMENT OF RISK ADJUSTMENT MODELS: MULTILEVEL REGRESSIONMULTILEVEL REGRESSION
Characterized byCharacterized by: hierarchical clustering of variables: hierarchical clustering of variablesLEVEL 1: LEVEL 1: PATIENTSPATIENTSLEVEL 2: LEVEL 2: PC Teams PC Teams
DEPENDENT VARIABLEDEPENDENT VARIABLE: :
Total number of visits to PC physicians in 2007 Total number of visits to PC physicians in 2007
The variability in total of visits to PC physicians are due to differences The variability in total of visits to PC physicians are due to differences between patients and differences between PC Teamsbetween patients and differences between PC Teams
DATA ANALYSISDATA ANALYSIS
2.2.DEVELOPMENT OF RISK ADJUSTMENT MODELS: DEVELOPMENT OF RISK ADJUSTMENT MODELS: MULTILEVEL REGRESSIONMULTILEVEL REGRESSION
Characterized byCharacterized by: hierarchical clustering of variables: hierarchical clustering of variablesLEVEL 1: LEVEL 1: PATIENTSPATIENTSLEVEL 2: LEVEL 2: PC Teams PC Teams
DEPENDENT VARIABLEDEPENDENT VARIABLE: :
Total number of visits to PC physicians in 2007 Total number of visits to PC physicians in 2007
The variability in total of visits to PC physicians are due to differences The variability in total of visits to PC physicians are due to differences between patients and differences between PC Teamsbetween patients and differences between PC Teams
METHODOLOGY

MULTILEVEL MODEL:MULTILEVEL MODEL:
INDEPENDENT VARIABLES OF PATIENTINDEPENDENT VARIABLES OF PATIENT
MULTILEVEL MODEL:MULTILEVEL MODEL:
INDEPENDENT VARIABLES OF PATIENTINDEPENDENT VARIABLES OF PATIENT
METHODOLOGY
METHODOLOGYSociodemográficas1. Edad 2. Sexo 3. Problemas Sociales
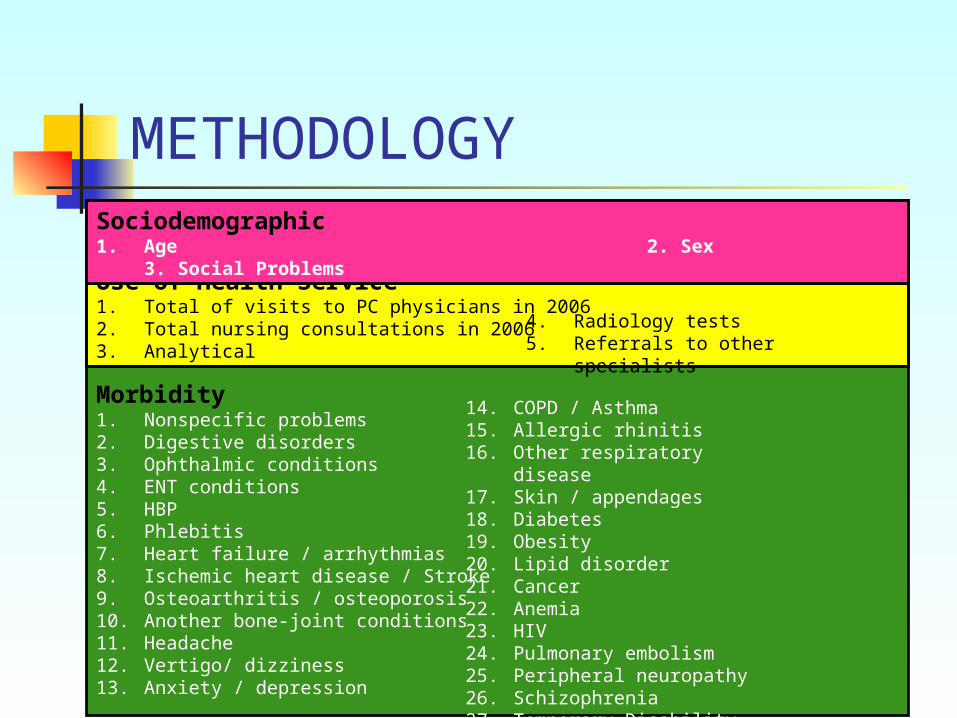
Use of Health Service1. Total of visits to PC physicians in 2006 2. Total nursing consultations in 20063. Analytical
4. Radiology tests5. Referrals to other specialists
Sociodemográficas1. Edad 2. Sexo 3. Problemas Sociales
Use of Health Service1. Total of visits to PC physicians in 2006 2. Total nursing consultations in 20063. Analytical
4. Radiology tests5. Referrals to other specialists
Sociodemográficas1. Edad 2. Sexo 3. Problemas SocialesSociodemographic1. Age 2. Sex 3. Social Problems
Morbidity1. Nonspecific problems2. Digestive disorders3. Ophthalmic conditions4. ENT conditions5. HBP6. Phlebitis7. Heart failure / arrhythmias8. Ischemic heart disease / Stroke9. Osteoarthritis / osteoporosis10. Another bone-joint conditions11. Headache12. Vertigo/ dizziness 13. Anxiety / depression
14. COPD / Asthma15. Allergic rhinitis16. Other respiratory disease17. Skin / appendages18. Diabetes19. Obesity20. Lipid disorder21. Cancer22. Anemia23. HIV24. Pulmonary embolism25. Peripheral neuropathy26. Schizophrenia27. Temporary Disability
MULTILEVEL MODEL :MULTILEVEL MODEL :
INDEPENDENT VARIABLES OF PC TeamINDEPENDENT VARIABLES OF PC Team
MULTILEVEL MODEL :MULTILEVEL MODEL :
INDEPENDENT VARIABLES OF PC TeamINDEPENDENT VARIABLES OF PC Team
METHODOLOGY
Características y Capacidad Organizativa del Sistema Sanitario
1. Tipo de EAP: Rural/ Urbano 2. Turno del EAP: Mañana y Tarde/ Mañana o Tarde 3. PAMED 4. PAENF5. % de pacientes con edad ≥ 65 años del EAP
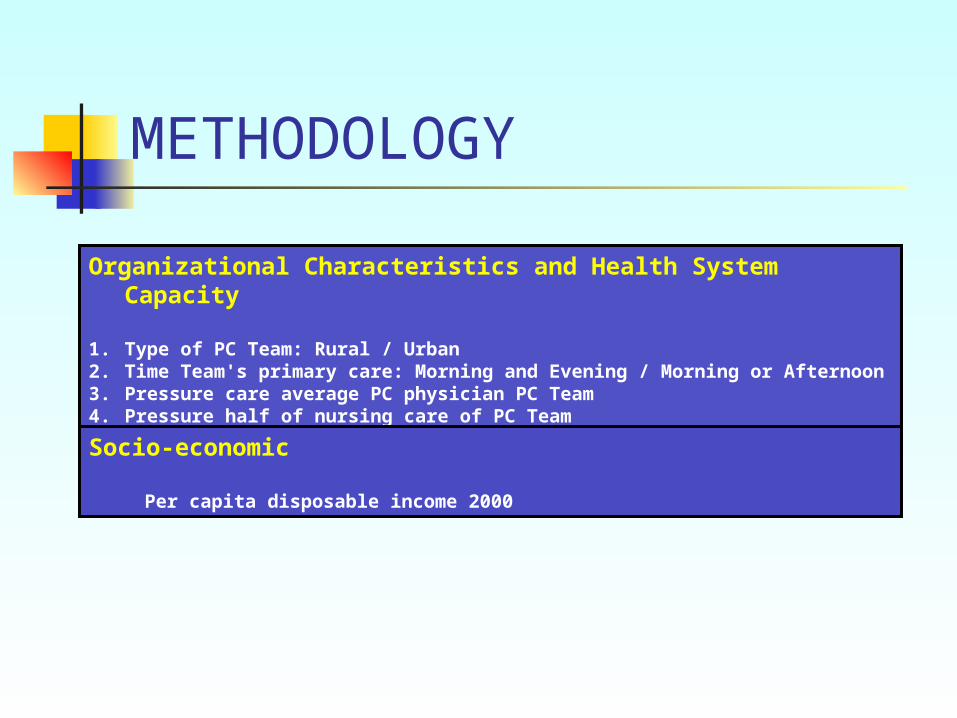
Organizational Characteristics and Health System Capacity
1. Type of PC Team: Rural / Urban2. Time Team's primary care: Morning and Evening / Morning or Afternoon3. Pressure care average PC physician PC Team4. Pressure half of nursing care of PC Team5. % of patients aged ≥ 65 years of PC Team
Socio-economic
Per capita disposable income 2000
METHODOLOGY
DATA ANALYSISDATA ANALYSIS
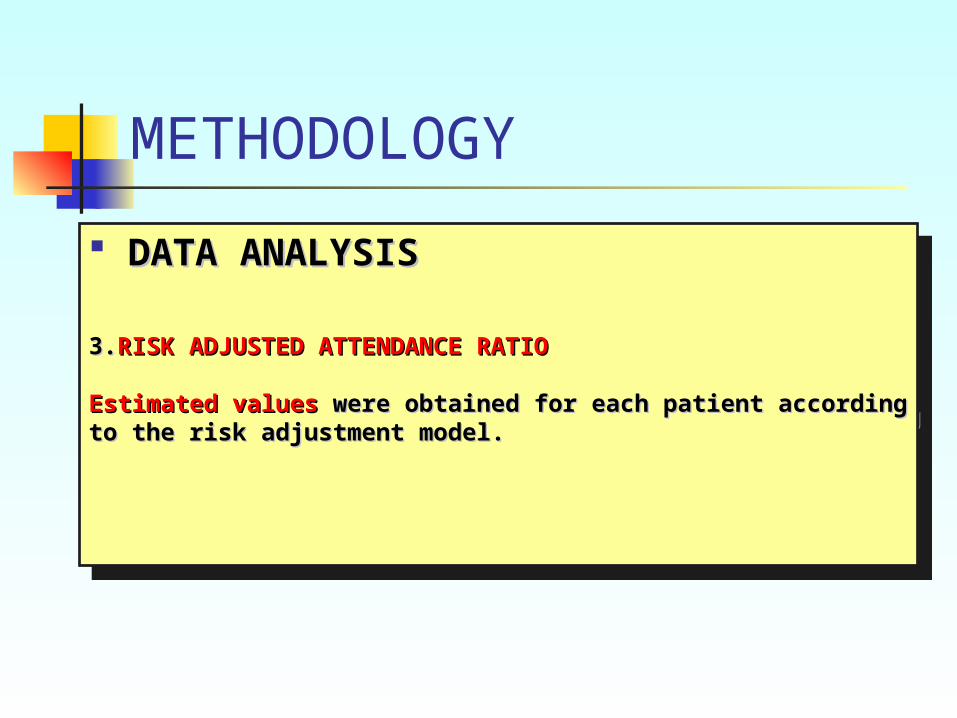
3.3.RISK ADJUSTED ATTENDANCE RATIORISK ADJUSTED ATTENDANCE RATIO
Estimated valuesEstimated values were obtained for each patient according were obtained for each patient according to the risk adjustment modelto the risk adjustment model..
DATA ANALYSISDATA ANALYSIS
3.3.RISK ADJUSTED ATTENDANCE RATIORISK ADJUSTED ATTENDANCE RATIO
Estimated valuesEstimated values were obtained for each patient according were obtained for each patient according to the risk adjustment modelto the risk adjustment model..
METHODOLOGY
DATA ANALYSISDATA ANALYSIS
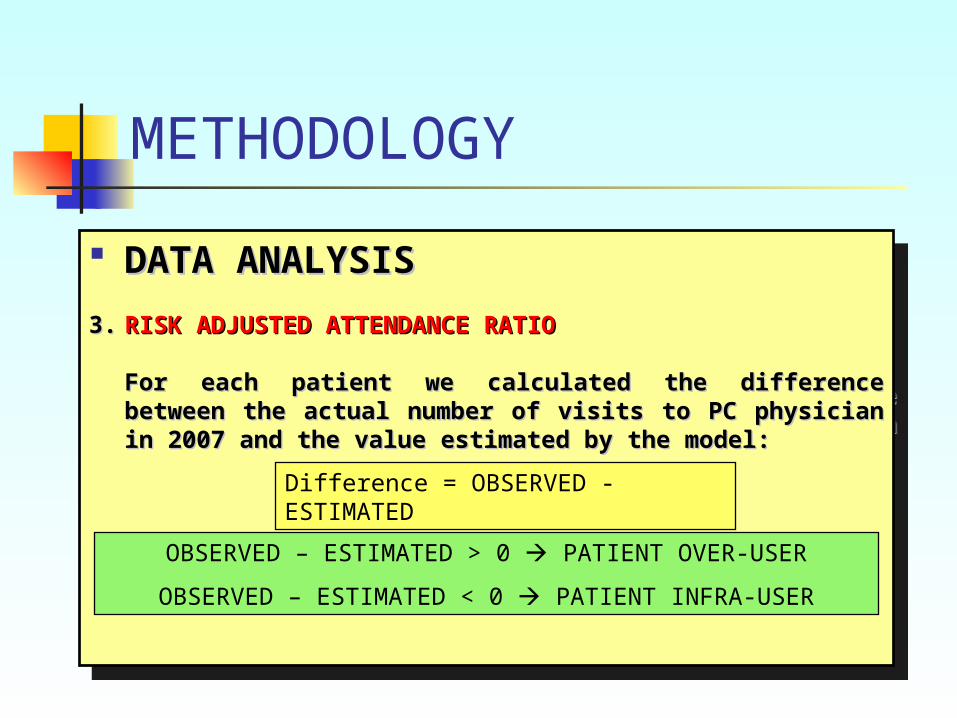
3.3. RISK ADJUSTED ATTENDANCE RATIORISK ADJUSTED ATTENDANCE RATIO
For each patient we calculated the difference between For each patient we calculated the difference between the actual number of visits to PC physician in 2007 and the actual number of visits to PC physician in 2007 and the value estimated by the model:the value estimated by the model:
DATA ANALYSISDATA ANALYSIS
3.3. RISK ADJUSTED ATTENDANCE RATIORISK ADJUSTED ATTENDANCE RATIO
For each patient we calculated the difference between For each patient we calculated the difference between the actual number of visits to PC physician in 2007 and the actual number of visits to PC physician in 2007 and the value estimated by the model:the value estimated by the model:
Difference = OBSERVED - ESTIMATED
OBSERVED – ESTIMATED > 0 PATIENT OVER-USER
OBSERVED – ESTIMATED < 0 PATIENT INFRA-USER
METHODOLOGY

DATA ANALYSISDATA ANALYSIS
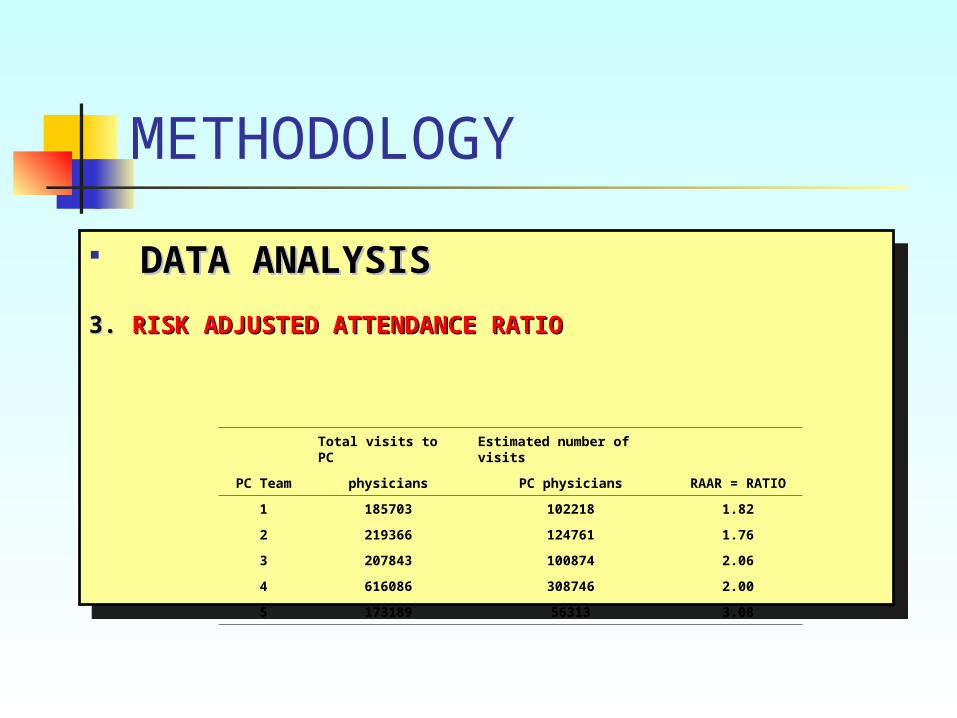
3.3. RISK ADJUSTED ATTENDANCE RATIO RISK ADJUSTED ATTENDANCE RATIO
This approach allowed to obtained the This approach allowed to obtained the observed/expeced number of visits observed/expeced number of visits for each PC Team. for each PC Team. The total number of visits to PC in 2007 of these The total number of visits to PC in 2007 of these patients and the estimated total number of patients and the estimated total number of consultations by the model.consultations by the model.
DATA ANALYSISDATA ANALYSIS
3.3. RISK ADJUSTED ATTENDANCE RATIO RISK ADJUSTED ATTENDANCE RATIO
This approach allowed to obtained the This approach allowed to obtained the observed/expeced number of visits observed/expeced number of visits for each PC Team. for each PC Team. The total number of visits to PC in 2007 of these The total number of visits to PC in 2007 of these patients and the estimated total number of patients and the estimated total number of consultations by the model.consultations by the model.
METHODOLOGY
PC Team
Total visits to PC Estimated number of visits
physicians PC physicians
1 185703 102218
2 219366 124761
3 207843 100874
4 616086 308746
5 173189 56313
DATA ANALYSISDATA ANALYSIS
3.3. RISK ADJUSTED ATTENDANCE RATIO RISK ADJUSTED ATTENDANCE RATIO
DATA ANALYSISDATA ANALYSIS
3.3. RISK ADJUSTED ATTENDANCE RATIO RISK ADJUSTED ATTENDANCE RATIO
METHODOLOGY
PC Team
Total visits to PC Estimated number of visits
RAAR = RATIOphysicians PC physicians
1 185703 102218 1.82
2 219366 124761 1.76
3 207843 100874 2.06
4 616086 308746 2.00
5 173189 56313 3.08
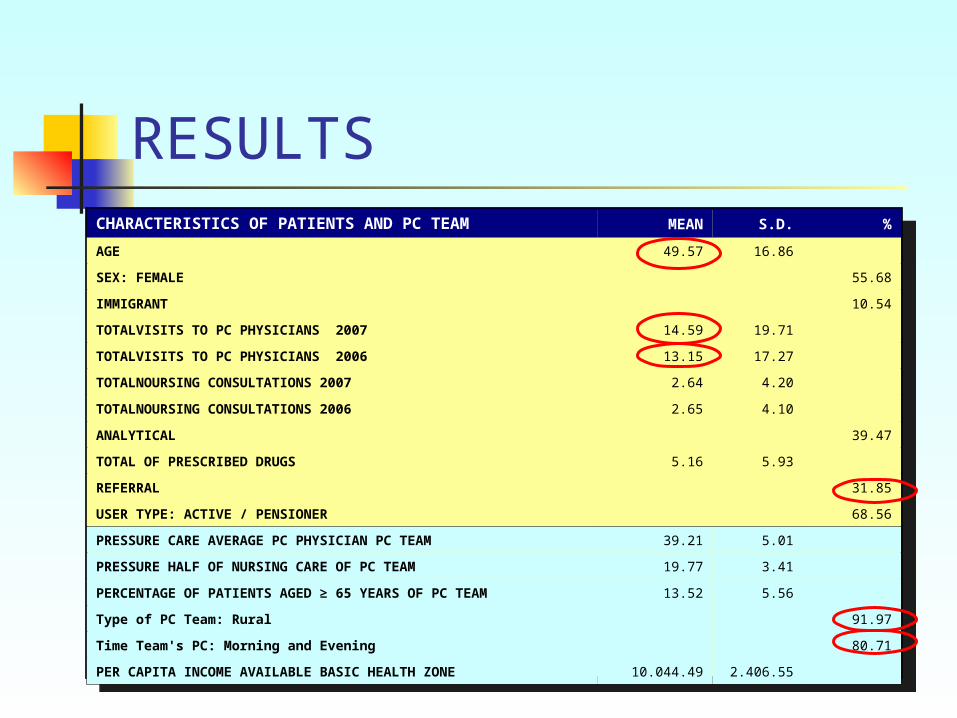
CHARACTERISTICS OF PATIENTS AND PC TEAM MEAN S.D. %
AGE 49.57 16.86
SEX: FEMALE 55.68
IMMIGRANT 10.54
TOTALVISITS TO PC PHYSICIANS 2007 14.59 19.71
TOTALVISITS TO PC PHYSICIANS 2006 13.15 17.27
TOTALNOURSING CONSULTATIONS 2007 2.64 4.20
TOTALNOURSING CONSULTATIONS 2006 2.65 4.10
ANALYTICAL 39.47
TOTAL OF PRESCRIBED DRUGS 5.16 5.93
REFERRAL 31.85
USER TYPE: ACTIVE / PENSIONER 68.56
PRESSURE CARE AVERAGE PC PHYSICIAN PC TEAM 39.21 5.01
PRESSURE HALF OF NURSING CARE OF PC TEAM 19.77 3.41
PERCENTAGE OF PATIENTS AGED ≥ 65 YEARS OF PC TEAM 13.52 5.56
Type of PC Team: Rural 91.97
Time Team's PC: Morning and Evening 80.71
PER CAPITA INCOME AVAILABLE BASIC HEALTH ZONE 10.044.49 2.406.55
RESULTS

VARIABLES Coeff. Z 95% CI
Age 0.01 104.35 0.01 0.01
Sex (Ref. Male) 0.12 72.52 0.11 0.12
Log Total visits to PC Physicians 2006 0.56 506.85 0.56 0.57
Log Total Noursing Consultations 2006 0.03 30.25 0.03 0.04
Analytical (Ref. No) 0.14 65.32 0.13 0.14
Radiology tests (Ref. No) 0.13 61.10 0.12 0.13
Nonspecific problems (Ref. No) 0.01 3.04 0.00 0.01
Digestive disorders (Ref. No) 0.07 38.73 0.06 0.07
Ophthalmic Pathology (Ref. No) 0.02 12.98 0.02 0.03
ORL Pathology (Re. No) 0.01 6.15 0.01 0.02
HBP (Ref. No) 0.03 14.68 0.03 0.04
Phlebitis (Ref. No) 0.03 12.51 0.03 0.04
Heart failure / arrhythmias (Ref. No) 0.05 11.41 0.04 0.06
Ischemic heart disease / Stroke (Ref. No)
0.0615.88
0.05 0.07
RESULTS
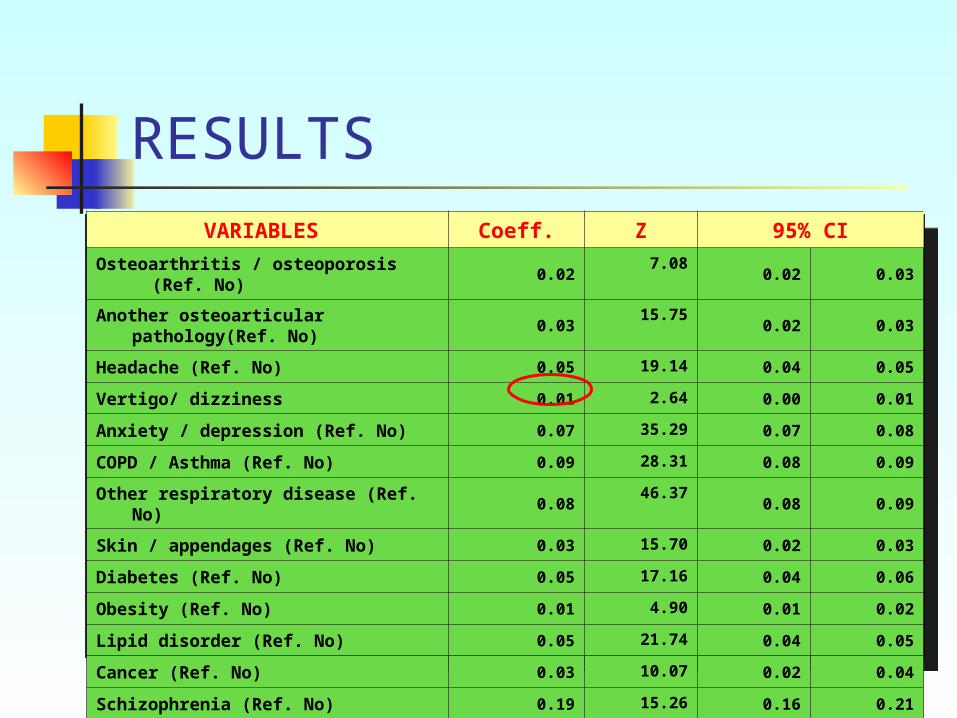
VARIABLES Coeff. Z 95% CI
Osteoarthritis / osteoporosis (Ref. No)
0.027.08
0.02 0.03
Another osteoarticular pathology(Ref. No)
0.0315.75
0.02 0.03
Headache (Ref. No) 0.05 19.14 0.04 0.05
Vertigo/ dizziness 0.01 2.64 0.00 0.01
Anxiety / depression (Ref. No) 0.07 35.29 0.07 0.08
COPD / Asthma (Ref. No) 0.09 28.31 0.08 0.09
Other respiratory disease (Ref. No) 0.08 46.37 0.08 0.09
Skin / appendages (Ref. No) 0.03 15.70 0.02 0.03
Diabetes (Ref. No) 0.05 17.16 0.04 0.06
Obesity (Ref. No) 0.01 4.90 0.01 0.02
Lipid disorder (Ref. No) 0.05 21.74 0.04 0.05
Cancer (Ref. No) 0.03 10.07 0.02 0.04
Schizophrenia (Ref. No) 0.19 15.26 0.16 0.21
RESULTS

COEFFICIENT
STANDARD ERROR
LOG-LIKELIHOOD -1186575.2
Variability between PC Teams
0.29 0.0198
Variability between patients
0.78 0.0005
ICC 12.6% 0.0148
VARIABLES Coeff
.Z 95% CI
Type of PC Team (Ref. Rural) -0.21 -2.27 -0.39 -0.03
Pressure Half of Nursing Care of PC Team
0.022.57
0.00 0.04
3 Income categories (Ref. Low)
Intermediate -0.04 -0.49 -0.18 0.11
High/ Very High -0.18 -2.72 -0.31 -0.05
RESULTS

53% of patients visits their primary care physician more 53% of patients visits their primary care physician more than estimated according to their riskthan estimated according to their risk..
40% visits less primary care physicians than expected.40% visits less primary care physicians than expected.
RESULTS
PATIENT
OVER-USER 53%
INFRA-USER 40%
n= 1,017,002
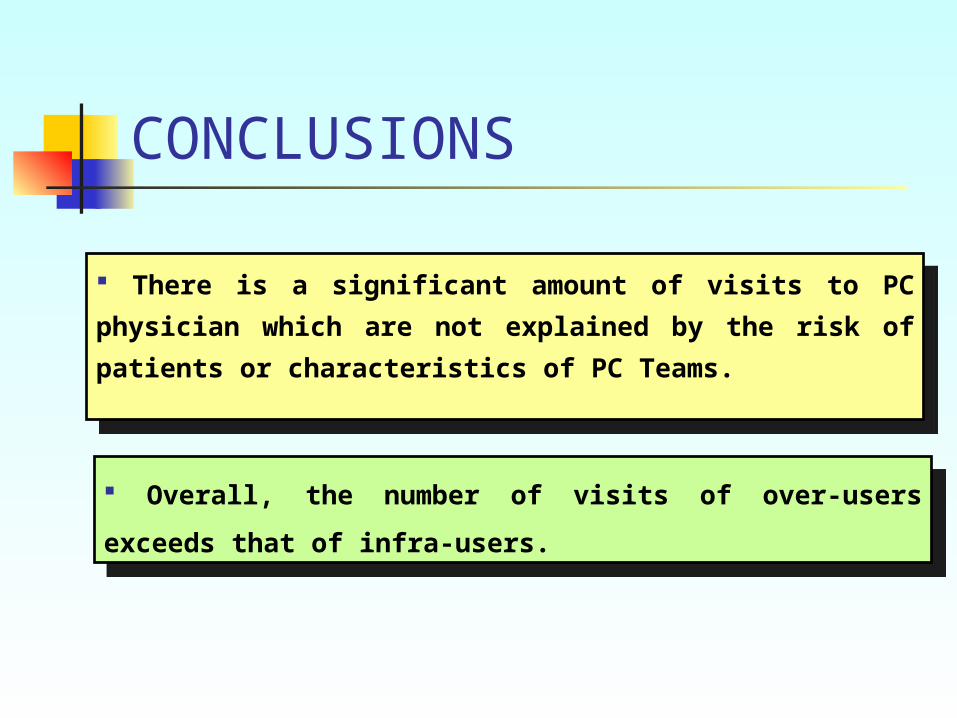
There is a significant amount of visits to PC
physician which are not explained by the risk of
patients or characteristics of PC Teams.
There is a significant amount of visits to PC
physician which are not explained by the risk of
patients or characteristics of PC Teams.
Overall, the number of visits of over-users exceeds
that of infra-users.
Overall, the number of visits of over-users exceeds
that of infra-users.
CONCLUSIONS

THANK YOUTHANK YOU


![Forecasting event attendance with anonymized mobile phone data · 25, 46]. Moreover, predictive modeling has been mainly limited to tra c prediction and mobile network management.](https://static.fdocuments.in/doc/165x107/5f973b2bc330ce3ab11fb655/forecasting-event-attendance-with-anonymized-mobile-phone-data-25-46-moreover.jpg)