Predictive Mapping GMAC - Wigan 2011 Ian Bullen – Strategic Analytical Partnership Co-ordinator 9...
14
Predictive Mapping GMAC - Wigan 2011 Ian Bullen – Strategic Analytical Partnership Co-ordinator 9 th November 2011 Wigan Strategic Assessment
-
Upload
jamir-fenty -
Category
Documents
-
view
219 -
download
1
Transcript of Predictive Mapping GMAC - Wigan 2011 Ian Bullen – Strategic Analytical Partnership Co-ordinator 9...

Predictive MappingGMAC - Wigan 2011
Ian Bullen – Strategic Analytical Partnership Co-ordinator 9th November 2011
Wigan Strategic Assessment

“Prediction is very difficult, especially if it’s about the
future.”
Nils Bohr, Nobel laureate in Physics

Predictive Mapping
• First advanced in 2004 (Johnson et al)• Increased risk within 400m for 6/7 weeks• Local view in 2005/6 = not useful – 400m from any
Burglary in Leigh covers all of Leigh• Utilised in Trafford & linked to 25% reduction in
Burglary Dwelling• Let’s have another look…• But… “the implementation of a strategy for which
every burgled household and neighbours within 400m received crime reduction attention would require substantial resources…” (Johnson et al, 2006, Home Office)

The Changing Face of Near Repeats…
• Initial research based on 2003/4 data
• Wigan BD in 2003/4 = 2,813
• Wigan BD in 2010/1 = 1,266
• 55% reduction• Repeats and Near
Repeats also likely to have reduced
All Areas 2002
0
1
2
3
4
5
6
7
within1 week
within2
weeks
within3
weeks
within4
weeks
within5
weeks
within6
weeks
within7
weeks
within8
weeks
within9
weeks
within10
weeks
within11
weeks
within12
weeks
2002 L 1
2002 L 2
2002 L 3
2002 L 4
2002 L 5
AL L
All Areas 2010
0
1
2
3
4
5
6
7
within1 week
within2
weeks
within3
weeks
within4
weeks
within5
weeks
within6
weeks
within7
weeks
within8
weeks
within9
weeks
within10
weeks
within11
weeks
within12
weeks
2010 L 1
2010 L 2
2010 L 3
2010 L 4
2010 L 5
2010 A L L
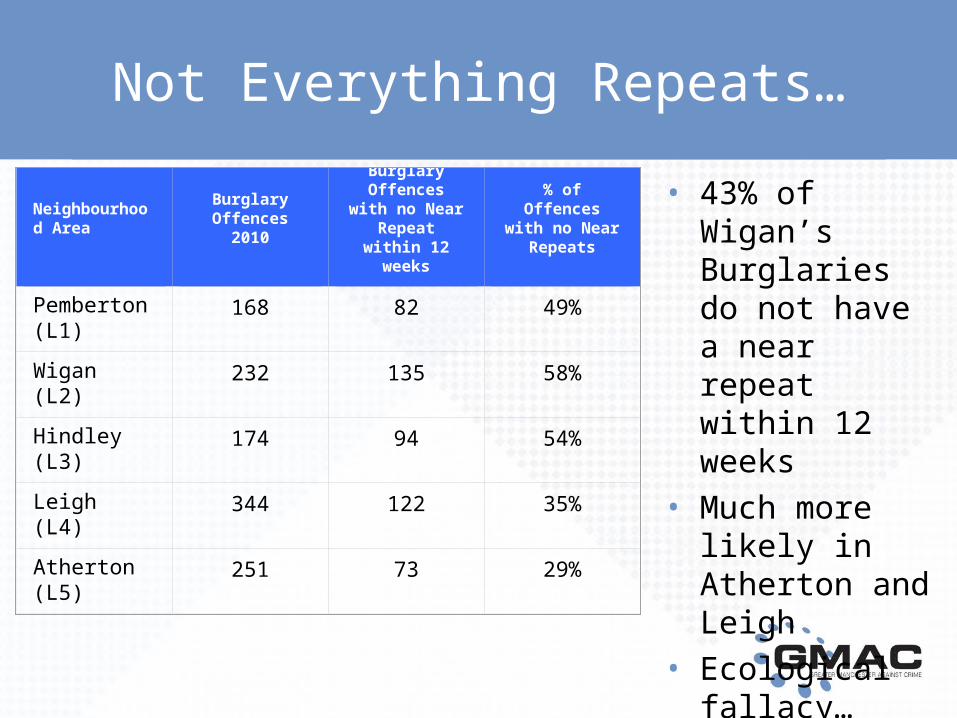
Not Everything Repeats…
• 43% of Wigan’s Burglaries do not have a near repeat within 12 weeks
• Much more likely in Atherton and Leigh
• Ecological fallacy…
Neighbourhood Area
Burglary Offences 2010
Burglary Offences with
no Near Repeat within 12 weeks
% of Offences with no Near
Repeats
Pemberton (L1)
168 82 49%
Wigan (L2) 232 135 58%
Hindley (L3) 174 94 54%
Leigh (L4) 344 122 35%
Atherton (L5)
251 73 29%
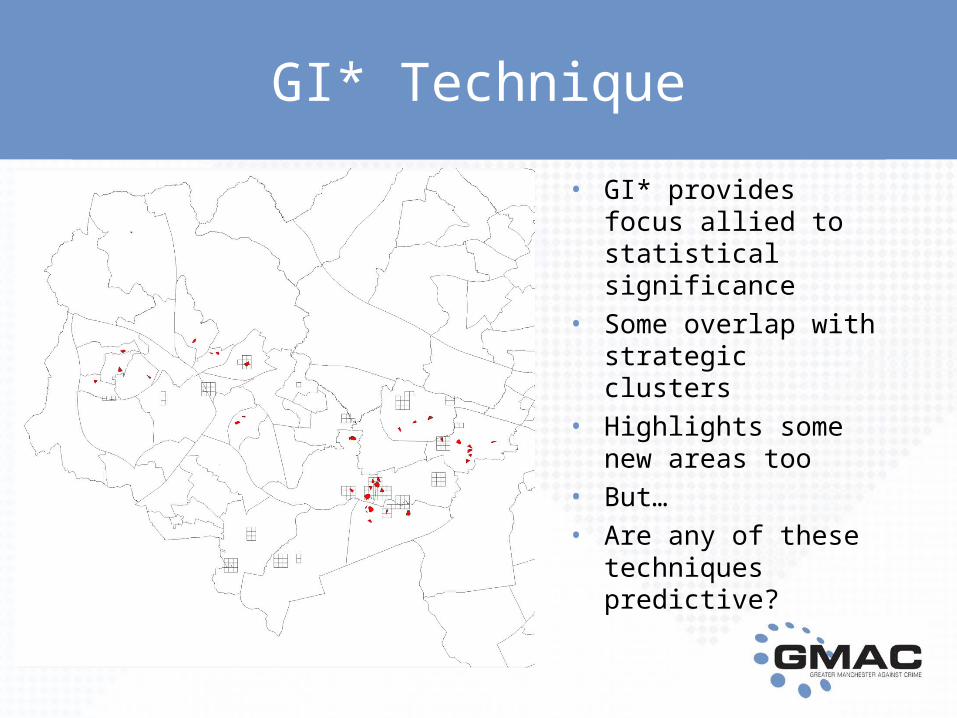
GI* Technique
• GI* provides focus allied to statistical significance
• Some overlap with strategic clusters
• Highlights some new areas too
• But…• Are any of these
techniques predictive?
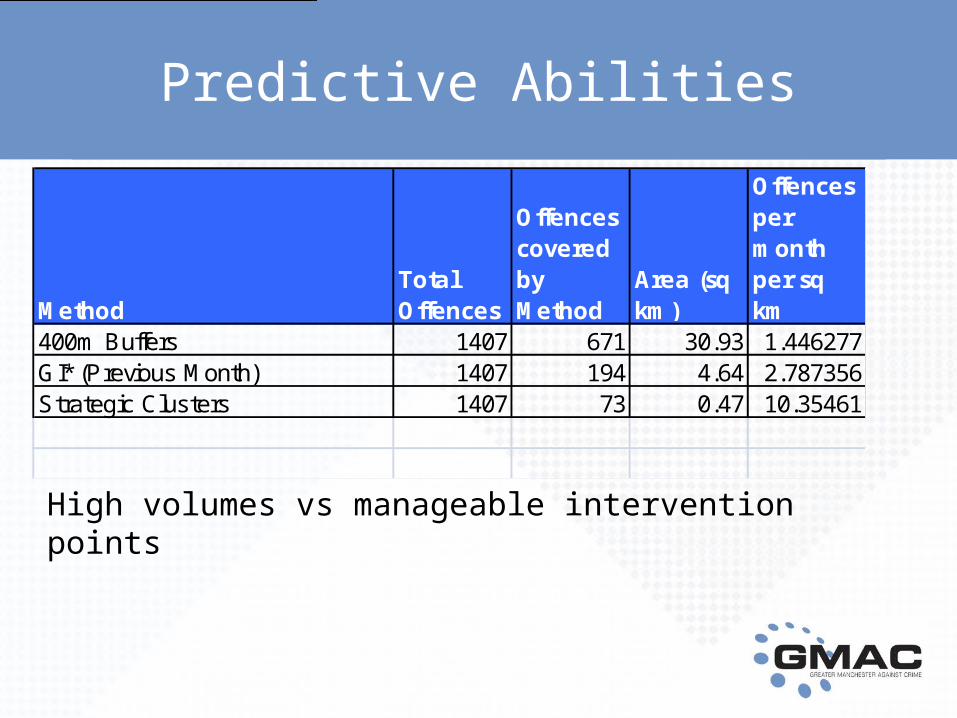
Predictive Abilities
MethodTotal Offences
Offences covered by Method
Area (sq km)
Offences per month per sq km
400m Buffers 1407 671 30.93 1.446277GI* (Previous Month) 1407 194 4.64 2.787356Strategic Clusters 1407 73 0.47 10.35461
High volumes vs manageable intervention points
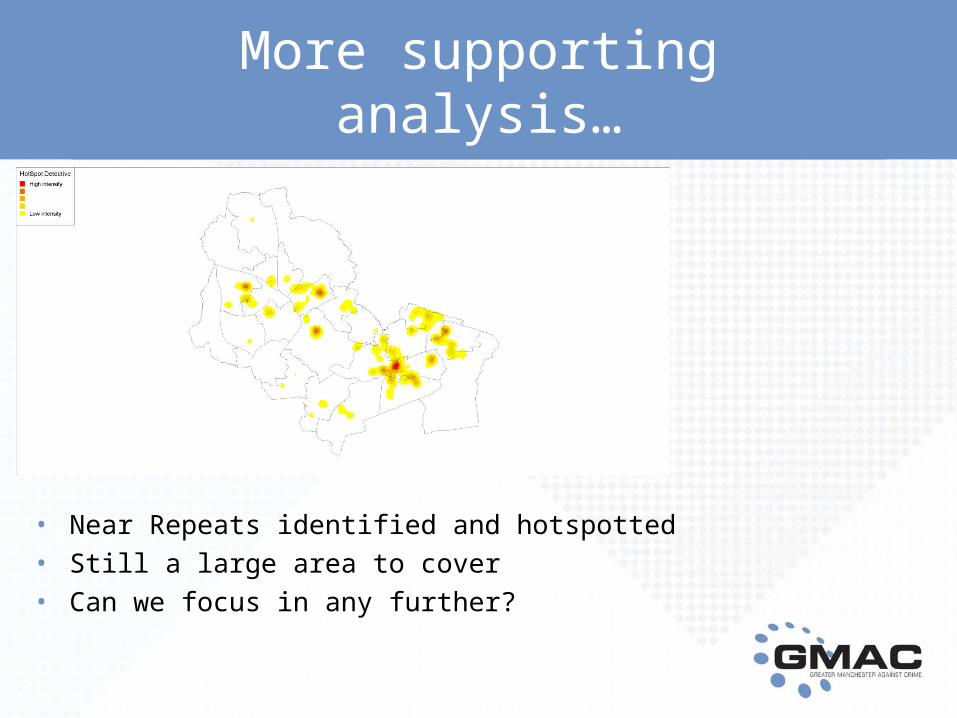
More supporting analysis…
• Near Repeats identified and hotspotted• Still a large area to cover• Can we focus in any further?
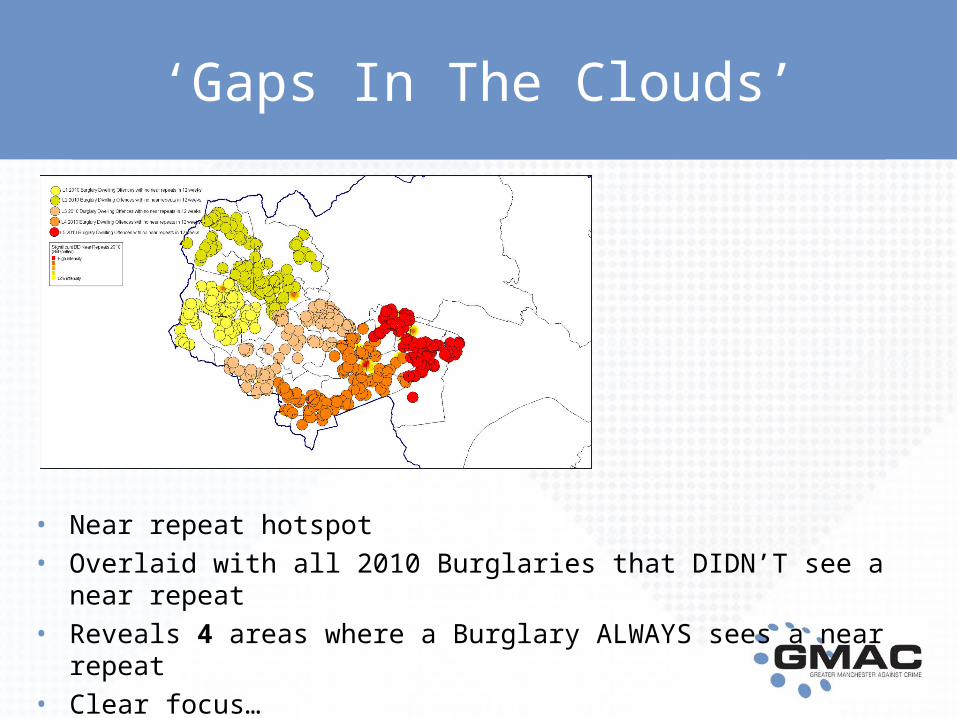
‘Gaps In The Clouds’
• Near repeat hotspot• Overlaid with all 2010 Burglaries that DIDN’T see a near repeat• Reveals 4 areas where a Burglary ALWAYS sees a near repeat• Clear focus…

• Near Repeat hotspots + Analyse2Advance Clusters + GI* grids
• All 4 Near Repeat hotspots contain Analyse2Advance Clusters
• Significant grids on top of Analyse2Advance Clusters on top of Near Repeat hotspots = top priority
• Refresh GI* weekly to keep live – tactical analysis underpinned by Strategic analysis
Stacking up the Evidence

• Local picture in Leigh
Stacking up the Evidence

A Combined Approach
• Hierarchy of risk based on crimes falling into • GI* grids• Strategic clusters• Near repeat hotspots
• Identify offenders living/operating within area and target (linked to IOM work)
• Offences outside these areas should be prioritised after this but based on local knowledge of Near Repeats:– Pemberton - <300m <7days emphasis on day 1– Wigan - <300m <7 days– Hindley – no near repeat evidence– Leigh – <300m <1 day– Atherton - <200m <7 days emphasis on day 3
Current Picture
• Initial pilot exercise running since 24/10/2011• 40% strike rate – importantly, in a manageable area• Number of arrests in identified areas• Monitoring patrol locations via dip sampling• Offender element to be added in soon• Partnership approach to be developed• Works with other thematic areas – TFMV, FDR3s
Predictive MappingGMAC - Wigan 2011
Ian Bullen – Strategic Analytical Partnership Co-ordinator 9th November 2011
Wigan Strategic Assessment