Predictive Engineering Tools for Injection-Molded Long ... · PDF fileComposite Structures,...
46
PNNL-25440 Ba Nghiep Nguyen, Leonard S. Fifield Pacific Northwest National Laboratory, Richland, WA 99354 Jin Wang, Franco Costa Autodesk, Inc., Ithaca, NY 14850 Gregory Lambert, Donald G. Baird Virginia Polytechnic and State University, Blacksburg, Virginia 24061 Bhisham N. Sharma, Seth A. Kijewski, Michael D. Sangid Purdue University, West Lafayette, IN 47907 Umesh N. Gandhi Toyota Research Institute North America, Ann Arbor, MI 48105 Eric J. Wollan, Dale Roland PlastiComp, Inc., Winona, MN 55987 Steven Mori Magna Exteriors and Interiors Corporation, Aurora, Ontario, Canada Charles L. Tucker III University of Illinois at Urbana-Champaign, Urbana, IL 61801 Project period: October 1 st 2012 to September 30 th , 2016 Topical report submitted to: Aaron Yocum, National Energy Technology Laboratory, Morgantown, WV 26507 Predictive Engineering Tools for Injection-Molded Long-Carbon-Fiber Thermoplastic Composites June 2016
Transcript of Predictive Engineering Tools for Injection-Molded Long ... · PDF fileComposite Structures,...

PNNL-25440
Ba Nghiep Nguyen, Leonard S. Fifield Pacific Northwest National Laboratory, Richland, WA 99354
Jin Wang, Franco Costa Autodesk, Inc., Ithaca, NY 14850
Gregory Lambert, Donald G. Baird Virginia Polytechnic and State University, Blacksburg, Virginia 24061
Bhisham N. Sharma, Seth A. Kijewski, Michael D. Sangid Purdue University, West Lafayette, IN 47907
Umesh N. Gandhi Toyota Research Institute North America, Ann Arbor, MI 48105
Eric J. Wollan, Dale Roland PlastiComp, Inc., Winona, MN 55987
Steven Mori Magna Exteriors and Interiors Corporation, Aurora, Ontario, Canada
Charles L. Tucker III University of Illinois at Urbana-Champaign, Urbana, IL 61801
Project period: October 1st 2012 to September 30th, 2016
Topical report submitted to:
Aaron Yocum, National Energy Technology Laboratory, Morgantown, WV 26507
Predictive Engineering Tools for Injection-Molded Long-Carbon-Fiber Thermoplastic Composites
June 2016

PNNL-25440
1

PNNL-25440
2
Predictive Engineering Tools for Injection-Molded Long-Carbon-Fiber Thermoplastic
Composites Ba Nghiep Nguyen, Leonard S. Fifield Pacific Northwest National Laboratory, Richland, WA 99354
Jin Wang, Franco Costa Autodesk, Inc., Ithaca, NY 14850
Gregory Lambert, Donald G. Baird Virginia Polytechnic and State University, Blacksburg, Virginia 24061
Bhisham N. Sharma, Seth A. Kijewski, Michael D. Sangid Purdue University, West Lafayette, IN 47907
Umesh N. Gandhi Toyota Research Institute North America, Ann Arbor, MI 48105
Eric J. Wollan, Dale Roland PlastiComp, Inc., Winona, MN 55987
Steven Mori Magna Exteriors and Interiors Corporation, Aurora, Ontario, Canada
Charles L. Tucker III University of Illinois at Urbana-Champaign, Urbana, IL 61801 June 2016 Project period: October 1st 2012 to September 30th, 2016 Topical report submitted to: Aaron Yocum, National Energy Technology Laboratory, Morgantown, WV 26507 Prepared for the U.S. Department of Energy under Contract DE-AC05-76RL01830 Pacific Northwest National Laboratory Richland, Washington 99352

PNNL-25440
3
Executive Summary This project aimed to integrate, optimize, and validate the fiber orientation and length distribution models previously developed and implemented in the Autodesk® Simulation Moldflow® Insight (ASMI) software package for injection-molded long-carbon-fiber (LCF) thermoplastic composite structures. The project was organized into two phases: Phase 1 demonstrated the ability of the advanced ASMI package to predict fiber orientation and length distributions in LCF/polypropylene (PP) and LCF/polyamide-6,6 (PA66) plaques within 15% of experimental results. Phase 2 validated the advanced ASMI package by predicting fiber orientation and length distributions within 15% of experimental results for a complex three-dimensional (3D) Toyota automotive part injection-molded from LCF/PP and LCF/PA66 materials. Work under Phase 2 also included estimate of weight savings and cost impacts for a vehicle system using ASMI predictions and structural analyses of the complex part. The present report summarizes the completion of Phases 1 and 2 work activities and accomplishments achieved by the team comprising Pacific Northwest National Laboratory (PNNL); Purdue University (Purdue); Virginia Polytechnic Institute and State University (Virginia Tech); Autodesk, Inc. (Autodesk); PlastiComp, Inc. (PlastiComp); Toyota Research Institute North America (Toyota); Magna Exteriors and Interiors Corp. (Magna); and University of Illinois. Figure 1 illustrates the technical approach adopted in this project that progressed from compounding LCF/PP and LCF/PA66 materials, to process model improvement and implementation, to molding and modeling LCF/PP and LCF/PA66 plaques. The lessons learned from the plaque study and the validation of improved process models for fiber orientation and length distributions for these plaques enabled the project to go to Phase 2 and demonstrate successful molding, modeling, and optimization of the 3D complex part.
Figure 1. Schematic picture illustrating the technical approach to integrate and validate the tools for designing injection-molded LCF thermoplastic automotive structures.

PNNL-25440
4
1. Objective
The objective of this project was to advance predictive engineering (PE) tools to accurately predict fiber orientation and length distributions in injection-molded long-carbon fiber thermoplastic composites for optimum design of automotive structures using these materials to meet weight and cost reduction requirements defined in Table 2 of DE-FOA-0000648 (Area of Interest 1) [1]. 2. Background
This project proposed to integrate, optimize and validate the fiber orientation and length distribution models previously developed and implemented in the ASMI package for injection-molded long-carbon-fiber thermoplastic composites into a cohesive prediction capability. In our previous U.S. Department of Energy (DOE) funded project, entitled “Engineering Property Prediction Tools for Tailored Polymer Composite Structures,” PNNL, with the University of Illinois and Autodesk, developed a unique assembly of computational algorithms. These algorithms provided state-of-the-art process and constitutive models to enhance the capabilities of commercial software packages to predict fiber orientation and length distributions as well as subsequent mechanical properties of injection-molded long-fiber thermoplastic (LFT) composites. The predictive capabilities had been validated using fiber analysis data generated at Oak Ridge National Laboratory on two-dimensional (2D) structures consisting of edge-gated plaques and center-gated disks injection-molded from long-glass-fiber (LGF)/PP and LGF/PA66 pellets. This effort focused on rendering the developed models more robust and efficient for automotive industry part design to enable weight savings and cost reduction. The project goal has been achieved by optimizing the developed models, improving and integrating their implementations in ASMI, and validating them for a complex 3D LCF thermoplastic automotive part. Both PP and PA66 were used as resin matrices. Local fiber orientation and length distributions at key regions in the part were measured for model validation based on a 15% accuracy criterion. The project outcome is the enhanced ASMI package with computational capabilities that accurately predict fiber orientation and length distributions in long-carbon fiber thermoplastic automotive parts.
3. Accomplishment Highlights
The accomplishments by the team members were reported in detail in quarterly reports [2-12]. In this topical report, a succinct summary of the accomplishments is provided. The accomplishments achieved under Phase 1 are the following:
PNNL established a Cooperative Research and Development Agreement (CRADA) with Autodesk, Toyota and Magna, and subcontracts with Purdue, PlastiComp, and University of Illinois enabling the technical start of the project on November 1st, 2013.
PlastiComp compounded LCF/PP and LCF/PA66 materials having 30 wt% and 50 wt% fiber loadings and molded centered and edge-gated plaques from these materials using the conventional long-carbon-fiber injection molding and the PlastiComp Pushtrusion® in-line direct-injection long-fiber molding (D-LFT) processes.
Autodesk characterized the rheological, thermal and mechanical properties of 30 wt% and 50 wt% LCF/PP and LCF/PA66 compounds from PlastiComp and delivered the data to the project partners [13-16].
Autodesk improved and implemented advanced process models in ASMI for prediction of fiber orientation and length distributions.
Autodesk delivered research versions of ASMI to PNNL and provided PNNL with process modeling technical support.
PNNL cut coupons from plaques at selected locations for fiber orientation and length measurement.

PNNL-25440
5
Purdue performed fiber orientation measurements for the PlastiComp plaque coupons.
With PNNL assistance, Purdue conducted fiber length measurements for PlastiComp plaque coupons.
In discussion with Autodesk, PNNL completed ASMI analyses of the PlastiComp plaques selected for the Go/No-go decision point to predict flow-induced fiber orientation (FOD) and fiber length distributions (FLD) in these plaques. The predicted FODs and FLDs at the selected locations on the plaques were validated within 15% of the corresponding Purdue experimental results.
The University of Illinois assisted team members from Purdue with fiber orientation measurement techniques, including interpretation of off-axis cross sections.
The University of Illinois assisted Autodesk team members in software implementation of the proper-orthogonal decomposition (POD) approach for fiber length modeling, and in fiber orientation modeling.
In discussion with the team, PNNL conducted ASMI pre-analyses of the complex parts to assess part moldability and wall thickness.
PNNL established a plan with Toyota, Magna and PlastiComp for molding of the complex part.
The accomplishments achieved under Phase 2 include:
Magna and Toyota prepared a tool to mold the Toyota complex 3D ribbed and non-ribbed parts.
Magna molded the complex ribbed and non-ribbed parts from the 30 wt% LCF/PP and 30 wt% LCF/PA66 materials using the conventional LFT injection-molding process.
After molding, Magna cut coupons from the parts at selected locations and shipped these samples to Virginia Tech for fiber orientation and length measurement.
PlastiComp molded 30 wt% LCF/PP and 30 wt% LCF/PA66 ribbed and non-ribbed complex parts using the D-LFT process.
Autodesk further improved the implementation of process models in ASMI. Autodesk provided PNNL with ASMI research versions and technical support to perform process modeling of the complex ribbed and non-ribbed parts.
Virginia Tech completed fiber orientation measurements for the coupons from select locations of the 30 wt% LCF/PP and 30 wt% LCF/PA66 ribbed and non-ribbed complex parts, and delivered to PNNL all the fiber orientation data for validating ASMI fiber orientation predictions.
In discussion with the team, Virginia Tech completed fiber length measurement for the coupons taken at select locations from the 30 wt% LCF/PP and 30 wt% LCF/PA66 ribbed complex parts, and delivered to PNNL all the fiber length data including the data for nozzle purge materials to validate ASMI fiber length predictions.
In discussion with Autodesk, PNNL performed ASMI injection molding analyses of the complex ribbed and non-ribbed parts using the actual molding parameters to assess mold filling patterns and to validate fiber orientation predictions at the selected locations on the parts to within 15% of the Virginia Tech measured data.
In discussion with Autodesk, PNNL performed ASMI injection molding analyses of the complex ribbed parts using the actual molding parameters to validate fiber length predictions at the selected locations on the parts to within 15% of the Virginia Tech measured data.
University of Illinois advised the team on fiber orientation and fiber length measurement options, modeling issues, and interpretation of data.
In discussion with Toyota and Magna, PNNL completed the part-to-part weight reduction analysis for LCF/PA66 ribbed parts using comparative three-point bending simulations of these parts and of similar parts in steel and in LGF/PA66 materials. Relative to the equivalent part in steel, a weight

PNNL-25440
6
reduction exceeding the 35% target defined in Table 2 of DE-FOA-0000648, Area of Interest 1 was achieved [1].
Toyota estimated a weight reduction of 22.5% for the relevant vehicle body system including the body-in-white, closures, fenders and bumpers body for replacement of applicable steel parts with 50 wt% LCF/PA66 parts.
In discussion with Magna and PlastiComp, Toyota and PNNL estimated the cost per pound saved if 50 wt% LCF/PA66 parts were used to replace the equivalent parts in steel.
4. Phase 1 Accomplishments 4.1 Material Compounding and Plaque Molding (PlastiComp) PlastiComp compounded 30 wt% LCF/PP and 30 wt% LCF/PA66 as well as 50 wt% LCF/PP and 50 wt% LCF/PA66 pellets for the project as listed in Table 1. PlastiComp shipped the compounds to Autodesk for rheological, thermal and mechanical property characterization [3]. Table 1. 30 wt% and 50 wt% LCF/PP and LCF/PA66 compounds produced by PlastiComp and shipped
to Autodesk for rheological, thermal and mechanical testing [30].
Serial No Compound Amount Remarks 1 PP+LCF30 Natural 55 lbs. Shipped to Autodesk, Australia 2 PP+LCF50 Natural 55 lbs. Shipped to Autodesk, Australia 3 PA66+LCF30 Natural 55 lbs. Shipped to Autodesk, Australia 4 PA66+LCF50 Natural 55 lbs. Shipped to Autodesk, Australia
PlastiComp molded 30 wt% and 50 wt% LCF/PP as well as 30 wt% and 50 wt% LCF/PA66 center-gated and edge-gated plaques (Figure 2) using the conventional injection molding process under controlled conditions outlined in Table 2 [3]. The 7 in. x 7 in. x 1/8 in. molded plaques were delivered to PNNL. Information on the injection speeds and processing conditions used in the various molding trials was also sent to PNNL for preparing ASMI models and preliminary analyses of PlastiComp plaques.
Figure 2. (a) Center-gated and (b) Edge (fan)-gated, 7 in. x 7 in. x 1/8 in. PlastiComp plaques.

PNNL-25440
7
Table 2. LCF thermoplastic plaques molded by PlastiComp under slow and fast fill conditions [4].
During the third quarter of FY 2014, the edge-gated and center-gated plaque molds used in earlier conventional molding trials were used for further molding trials. PlastiComp used the Pushtrusion®, D-LFT process to mold additional plaques fulfilling the plaque molding milestone [5]. As opposed to earlier molding trials with pre-compounded pellets, Pushtrusion® directly feeds the molten resin and cut fibers into the mixing zone of the injection barrel. The principle is illustrated in Figure 3.
Figure 3. Principle of the Pushtrusion® in-line direct injection molding (D-LFT) used by PlastiComp.

PNNL-25440
8
In the process, fiber in the molten resin stream is cut to desired length by a rotary cutter (not shown in Figure 3) at the terminus of the capillary tube. The rotary speed of the cutter, the number of cutting edges and the lineal speed of the fiber/resin stream are selectable and may be used to determine chopped fiber lengths. As with the pre-compounded pellets, fibers for molded plaques were cut to 12-mm lengths. Since fiber-chopping in Pushtrusion® occurs in the molten phase, there is tight control on fiber-length distribution, whereas fibers in pre-compounded pellets are subject to severe length attrition during pellet melting in the injection barrel. Pushtrusion® routinely compounds 20 to 50 wt% glass-fiber compounds and is currently used for molding PlastiComp customer parts. However, for carbon fiber compounds, the realistic and achievable fiber content at the time of molding was in the range from 20 to 30 wt%. Therefore, carbon fiber weight fractions in the range from 20 to 30 wt% were adopted, and fast/slow molding conditions for each fiber/resin combination were repeated as in the earlier molding using the conventional injection molding process. The plaques molded are summarized in Table 3.
Table 3. Summary of molding conditions and number of plaques D-LFT processed by PlastiComp [4].
4.2 Compound Material Characterization (Autodesk) Autodesk completed the milestone on material characterization for four LCF thermoplastic compounds (Table 1) including 30 wt% LCF/PP, 30 wt% LCF/PA66, 50 wt% LCF/PP and 50 wt% LCF/PA66. Material characterization performed by Autodesk provided the viscosity, thermal properties, mechanical properties, and PVT/density data for the selected materials. The materials data files were distributed to all the project participants [4, 13-16]. Illustrations of the data obtained through Autodesk characterization are presented in Figures 4 and 5 for the specific heat data vs. temperature for the 30 wt% LCF/PA66 and 50 wt% LCF/PA66, respectively. Subsequently, PNNL used these material data files in the ASMI injection molding simulations of PlastiComp 2D plaques and of the complex ribbed and non-ribbed parts (under Phase 2).
Figure 4. Specific heat vs. temperature for the 30 wt% LCF/PA66 material.
ITEM DESCRIPTION INJECTION SPEED
(HIGH) INJECTION
SPEED (LOW)
1 20-30 wt% LCF/PP 20 Plaques 20 Plaques
2 20-30 wt% LCF/PA66 20 Plaques 20 Plaques

PNNL-25440
9
Figure 5. Specific heat vs. temperature for the 50 wt% LCF/PA66 material. 4.3 Cutting samples from PlastiComp Plaques for Fiber Orientation and Length Measurements (PNNL)
PNNL cut 0.9 in. x 0.9 in. coupons from plaques received from PlastiComp at 3 Locations designated
“A”, “B” and “C”. The coupons were shipped to Purdue for fiber orientation and fiber length measurements. All three regions in a given plaque are located along the same center line. Location A is near the gate while Location C is near the plaque extremity. Location B is equidistant from Regions A and C. Figure 6 shows these regions defined on the edge-gated and center-gated plaques [4].
Figure 6. Locations A, B and C defined on the edge-gated (left) and center-gated (right) plaques where coupons were removed for shipping to Purdue for fiber orientation and length measurements.
4.4 Fiber Orientation Measurement for PlastiComp 2D Plaques (Purdue)
To facilitate fiber orientation measurement (and also fiber length measurement), Purdue used an optical microscope, Olympus BX51, as shown in Figure 7. A software-controlled motorized stage attached to the microscope allows for automated image stitching at high magnification. High dynamic range and extended-focus imaging capabilities capture in-focus, high-contrast images at varying heights. This system replicates the function of the Leeds system [17] (see below) and provides measurement fidelity.

PNNL-25440
10
Figure 7. Optical microscope system with motorized stage for use in fiber measurements.
Figure 8. Comparison of fiber orientation tensor components obtained using the Purdue method, Phelps manual segmentation [18], and Leeds machine (x3 denotes the thickness direction).

PNNL-25440
11
Purdue developed a fiber orientation measurement method [3-6] based on the principles of a method developed at the University of Leeds (termed the Leeds method) [17] and validated this method using previous fiber orientation data obtained from the Leeds machine and manually measured data by Phelps [18]. The Purdue approach included:
Developing a new polishing routine, utilizing an automated polishing machine, to reduce fiber damage during surface preparation
Using a marker-based watershed segmentation routine, in conjunction with a hysteresis thresholding technique, for fiber segmentation
Verifying the orientation measurement method using images and results obtained by Phelps [18] using the Leeds method.
The orientation results obtained by the Purdue method were compared with the data obtained using the Leeds machine and those obtained using manual segmentation by Phelps [18]. The comparison of the fiber orientation tensor components A11, A22, A33 and A31 is shown in Figure 8. The 1- and 2-directions denote the flow and cross flow directions, respectively. Purdue's fiber orientation results agree within 10% of a reference analysis on data acquired by the Leeds system, thereby verifying the Purdue method The Purdue method was applied to measure fiber orientations for coupons taken at Locations A, B and C on the PlastiComp plaques (Figure 6) selected for the Go/No-go decision point. Each sample was divided into three analysis regions to allow better segmentation and to improve execution time. Each region is approximately 0.3 in x 0.3 in. The tensors obtained using the three regions were used to determine the average tensor components for the entire specimen for comparison with predicted values. The comparison of Purdue measured fiber orientation results with ASMI predictions for PlastiComp plaques is reported in Section 4.7. 4.5 Fiber Isolation for Length Measurement (PNNL)
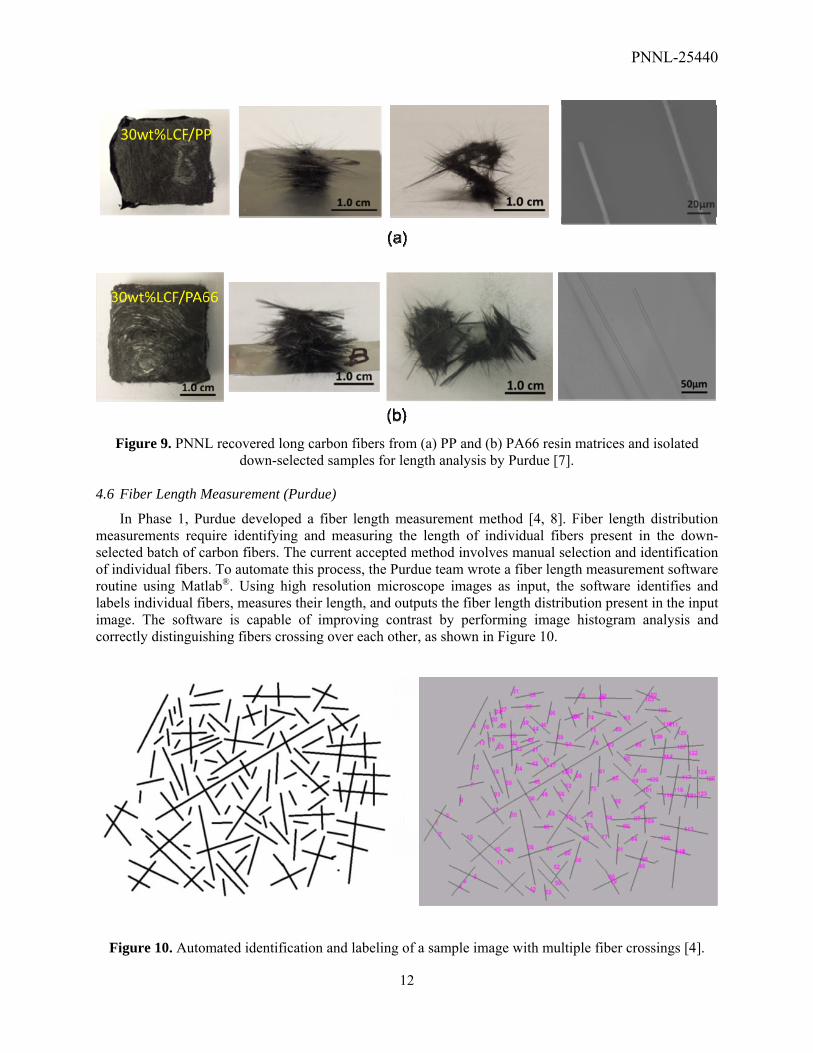
An important technical challenge for the team during Phase 1 involved the isolation of fibers from coupons for length measurement. To assist Purdue in the fiber length characterization effort, PNNL developed a method to recover intact carbon fibers from LCF/PP and LCF/PA66 composites for fiber length distribution measurement [7]. In previous attempts to recover carbon fibers from PP and from PA66 composites through heating of the composites in air (burn-off), it was observed that the diameters of recovered fibers (~5 microns) decreased relative to initial diameters (7 microns) and that fiber ends were sharpened. These observations were consistent with oxidative damage to the fibers during the heating process for resin removal. The fact that measured fiber lengths were shorter than anticipated was also hypothesized to be due to oxidative damage, resulting in fiber embrittlement and breakage during recovery. To avoid oxidative damage and recover fiber samples with length distributions representative of those in the molded composite, an inert atmosphere heating process was developed for resin removal. The process consists of heating the LCF/PP composite sample in argon at 500°C for 2 hours. Microscopic evaluation of the resultant fibers confirmed that the fiber diameter was maintained, that no fiber end sharpening was present, and that the resin was cleanly removed (Figure 9a). Residual fiber mass further confirmed the complete extent of resin removal with the process. It was observed that the inert atmosphere burn-off process does not result in complete removal of PA66 as evidence by 2-3 wt% residual mass in addition to fiber mass in the recovered samples and by visible microscopic residue on the fibers. PNNL then developed an alternative solvent method for fiber recovery from PA66 composites (Figure 9b).
PNNL-25440
12
Figure 9. PNNL recovered long carbon fibers from (a) PP and (b) PA66 resin matrices and isolated
down-selected samples for length analysis by Purdue [7]. 4.6 Fiber Length Measurement (Purdue)
In Phase 1, Purdue developed a fiber length measurement method [4, 8]. Fiber length distribution measurements require identifying and measuring the length of individual fibers present in the down-selected batch of carbon fibers. The current accepted method involves manual selection and identification of individual fibers. To automate this process, the Purdue team wrote a fiber length measurement software routine using Matlab®. Using high resolution microscope images as input, the software identifies and labels individual fibers, measures their length, and outputs the fiber length distribution present in the input image. The software is capable of improving contrast by performing image histogram analysis and correctly distinguishing fibers crossing over each other, as shown in Figure 10.
Figure 10. Automated identification and labeling of a sample image with multiple fiber crossings [4].

PNNL-25440
13
After fiber separation, PNNL shipped fiber samples to Purdue for length analysis. Purdue conducted fiber length measurements and delivered the length data to PNNL for the purge materials and PlastiComp 2D plaques selected on the Go/No-go list for fiber length model validation (i.e., slow-fill edge-gated 30 wt% LCF/PP and 30 wt% LCF/PA66 plaques, Locations A, B, and C). Comparison of Purdue-measured fiber length distributions with ASMI predictions for PlastiComp plaques is discussed in Section 4.8.
4.7 Implementation and Improvement of Process Models in ASMI (Autodesk)
Autodesk focused on the implementation and improvement of process models in ASMI and delivered improved ASMI research versions to PNNL for process modeling of PlastiComp plaques (Phase 1) and of the complex 3D parts (Phase 2).
4.7.1 Improvement of 3D Fiber Orientation Solver
Autodesk improved the fiber orientation prediction by the reduced strain closure (RSC) model in 3D analysis. The RSC model is used with the anisotropic rotary diffusion (ARD) model [19] to predict the fiber orientation for long carbon fiber composites. Previous comparisons to experimental data indicated that ASMI was able to reasonably predict the orientation component in the flow direction, but tended to over-predict orientation in the thickness direction and hence under-predict the orientation component in the cross-flow direction. Also, the orientation near the mid-thickness plane was nearly always predicted to be fully random, regardless of the flow geometry, processing conditions and materials. Because of these issues, the RSC model was scrutinized and its implementation has been improved, especially near the gate region where the elongation flow is dominant as the polymer melt enters the cavity. The new ASMI 3D RSC solver was tested for a number of injection-molded cases with short-fiber and long-fiber composites, and the fiber orientation prediction has shown good agreement with most experimental data [7-10]. As the inlet orientation condition strongly influences the orientation predicted in the part by the RSC model, the option to specify the inlet profile, which was already available in the ASMI mid-plane and dual domain solver, was added in the 3D solver [8]. An option was added in the new research version of ASMI to apply the prescribed inlet orientation profile through the thickness direction of the part around the gate. The section on ASMI Fiber Orientation Predictions for PlastiComp Plaques (Section 4.8) in this report demonstrates significant improvements in 3D fiber orientation prediction using this new ASMI research version. In the 3D analyses of the slow-fill 50 wt% LCF/PP edge-gated and center-gated plaques, we prescribed the same inlet condition and the same ARD-RSC model parameters as used in the corresponding mid-plane models. 4.7.2 Implementation of a Fiber Length Distribution (FLD) Model
Autodesk implemented a new FLD model based on an unbreakable length assumption with reduced order modeling by the proper orthogonal decomposition (POD) approach in the mid-plane, dual-domain, and 3D solvers. The work focused on removing the need for a preliminary snapshot analysis to determine the POD modes. The snapshot analysis previously used required long computation time and large computation memory while running the full-flow and FLD models to pre-determine the POD modes for use in the ROM scheme. Using a dynamic look-up table that covers a wide spectrum of shear-rate and viscosity variations in the analysis removed the need for snapshot analysis. Nguyen et al. [6] compared and reported the computational memory required when using ROM with five POD modes and the full FLD model for a dual-domain analysis of the complex part with 150 length segments in the FLD distribution. The memory required for the FLD calculation was reduced by 61% when ROM with five POD modes is used. The validation of the FLD model using the POD approach for selected PlastiComp plaques has shown that FLDs predicted by this model reasonably match the experimental data [7].

PNNL-25440
14
4.8 ASMI Fiber Orientation Predictions for PlastiComp Plaques (PNNL and Autodesk)
In discussion with Autodesk and the University of Illinois, PNNL conducted injection molding simulations of PlastiComp plaques to predict flow-induced fiber orientation and length distributions in these plaques. PNNL subsequently compared the predicted FODs and FLDs with the corresponding experimental results to validate the model predictions. A series of PlastiComp plaques were selected and approved for defining the Go/No-go decision point. The plaques selected for fiber orientation prediction validation, selected to consider the variables of fill speed, gating option, fiber loading and matrix resin, comprised the following [7]:
Fast-fill 30 wt% LCF/PP edge-gated plaque, Slow-fill 50 wt% LCF/PP edge-gated plaque, Slow-fill 50 wt% LCF/PP center-gated plaque, Fast-fill 30 wt% LCF/PP center-gated plaque, Fast-fill 50 wt% LCF/PA66 edge-gated plaque, Fast-fill 50 wt% LCF/PA66 center-gated plaque.
The ASMI analyses for all the above plaques were conducted using the ARD-RSC model [19] implemented in an ASMI research version that Autodesk delivered to PNNL. From the measured data received from Purdue, a target fiber orientation tensor, Aij, was selected, and from this target, a set of acceptable bi parameters for the ARD-RSC model were identified and used in the simulations [5]. The bi parameters were identified following the procedure proposed by Phelps et al. [19], by fitting the steady-state solution in a simple shear flow to the selected target orientation, requiring the physically-valid fiber interaction tensor C in all flows, and requiring stable transient orientation solutions in simple shear as well as planar, uniaxial, and biaxial elongation flows. The target steady-state fiber orientation of the model was chosen based on the measured orientation in the shell layers. The ASMI simulations used the actual process parameters employed by PlastiComp when molding the plaques. Figures 11(a) and (b) show the ASMI mid-plane models for the PlastiComp edge-gated and center-gated plaques used in the simulations. Subsequent 3D models of the same plaques were built for the analyses and discussed in a previous report [7].
Figure 11. ASMI models for the PlastiComp edge-gated plaque (a) and center-gated plaque (b).
FODs predicted at Locations A, B and C (see Figure 6) were compared to the corresponding measured FODs at these respective locations to validate ASMI fiber orientation predictions. As fiber
(a) (b)

PNNL-25440
15
orientation strongly varies through the sample thickness, it is not possible or meaningful to have the point-by-point comparison between the predicted and measured fiber orientations for all the components of the second-order fiber orientation tensor. Instead, a quantitative method for comparing measured and predicted fiber orientations using the calculated mechanical properties as the basis for assessing the accuracy in fiber orientation prediction is meaningful and relevant. In this work, the tensile elastic moduli and flexural moduli computed for the flow and cross-flow directions using predicted and measured fiber orientations were used to evaluate whether the ASMI fiber orientation prediction at a given location agrees with the measured data within 15% [6]. The ASMI analyses of the PlastiComp plaques selected for the Go/No-go decision point were discussed in detail in our quarterly reports [4-8]. A project review web conference was held on March 19th, 2015 to present all the analysis results to DOE for making the Go/No-go decision. For illustration, Figures 12 to 14 show the ASMI mid-plane fiber orientation predictions for the flow-direction component, 11A and cross-flow-direction component 22A of the fiber orientation tensor for Locations A, B and C on the slow-fill 50 wt% LCF/PP edge-gated plaque. These figures also report the ASMI 3D analysis results and the measured fiber orientation data received from Purdue [8]. There is good agreement of results observed for Location A where both 3D and mid-plane solutions have reasonable agreement with the experimental data. The 3D model predicts a similar wide core as predicted in the mid-plane results, but it has underestimated 11A and overestimated 22A in the shell layers for Location B. The 3D results for Location C are in better agreement with the average measured data than the mid-plane solution (Figure 15).
Figure 12. Predictions vs. measured data for the fiber orientation tensor components: (a) 11A , and (b)
22A for Location A on the slow-fill 50 wt% LCF/PP edge-gated plaque [8].
(a) (b)

PNNL-25440
16
Figure 13. Predictions vs. measured data for the fiber orientation tensor components: (a) 11A , and (b)
22A for Location B on the slow-fill 50 wt% LCF/PP edge-gated plaque [8].
Figure 14. Predictions vs. measured data for the fiber orientation tensor components: (a) 11A , and
(b) 22A for Location C on the slow-fill 50 wt% LCF/PP edge-gated plaque [8].
To evaluate whether fiber orientation prediction at a given location agrees with measured data within 15%, PNNL computed tensile elastic moduli and flexural moduli for the flow and cross-flow directions using predicted and measured fiber orientations. Typical values of elastic properties of the carbon fiber and resin matrix were used in the calculations assuming a mean fiber aspect ratio of 200. Table 4 reports the tensile and flexural moduli calculated based on the predicted and measured fiber orientations for Locations A, B and C on this plaque. This table compares both mid-plane- and 3D solver-produced moduli with the corresponding values computed using measured fiber orientation data. The mid-plane results agree with the measured data within 15% except for certain mid-plane predictions for Location C.
(a) (b)
(a) (b)
PNNL-25440
17
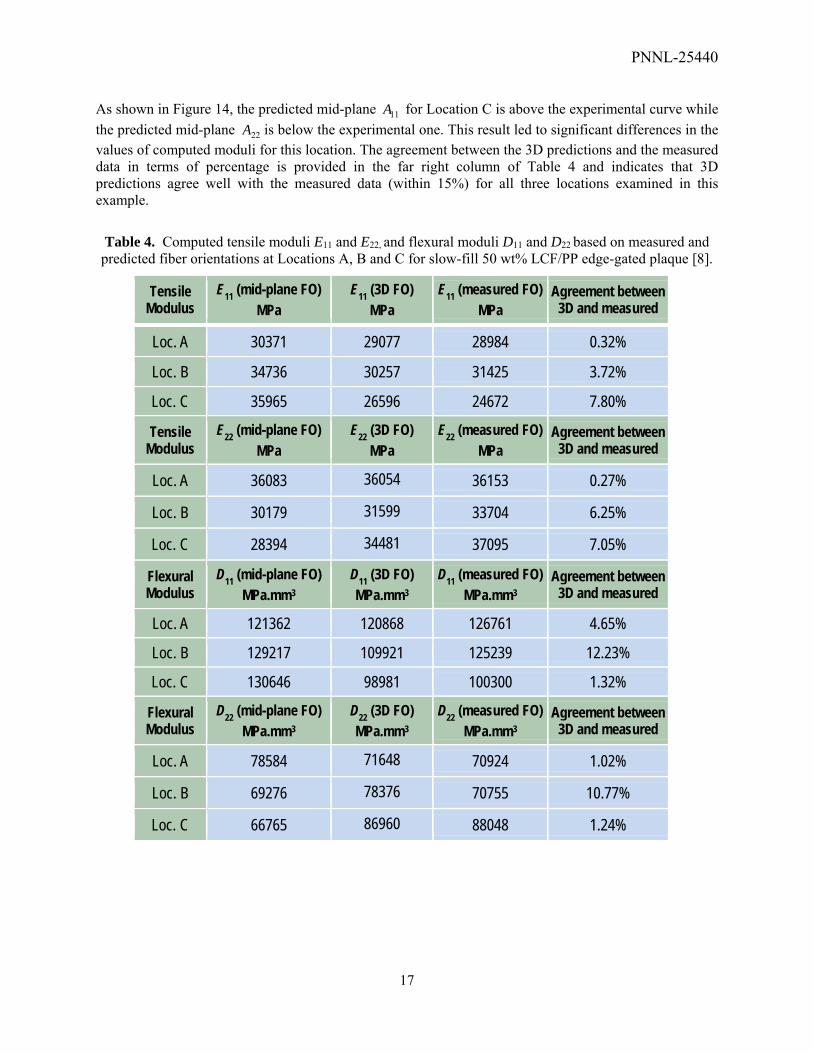
As shown in Figure 14, the predicted mid-plane 11A for Location C is above the experimental curve while
the predicted mid-plane 22A is below the experimental one. This result led to significant differences in the values of computed moduli for this location. The agreement between the 3D predictions and the measured data in terms of percentage is provided in the far right column of Table 4 and indicates that 3D predictions agree well with the measured data (within 15%) for all three locations examined in this example.
Table 4. Computed tensile moduli E11 and E22, and flexural moduli D11 and D22 based on measured and predicted fiber orientations at Locations A, B and C for slow-fill 50 wt% LCF/PP edge-gated plaque [8].
Tensile Modulus
E11 (mid-plane FO) MPa
E11 (3D FO) MPa
E11 (measured FO) MPa
Agreement between 3D and measured
Loc. A 30371 29077 28984 0.32%
Loc. B 34736 30257 31425 3.72%
Loc. C 35965 26596 24672 7.80%
Tensile Modulus
E22 (mid-plane FO) MPa
E22 (3D FO) MPa
E22 (measured FO) MPa
Agreement between 3D and measured
Loc. A 36083 36054 36153 0.27%
Loc. B 30179 31599 33704 6.25%
Loc. C 28394 34481 37095 7.05%
Flexural Modulus
D11 (mid-plane FO) MPa.mm3
D11 (3D FO) MPa.mm3
D11 (measured FO) MPa.mm3
Agreement between 3D and measured
Loc. A 121362 120868 126761 4.65%
Loc. B 129217 109921 125239 12.23%
Loc. C 130646 98981 100300 1.32%
Flexural Modulus
D22 (mid-plane FO) MPa.mm3
D22 (3D FO) MPa.mm3
D22 (measured FO) MPa.mm3
Agreement between 3D and measured
Loc. A 78584 71648 70924 1.02%
Loc. B 69276 78376 70755 10.77%
Loc. C 66765 86960 88048 1.24%

PNNL-25440
18
4.9 ASMI Fiber Length Predictions for PlastiComp Plaques (PNNL and Autodesk) PlastiComp plaques selected and approved for the Go/No-go decision point were the following [8]:
Slow-fill 30 wt% LCF/PP edge-gated plaque Slow-fill 30 wt% LCF/PA66 edge-gated plaque
PNNL performed injection molding mid-plane and 3D simulations for these PlastiComp plaques using the fiber length model implemented in the ASMI research version that Autodesk delivered to PNNL [8-9]. In all the simulations, the FLD data in the injection molding machine nozzle measured by Purdue was applied as the fiber inlet condition at the injection location (Figure 15). For a given material, the same set of model parameters were used in all the analyses. The accuracy in fiber length prediction was determined using the 15% accuracy criterion. This criterion was evaluated via the principal tensile and flexural moduli computed using predicted vs. measured FLDs for a prescribed fiber orientation distribution. In this work, predicted fiber orientations at Locations A, B, and C were used in the computation of elastic moduli for these locations.
Figure 15. FLDs measured by Purdue for the slow-fill 30 wt% LCF/PA66 and 30 wt% LCF/PP nozzle purge materials from the injection molding machine nozzle [8].
Plots in Figure 16(a-c) show the predicted FLDs compared to FLDs measured by Purdue for Locations A, B and C on the slow-fill 30 wt% LCF/PA66 plaque. The weight-average lengths resulting from the predicted and measured distributions are also given in these figures. Both the mid-plane and 3D ASMI solutions are able to capture the measured length distributions quite well. There is also reasonable agreement between all the predicted FLDs and the corresponding weight-average lengths with the experimental results. Table 5 provides the tensile and flexural moduli calculated based on the predicted and measured FLDs for Locations A, B and C on this plaque. Very good agreement of results for the tensile moduli E11 and E22 as well as for the flexural moduli D11 and D22 are observed for all three locations. The excellent agreement in predicted stiffness performance is not surprising considering the

PNNL-25440
19
fiber length distributions achieved represent truly long fibers producing high fiber aspect ratio values that bring the elastic moduli near their maximum limits. Modest changes in fiber length in this high aspect ratio range have only very little effect on the composite elastic moduli. A sensitivity study of the fiber length effect on the elastic moduli was completed and reported in a previous quarterly report [8].
Figure 16. Predicted and measured fiber length distributions for (a) Location A, (b) Location B, and (c)
Location C on the slow-fill 30 wt% LCF/PA66 plaque. w (l) is the weight distribution of fibers as a function of length.
A similar ASMI analysis was performed for the slow-fill 30 wt% LCF/PP plaque to predict FLDs at Locations A, B and C on this plaque for the validation of the fiber length model [9]. As observed in the LCF/PA66 molding discussed above, the fiber length model was able to capture the measured length distributions in the LCF/PP molding quite well. Good agreement is found between all the predicted FLDs

PNNL-25440
20
and the corresponding weight-average lengths with the experimental results. Excellent agreement is found between the elastic moduli calculated based on the predicted and measured FLDs for all three plauque locations. Table 5. Computed tensile moduli E11 and E22, and flexural moduli D11 and D22 based on measured and
predicted FLDs at Locations A, B and C in the slow-fill 30 wt% LCF/PA66 edge-gated plaque.
Tensile Modulus E11 (mid-plane FLD)
MPa E11 (3D FLD)
MPa E11 (measured FLD)
MPa Agreement between measured and 3D
Loc. A 22499 22363 22309 0.24%
Loc. B 25500 25313 25427 0.45%
Loc. C 26310 26127 26106 0.08%
Tensile Modulus E22 (mid-plane FLD)
MPa E22 (3D FLD)
MPa E22 (measured FLD)
MPa Agreement between measured and 3D
Loc. A 24620 24469 24480 0.04%
Loc. B 19802 19666 19729 0.32%
Loc. C 19123 19001 18987 0.07%
Flexural Modulus
D11 (mid-plane FLD) MPa.mm3
D11 (3D FLD) MPa.mm3
D11 (measured FLD) MPa.mm3
Agreement between measured and 3D
Loc. A 86813 86293 86085 0.24%
Loc. B 86750 86137 86511 0.43%
Loc. C 88210 87622 87556 0.08%
Flexural Modulus
D22 (mid-plane FLD) MPa.mm3
D22 (3D FLD) MPa.mm3
D22 (measured FLD) MPa.mm3
Agreement between measured and 3D
Loc. A 56729 56437 56320 0.21%
Loc. B 53404 53090 53282 0.36%
Loc. C 51807 51525 51493 0.06%
4.10 ASMI Pre-Analysis of the Complex 3D Part (PNNL) PNNL received from Toyota two complex part geometries to consider: one with and one without ribs. A sensitivity study was performed to determine the effect of several input parameters (i.e., material, wall thickness, and filling control parameters) on the the range of relevant outputs critical to designing a molding process (i.e., pressure at the end of fill, maximum clamp force, and total fill time) [20]. The four PlastiComp materials adopted for the project were used in the mold filling pre-analysis for the Toyota complex part: 30 wt% LCF/ PP, 30 wt% LCF/PA66, 50 wt% LCF/PP and 50 wt% LCF/PA66. These materials had been characterized by Autodesk and the rheological and physical data were provided to

PNNL-25440
21
PNNL for the process simulations using ASMI [13-16]. A first round of mold filling pre-analyses had been conducted for the complex part considering 50 wt% LCF/PP and 50 wt% LCF/PA66 materials as the 50 wt% carbon fiber loading was initially adopted for the complex part. The first pre-analysis results indicated that it was difficult to achieve the mold filling using 50 wt% LCF/PA66. Also, the pressure at the end of fill predicted for a 2-mm wall thickness reached very high values. Therefore, after discussions with the team, 30 wt% fiber loading was adopted, and it was suggested to consider 2.8 mm and 3.0 mm wall thicknesses for the part so that when the project enters Phase 2 the tool could be used for fiber loading values higher than 30 wt% as needed. Pre-analysis of the complex part also predicted that successful molding with 50 wt% LCF/PA66 would be difficult to achieve in practice due to high pressures in the part during filling. In addition, reducing the wall thickness to 2 mm would significantly increase the pressure in the part and exacerbate molding issues. The molding difficulty with 50 wt% LCF/PA66 is due to the high viscosity of this material at the considered molding conditions. On the other hand, ASMI predicted successful mold fillings of the complex ribbed and non-ribbed parts using both 30 wt% LCF/PP and 30 wt% LCF/PA66 materials, and for all the wall thicknesses considered: 2 mm, 2.8 mm and 3 mm. However, the team retained the wall thickness for the complex parts around 2.8 mm so that the tool used to mold them could be used not only for 30 wt% fiber loading but higher fiber loadings as well. Figure 17 illustrates the fill-time contour predicted for the 2.8-mm-wall thickness, 30 wt% LCF/PP complex part with ribs. ASMI predicted successful mold filling for this part [20].
Figure 17. Fill time predicted for the 2.8-mm wall-thickness, 30 wt% LCF/PP complex part with ribs – successful mold filling was predicted [20].

PNNL-25440
22
5. Phase 2 Accomplishments
5.1 Conventional LFT Molding of the Ribbed and Non-Ribbed Parts (Magna)
At the beginning of Phase 2, Magna worked with Toyota and PlastiComp to build the tool for molding the complex ribbed and non-ribbed parts [9]. Magna began molding trials by running a series of short shot fill profiles (Figure 18). Melt temperatures and tool temperatures were gradually increased until parts began to flash to establish the maximum limits. The team proceeded to optimize fill speed and pack profile to get the best surface finish and fill of the ribs. The processing trials ran well with very consistent part weights, but incomplete filling of the ribs was observed (Figure 19). This is likely due to gas trapped in the thin rib areas. Strategies to improve rib filling including increasing plasticizing back pressure or screw rotation were not pursued in an effort to preserve fiber length as much as possible. Venting in the deep ribs to alleviate trapped gas is another option to facilitate complete filling of the ribs.
The parts without ribs were filled much more easily since screw rotation (rpm) and plasticizing back pressure were able to be reduced, so there was a possibility to achieve longer fiber lengths in the non-ribbed part. Nozzle purges were retained from each of the trials for fiber length measurement. Table 6 reports the Magna complex part molding matrix with and without ribs. Table 7 gathers the processing parameters that Magna used to mold the parts. Magna communicated these parameters to PNNL and the team for ASMI process simulation of the complex parts.
Figure 18. Short shot fill profiles obtained during molding trials [9].

PNNL-25440
23
Figure 19. 30 wt% LCF/PA66 ribs showing incomplete fill due to trapped gas in the thin ribs [9]. Table 6. Magna LFT Molding Trial Matrix – U shape Complex Part [8]
Table 7. Magna LFT Molding Trial Processing Conditions – U shape Complex Part [9].
Processing Conditions
Location: Magna Exteriors and Interiors ‐ Casmir
Machine Engel 200 TL
Mold U‐Shape Tool
Molding Date 16/17‐June‐2015
Material 30CF‐PA66 30CF‐PA66 30CF‐PP 30CF‐PP
Rib / No‐Rib Ribs No Ribs Ribs No Ribs
Identification Code 30PALR 30PALN 30PPLR 30PPLN
Mold Temp ‐ Cavity 110 C (230 F) 105 C (220 F) 88 C (190 F) 88 C (190 F)
Mold Temp ‐Core 115 C (240 F) 105 C (220 F) 82 C (180 F) 82 C (180 F)
Melt Temp 320 C (608 F) 320 C (608 F) 248 C (478 F) 248 C (478 F)
Fill Time 2.64 sec 1.93 sec 2.35 sec 2.24 sec
Fill Speed 70 mm/s (2.75 in/sec) 75 mm/s (2.95 in/sec) 60 mm/s (2.36 in/sec) 60 mm/s (2.36 in/sec)
Packing Pressure (Hydraulic) 33 bar (478 psi) 40 bar (580 psi) 28.3 bar (410 psi) 40 bar (580 psi)
Intensification Ratio 9.0 9.0 9.0 9.0
Packing Pressure (Melt) 297 bar (4,308 psi) 360 bar (5,221 psi) 360 bar (5,221 psi) 360 bar (5,221 psi)
Packing time 3.5 sec 5 sec 3 sec 10 sec
Cooling Time 45 sec 45 sec 46 sec 54 sec
Nomimal wall thickness 2.8 mm 2.8 mm 2.8 mm 2.8 mm
Part Weight (with gate) 274 g 233 g 213 g 193 g
Part Weight (without gate) 269 g 228 g 208 g 188 g
Case Ribs Resin CF wt%
LFT/ D-LFT
Trial 1 Date
Parts Molded 1st
Trial 2 Date
Parts Molded 2nd
Total Parts
1 ribs PP 30% LFT 06/16/15 13 06/30/15 37 50 2 ribs PA66 30% LFT 06/16/15 12 06/30/15 38 50 3 no-ribs PP 30% LFT 06/17/15 25 06/29/15 25 50 4 no-ribs PA66 30% LFT 06/17/15 22 06/29/15 28 50

PNNL-25440
24
5.2 Cutting Samples from Complex Parts for Fiber Orientation and Length Measurements (Magna) Locations selected for fiber orientation and length measurements in the complex part, designated A, B, C and D and shown in Figure 20, were marked in the mold for easy identification in the molded parts. Location D is on a rib. After molding, Magna cut the selected coupons at the designated locations from the ribbed and non-ribbed parts and shipped them to Virginia Tech for fiber orientation and length measurements [10].
Figure 20. Locations A, B and C on the ribbed and non-ribbed parts where coupons were cut out for fiber orientation and length measurements. Location D is on a rib. The sample size and the surfaces marked red
for fiber orientation measurement are also defined in this figure [10].
PNNL-25440
25
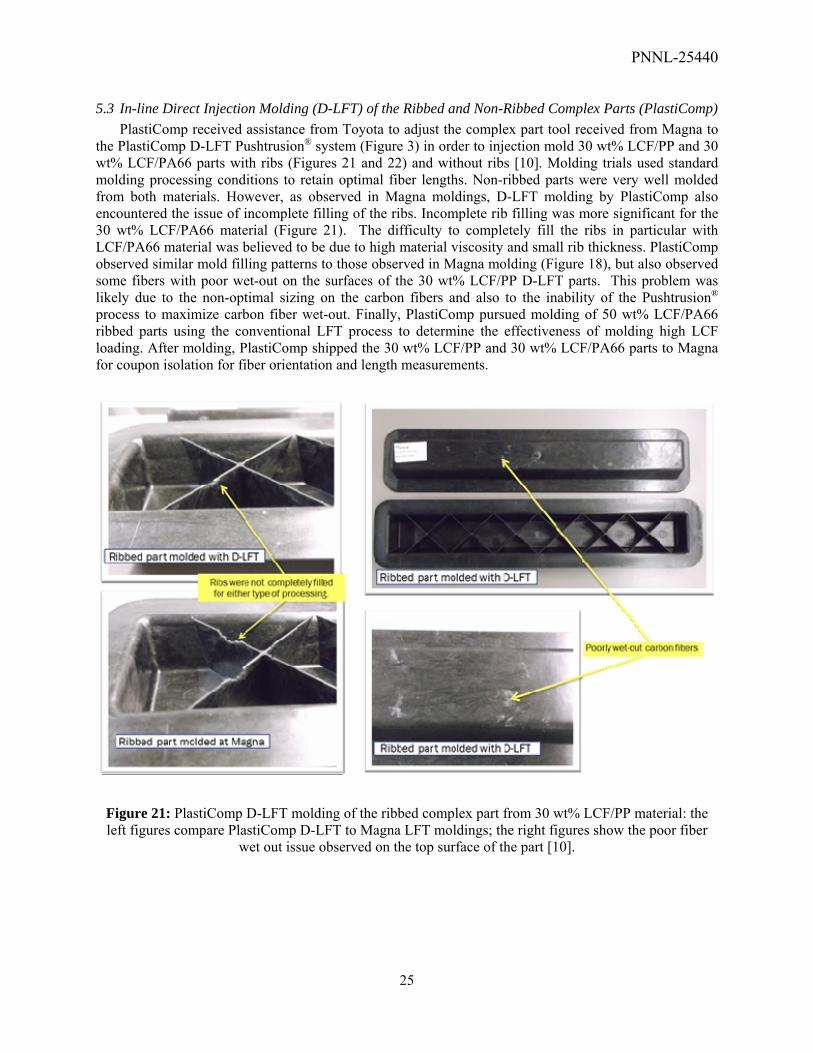
5.3 In-line Direct Injection Molding (D-LFT) of the Ribbed and Non-Ribbed Complex Parts (PlastiComp)
PlastiComp received assistance from Toyota to adjust the complex part tool received from Magna to the PlastiComp D-LFT Pushtrusion® system (Figure 3) in order to injection mold 30 wt% LCF/PP and 30 wt% LCF/PA66 parts with ribs (Figures 21 and 22) and without ribs [10]. Molding trials used standard molding processing conditions to retain optimal fiber lengths. Non-ribbed parts were very well molded from both materials. However, as observed in Magna moldings, D-LFT molding by PlastiComp also encountered the issue of incomplete filling of the ribs. Incomplete rib filling was more significant for the 30 wt% LCF/PA66 material (Figure 21). The difficulty to completely fill the ribs in particular with LCF/PA66 material was believed to be due to high material viscosity and small rib thickness. PlastiComp observed similar mold filling patterns to those observed in Magna molding (Figure 18), but also observed some fibers with poor wet-out on the surfaces of the 30 wt% LCF/PP D-LFT parts. This problem was likely due to the non-optimal sizing on the carbon fibers and also to the inability of the Pushtrusion® process to maximize carbon fiber wet-out. Finally, PlastiComp pursued molding of 50 wt% LCF/PA66 ribbed parts using the conventional LFT process to determine the effectiveness of molding high LCF loading. After molding, PlastiComp shipped the 30 wt% LCF/PP and 30 wt% LCF/PA66 parts to Magna for coupon isolation for fiber orientation and length measurements.
Figure 21: PlastiComp D-LFT molding of the ribbed complex part from 30 wt% LCF/PP material: the left figures compare PlastiComp D-LFT to Magna LFT moldings; the right figures show the poor fiber
wet out issue observed on the top surface of the part [10].

PNNL-25440
26
Figure 22: PlastiComp D-LFT molding of the ribbed complex part from 30 wt% LCF/PA66 material:
incomplete fill of the ribs was observed [10].
5.4 Fiber Orientation Measurements for the Complex Ribbed and Non-Ribbed Parts (Virginia Tech)
Virginia Tech received the samples from Magna and PlastiComp including nozzle purge materials, initial pellets, and coupons cut from the selected locations on the ribbed and non-ribbed complex parts (Figure 20) [11]. Virginia Tech performed fiber orientation measurements for these samples using the established Virginia Tech method that applies the same key principles of the Leeds method [17]. 1 mm x 2.7 mm images of polished and etched samples were obtained and analyzed using Virginia Tech in-house code that accounts for partial objects and resolves out-of-plane angle ambiguity. Figure 22(a) presents a portion of the image obtained for Location C of the non-ribbed 30 wt% LCF/PPA66 part that shows very good contrast between carbon fiber cross-sections (white ellipses) and the matrix. Figure 22(b) reports fiber orientation components 11A , 22A and 33A measured in the 1-2-3 coordinate system at Location C
where Axis 1 is parallel to the part longitudinal direction and Axis 2 is the thickness direction at this location. Figure 23(b) shows a clear shell/core layered orientation structure.
PNNL used measured fiber orientation data from Virginia Tech to validate ASMI fiber orientation predictions for the complex parts. A comparison of the Virginia Tech fiber orientation data with the corresponding ASMI predictions is presented in Section 5.6.
5.5 Fiber Length Measurements for the Complex Ribbed Parts (Virginia Tech)
Virginia Tech applied an established method to perform fiber length measurements for the coupon samples taken at Locations A, B, C and D of the complex ribbed parts molded from the 30 wt% LCF/PP and 30 wt% LCF/PA66 materials [12]. The procedure used by Virginia Tech to measure fiber length is summarized in the following 8 steps:
1. Samples are extracted based on the sample type
a. Nozzle purge: a segment of the purge 1 inch or longer is cut from the purge material
b. Injection molded part: FLD samples use the same coupons used in FOD measurement
2. Samples are wrapped tightly in two layers of aluminum foil. This is done to prevent the loss of fibers in the case that the inner layer became damaged during matrix burn-off.
3. Matrix is burned-off in a convection oven in air at 450°C over the course of 1 hour. Identical conditions were used for both matrices.

PNNL-25440
27
4. Samples are removed from the oven after matrix burn-off. An epoxy plug is injected into the aluminum packet to capture a small subset of fibers within the sample following the method described by Kunc et al [21]. The epoxy is allowed to cure for at least 24 hours.
5. Epoxy plug is extracted from the sample after curing. An air gun is used to blow off any fibers that are not directly captured by the plug and the diameter of the plug is measured with calipers. The plug is then wrapped in two layers of aluminum foil for plug burn-off.
6. Plugs are placed and wrapped in two layers of aluminum foil in an oven under conditions identical to that for matrix burn-off for 1 hour to isolate the captured fibers for length measurement.
7. Fibers captured by the plug are placed in a Petri dish filled with enough water to cover the bottom of the dish. Captured fibers are separated into three batches due to the fact that a very large number of fibers are captured by each epoxy plug. This reduces the total number of fibers in each scan obtained in the following step and makes identifying and tracing separate fibers much less ambiguous.
8. Petri dishes with fibers are placed on a desktop scanner and scanned. The resulting images have a resolution of 6400 dpi and dimensions of 33.3 mm by 76.7 mm.
9. Fiber length measurement is performed manually in ImageJ software using a macro developed at Virginia Tech. Fibers are selected using a method suggested by University of Illinois in which circles are superimposed on the image. Any fibers intersecting the circle diameters or laying inside the circles are selected; all other fibers are neglected.
a. Not: The method suggested by the University of Illinois had not been extensively practiced and was not executed in a statistically or mathematically rigorous way this work. However, it was applied consistently throughout all of the FLD analyses.
b. Analysis circles are 6 mm in diameter, arranged randomly using a random number generator to create a list of circle centers, and spaced so that the circumferences of nearby circles are separated by at least 3 mm.
c. The number of circles in each image is selected so that the circles appear evenly distributed across the scan and cover a reasonable area in the image. “Evenly” and “reasonable” were not quantified but were judged by eye. Ultimately, 25 circles were judged to satisfy these criteria.
d. In summary: 25 6-mm diameter circles are used to select the fibers to be measured in each scan. Circles are positioned randomly within each scan with the edge of each circle separated by at least 3 mm from neighboring circles.
e. The goals of this method were to reduce user selection bias and to reduce analysis time.
f. A correction factor [22] is used to account for the fact that the circles have a bias towards longer fibers. Note that this correction is in addition to the correction associated with the same phenomenon in the epoxy plug extraction and is applied in a multiplicative manner (i.e. the circle correction is applied to the plug correction).
In Section 5.7, the FLDs computed by ASMI analyses at Locations A, B, C and D of the 30 wt% LCF/PP and 30 wt% LCF/PA66 parts are compared to the corresponding experimental FLDs expressed in terms of fiber length weighted distributions to validate the fiber length model.

PNNL-25440
28
Figure 23. (a) Surface after polishing and etching for fiber orientation measurement, and (b) Illustration of measured fiber orientation components 11A , 22A and 33A at Location C of the 30 wt% LCF/PA66 non-
ribbed complex part [11]. 5.6 Fiber Orientation Predictions for the Complex Parts (PNNL and Autodesk)
PNNL worked with Autodesk to build 3D ASMI models for the ribbed and non-ribbed complex parts [10]. PNNL conducted ASMI analyses of parts injection molded from the 30 wt% LCF/PP and 30 wt% LCF/PA66 materials to exercise the models and evaluate part filling. Magna molding parameters were used in the injection molding simulations of the complex parts (Table 7). During the first quarter of FY 2016, PNNL performed 3D ASMI analyses of these parts to predict FODs and compare predicted FODs at the selected locations (see Figure 20) to the corresponding measured data received from Virginia Tech. Autodesk identified the parameters of the ARD-RSC model based on the fiber orientation data measured of the ribbed and non-ribbed parts produced from these materials. PNNL then used these parameters in trial ASMI analyses and determined a single set of parameters for each material used in the parts. Different options to prescribe the fiber orientation inlet condition in ASMI were explored, and it was determined that the option “fiber aligned at skin/transverse at core” produced results most in line with the measured fiber orientation data. Figure 24 shows the coordinate system used for all the fiber orientation measurements at Locations A, B, and C. Location D is on a rib. The local measurement coordinate system at Location D is such that the 1-direction is the thickness direction, the 2-direction points along the width of the rib, and the 3-direction points along the height of the rib (positive direction out of the plane). All

PNNL-25440
29
the ASMI fiber orientation predictions compared to the corresponding measured data for the ribbed and non-ribbed parts were described in a previous report [11]. The following illustrates these results for the 30 wt% LCF/PA66 ribbed part.
Figure 24. Coordinate system used for all of the FOD measurements at Location A, B and C [11].
Figures 25 and 26 report the comparisons between the predicted and measured fiber orientation tensor components 11A , 22A and 33A expressed in the measurement coordinate system for Locations A and B on
the 30 wt% LCF/PA66 ribbed part. The measured data for 11A and 22A at Location A show a very wide
core where the orientation state is nearly random with 11A and 22A fluctuating around 0.5 (Figure 25).
The model captures well the variations of 11A and 22A from the skin to the shell layers at this location but cannot capture the values of these components in the core. The model predicted a very pronounced skin/shell/core orientation structure with fibers aligned in the cross-flow direction in the core. A good agreement between predicted and measured 33A is observed at Location A. The model, however, provides
better predictions for 11A and 22A at Location B. Figure 26 shows globally good agreements between predicted and experimental results at Location B although the model does not completely capture fiber orientation in the core. In contrast to the fiber orientation profile at Location A, the measured fiber orientation data at Location B clearly exhibits the usual skin/shell/core structure. Predicted fiber orientation results for Location C of this part are seen to compare well to the measured data on this part as presented in Figure 27. The measured fiber orientation profile exhibits high alignment in the 1-direction that is very well captured by the model. Good agreement of results is found for all three components of the orientation tensor. Figure 28 reports the fiber orientation predictions for Location D (on a rib) compared to the measured data at this location. ASMI fiber orientation results obtained in the structural XYZ axes were expressed in the measurement coordinate system for comparison of results reported in Figure 28. Global agreement is observed between the predicted and measured results for 22A and 33A . The
model roughly captures the nearly random fiber orientation distribution in the 2-3 plane, but it largely over-predicts 11A for the values of the normalized thickness z/h between -0.5 and 1.

PNNL-25440
30
Figure 25. Predictions vs. measured data for the fiber orientation tensor components 11A , 22A and 33A for
Location A on the 30 wt% LCF/PA66 ribbed part. z/h denotes the normalized z coordinate with h being the half of the sample thickness [11].
Figure 26. Predictions vs. measured data for the fiber orientation tensor components 11A , 22A and 33A for
Location B on the 30 wt% LCF/PA66 ribbed part [11].

PNNL-25440
31
Figure 27. Predictions vs. measured data for the fiber orientation tensor components 11A , 22A and 33A for
Location C on the 30 wt% LCF/PA66 ribbed part [11].
Figure 28. Predictions vs. measured data for the fiber orientation tensor components 11A , 22A and 33A for
Location D on the 30 wt% LCF/PA66 ribbed part [11]. Tables 8 to 11 provide the tensile and flexural moduli calculated based on the predicted and measured fiber orientations for all the selected locations on the 30 wt% LCF/PA66 ribbed part. The computation of elastic moduli using the method described previously [6] assumed typical elastic properties of the carbon fiber and of the PA66 matrix. A uniform fiber aspect ratio, l/d = 200 was also assumed in the computation. Table 8 shows that the 15% accuracy criterion was not met at Location A for 11E or 22E .

PNNL-25440
32
This was due to the large model under-prediction for 11A and over-prediction for 22A (Figure 24). However, better correlation between predicted and measured FODs at Locations B and C (Figures 25 and 26) have led the predictions of all the elastic moduli to be within 15% of the measured data. For Location D (Table 11), the accuracy criterion was not met for 22E or 33E , but the exceedances were small [11].
Differences between measured and predicted values of FODs in the complex parts may be due to several factors. For Location A, the role of part to part variability for the long carbon fiber injection molded parts may be significant. It is unclear whether the observed fiber orientation structures are consistently repeatable in multiple moldings for the same mold geometry and material or if this was a randomly occurring problem. One possible explanation is that carbon fibers have not been adequately dispersed during mixing and melting in the barrel of the injection molding machine. With plastication settings targeting minimal fiber breakage, it may be the case that melting and dispersion were incomplete, particularly for the last material entering the cavity during the post-filling stage (which has its final position in the core near the gate). This last material injected has the shortest time in the cavity to develop an orientation profile due to the shear and expansion flow. Lack of dispersion might lead to a plug-like flow which would not develop the usual orientation profile. An increase in the plastication settings (back pressure and screw rotation speed) could be attempted to determine if the expected orientation profiles could be consistently obtained. The ASMI software is designed for the ideal case of well-dispersed fibers and is not intended to predict random events due to incomplete dispersion.
The discrepancy between measured and predicted FOD values at Location D may relate to the fact that Location D is close to a change in direction for the flow and that the software is not adequately capturing the rotation of orientation in the core as it goes around the corner (flowing from the base geometry into the rib). This is a known weakness in the convection implementation of ASMI and an active focus area for improvement. Over a longer flow path (after a bend), the through-thickness orientation would progressively decrease, but so close to the bend (that is, close to the base of the rib), the orientation prediction still shows an artifact of the convection problem. Another potential explanation for Location D discrepancy is that the model does not include cooling analysis, but assumes perfect cooling and uniform mold temperature. In reality, temperature varies in the mold based on cooling efficiency, and near the rib cooling is likely delayed. Injected material may solidify faster in the ASMI analysis than in the real case.
Table 8. Computed tensile moduli E11 and E22, and flexural moduli D11 and D22 based on measured and predicted fiber orientations at Location A on the 30 wt% LCF/PA66 ribbed part [11].

PNNL-25440
33
Table 9. Computed tensile moduli E11 and E22, and flexural moduli D11 and D22 based on measured and predicted fiber orientations at Location B on the 30 wt% LCF/PA66 ribbed part [11].
Table 10. Computed tensile moduli E11 and E33, and flexural moduli D11 and D33 based on measured and predicted fiber orientations at Location C on the 30 wt% LCF/PA66 ribbed part [11].
Table 11. Computed tensile moduli E22 and E33, and flexural moduli D22 and D33 based on measured and predicted fiber orientations at Location D on the 30 wt% LCF/PA66 ribbed part [11].
5.7 Fiber Length Predictions for the Complex Parts (PNNL and Autodesk)
PNNL repeated the injection molding simulations of the 30 wt% LCF/PP and 30 wt% LCF/PA66 ribbed parts to predict flow-induced fiber length distributions following receipt of a new ASMI research version from Autodesk on 01/31/2016 [12]. All the measured FLDs expressed in terms of corrected numbers of fibers vs. fiber length received from Virginia Tech were converted into weight-of-fiber vs. fiber length distributions for comparison with the predicted results at Locations A, B, C and D on these parts. Fiber length breakage modeling using the Phelps et al. [23] model implemented in ASMI can be performed independently from fiber orientation predictions. Fiber orientation predictions for the complex parts were reported in a previous quarterly report [10]. As the use of the fiber length model requires the

PNNL-25440
34
length data in the feeding system introduced as the inlet condition, the measured FLD data of the nozzle purging materials were used as the fiber inlet conditions applied at the injection location in the ASMI models. Figures 29(a) and 29(b) show the nozzle FLDs measured by Virginia Tech and converted into fiber length weighted distributions for the 30 wt% LCF/PA66 and 30 wt% LCF/PP materials, respectively. The corresponding weight-average lengths Lw are also provided in these figures.
The accuracy in fiber length prediction was determined using the 15% accuracy criterion that was evaluated via the principal tensile and flexural moduli computed using predicted vs. measured FLDs for a prescribed fiber orientation distribution. In this work, the fiber orientations measured by Virginia Tech (see Figures 25 to 28, also reported in [11]) at the selected locations were used in the computation of moduli in the local measurement coordinate system. ASMI predictions of FLDs compared to Virginia Tech measured data for the 30 wt% LCF/PP and 30 wt% LCF/PA66 ribbed parts have been reported previously [12]. This section illustrates the validation of the ASMI predictions for the 30 wt% LCF/PA66 ribbed part.
Predicted versus measured FLDs for 30 wt% LCF/PA66 ribbed part Locations A, B, C and D are shown in Figures 30(a), 30(b), 31(a) and 31(b), respectively. The weight-average lengths resulting from the predicted and measured distributions are also given in these figures. The fiber length model is able to globally capture the measured length distribution profiles quite well. There are reasonable agreements in weight-average lengths wL at Locations A, B and C. However, the model significantly over-predicts wL at Location D. Magna and PlastiComp both reported incomplete filling of the ribs during mold filling from the 30 wt% LCF/PA66 material, likely due to gas trapped in the thin rib areas (see Figure 19). ASMI provides the option of venting analysis, but normally it requires a fine mesh in order to predict the short shot due to poor venting. In current ASMI analyses venting analysis was excluded and the mold was assumed to have perfect venting. The difference between predicted and actual rib filling could partially explain the difference in predicted and measured FLDs in the ribs.
Tables 12 to 15 provide the tensile and flexural moduli calculated based on the predicted and measured FLDs for Locations A, B, C and D on the 30 wt% LCF/PA66 ribbed part. Very good agreement of results for the principal tensile moduli as well as for the principal flexural moduli are observed for all four locations. The excellent agreement in predicted stiffness performance is not surprising since the fiber length distributions achieved represent significantly long fibers producing high fiber aspect ratios that bring the elastic moduli near their maximum limits. Modest changes in fiber length in this high aspect ratio range have very little effect on the composite elastic moduli. The saturation of the composite elastic moduli with increasing fiber aspect ratio was demonstrated and discussed in our previous reports [8, 12].

PNNL-25440
35
Figure 29. The nozzle FLDs measured by Virginia Tech and converted into fiber length weighted
distributions w (l) (with l being fiber length) for the (a) 30 wt% LCF/PA66 and (b) 30 wt% LCF/PP materials [12].
Figure 30. Predicted vs. measured fiber length weighted distributions for (a) Location A and (b) Location
B on the 30 wt% LCF/PA66 ribbed part [12].
(a) (b)
(a) (b)

PNNL-25440
36
Figure 31. Predicted vs. measured fiber length weighted distributions for (a) Location C and (b) Location
D on the 30 wt% LCF/PA66 ribbed part [12].
Table 12. Tensile moduli E11 and E22, and flexural moduli D11 and D22 computed using measured and predicted FLDs at Location A on the 30 wt% LCF/PA66 ribbed part [12].
Table 13. Tensile moduli E11 and E22, and flexural moduli D11 and D22 computed using measured and predicted FLDs at Location B on the 30 wt% LCF/PA66 ribbed part [12].
(a) (b)

PNNL-25440
37
Table 14. Tensile moduli E11 and E33, and flexural moduli D11 and D33 computed using measured and predicted FLDs at Location C on the 30 wt% LCF/PA66 ribbed part [12].
Table 15. Tensile moduli E22 and E33, and flexural moduli D22 and D33 computed using measured and predicted FLDs at Location D on the 30 wt% LCF/PA66 ribbed part [12].
Figures 32(a) and 32(b) provide an overview of fiber lengths in the parts for all the predicted weight-average lengths compared to the corresponding experimental values for both moldings [12].
Figure 32. Predicted vs. measured weight-average fiber lengths for all the locations in (a) 30 wt%
LCF/PA66 and (b) 30 wt% LCF/PP ribbed parts [12].
(a) (b)

PNNL-25440
38
5.8 Development of a Method to Estimate Weight Reduction (PNNL, Toyota, Magna) In discussion with Toyota and Magna, PNNL has developed a method to estimate the weight reduction that can be achieved when replacing the non-ribbed part in steel with the equivalent ribbed part in injection-molded LCF/PA66 material [12]. The method involves process simulations using ASMI and structural analyses of the same parts using ABAQUS® or EMTA-NLA/ABAQUS® (for the LCF/PA66 part). EMTA-NLA was developed at PNNL under the previous Predictive Engineering effort. This tool is implemented in ABAQUS® via user subroutines. It contains a series of linear and nonlinear constitutive models for fiber composites using the standard or incremental Eshelby-Mori-Tanaka approaches [24]. The method to estimate weight reduction involves the following steps:
1. Run ASMI analysis of the 30 wt% LCF/PA66 ribbed part and compare predicted fiber orientation and length results to the measured data
2. Export ASMI nodal fiber orientation and weight-average length result data 3. Import data into ABAQUS® via EMTA-NLA 4. Perform bending elastic analysis of the 30 wt% LCF/PA66 part using EMTA-NLA/ABAQUS® to
obtain load-deflection response 5. Perform ABAQUS® bending elastic analysis of similar non-ribbed parts in steel with different
wall thicknesses to obtain load-deflection responses 6. Determine the wall thickness of the part in steel that produces the same load-deflection response
as the 30 wt% LCF/PA66 part 7. Manufacturing constraint: Parts in steel require thickness ≥ 1 mm 8. If the 30 wt% LCF/PA66 part does not meet the stiffness performance, increase the fiber loading
to 40% or 50%, and then repeat Steps 4, 6, and 8 by replacing 30 wt% with 40 or 50 wt% until achieving the load-deflection response target
9. Evaluate weight reduction achieved 10. Estimate manufacturing cost including material cost for making the equivalent part in steel and
compare to the costs for making the LCF/PA66 part to determine the cost per “saved” pound After validating fiber orientation and length predictions for the 30 wt% LCF/PA66 ribbed part, with Autodesk support to output ASMI results, PNNL exported the nodal fiber orientation and length results using the “patout” command of ASMI. These results were imported by EMTA-NLA into an ABAQUS® finite element model for structural analysis [10, 12]. In this work, three-point bending analysis of the part using EMTA-NLA/ABAQUS® was performed based on the bending test setup developed at Toyota with inputs from Magna regarding loading configuration, support dimensions, and loading nose [10]. The wall thickness of the part based on molding considerations discussed with the team is 2.8 mm. Its design was based on elastic stiffness, thus the linear elastic model of EMTA-NLA was used in the bending analysis of this part. In parallel, three-point bending analyses of the non-ribbed parts in steel having different wall-thicknesses were achieved using a finite element mesh received from Toyota. The finite element model for the part in steel used the thin shell elements of ABAQUS® that offer the option to modify the wall thickness for the design. Figure 33(a) and 33(b) illustrate the deformed shapes and contours of the vertical deflections during three-point bending of the 30 wt% LCF/PA66 ribbed part and the non-ribbed 1-mm thick part in steel, respectively. The elastic modulus and Poisson’s ratio of the part in steel used in the analysis are 183 GPa and 0.3, respectively, considering parts made by stamping. Figure 34 presents the load displacements obtained from all the analyses. The 2.8-mm thick ribbed part processed from 30 wt% LCF/PA66 was determinded not to be able to produce the load-deflection response equivalent to any part in steel having acceptable thicknesses (≥ 1 mm). Increasing the thickness of the composite part beyond 3 mm and higher to improve its load-deflection response was not recommended. Therefore, fiber content was increased to 50 wt% in the analysis corresponding to 50 wt% LCF/PA66 PlastiComp material. ASMI analyses of the ribbed part injection-molded from the 50 wt% LCF/PA66 material were then performed to predict fiber orientation and length distributions in the

PNNL-25440
39
molded part. Resulting fiber orientation and length results were exported to ABAQUS® for the three-point bending analysis of the as-formed part using EMTA-NLA/ABAQUS®. The load-deflection response of the 50 wt% LCF/PA66 part, reported in Figure 34, shows that this part and the 0.9-mm thick part in steel exhibit essentially the same response. However, 0.9-mm thickness could cause important thinning in the corners of the part in steel when deep drawing is applied in the stamping process. The 1 mm-thick part in steel was therefore selected to evaluate the weight saving that can be achieved when replacing this part with the 50 wt% LCF/PA66 ribbed part [12].
Figure 33. The deformed shapes and contours of the vertical deflections during three-point bending of (a) the 30 wt% LCF/PA66 part at -1.36-mm applied vertical displacement by the loading nose, and of (b) the
non-ribbed 1-mm thick part in steel at -1.26-mm applied vertical displacement [12].
Figure 34. Load-vertical deflection responses computed for the LCF/PA66 parts and the parts in steel with different wall thicknesses [12].
(a) (b)

PNNL-25440
40
The weight reduction that could be achieved by replacing the 1-mm thick non-ribbed part in steel with the 2.8-mm thick ribbed part processed from the 50 wt% LCF/PA66 material is illustrated by the part-to-part comparison in Table 16. This analysis indicates a 43.2% weight reduction for the complex part. It is noted that if the 0.9-mm thick part in steel were feasible, the weight reduction achieved would be 37.2 %. In both cases, the weight reduction for the part meets the system target (≥ 35%) set in Table 2 of DE-FOA-0000648 (AOI #1) [1].
Table 16. Part-to-part comparison to evaluate the weight reduction achieved with 50 wt% LCF/PA66 [12].
Figure 35. Load-vertical deflection responses computed for the LGF/PA66 parts compared to the responses of the LCF/PA66 parts [12].
Comparative three-point bending analyses of the complex ribbed parts processed from long-glass-fiber (LGF)/PA66 materials were also conducted to further evaluate the weight savings achieved with the use of LCF thermoplastics and to substantiate the mechanical performance of long-carbon-fiber thermoplastics in terms of stiffness. Two LGF/PA66 materials in the ASMI database were used in the ASMI analyses: 33 wt% LGF/PA66 and 50 wt% LGF/PA66. The injection molding simulations used

PNNL-25440
41
typical recommended process parameters for these materials. Fiber orientation results were exported to ABAQUS® for three-point bending analyses of these parts following process simulations. An average uniform glass fiber length of 2 mm was assumed in both 33 wt% LGF/PA66 and 50 wt% LGF/PA66 parts. This residual glass fiber length assumption is reasonable based on the previous study of injection-molded long-glass fiber thermoplastic composites [25]. Considering a glass fiber diameter of 0.015 mm, this produced an average fiber aspect ratio of 133 which is comparable to the average fiber aspect ratio achieved in the actual 30 wt% LCF/PA66 molding. Figure 15 reports the load-vertical deflection results of the LGF/PA66 parts compared to the results for the LCF/PA66 parts. Figure 35 clearly shows that the responses of both the 33 wt% LGF/PA66 and 50 wt% LGF/PA66 are substantially below the response of the 30 wt% LCF/PA66 part, which still cannot compete with the 1-mm part in steel. Therefore, LGF/PA66 parts could not be used to replace the part in steel. In terms of weight, the 33wt% LGF/PA66 and 50 wt% LGF/PA66 parts weight 316.7 g and 362 g, respectively, which are 1.42% and 15.9% heavier than the 50 wt% LCF/PA66 part. Knowing the weight reduction that would be achieved for a single part, Toyota conducted a study to determine the components of the body in white (Figure 36) that could potentially be replaced with composite material parts using 50 wt% LCF/PA66. The body-in-white considered in the Toyota study weighs 225 kg, and the steel components of the body-in-white selected for replacement weighs 115 kg. With an estimated 40% weight reduction achievable with composite materials, the total new weight of the candidate components for replacement would be 69 kg. This would reduce the weight of the body-in-white to 179 kg and achieve 20% weight reduction. Since it is not possible to use injection molded materials for all the parts, only some of the body system components could be replaced with the considered materials. Practical considerations based on manufacturing insights were included in the weight reduction estimates. If closures were included in addition to the body-in-white in the weight reduction analysis, Toyota has found that a 22.5% weight reduction could be reached. The current weight reduction estimate was based on weight savings in body-in-white and closures (and possibly bumpers). Typically, a lighter body-in-white could also result in lighter secondary components (i.e., engine, brakes, suspension, etc.), which would lead to further weight savings. In this work, the components whose main contribution is stiffness (bending) related were considered for replacement to achieve weight reduction. The components
Figure 36. It is estimated that a 20% weight reduction is achievable for a body in white using the injection molded LCF/PA66 material.

PNNL-25440
42
6. Publications and Presentations Wang, J.; Nguyen, B.N.; Mathur, R.; Sharma, B.; Sangid, M.D.; Costa, F.; Jin, X.; Tucker III, C.L.;
Fifield, L.S. “Fiber Orientation in Injection molded Long Carbon Fiber Thermoplastic Composites. In Proceedings of the Annual Technical Conference of SPE (SPE-ANTEC), Orlando, March 23-25, 2015.
Fifield, L.S.; Nguyen, B.N. Predictive Engineering Tools for Injection-Molded Long-Carbon Fiber Thermoplastic Composites. Presented to the USCAR Materials Tech Team on June 3rd, 2015.
7. Patents
None
8. Conclusions
This project has integrated, optimized and validated the fiber orientation and length distribution models in the ASMI package for injection-molded long-carbon-fiber thermoplastic composites into an efficient predictive engineering (PE) tool. The PE tool has been enhanced with advanced computational capabilities to satisfactorily predict fiber orientation and length distributions in a complex automotive part allowing stiffness-based part design with injection-molded long-carbon fiber thermoplastics. In Phase 1, the team achieved the following: Improved and implemented process models in ASMI for prediction of fiber orientation and fiber
length in LCF thermoplastic parts using both mid-plane and 3D modeling Molded plaques with two different geometries, two different fiber loadings, two different matrix
resins, and two different injection fill speeds Characterized fiber orientation and fiber length and demonstrated weight-average LCF lengths
exceeding 2 mm on PlastiComp plaques. The elastic stiffness of LCF composites was observed to saturate quickly as a function of fiber length, and length values equal to and beyond 0.7 mm represent truly long carbon fibers producing composites approaching the maximum achievable stiffness
Validated ASMI predictions for fiber orientation and fiber length within 15% of the measured data for the PlastiComp LCF/PP and LCF/PA66 plaques selected for the Go/No-go decision point
Successfully transitioned the project to Phase 2 to validate the Predictive Tools of LCF thermoplastic composites for a complex 3D LCF thermoplastic part.
In Phase 2, the team achieved the following:
Molded the ribbed and non-ribbed parts by both the conventional LFT and D-LFT processes Further improved ASMI for 3D fiber orientation and length prediction Validated ASMI predictions for fiber orientation and fiber length within 15% of the measured data for
the LCF/PP and LCF/PA66 complex parts Performed structural three-point bending analyses of the complex parts and similar parts in steel Developed a method using the Predictive Engineering tool to assess LCF/PA66 complex part design
in terms of stiffness performance. Demonstrated the use of stiffness-based complex part design assessment to evaluate weight savings
relative to the body system target (≥ 35%) set in Table 2 of DE-FOA-0000648 (AOI #1) [1]. Finally, the intensive participation of industrial partners (i.e., Autodesk, PlastiComp, Toyota, and Magna) in this project has supported a path for the PE tool and research results to be transferred to U.S.

PNNL-25440
43
automotive and plastics industries, where ASMI is widely used. The advanced PE capability developed here will be available to these industries in the future to help achieve affordable, light-weight vehicle systems. 9. References [1] U. S. Department of Energy, National Energy Technology Laboratory, Funding Opportunity Number: DE-FOA-0000648. “Predictive Modeling for Automotive Lightweighting Applications and Advanced Alloy Development for Automotive and Heavy-Duty Engines”. Announcement Type: 003. CFDA Number: 81.086 Conservation Research and Development, Issue Date: 05/04/2012.
[2] Nguyen BN, Simmons KL (2013). Predictive Engineering Tools for Injection-Molded Long-Carbon-Fiber Thermoplastic Composites – FY 2013 Fourth Quarterly Report; PNNL-22938; Pacific Northwest National Laboratory, Richland, WA.
[3] Nguyen BN, Sanborn SE, Simmons KL, Mathur RN, Sangid MD, Jin X, Costa F, Gandhi UN, Mori S, Tucker III CL (2014). Predictive Engineering Tools for Injection-Molded Long-Carbon-Fiber Thermoplastic Composites – FY 2014 First Quarterly Report; PNNL-23139; Pacific Northwest National Laboratory, Richland, WA.
[4] Nguyen BN, Sanborn SE, Simmons KL, Mathur RN, Sangid MD, Jin X, Costa F, Gandhi UN, Mori S, Tucker III CL (2014). Predictive Engineering Tools for Injection-Molded Long-Carbon-Fiber Thermoplastic Composites – FY 2014 Second Quarterly Report; PNNL-23325; Pacific Northwest National Laboratory, Richland, WA.
[5] Nguyen BN, Sanborn SE, Mathur RN, Sharma BN, Sangid MD, Wang J, Jin X, Costa F, Gandhi UN, Mori S, Tucker III CL (2014). Predictive Engineering Tools for Injection-Molded Long-Carbon-Fiber Thermoplastic Composites – FY 2014 Third Quarterly Report; PNNL-23499; Pacific Northwest National Laboratory, Richland, WA.
[6] Nguyen BN, Fifield LS, Mathur RN, Kijewski SA, Sangid MD, Wang J, Jin X, Costa F, Gandhi UN, Mori S, Tucker III CL (2014). Predictive Engineering Tools for Injection-Molded Long-Carbon-Fiber Thermoplastic Composites – FY 2014 Fourth Quarterly Report; PNNL-23842; Pacific Northwest National Laboratory, Richland, WA.
[7] Nguyen BN, Fifield LS, Kijewski SA, Sangid MD, Wang J, Jin X, Costa F, Tucker III CL, Mathur RN, Gandhi UN, Mori S (2015). Predictive Engineering Tools for Injection-Molded Long-Carbon-Fiber Thermoplastic Composites – FY 2015 First Quarterly Report; PNNL-24031; Pacific Northwest National Laboratory, Richland, WA.
[8] Nguyen BN, Fifield LS, Kijewski SA, Sangid MD, Wang J, Costa F, Tucker III CL, Mathur RN, Gandhi UN, Mori S (2015). Predictive Engineering Tools for Injection-Molded Long-Carbon-Fiber Thermoplastic Composites – FY 2015 Second Quarterly Report; PNNL-24259; Pacific Northwest National Laboratory, Richland, WA.
[9] Nguyen BN, Fifield LS, Mori S, Gandhi UN, Wang J, Franco C, Wollan EJ, Tucker III CL (2015). Predictive Engineering Tools for Injection-Molded Long-Carbon-Fiber Thermoplastic Composites – FY 2015 Third Quarterly Report; PNNL-24472; Pacific Northwest National Laboratory, Richland, WA.
[10] Nguyen BN, Fifield LS, Roland D, Wollan EJ, Gandhi UN, Mori S, Lambert G, Baird DG, Wang J, Franco C, Tucker III CL (2015). Predictive Engineering Tools for Injection-Molded Long-Carbon-Fiber Thermoplastic Composites – FY 2015 Fourth Quarterly Report, PNNL-24834; Pacific Northwest National Laboratory, Richland, WA.
[11] Nguyen BN, Fifield LS, Lambert L, Baird DG, Wang J, Franco C, Tucker III CL, Gandhi UN, Mori S, Wollan EJ, Roland D (2016). Predictive Engineering Tools for Injection-Molded Long-Carbon-Fiber Thermoplastic Composites – FY 2016 First Quarterly Report; PNNL-25163; Pacific Northwest National Laboratory, Richland, WA.
PNNL-25440
44
[12] Nguyen BN, Fifield LS, Wang J, Franco C, Lambert L, Baird DG, Gandhi UN, Mori S, Tucker III CL, Wollan EJ (2016). Predictive Engineering Tools for Injection-Molded Long-Carbon-Fiber Thermoplastic Composites – FY 2016 Second Quarterly Report; PNNL-25372; Pacific Northwest National Laboratory, Richland, WA.
[13] Autodesk, Inc. (2014 a). “Material Testing Report: MAT5404.”
[14] Autodesk, Inc. (2014 b). “Material Testing Report: MAT5405.”
[15] Autodesk, Inc. (2014 c). “Material Testing Report: MAT5406.”
[16] Autodesk, Inc. (2014 d). Material Testing Report: MAT5407.”
[17] Hine PJ, Davidson N, Duckett RA, Clarke AR, and Ward IM. Hydrostatically Extruded Glass-Fiber-Reinforced Polyoxymethylene. I: the Development of Fiber and Matrix Orientation, Polymer Composites, 1996, 17:720-9.
[18] Phelps JH. Process-Microstructure Models for Short- and Long- Fiber Thermoplastic Composites, Ph.D. Thesis, University of Illinois, Urbana-Champaign, 2009.
[19] Phelps JH and Tucker III CL 2009. An Anisotropic Rotary Diffusion Model for Fiber Orientation in Short- and Long-Fiber Thermoplastics,” Journal of the Non-Newtonian Fluid Mechanics, 156(3):165-176.
[20] Nguyen BN, Fifield LS, Gandhi UN, Mori S, Mathur RN, Franco C (2014). Mold Filling Pre-Analysis of the 3D Complex Part – Milestone Report. PNNL-23772. Richland, WA, Pacific Northwest National Laboratory.
[21] Kunc V, BJ Frame, BN Nguyen, CL Tucker III, and G. Velez-Garcia (2007). “Fiber Length Distribution Measurement for Long Glass and Carbon Fiber Reinforced Injection Molded Thermoplastics.” In: Proceedings of the 7th Annual SPE Automotive Composites Conference & Exposition, Society of Plastics Engineers.
[22] Tucker III CL (2006). “Correction for Sampling Bias in Fiber Length Measurement.” University of Illinois at Urbana-Champaign.
[23] Phelps JH, Abd El-Rahman AI, Kunc V, and Tucker III CL 2013. “A Model for Fiber Length Attrition in Injection-molded Long-fiber Composites,” Composites: Part A, 51, 11-21.
[24] Nguyen BN (2010) “EMTA-NLA User’s Guide.” Internal Report, PNNL-20013, Pacific Northwest National Laboratory, Richland, WA.
[25] Nguyen BN, Bapanapalli S, Holbery JD, Smith MT, Kunc V, Frame BJ, Phelps JH, and Tucker III CL (2008). “Fiber Length and Orientation Distributions in Long-Fiber Injection-Molded Thermoplastics – Part I: Modeling of Microstructure and Elastic Properties.” J. Composite. Materials, 42:1003-1029.