Prediction OPI Area hatchery coho –Jack to Adult regression Oregon Coastal Natural (OCN) coho...
13
Prediction • OPI Area hatchery coho – Jack to Adult regression • Oregon Coastal Natural (OCN) coho – Environmental • Sea Surface Temperature • Upwelling • Year (?) • Lower Columbia River coho – Not predicted
-
date post
21-Dec-2015 -
Category
Documents
-
view
215 -
download
0
Transcript of Prediction OPI Area hatchery coho –Jack to Adult regression Oregon Coastal Natural (OCN) coho...
Prediction
• OPI Area hatchery coho– Jack to Adult regression
• Oregon Coastal Natural (OCN) coho– Environmental
• Sea Surface Temperature
• Upwelling
• Year (?)
• Lower Columbia River coho– Not predicted
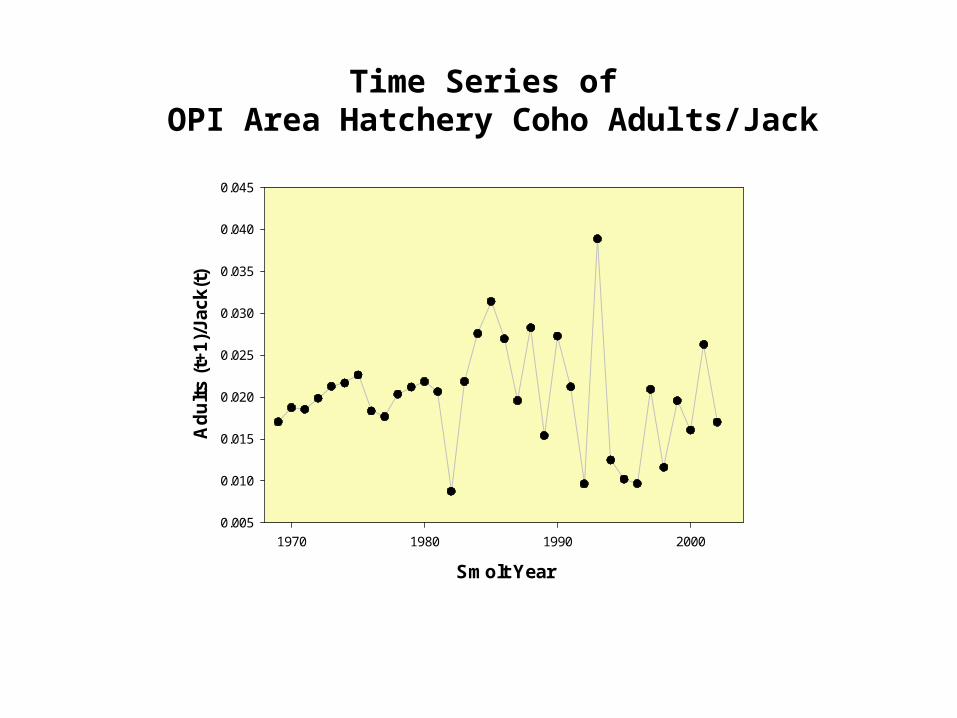
Smolt Year
1970 1980 1990 2000
Ad
ult
s (t
+1)
/Jac
k(t)
0.005
0.010
0.015
0.020
0.025
0.030
0.035
0.040
0.045
Time Series of OPI Area Hatchery Coho Adults/Jack

OPI Area Hatchery Coho Jacks and Adults
0
1000
2000
3000
4000
5000
Year
Adul
ts (t
+1) (
x100
0)
0
50
100
150
200
Jack
s (t)
(x
1000
)
Jacks (t)Adults (t+1)

0
2
4
6
8
1019
47
1949
1951
1953
1955
1957
1959
1961
1963
1965
1967
1969
1971
1973
1975
1977
1979
1981
1983
1985
1987
1989
1991
1993
1995
1997
1999
2001
2003
Year
pro
du
ctio
n -
x 1
0^6
0.0000
0.0200
0.0400
0.0600
0.0800
0.1000
0.1200
0.1400
0.1600
OP
I h
atch
ery
mar
ine
surv
ival
WOC Coho production GAM modelled survival GAM hindcast survival
Observed survival GAM forecast survival
+/- 1 S.E.
“Ocean Conditions Model” with predictionsP
rodu
ctio
nO
PI H
atchery Marine S
urvivalSea Surface TemperatureSea LevelSpring Transition
Predicted
Observed

10
100
1000
Return Year
Co
ho
(x1
000)
Observed
Predicted
Environmental predictor for OCN coho:ln(Recruits) = a + b*Year +
c* Upwelling + d*Sea Surface Temperaturer2 = 0.48 p = 0.0003
Harvest Management
• How to manage with this level of predictive capacity?– Weak stock– Exploitation Rate Matrix
• marine survival
• parental spawners

Marine Survival
Par
enta
l Spa
wne
r E
scap
emen
t
Exploitatio
n Rate
OCN and Lower Columbia Rivercoho salmon harvest management
Low HighLow
High
Low
High
< 8%
45%
< 8%
< 8%

Amendment 13 Revised Management Matrix forOCN Coho
Marine Survival IndexParentSpawnerStatus
Very Low Low Medium High
High 8% 15% 30% 45%
Medium 8% 15% 20% 38%
Low 8% 15% 15% 25%
Very Low 8% 11% 11% 11%
Critical 0 – 8 % 0 – 8 % 0 – 8 % 0 – 8 %
Planning for the Future
• Understand climate interactions
• Anticipate and prepare for likely futures
• Hatchery vs. Wild
• Flexible management strategies
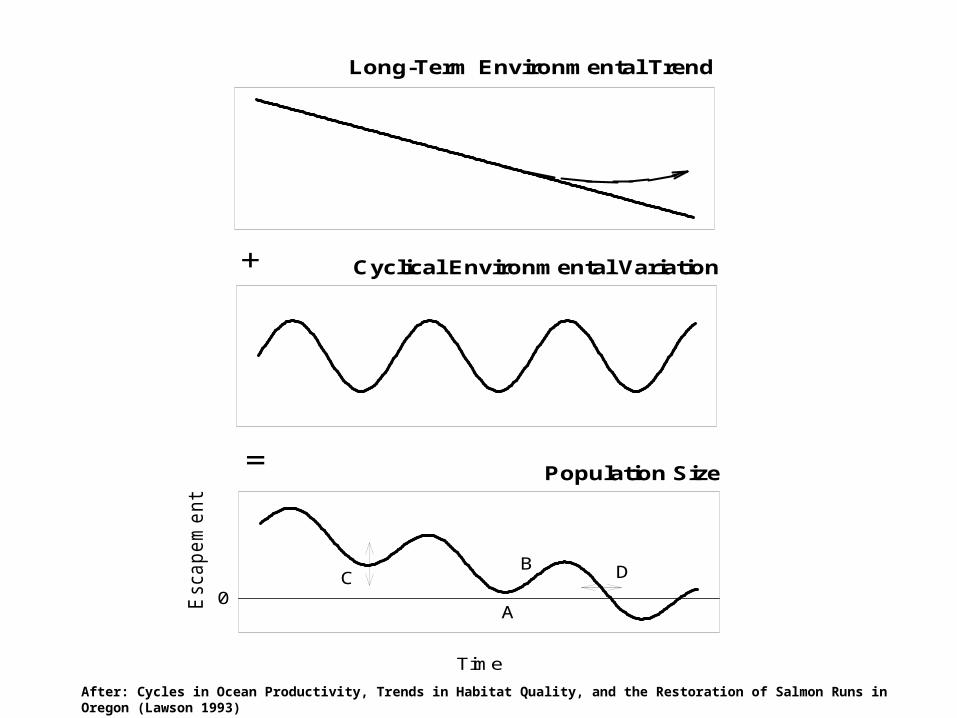
Population Size
Cyclical Environmental Variation
Long-Term Environmental Trend
=
+
DCB
A
Time
Esca
pem
en
t
0
After: Cycles in Ocean Productivity, Trends in Habitat Quality, and the Restoration of Salmon Runs in Oregon (Lawson 1993)

Coho Salmon Life-cycle
with Freshwater and Marine Environmental Factors
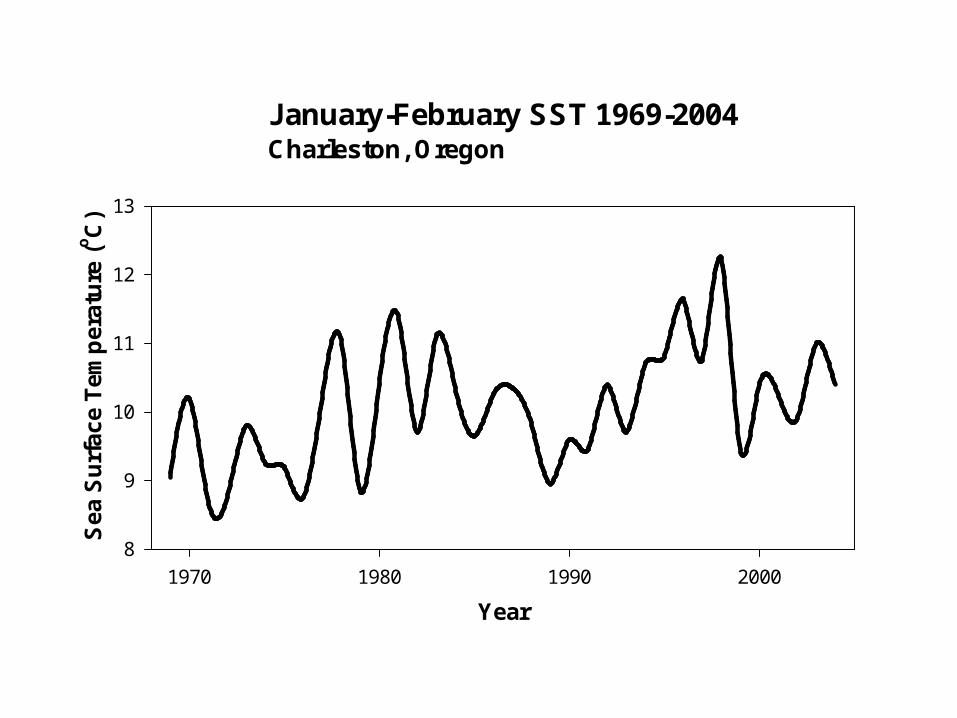
January-February SST 1969-2004Charleston, Oregon
Year
1970 1980 1990 2000
Sea
Su
rfa
ce T
emp
erat
ure
(oC
)
8
9
10
11
12
13

OO++
Spawners
Early Late
fecundity
Eggs
*
*
OO++
0.00
0.10
0.20
0.30
0.40
0.50
0% 25% 50% 75% 100% 125% 150% 175% 200%
Percent of Full Seeding (P)
Egg-
to-P
arr S
urvi
val R
ate
Sparr = 0.064P-0.743
R2 = 0.68
4 Fish per Mile
12% of Full Seeding
19% of Full Seeding
50% of Full Seeding
75% of full Seeding
899 21,700 3,596 NA 4,123 10,850 16,275
1,163 55,000 4,652 NA 10,450 27,500 41,250
1,685 50,000 6,740 NA 9,500 25,000 37,500
450 5,400 NA 86 1,026 2,700 4,050
4,197 132,100 25,099 66,050 99,075
(based on return of jacks per hatchery smolt)
HighMediumLowExtremely Low(>0.0040 jacks/smolt)(0.0015 to 0.0039)
M R
Marine Survival Index
Parent Spawner
Status 1/
0 - 8% 0 - 8% 0 - 8% 0 - 8%
< 15%
< 15%
< 15%
< 11%
15,074Coastwide Total
(<0.0008 jacks/smolt) (0.0008 to 0.0014 )
Sub-aggregate and Basin Specific Spawner Criteria Data
Northern
North - Central
South - Central
Southern
< 8%
< 8%
< 11%
< 15% < 25%
L
< 11%
Q
J
I
H
G
O
< 30%
N
< 20%
T
< 45%
S
< 38%
Sub-aggregate
HighParent Spawners > 75% of full seeding
Miles of Available Spawning Habitat
E
D
C
B
< 8%
< 8%
100% of Full
Seeding
"Critical" Very Low, Low, Medium & High
A K P
Parent Spawners > 4 fish per mile & < 19% of full seeding
Critical 2/
Parental Spawners < 4 fish per mile
MediumParent Spawners > 50% & < 75% of full seeding
LowParent Spawners > 19% & < 50% of full seeding
Very Low
F
Year
1900 1950 2000 2050 2100
Sta
nd
ard
ize
d A
no
ma
ly
-4
-3
-2
-1
0
1
2
3
4
5
1950 2000
OC
N C
oho Index
0
1500
Observed PDO Projected PNA
PopulationDynamics
FreshwaterHabitat
Climate Patterns
Marine Survival
HarvestManagement
MetapopulationDynamics