Climate prediction at regional and local scales for the benefit of climate services
Upload
gaetano-laveryCategory
view
27download
0description
Prediction on Time-Scales of Years Prediction on Time-Scales of Years to Decadesto Decades
Discussion Group ADiscussion Group A
Climax Cosmic-Ray FluxClimax Cosmic-Ray Flux
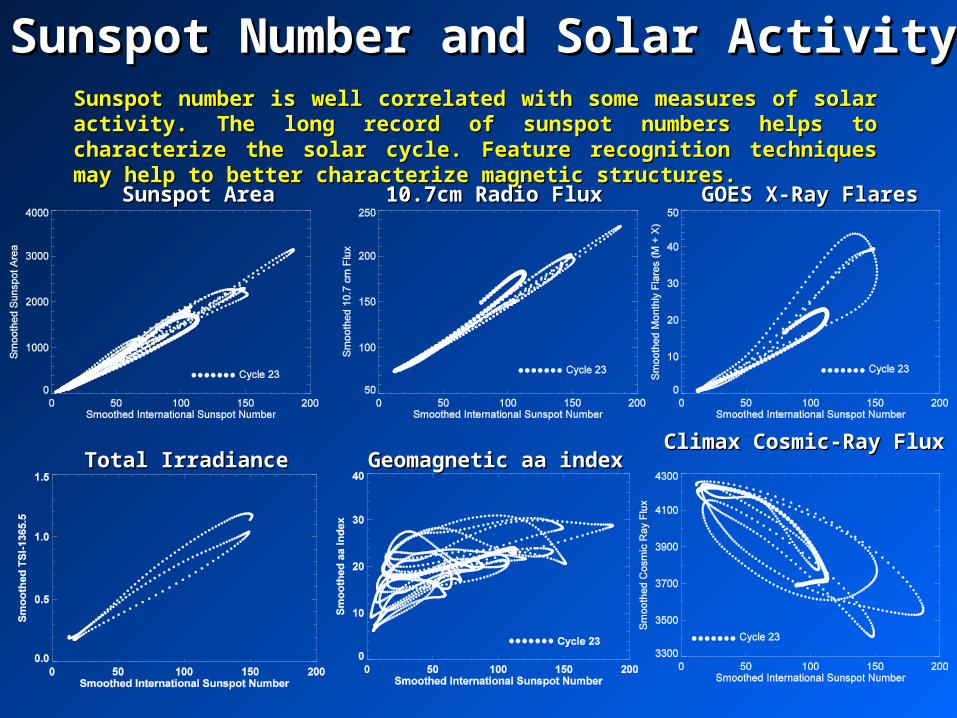
Sunspot number is well correlated with some measures of solar activity. The Sunspot number is well correlated with some measures of solar activity. The long record of sunspot numbers helps to characterize the solar cycle. Feature long record of sunspot numbers helps to characterize the solar cycle. Feature recognition techniques may help to better characterize magnetic structures.recognition techniques may help to better characterize magnetic structures.
Sunspot Number and Solar ActivitySunspot Number and Solar Activity
Sunspot AreaSunspot Area 10.7cm Radio Flux10.7cm Radio Flux GOES X-Ray FlaresGOES X-Ray Flares
Geomagnetic aa indexGeomagnetic aa indexTotal IrradianceTotal Irradiance
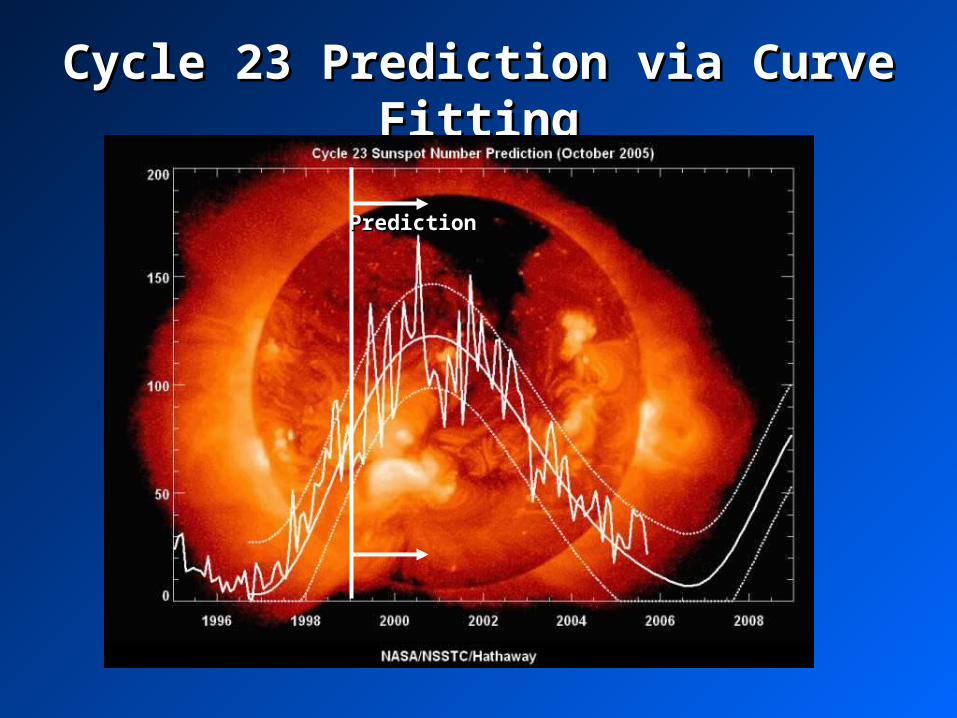
Cycle 23 Prediction via Curve FittingCycle 23 Prediction via Curve Fitting
PredictionPrediction
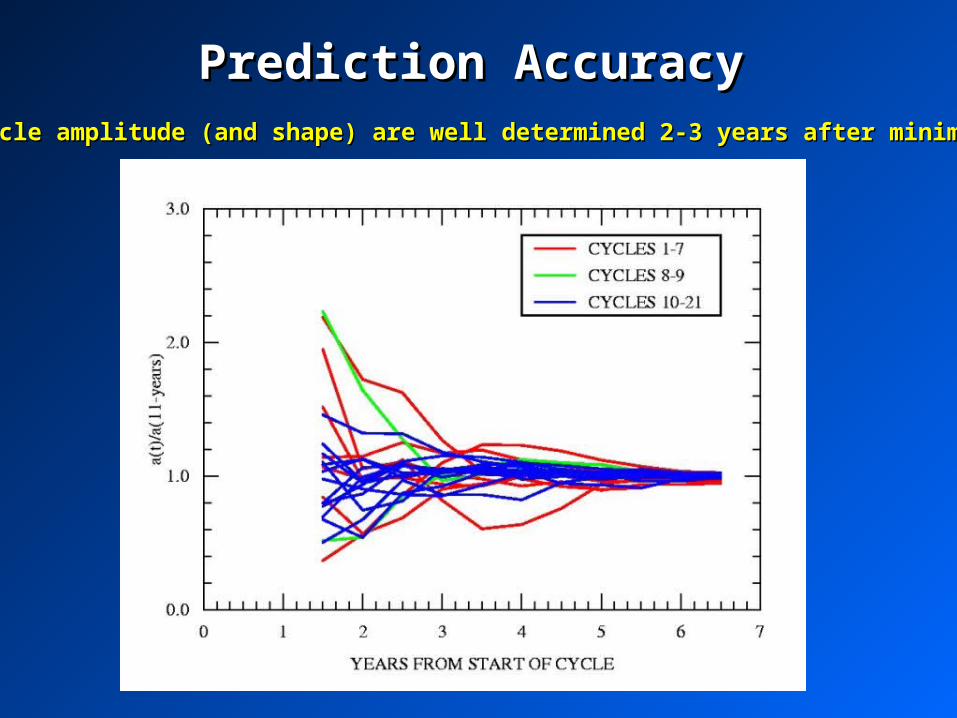
Prediction AccuracyPrediction AccuracyCycle amplitude (and shape) are well determined 2-3 years after minimum.Cycle amplitude (and shape) are well determined 2-3 years after minimum.
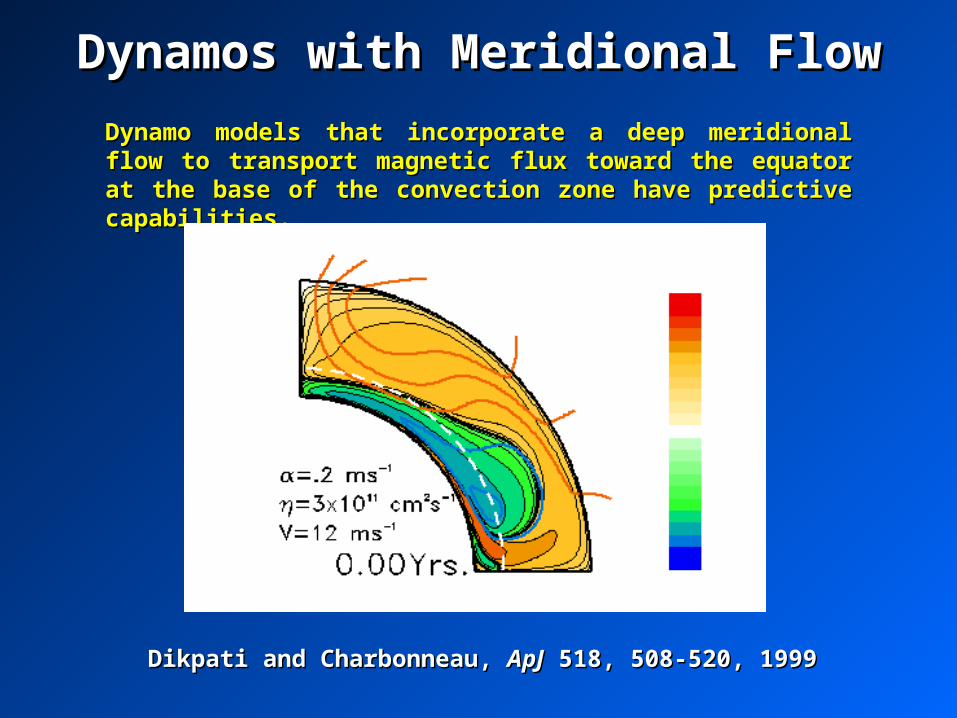
Dynamos with Meridional FlowDynamos with Meridional Flow
Dynamo models that incorporate a deep meridional flow to Dynamo models that incorporate a deep meridional flow to transport magnetic flux toward the equator at the base of the transport magnetic flux toward the equator at the base of the convection zone have predictive capabilities.convection zone have predictive capabilities.
Dikpati and Charbonneau, Dikpati and Charbonneau, ApJApJ 518, 508-520, 1999 518, 508-520, 1999
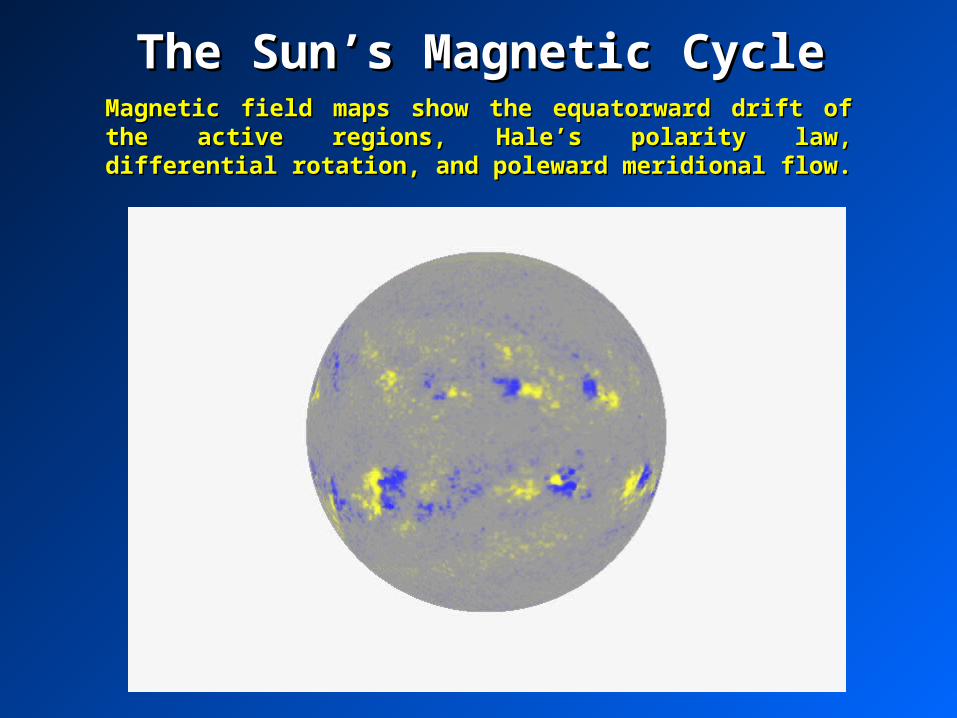
The Sun’s Magnetic CycleThe Sun’s Magnetic CycleMagnetic field maps show the equatorward drift of the active Magnetic field maps show the equatorward drift of the active regions, Hale’s polarity law, differential rotation, and poleward regions, Hale’s polarity law, differential rotation, and poleward meridional flow.meridional flow.
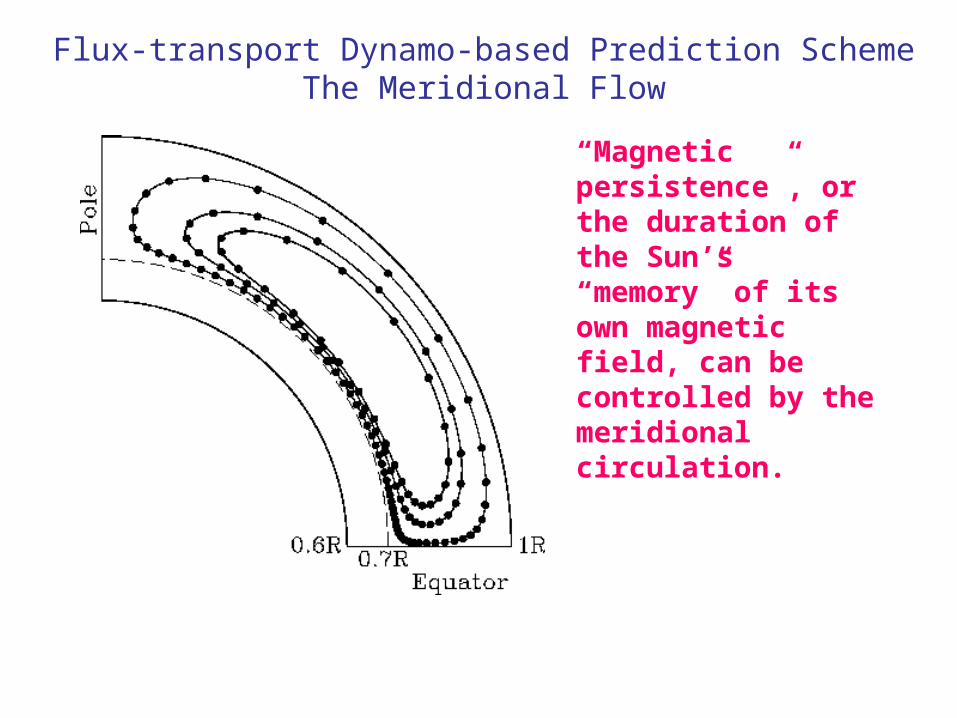
“Magnetic persistence”, or the duration of the Sun’s “memory” of its own magnetic field, can be controlled by the meridional circulation.
Flux-transport Dynamo-based Prediction SchemeThe Meridional Flow
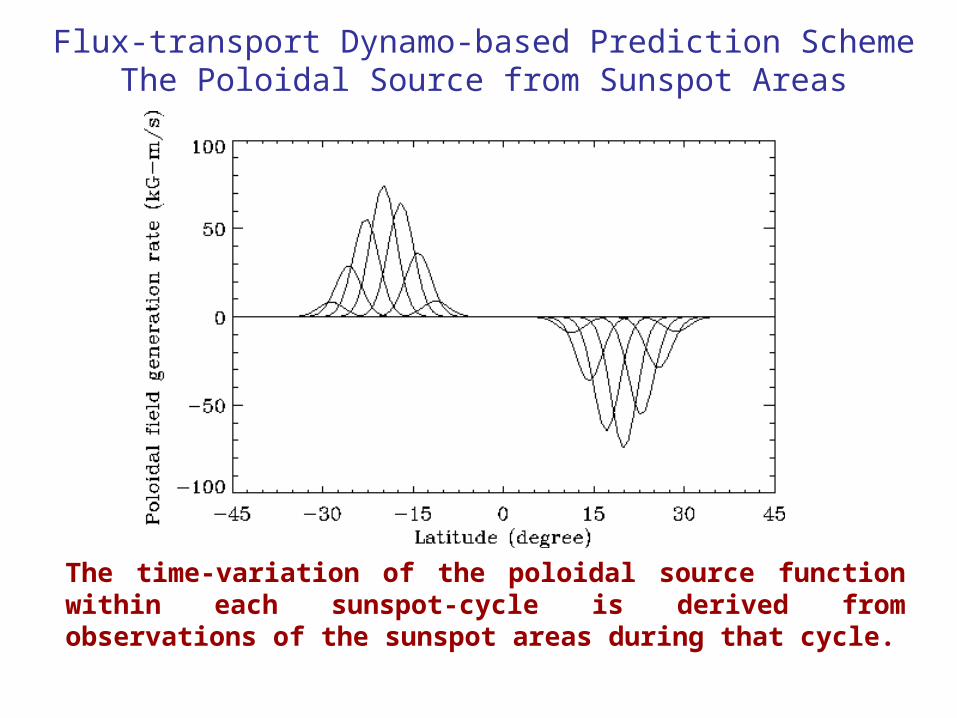
The time-variation of the poloidal source function within each sunspot-cycle is derived from observations of the sunspot areas during that cycle.
Flux-transport Dynamo-based Prediction SchemeThe Poloidal Source from Sunspot Areas
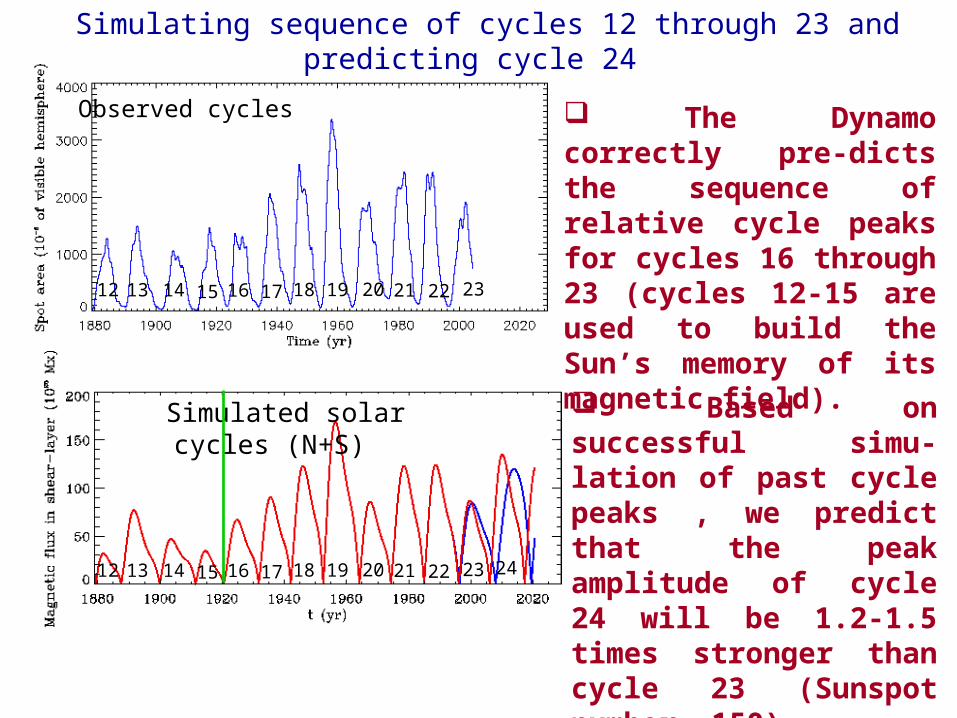
Simulated solar cycles (N+S)
Simulating sequence of cycles 12 through 23 and predicting cycle 24
21 22201918171615 23 24141312
21 22201918171615 23141312
Observed cycles
Based on successful simu-lation of past cycle peaks , we predict that the peak amplitude of cycle 24 will be 1.2-1.5 times stronger than cycle 23 (Sunspot number ~150).
The Dynamo correctly pre-dicts the sequence of relative cycle peaks for cycles 16 through 23 (cycles 12-15 are used to build the Sun’s memory of its magnetic field).
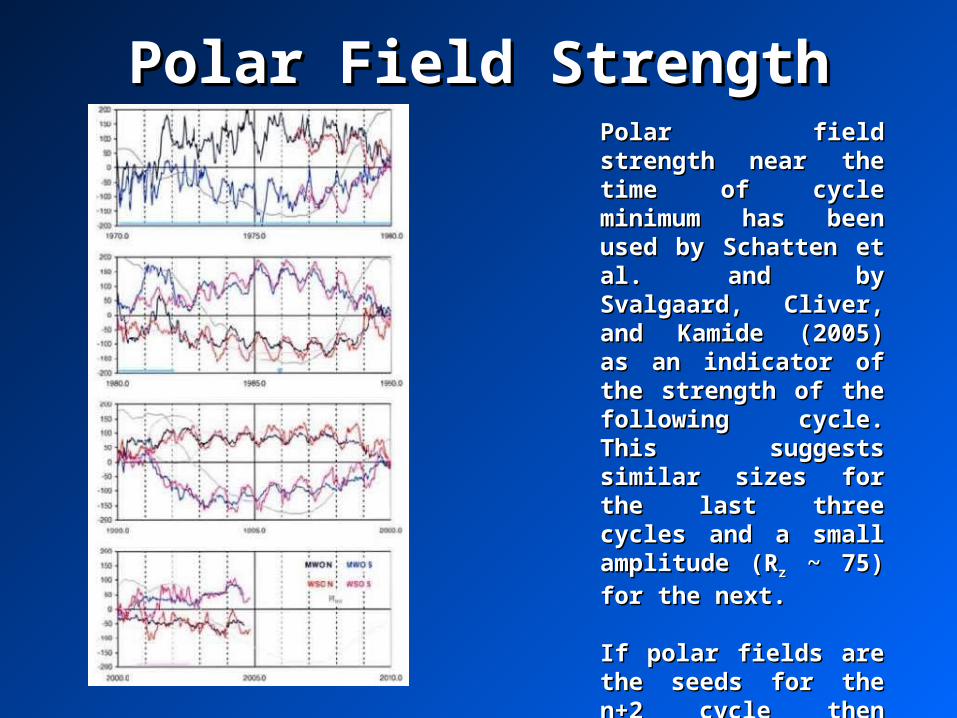
Polar Field StrengthPolar Field StrengthPolar field strength near Polar field strength near the time of cycle the time of cycle minimum has been used minimum has been used by Schatten et al. and by by Schatten et al. and by Svalgaard, Cliver, and Svalgaard, Cliver, and Kamide (2005) as an Kamide (2005) as an indicator of the strength indicator of the strength of the following cycle. of the following cycle. This suggests similar This suggests similar sizes for the last three sizes for the last three cycles and a small cycles and a small amplitude (Ramplitude (Rzz ~ 75) for ~ 75) for
the next.the next.
If polar fields are the If polar fields are the seeds for the n+2 cycle seeds for the n+2 cycle then cycle 24 should be then cycle 24 should be like the last two and like the last two and cycle 25 should be cycle 25 should be small.small.
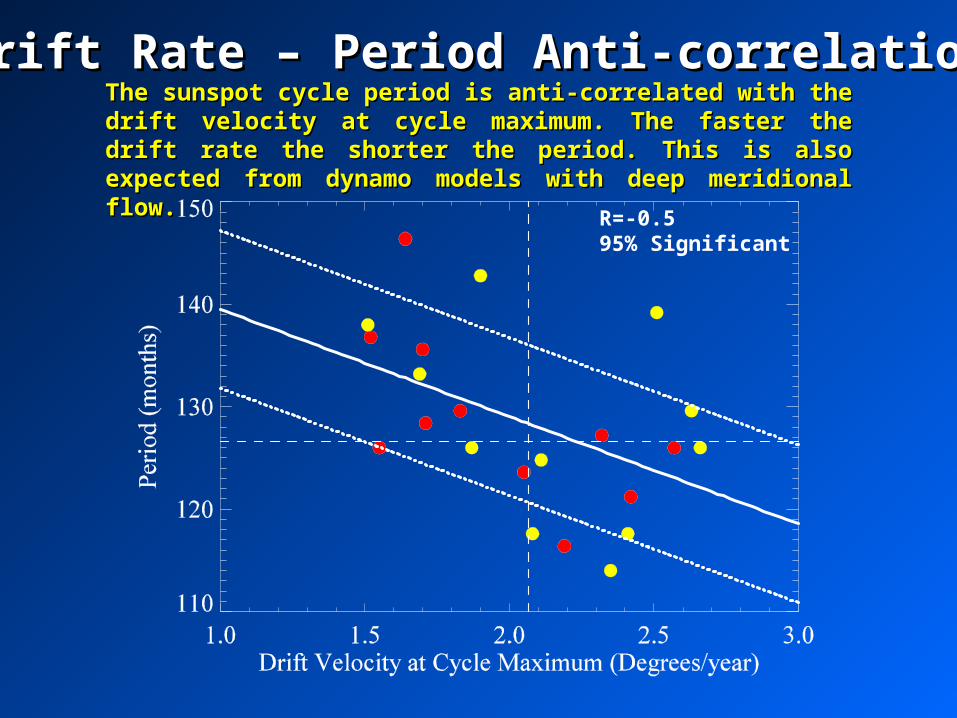
The sunspot cycle period is anti-correlated with the drift velocity The sunspot cycle period is anti-correlated with the drift velocity at cycle maximum. The faster the drift rate the shorter the period. at cycle maximum. The faster the drift rate the shorter the period. This is also expected from dynamo models with deep meridional This is also expected from dynamo models with deep meridional flow.flow.
R=-0.595% Significant
Drift Rate – Period Anti-correlationDrift Rate – Period Anti-correlation
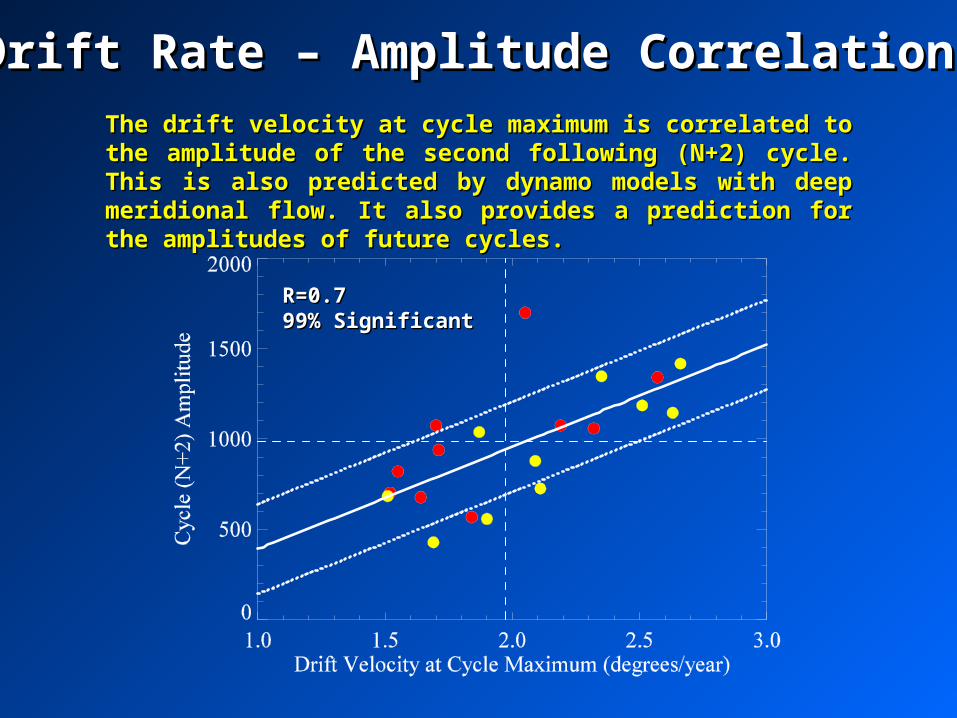
The drift velocity at cycle maximum is correlated to the amplitude The drift velocity at cycle maximum is correlated to the amplitude of the second following (N+2) cycle. This is also predicted by of the second following (N+2) cycle. This is also predicted by dynamo models with deep meridional flow. It also provides a dynamo models with deep meridional flow. It also provides a prediction for the amplitudes of future cycles.prediction for the amplitudes of future cycles.
R=0.7R=0.799% Significant99% Significant
Drift Rate – Amplitude CorrelationsDrift Rate – Amplitude Correlations
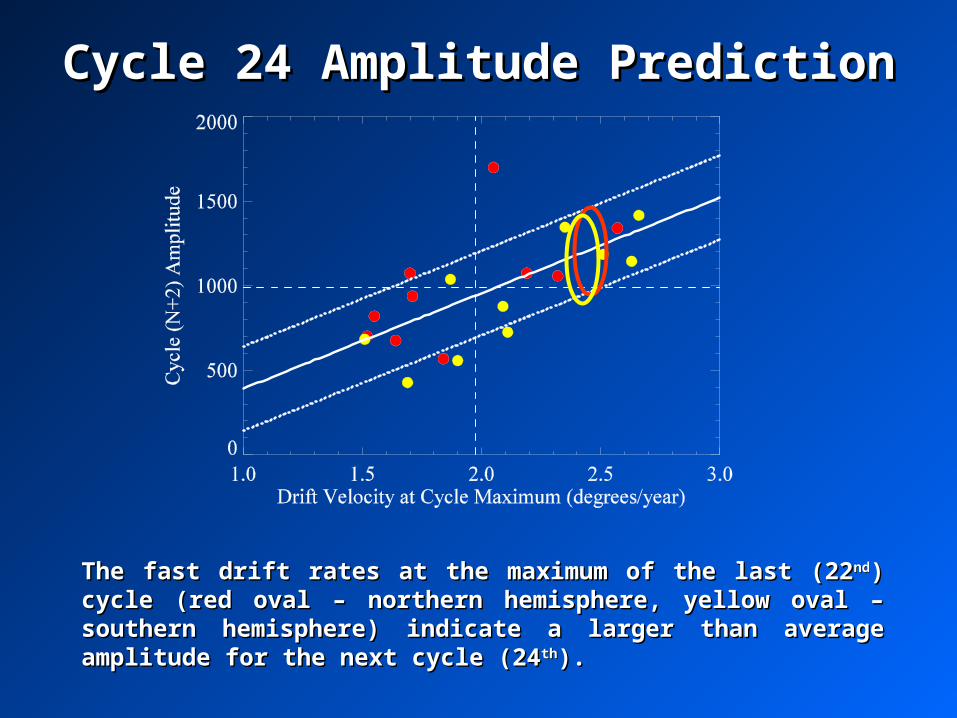
Cycle 24 Amplitude PredictionCycle 24 Amplitude Prediction
The fast drift rates at the maximum of the last (22The fast drift rates at the maximum of the last (22ndnd) cycle (red oval – ) cycle (red oval – northern hemisphere, yellow oval – southern hemisphere) indicate a northern hemisphere, yellow oval – southern hemisphere) indicate a larger than average amplitude for the next cycle (24larger than average amplitude for the next cycle (24thth).).
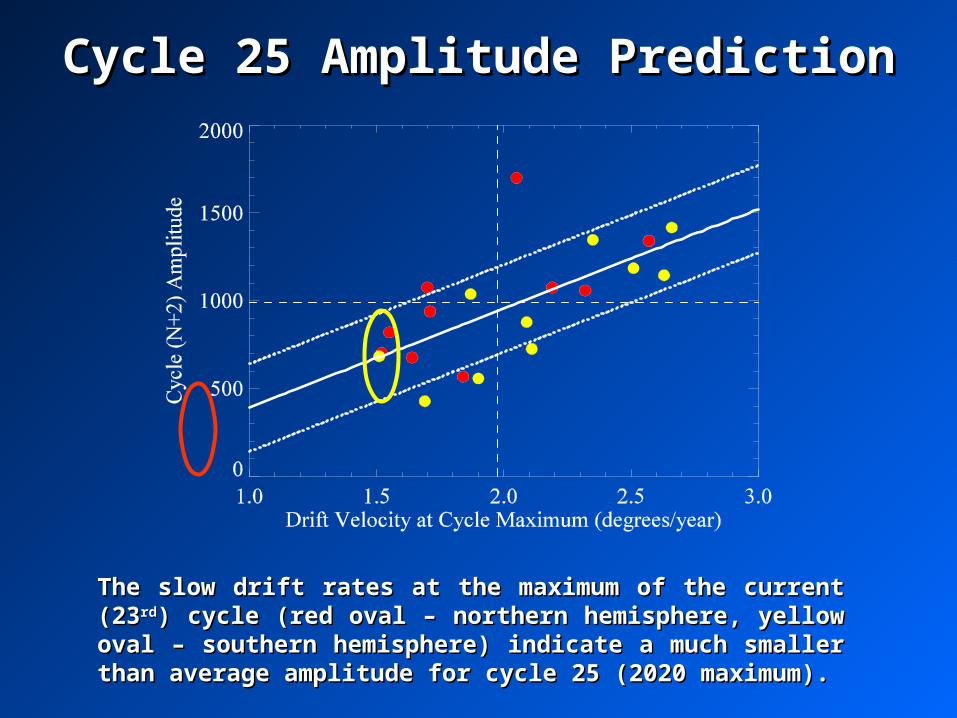
The slow drift rates at the maximum of the current (23The slow drift rates at the maximum of the current (23rdrd) cycle ) cycle (red oval – northern hemisphere, yellow oval – southern (red oval – northern hemisphere, yellow oval – southern hemisphere) indicate a much smaller than average amplitude for hemisphere) indicate a much smaller than average amplitude for cycle 25 (2020 maximum).cycle 25 (2020 maximum).
Cycle 25 Amplitude PredictionCycle 25 Amplitude Prediction
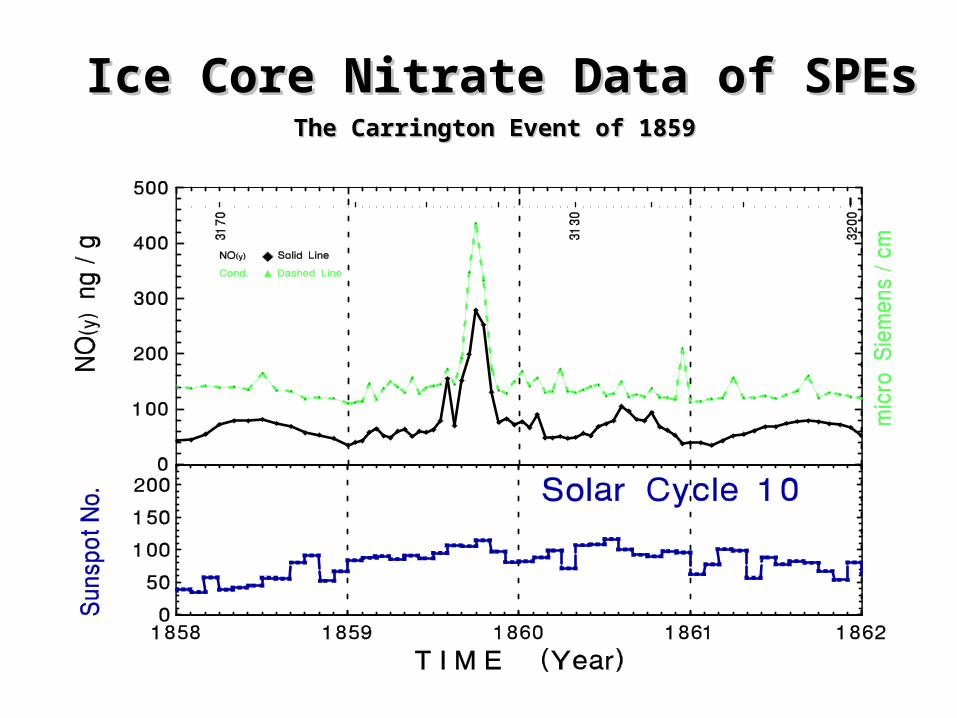
Ice Core Nitrate Data of SPEsIce Core Nitrate Data of SPEsThe Carrington Event of 1859The Carrington Event of 1859
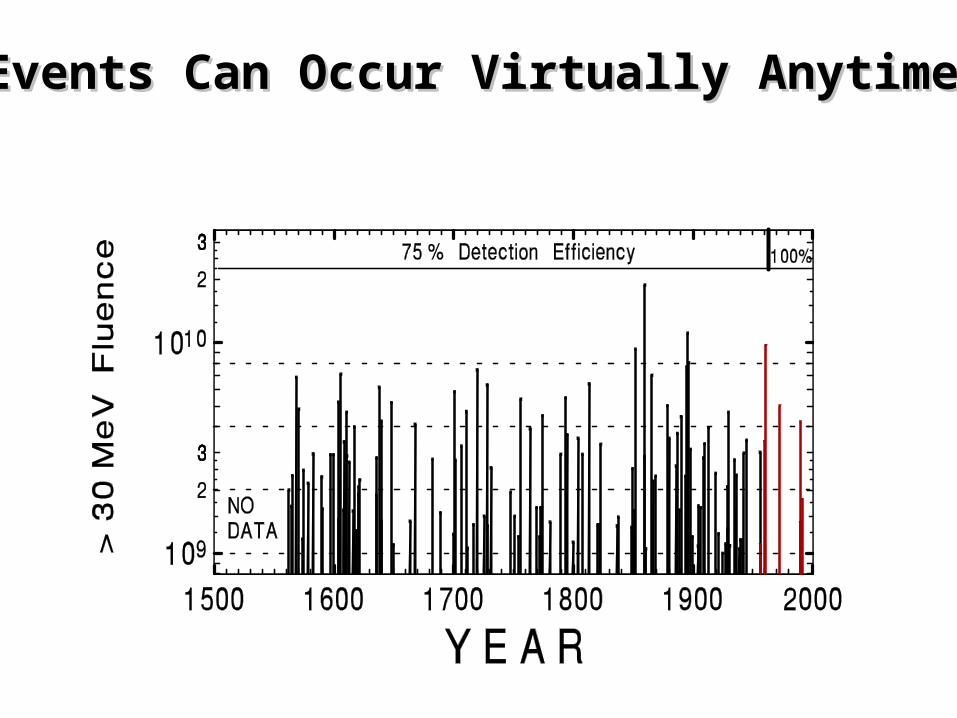
Events Can Occur Virtually AnytimeEvents Can Occur Virtually Anytime
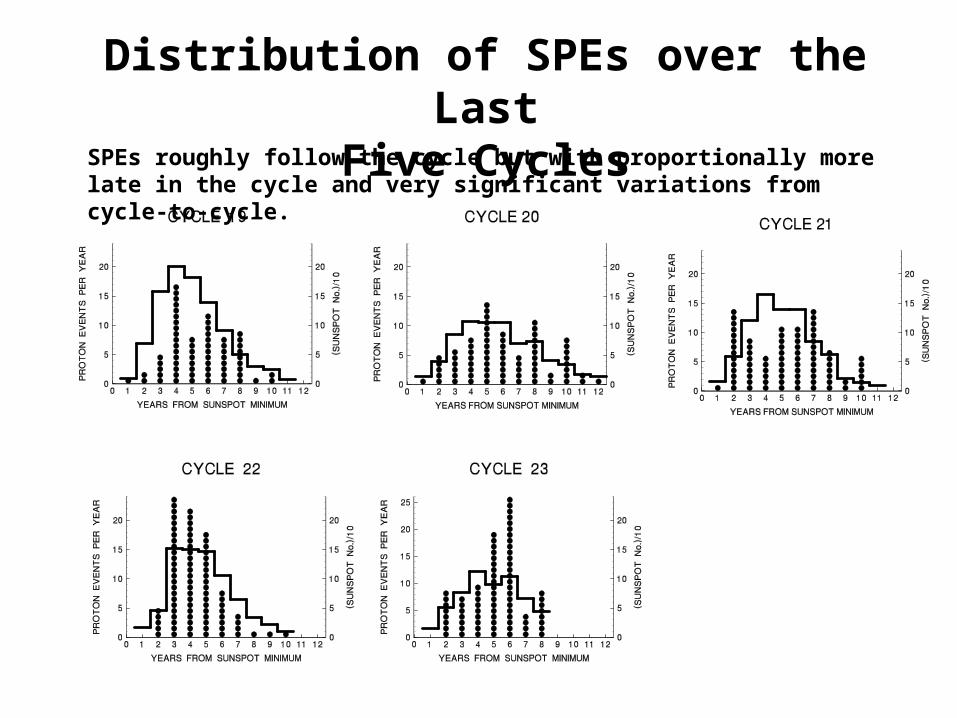
Distribution of SPEs over the LastFive Cycles
SPEs roughly follow the cycle but with proportionally more late in the cycle and very significant variations from cycle-to-cycle.
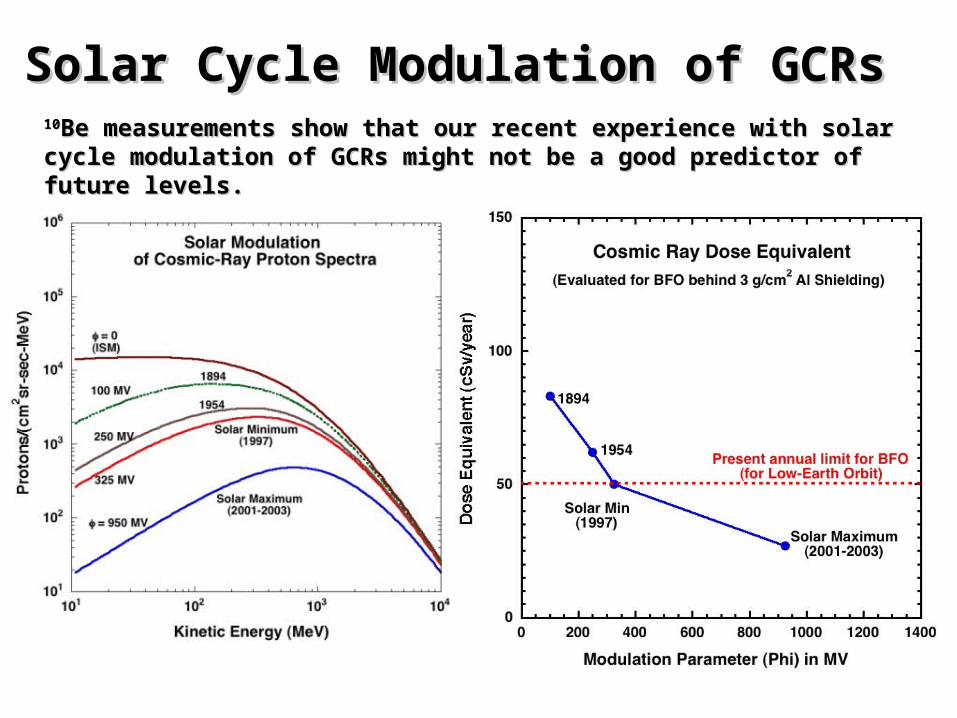
Solar Cycle Modulation of GCRsSolar Cycle Modulation of GCRs1010Be measurements show that our recent experience with solar cycle Be measurements show that our recent experience with solar cycle modulation of GCRs might not be a good predictor of future levels.modulation of GCRs might not be a good predictor of future levels.
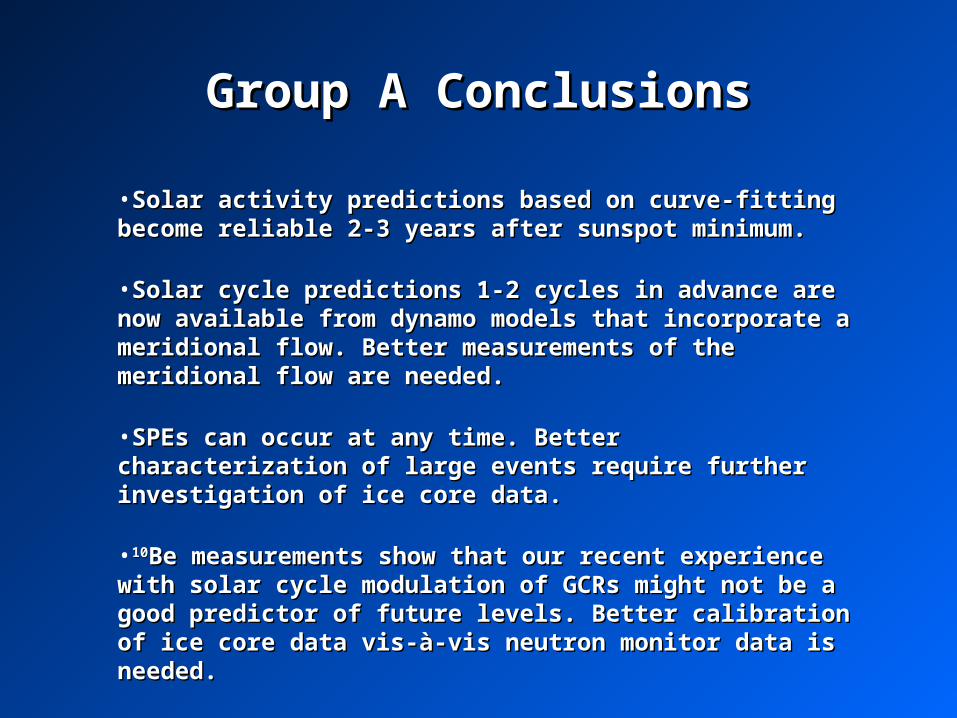
Group A ConclusionsGroup A Conclusions
•Solar activity predictions based on curve-fitting become reliable Solar activity predictions based on curve-fitting become reliable 2-3 years after sunspot minimum.2-3 years after sunspot minimum.
•Solar cycle predictions 1-2 cycles in advance are now available Solar cycle predictions 1-2 cycles in advance are now available from dynamo models that incorporate a meridional flow. Better from dynamo models that incorporate a meridional flow. Better measurements of the meridional flow are needed.measurements of the meridional flow are needed.
•SPEs can occur at any time. Better characterization of large SPEs can occur at any time. Better characterization of large events require further investigation of ice core data.events require further investigation of ice core data.
•1010Be measurements show that our recent experience with solar Be measurements show that our recent experience with solar cycle modulation of GCRs might not be a good predictor of cycle modulation of GCRs might not be a good predictor of future levels. Better calibration of ice core data vis-à-vis neutron future levels. Better calibration of ice core data vis-à-vis neutron monitor data is needed.monitor data is needed.