Prediction of WISC-III Scores from the Iowa Tests of Basic ...
92
Eastern Illinois University e Keep Masters eses Student eses & Publications 1995 Prediction of WISC-III Scores from the Iowa Tests of Basic Skills and the Cognitive Abilities Test in Order to Predict Premorbid Cognitive Functioning in Children with Traumatic Brain Injury Kent A. Riley Eastern Illinois University is research is a product of the graduate program in School Psychology at Eastern Illinois University. Find out more about the program. is is brought to you for free and open access by the Student eses & Publications at e Keep. It has been accepted for inclusion in Masters eses by an authorized administrator of e Keep. For more information, please contact [email protected]. Recommended Citation Riley, Kent A., "Prediction of WISC-III Scores from the Iowa Tests of Basic Skills and the Cognitive Abilities Test in Order to Predict Premorbid Cognitive Functioning in Children with Traumatic Brain Injury" (1995). Masters eses. 2276. hps://thekeep.eiu.edu/theses/2276
Transcript of Prediction of WISC-III Scores from the Iowa Tests of Basic ...

Eastern Illinois UniversityThe Keep
Masters Theses Student Theses & Publications
1995
Prediction of WISC-III Scores from the Iowa Testsof Basic Skills and the Cognitive Abilities Test inOrder to Predict Premorbid Cognitive Functioningin Children with Traumatic Brain InjuryKent A. RileyEastern Illinois UniversityThis research is a product of the graduate program in School Psychology at Eastern Illinois University. Findout more about the program.
This is brought to you for free and open access by the Student Theses & Publications at The Keep. It has been accepted for inclusion in Masters Thesesby an authorized administrator of The Keep. For more information, please contact [email protected].
Recommended CitationRiley, Kent A., "Prediction of WISC-III Scores from the Iowa Tests of Basic Skills and the Cognitive Abilities Test in Order to PredictPremorbid Cognitive Functioning in Children with Traumatic Brain Injury" (1995). Masters Theses. 2276.https://thekeep.eiu.edu/theses/2276

Prediction of WISC-III Scores from the Iowa Tests of Basic Skills
and the Cognitive Abilities Test in order to Predict Premorbid
Cognitive Functioning in Children with Traumatic Brain Injury
(TITLE)
BY
Kent A. Riley
THESIS
SUBMITTED IN PARTIAL FULFILLMENT OF THE REQUIREMENTS
FOR THE DEGREE OF
Specialist in School Psychology
IN THE GRADUATE SCHOOL, EASTERN ILLINOIS UNIVERSITY
CHARLESTON, ILLINOIS
1995 YEAR
I HEREBY RECOMMEND THIS THESIS BE ACCEPTED AS FULFILLING
THIS PART OF THE GRADUATE DEGREE CITED ABOVE
1- c2 L~ 9, <)' DATE

ABSTRACT
The present study examined the relationship of the Iowa
Tests of Basic Skills, Form J (ITBS-J) and the Cognitive
Abilities Test, Form 4 (CogAT-4) with the Wechsler
Intelligence Scale for Children, Third Edition (WISC-III)
in order to establish a better method for predicting
premorbid intellectual functioning in children with
Traumatic Brain Injury (TBI) aged 6 through 11 years. The
subjects included 73 children in grades one through six
from four elementary schools within a rural city in
southeastern Illinois. The results of the study supported
all six hypotheses: The CogAT-4 and ITBS-J significantly
predicted the variability observed in WISC-III scores; the
ITBS-J Vocabulary, Reading, and Language Skills Composites
correlated moderately with WISC-III VIQ, FSIQ, and VCI;
the Mathematics Composite of the ITBS-J correlated
moderately with the WISC-III VIQ and FSIQ; the CogAT-4
Verbal and Quantitative scores correlated moderately with
WISC-III VIQ and FSIQ; the CogAT-4 Nonverbal score
correlated moderately with the WISC-III PIQ; and lastly,
the combination of the ITBS-J Composites along with the
CogAT-4 scores better predicted WISC-III FSIQ by
accounting for more total variance than either of the
tests alone. Regression equations and standard error of
estimates are offered for predicting WISC-III VIQ, PIQ,
and FSIQs, and VCI, POI, FDI and PSI Factor scores from
the CogAT-4 and ITBS-J together, and the ITBS-J alone with
i

children in grades one through six, aged 6 through 11
years, and with children in grades two through six, aged 7
through 11 years. Separate regression equations and
standard error of estimates are presented for predicting
WISC-III VIQ, PIQ, and FSIQs, and VCI, POI, FDI and PSI
Factor scores from the CogAT-4 alone for children in
grades one through six, aged 6 through 11 years. Overall,
the results of the present study suggest that using the
CogAT-4 and/or the ITBS-J to predict the various WISC-III
scores is the best method currently available with which
to predict premorbid cognitive functioning in children of
this grade and age range, from this area, suspected of
having a loss of functioning as a result of TBI.
ii

ACKNOWLEDGEMENTS
First, I would like to thank Jeannie Walters,
Assistant Superintendent in charge of curriculum and
instruction for her assistance in obtaining the ITBS-J and
CogAT-4 scores from school records while preserving
confidentiality for all. Without her help, this study
would not have been possible.
I would like to thank Dr. Timothy Richards of the
Riverside Publishing Company for all of the complementary
materials that he sent me. His prompt assistance and
support was very welcome. I would also like to thank Dr.
H. D. Hoover, Professor, at the University of Iowa for the
information he gave me and the manual that he sent me.
Both of these gentlemen were extremely helpful.
Of course, I would like to thank Dr. Judy Oehler
Stinnett, Dr. Terry Stinnett, and Dr. Michael Havey for
their direction, assistance, and encouragement. Special
thanks go to Dr. Judy Oehler-Stinnett, my Chairperson, for
all of the time and effort that she devoted to helping me
with this large project.
Lastly, I would like to thank Linda Shroyer for her
support, friendship, and patience. Throughout my graduate
studies, when times were tough, she offered me needed
encouragement. She listened to my pontifications and read
my papers all along the way. With regard to this project,
she heard about, read, and critiqued, sections of this
manuscript several times.
iii

TABLE OF CONTENTS
Abstract... . . . . . . . . . . . . . . . . . . . . . . . . . . . . . . . . . . . . . . . . . . i
Acknowledgements ..................................... iii
Table of Contents. . . . . . . . . . . . . . . . . . . . . . . . . . . . . . . . . . . . iv
List of Tables....................................... v
Introduction. . . . . . . . . . . . . . . . . . . . . . . . . . . . . . . . . . . . . . . . . 1
Literature Review. . . . . . . . . . . . . . . . . . . . . . . . . . . . . . . . . . . . 9
Predicting Premorbid Functioning in Children.... 9
Neuropsychological Assessment of TBI in Children 13
Intelligence and Achievement .................... 18
WISC-R Correlations with Achievement Measures ... 23
Correlations between the CogAT and ITBS-G ....... 27
Factor Analysis of the CogAT-4 and ITBS-G ....... 29
Correlations between the WISC-R/III and the ITBS 31
Hypotheses. . . . . . . . . . . . . . . . . . . . . . . . . . . . . . . . . . . . . . 34
Method............................................... 35
Subjects ........................................ 35
Procedures. . . . . . . . . . . . . . . . . . . . . . . . . . . . . . . . . . . . . . 37
Data Analyses................................... 38
Results .......................... "................... 40
Discussion. . . . . . . . . . . . . . . . . . . . . . . . . . . . . . . . . . . . . . . . . . . 66
References. . . . . . . . . . . . . . . . . . . . . . . . . . . . . . . . . . . . . . . . . . . 7 5
Appendix . . . . . . . . . . . . . . . . . . . . . . . . . . . . . . . . . . . . . . . . . . . . . 8 2
iv

Table
1
2
3
LIST OF TABLES
Means, Standard Deviations, Minimums,
Maximums, and Number of Subjects ........ 40
Correlations of All Variables Including
WTotal from ITBS-J Grades 2 through 6 .. 42-44
Correlations of All Common Variables
Throughout Age Range Grades
1 through 6. . . . . . . . . . . . . . . . . . . . . . . . . . . . . 46-48
4 Stepwise Multiple Regressions with Scores
from CogAT-4 and ITBS-J Including WTotal
from ITBS-J Grades 2 through 6 ......... 52-53
5 Stepwise Multiple Regressions with Scores
from CogAT-4 and ITBS-J Excluding WTotal
from ITBS-J Grades 1 through 6 ......... 54-55
6 Stepwise Multiple Regressions with Scores
from ITBS-J Only Including WTotal
Grades 2 through 6 ...................... 57-58
7 Stepwise Multiple Regressions with Scores
from ITBS-J Only Excluding WTotal
Grades 1 through 6 ...................... 60-61
8 Stepwise Multiple Regressions with Scores
from CogAT-4 Only Grades 1 through 6 ... 63-64
v

CHAPTER I
Introduction
Prediction of WISC-III Scores from the Iowa Tests of
Basic Skills and the Cognitive Abilities Test in order
to Predict Premorbid Cognitive Functioning in Children
with Traumatic Brain Injury
In the event that a child aged 7-11 were to become
brain-injured, it is likely that there would be no
adequate measure of pre-morbid cognitive functioning
available to help determine how much and what kind of
functioning was previously present, then compromised.
1
That is, no formal pre-morbid information would be
available to establish a neuropsychological framework from
which to determine the degree of impairment within
different cognitive domains.
The various Wechsler scales are considered by many to
be a valuable component in t~e neuropsychological
assessment of brain-injured individuals (Sattler, 1992).
However, because individually administered intelligence
tests are not routinely given to children, the
determination of pre-morbid levels of intellectual
functioning in children with brain injuries would be left
to informal estimation. If, on the other hand, group
administered measures of achievement and cognitive
functioning could be used to predict performance on the
individually administered intelligence tests used in
neuropsychological assessment, pre-morbid levels of

2
intellectual functioninq/processinq in different coqnitive
domains could be more closely approximated than is
currently possible. The typical qroup administered tests
given in the immediate area include the Iowa Tests of
Basic Skills, Form J (ITBS-J; Hieronymus, Hoover,
Linquist, Oberley, and Cantor, 1990) and the Cognitive
Abilities Test, Form 4 (CogAT-4; Thorndike and Hagen,
1986). After a comprehensive literature search, no
information was found correlatinq the Wechsler
Intelligence Scale for Children, Third Edition {WISC-III;
Wechsler, 1991) or Wechsler Intelliqence Scale for
Children, Revised (WISC-R; Wechsler, 1974) intelligence
quotients (IQs) and/or Factor Index Scores with the
standard ITBS-J composite scores or the CogAT-4.
Therefore, the necessary correlation coefficients are not
available with which to systematically or statistically
predict cognitive functioning as would be measured by the
WISC-III intelligence test.
The purpose of this study is to determine whether
WISC-III scores can be predicted from ITBS and CogAT
scores in order to have an estimate of premorbid cognitive
functioning if needed. Scores to be predicted include the
WISC-III Full-Scale IQ (FSIQ), Verbal IQ (VIQ),
Performance IQ (PIQ), as well as the WISC-III Verbal
Comprehension Index (VCI), Perceptual Organization Index
(POI), Freedom from Distractibility Index (FDI), and
Processing Speed Index (PSI) Factor scores. Common ITBS-J
3
composite scores and CogAT-4 Verbal, Nonverbal, and
Quantitative scores will be used as predictors. Further,
if adequate predictive power is established empirically,
by this study, it will enable school psychologists, in
collaboration with attending physicians and/or
neuropsychologists, to better determine eligibility for
special education services under the category "Traumatic
Brain Injury," (TBI) which is now recognized by the
Individuals with Disabilities Education Act (IDEA) (1990;
1992), and the various states, including the State of
Illinois (23 Illinois Administrative Code, 1994), as a
condition which undermines a child's ability to benefit
from free and appropriate education.
as:
The most recent revision of IDEA (1992) redefines TBI
. . . an acquired injury to the brain caused by an
external physical force, resulting in total or
partial functional disability or psychosocial
impairment, or both, that adversely affects a child's
educational performance. The term applies to open or
closed head injuries resulting in impairments in one
or more areas, such as cognition; language; memory;
attention; reasoning; abstract thinking; judgment;
problem solving; sensory, perceptual, and motor
abilities; psychosocial behavior; physical functions;
information processing; and speech. The term does
not apply to brain injuries that are congenital or

degenerative, or brain injuries induced by birth
trauma (p. 44802).
4
The school psychologist armed with this predictive
ability could help provide the neuropsychologist with
needed information which could better establish premorbid
functioning in the event that a child in this age range
were to become brain-injured. Then, before the child
returns to school, the school psychologist could make the
determination as to whether the child meets eligibility
requirements for TBI based upon his or her own
psychoeducational assessment, utilizing the predicted
premorbid WISC-III scores compared to the post-injury
scores on the same test. Score differences could be used
to determine the degree of loss of functioning in the
different areas of cognitive functioning addressed by the
WISC-III IQs and Factor Index Scores.
Wechsler Scales. The Wechsler Adult Intelligence
Scale, Revised (WAIS-R; Wechsler, 1981) is widely used
across the nation as part of a battery of tests for the
neuropsychological assessment of adults (Kaplin, Fein,
Morris, & Delis, 1991; Sattler, 1992). Being the latest
revision of the Wechsler Intelligence Scales for Children,
the WISC-III (Wechsler, 1991) replaced the WISC-R
(Wechsler, 1974), which was considered by many to be an
extremely valuable component in the neuropsychological
assessment of children aged 6-16 (Sattler, 1992).
Collectively, the Wechsler scales provide a broad

5
standardized measure of various cognitive abilities which
can be useful in evaluating brain-injured children and
adults (Kaplin, Fein, Morris, & Delis, 1991; Sattler,
1992).
The WISC-III is an individually-administered clinical
instrument useful in assessing cognitive abilities in
children aged 6 years 0 months to 16 years 11 months
across two broad scales: Verbal and Performance
(Wechsler, 1991). It also yields an overall FSIQ as well
(Wechsler). Its value in helping make diagnostic and
classification decisions is well documented (Little, 1992;
Witt & Gresham, 1985). In fact, many people believe that
the WISC-III will be like its predecessor, the WISC-R,
with which it shares approximately 73% of its items, and
also which was the most preferred IQ test for the
assessment of children (Sattler, 1992; Little, 1992).
The WISC-III also yields four Factor IQs. These are
the Verbal Comprehension Index (VCI), the Perceptual
Organization Index (POI), the Freedom from Distractibility
Index (FDI), and the Processing Speed Index (PSI)
(Wechsler, 1991). Considerable debate exists as to the
validity of the FDI Factor; in fact, Sattler (1992) and
Little (1992) both decry the use of this factor because it
lacks adequate specific variance, only 2-3%. However, the
relationship among these factors and performance on the
ITBS and CogAT may be relevant to the present study.

6
CogAT. All children in a southeastern rural
community in Illinois through grade nine are given the
CogAT on a biannual basis. The CogAT-4 is a group
administered measure of abilities which is given to
children in this area in the first, third, fifth, seventh,
and ninth grades. The CogAT-4 measures Verbal abilities,
Quantitative abilities, and Nonverbal abilities in
children from kindergarten through grade 12 (Anastasi,
1989). There are two different levels of the test:
a Primary Battery for kindergarten through grade 3, and a
Multilevel Edition for grades 3 through 12 (Thorndike &
Hagen, 1987).
The Primary Battery consists of six subtests from
three domains: Oral Vocabulary and Verbal Classification
from the Verbal domain, Relational Concepts and
Quantitative Concepts from the Quantitative domain, and
Figure Classification and Matrices from the Nonverbal
domain (Fuchs, 1989). The Multilevel Battery consists of
nine subtests from three domains: Sentence Completion,
Verbal Analogies, and Verbal Classification from the
Verbal domain; Equation Building, Number Series, and
Quantitative Relations from the Quantitative domain; and
Figure Analogies, Figure Analysis, and Figure
Classification from the Nonverbal domain (Fuchs; Thorndike
& Hagen, 1986). This test was standardized jointly with
the ITBS-G in 1984/85, and one stated purpose of this test
by the authors, is to allow users to compare performance

on this test to the ITBS "helping to identify those
students whose achievement deviates significantly from
their level of cognitive development (Thorndike & Hagen,
1987, p. 14).
7
Some general characteristics of the CogAT-4 are that
it includes tasks which are generated from content to
which children of a particular age group have been
typically exposed, and that it requires children to apply
this content in a new way to solve a novel problem. The
Primary Battery is entirely a power t~st, but the
Multilevel Edition is also a speed test (Thorndike &
Hagen, 1987). Scores are reported in five different ways,
including percentile ranks and stanine scores by age or
grade, and Standard Age Scores (SASs) with a mean of 100
and a standard deviation of 16 (Thorndike & Hagen).
ITBS. Within this same southeastern rural community
in Illinois, all children through grade nine are given the
group administered, ITBS-J on a yearly basis.
Consequently, current individual achievement data are
maintained on all children within this locale. According
to Dr. Timothy Richards of the Riverside Publishing
Company (publishers of the ITBS), many communities within
Illinois use the ITBS in one form or another to regularly
monitor the academic achievement of children in their
respective areas (personal communication, February 21,
1994).
The ITBS-J is a group-administered achievement test

8
that is designed to provide a measure of growth in the
fundamental skills: vocabulary, reading, writing
mechanics, study methods, and mathematics (Hieronymus &
Hoover, 1986). Form J of the ITBS was developed and
equated to Forms G and H in a 1987/88 nationwide sample of
32 schools; from this effort, new norms were developed for
Forms G, H, and J, establishing them as alternate forms of
the same test, and reflecting a nationwide trend toward
increased achievement (Hieronymus, Hoover, Frisbie, &
Dunbar, 1990; Lane, 1992). The composites common to the
ITBS-J from grade one through grade six include a
Vocabulary, Reading Comprehension, Language Skills, and
Mathematics Skills Composite, a Basic Composite, and a
Complete Composite (Hieronymus et al., 1990). A Work
Study Skills Composite is also available for children
beginning in the second grade. The ITBS-J also has two
optional subtests: Social Studies and Science (Hieronymous
et al.). Four subtests comprise Language Skills:
Spelling, Capitalization, Punctuation, and Usage and
Expression; two subtests comprise Work-Study Skills:
Visual Materials and Reference Materials; three subtests
define Mathematics Skills: Mathematics Concepts,
Mathematics Problem Solving, and Mathematics Computation
(Hieronymus et al., 1990).
The WISC-III is an individually administered general
cognitive instrument useful for making diagnostic and
classification decisions. It has a Verbal Scale, a

9
Performance Scale, and a subtest that measures facility in
mental arithmetic. The CogAT-4 is a group administered
general cognitive instrument that has Verbal,
Quantitative, and Nonverbal components. Both of these
tests share common elements and require a child to apply
existing knowledge to solve novel problems. Therefore,
scores in like areas should correlate quite well. The
ITBS-J is a group administered achievement measure that
taps the fundamental skills developed in school age
children: vocabulary, reading, writing mechanics, study
methods, and mathematics. Because these skills may be
useful in problem solving, and because exposure to them in
school portray a common experience for the development of
children, scores in these areas should again, correlate
positively with scores on the WISC-III.
Literature Review
Predicting Premorbid Functioning in Children
Even though the peak incidence of TBI in the
population as a whole is highest for adolescents aged 15
to 24, the incidence was nearly as high in younger school
aged children (Kraus, 1987). After infancy, head injuries
occur in boys over girls two to one (Mira, Tucker, &
Tyler, 1992). Mira, Tucker, and Tyler (1992) report that
a small school district (of approximately 10,000 to 20,000
inhabitants) can expect several children who will suffer a
TBI each year, and large school districts (with over
100,000 inhabitants) can anticipate over 100 such cases

10
each year. The long-term cognitive sequelae of TBI may
include deficits in memory, attention, intellect,
language, and higher level problem solving skills {Mira,
Tucker, & Tyler). The academic effects of TBI are
variable but some more common sequelae include impaired
mathematics reasoning and computational skills and
deficits in reading comprehension, complements of
foundational deficits in higher level cognitive skills,
memory, and general mental processing {Mira, Tucker, &
Tyler). With the proliferation of skateboarding and
sidewalk roller-blading among school-aged children, along
with the lack of mandatory helmet use, the incidence of
TBI could well be on the increase.
In the neuropsychological assessment of children with
TBI, it is considered very important to establish the
premorbid levels of intellectual functioning (Donders,
1993; Reynolds and Gutkin, 1979; Klesges, 1982). Because
premorbid, individually administered test scores are not
usually available, intellectual levels must be inferred
from many varied and subjective sources {Klesges).
Premorbid knowledge levels are related to prognosis.
Individuals with greater knowledge stores have shown to be
more resistant to the negative effects of TBI; that is,
previous learning has shown to provide some protection
against the disruptive consequences of subsequent brain
damage {Begali, 1992). Further, well-learned skills tend
to be spared in cases of TBI, and it has been proposed

11
that better educated children have a better proqnosis for
recovery and a greater ability to benefit from remediation
(Begali).
Reynolds and Gutkin (1979) conducted a study to
establish a regression equation for the prediction of
premorbid levels of intellectual functioning in children
using demographic variables as predictors. WISC-R VIQ,
PIQ, and FSIQ were to be predicted by such demographic
variables as father's occupational status, sex, race,
urban vs. rural residence, and geographical area of
residence (Reynolds and Gutkin). This procedure
previously had been tried with reasonable success with
adults.
Information from the WISC-R standardization data was
used to generate the data. The authors reported that the
father's occupation was the most powerful predictor of IQ
for children, and the multiple correlations between the
five demographic variables and the WISC-R IQs were: VIQ, R
= .44; PIQ, R = .37; and FSIQ, R = .44 (Reynolds and
Gutkin, 1979). The authors acknowledged that the variance
accounted for was very small but pointed out the necessity
of having a systematic and quantifiable method of
determining premorbid intellectual functioning in
assessing children with TBI.
Subsequently, Klesges and Sanchez (1981) assessed the
utility of the Reynolds and Gutkin procedure with two
clinical samples. The correlations that they found

12
between the formulae and the prediction of actual VIQ,
PIQ, and FSIQ were statistically nonsignificant: .19,
.13, and .18 for the normal group, and .18, .19, and .18
for the organic group (Klesges and Sanchez}.
Klesges (1982} conducted another study to further
assess the utility of the Reynolds and Gutkin model with
35 normal and 26 brain-injured children to obtain a sample
of "clinically relevant" data from children from middle
income families. For the normal group, the results
between the actual WISC-R VIQ, PIQ, and FSIQ using the
Reynolds and Gutkin equation for prediction were .14, .13,
and .14 respectively. The results for the organic group,
were .09, .04, and .07 respectively (Klesges}. All
correlations were nonsignificant. The author concluded
that the formulae may not significantly correlate with
actual IQs with primarily caucasian middle-income
families, and the formulae could not differentiate between
brain-injured and normal children.
Interestingly, the formulae described above were
effective in predicting the VIQ, PIQ, and FSIQ with adults
(Wilson et al., 1978}. Wilson et al. were able to account
for between 42\ and 54\ of the variance in IQs with this
method. IQ level in children, however, is largely subject
to maturational, educational, and developmental influences
(Sattler, 1992). Townes, Trupin, Martin, and Goldstein
(1980) reported high correlations between
neuropsychological tests and the level of academic

13
achievement in children. For purposes of predicting
premorbid intellectual functioning in children as measured
by the WISC-III, a more direct route might be through
existing achievement measures.
Neuropsychological Assessment of TBI in Children
Following closed-head injury, several postconcussion
symptoms should be evaluated in children. The three most
important are the somatic, cognitive, and affective
dimensions (Ruff, Levin, & Marshall, 1986). These
encompass several physical functions, mental abilities,
and the intensity and stability of emotions (Ruff, Levin,
& Marshall). A neurological assessment, a
neuropsychological assessment, and a personality
assessment are recommended to address these concerns
respectively (Ruff, Levin, & Marshall). A cursory in
office mental status examination is insufficient to
determine the subtle attentional and memory deficits which
may follow a closed-head injury. However, the ability to
understand instructions and follow complex directions can
be informally assessed in the context of the office (Ruff,
Levin, & Marshall).
There are two basic approaches to neuropsychological
assessment: A fixed test battery to be administered to a
large group of patients with a heterogeneous group of
presenting problems, or a specialized approach where
specific tests are given based upon the areas of the brain
believed to be most affected by the trauma (Ruff, Levin, &

14
Marshall, 1986).
Following TBI, different individuals have different
recovery curves in each of the three previously mentioned
domains of impairment. In minor head-injury cases, the
cognitive area has shown to demonstrate the greatest
increments in recovery during the first 4 to 6 weeks after
coma, although this process may continue for a
considerable period of time. Neuropsychological
assessments using the WISC-R and neuropsychological test
batteries such as the Halstead-Reitan are common and are
considered to be valuable components in the assessment and
diagnosis of TBI in head-injured children {Ruff, Levin, &
Marshall).
Ruff, Levin, and Marshall (1986) report that
attention-concentrational skills, visuomotor functioning,
memory abilities, and emotional status are the most
salient cognitive elements in the identification of
individuals "at risk" for school or employment failure as
a result of minor head injury, and they point to a need
for more lengthy assessment procedures if accurate
discriminations between normal and mildly impaired
patients are to be made. They also propose that better
methods of establishing premorbid functioning are needed
{Ruff, Levin, & Marshall).
In a recent survey of practicing neuropsychologists,
to determine the neuropsychological assessment instruments
most commonly used with respect to different age groups,

15
it was found that, with children, the most frequently
reported tests used were the WISC/WISC-R, followed by the
WRAT/WRAT-R, the Halstead-Reitan Neuropsycholoqical
Battery Trailmakinq subtest, the Finqer Oscillation Test,
and the Halstead Cateqory Test in the respective order of
preference and actual clinical use (Sellers & Nadler,
1992). The authors reported that the respondents' use of
fixed batteries has decreased in recent years in favor of
selective testinq as described above. However, the use of
the WISC/WISC-R was reported in a full 100\ of all cases.
Of the neuropsycholoqical test batteries currently
available, the Halstead-Reitan was reported to be the
pref erred instrument from which to draw a number of
individual subtests dependinq on the presentinq problems
(Sellers & Nadler).
Shurtleff, Fay, Abbott, and Berninqer (1988)
evaluated individual subtests of the Halstead-Reitan
Battery for Older Children and individual subtests of the
WISC-R in predictinq academic achievement as measured by
the WRAT-R and the Analytical Readinq Inventory (ARI).
The variance accounted for by these tests was reported
individually and in qroups with one subtest from each
respective instrument. The results indicated that
subtests of the Halstead-Reitan were correlated
siqnificantly with achievement in specific academic skills
(Shurtleff et al.). Further, the authors reported that
combininq a neuropsycholoqical subtest with a coqnitive

16
subtest increased the variance accounted for in such
academic areas as word decoding, reading comprehension,
and arithmetic over what was explained by either a
neuropsychological or cognitive subtest alone (Shurtleff
et al.).
The authors suggested that the Halstead-Reitan
Battery and the WISC-R may tap different levels of
functioning within the cortical systems (Shurtleff et al.,
1988). In example, they propose that the WISC-R
Vocabulary subtest "taps the lexical level" whereas "the
Halstead-Reitan Speech Perceptions Test taps the sub
lexical phonemic level within the language system"
(Shurtleff et al., p. 306). It should be noted that the
WISC-R was the all around best predictor of achievement in
all areas examined except ARI decoding, where the Speech
Sounds subtest of the Halstead-Reitan had an r~ of .29 and
the WISC~R Vocabulary subtest had an r~ of .28 (Shurtleff
et al.).
Donders (1993) conducted a study to determine WISC-R
subtest patterns in children with TBI. He feels that
overemphasis on VIQ, PIQ, and FSIQ may underestimate the
complexity of cognitive deficits in children with TBI.
Donders claims that WISC-R profiles may identify disorders
of visual-motor skills, speeded performance, and attention
which are among the most commonly reported deficits with
TBI. His results identified four clusters, two of which
were most distinctive. One group had a depressed ~IQ

17
(86.94) in the presence of a normal VIQ (98.81) as is
often seen after a closed-head injury. The most impaired
group identified displayed a VIQ of 75.53 and a PIQ of
72.05 (Donders). All scores were statistically compared
with the length of coma and other demographic information.
The lowest scoring group had depressed scores on all WISC
R tests, the longest duration coma, a lower socioeconomic
background as measured by parental occupation, and a high
proportion of children with a special education background
(Donders). The author suggested that pre-injury variables
may play an important role in test scores following TBI
(Donders). The author went on to say, "This underscores
the importance of considering premorbid characteristics
when evaluating outcome of pediatric TBI . . . " (p.
437).
It should be noted that in psychoeducational
assessments, individual test interpretation is not
recommended because the reliability of single or small
groups of subtests may not be high enough for such
diagnostic purposes (Sattler, 1992). Though individual
subtest scores may be indicative of specific strengths and
weaknesses, they may also display considerable within
child error variance. A more reliable approach to doing
profile analysis to determine cognitive deficits in
children with TBI might be to compare VIQ, PIQ, FSIQ, and
VCI, POI, FDI, and PSI factors.

18
Intelligence and Achievement
The nature of intelligence and the relationship
between achievement and intelligence has been, and
continues to be, a hotly contested subject between various
researchers, theorists, and philosophers {Wesman, 1968;
Kamphaus and Reynolds, 1987). In 1967, Alexander Wesman
delivered his presidential address to Division 5 of the
American Psychological Association on the issues of
intelligence, aptitude, achievement and the
interrelationships between them {1968). Wesman defined
intelligence as the totality of our experiential learning.
He talked about our species' ability to adapt by learning
via our interaction with our environment. He said that
with that learning, humans become somehow different in the
way that they re-engage their environment, largely as a
function of the previous learning. Higher level learning
then depends on previous learnings, and more complex
learning simply could not exist without the foundation of
earlier learning {Wesman).
Wesman (1968) said that traditionally, aptitude tests
were believed to measure what an individual can learn
whereas achievement tests are purported to measure that
which the individual has learned. The problem with this
is that what an individual has learned directly affects
what an individual can learn. All tests of ability-
intelligence, achievement, and aptitude--do, in fact,
measure what an individual has learned {Wesman). Wesman

19
claims that the type of test to be chosen in a given
situation simply depends upon the purpose for which
testing is occurring in the first place. If we are
testing to predict future broad learning across different
situations, we choose an intelligence test; if we are
testing to determine present broad learning (knowledge)
across different situations, we may choose an achievement
battery. He also stated that all of the different
measures of ability gauge their respective phenomenon
through similar test content and similar processes.
John Horn (1988), in a comprehensive work concerning
human abilities, proposed that distinguishing between
cognitive potential and the realization of that potential
(achievement) can be done in theory, but as these two
abilities are measured in the real world, "cognitive
abilities are achievements just as surely as they are
predictors of achievement" (p. 655). For example, verbal
ability is typically measured with vocabulary tests, and
vocabulary tests measure the understanding of words
(Horn). In the same vein, reading achievement is often
measured, in part, by looking at comprehension, and
comprehension also requires the understanding of words
(Horn). According to Horn, broad measures of achievement
correlate as much with broad measures of cognitive
abilities to the extent that their reliabilities will
allow. He further says that, empirically, the domain of
achievement is not significantly different from the domain

20
of cognitive abilities (Horn).
Horn (1988) refers to several types of intelligence,
but the type that reflects "an individual's breadth of
knowledge, experience, sophistication, judgment, skills of
communication, understanding of conventions, and capacity
for reasonable thinking" is called "Crystallized
Intelligence" (Ge) (p. 658). This concept can be referred
to then, as the knowledge of a culture. Horn says that
both scientific thinking and performance within scholarly
professions involve Ge. Abilities such as "verbal
comprehension, concept awareness, concept formation,
logical reasoning, numerical reasoning, and general
reasoning" are contained in Ge (Horn, p. 658). Horn also
described Fluid intelligence (Gf) which includes abilities
related to perceiving patterns, determining relationships
among patterns, drawing inferences from these patterns,
and comprehending their implications. Horn claims that Gf
must work cooperatively with Ge in order for an individual
to engage in logical reasoning or arithmetical reasoning.
The concept of Ge largely represents that which is
included in the overall concept of g (Horn). The Verbal
Scale of the WISC-III mostly reflects Ge, as does the
Verbal score of the CogAT and the various composites of
the ITBS. The concept of Gf is largely represented in the
Performance Scale of the WISC-III and the Nonverbal score
of the CogAT.
Separating aptitude from achievement is a mon~mentous

21
task; in fact, it appears to be nearly an impossible one
(Sternberg, 1984). According to Sternberg, establishing a
distinction between pure problem solving and the use of
acquired knowledge in pursuit of the same has been
abandoned by cognitive psychologists. He says that there
are two basic kinds of knowledge: declarative knowledge
and procedural knowledge. Declarative knowledge refers to
the knowledge of facts, concepts, and certain principles.
Procedural knowledge refers to knowledge of different
procedures and strategies that can be used to solve
problems. But, as Sternberg points out, problem solving
does not occur within a vacuum of knowledge, and research
has led many psychologists to resolve that intelligent
problem solving requires both the use of declarative
knowledge as well as procedural knowledge. Further,
research has demonstrated that highly abstract problems
discriminate more between various cultural groups than
does more direct, verbally-based problems (Sternberg).
Sternberg said that the measurement of verbal skill is
essential to the measurement of intelligence. He further
says that measures of vocabulary tend to correlate most
highly with overall IQ more than any other single subtest
within an intelligence test.
Realizing the positive correlation between
achievement and standard measures of verbal and global
intelligence such as the WISC-R, Kaufman and Kaufman
(1983) designed an individual measure of intelligence that

22
purportedly minimized the cultural/verbal loadinqs in the
calculation of IQ that typically characterize this qenre
of tests (Sternberq, 1984). The test they devised is
called the Kaufman Assessment Battery for Children (K-ABC;
Kaufman and Kaufman). Multiple theories and areas of
research were drawn upon in the final construction of the
K-ABC; the domains sampled consisted of those of
neuropsychology, information processing, and the famous
Cattel-Horn theory of intelligence (Kaufman and Kaufman).
The K-ABC contains an Achievement Scale which measures
many of those same skills that are typically assessed by
the Verbal Scale and Full-Scale components of the WISC-R
and other widely used intelligence tests (Kaufman and
Kaufman).
The K-ABC Achievement Scale measures those abilities
typically referred to as reflecting Ge as described
earlier in this text (Kaufman and Kaufman, 1983). These
achievement subtests purportedly measure those skills
reflected in vocabulary, lanquage concepts, reading,
arithmetic, and qeneral information which mirror many of
the WISC-R Verbal Scale subtests (Kaufman and Kaufman).
Kaufman and Kaufman attempted to minimize the role of
language ability in the construction of their Mental
Processing Scales so as to prevent the contamination of
measures of problem solving ability with language
development and verbal facility.
Naglieri (1985) determined correlations between the
23
K-ABC and the WISC-R with children who were normal,
learning disabled, and borderline mentally retarded
combined and found that the K-ABC Achievement Scale
correlated with the WISC-R VIQ, PIQ, and FSIQ .90, .75,
and .89 respectively. Kamphaus and Reynolds (1987), after
reviewing several factor analytic studies concerning the
K-ABC and the WISC-R, concluded that (1) the WISC-R Verbal
Scale is best interpreted as an achievement measure; (2)
the K-ABC and the WISC-R both measure g, which is heavily
weighted with achievement; and (3) the best predictor of
future achievement is a current measure of achievement,
not a more general cognitive measure. On the other hand,
to accurately predict WISC-III scores, in the absence of
previous indices of this class of scores, given the
established relationship between achievement and the WISC
R Verbal Scale, suggests that achievement scores may offer
the most direct route with which to make these
prognostications.
WISC-R Correlations with Achievement Measures
How well does the WISC-R correlate with other more
traditional measures of achievement? Covin and Lubimiv
(1976) correlated the WISC-R and the Wide Range
Achievement Test (WRAT) for 51 Caucasian children who were
referred for placement in a private child care facility in
Alabama. The children were of low socio-economic status
(SES) and were from homes that were dissolved due to
crisis. The results demonstrated that WISC-R VIQ
24
correlated .62, .68, and .59 with WRAT Spelling, Reading,
and Arithmetic respectively . WISC-R FSIQ correlated with
WRAT Spelling, Reading, and Arithmetic .50, .58, and .50.
WRAT Spelling, Reading, and Arithmetic standard scores
correlated most highly with Information, Arithmetic,
Similarities, Vocabulary, and the Picture Completion
subtests of the WISC-R (Covin and Lubimiv).
Schwarting and Schwarting (1977) compared WISC-R VIQ,
PIQ, and FSIQ with WRAT Reading, Spelling, and Arithmetic
for 282 children of various ethnic and SES backgrounds who
were referred for a school psychological evaluation in the
Omaha area. They found that VIQ correlated with WRAT
Reading, Spelling, and Arithmetic .68, .61, and .69
respectively in children aged 6 to 11 years; they also
found that FSIQ correlated with WRAT Reading, Spelling,
and Arithmetic .72, .65, and .75 in children aged 6 to 11
years (Schwarting and Schwarting). Further, PIQ
correlated with WRAT Reading, Spelling, and Arithmetic
.63, .60, and .69 with the younger group whereas the older
group obtained correlations of .40, .34, and .55 on the
Performance Scale (Schwarting and Schwarting). It was
interesting to note that the correlations obtained with
children aged 6 to 11 were higher than those of children
aged 12 to 16 years of age on the PIQ and FSIQ (Schwarting
and Schwarting).
Hale (1978) conducted a study where the Verbal and
Performance Scales of the WISC-R were used as predictors

of Reading, Spelling, and Arithmetic standard scores on
the WRAT. The author used 155 children referred for
evaluation from four counties in southeastern Nebraska.
The children were predominantly white, of low to middle
SES, and from a rural area (Hale). The children were
reported to be randomly selected and aged from 6 to 16
years (Hale).
25
Multiple regression analysis was used and results
demonstrated that the WISC-R was a significant predictor
of WRAT achievement scores: ~ < .0001. A stepwise
regression analysis was then conducted followed by a step
down analysis; the analyses indicated that the Verbal IQ
significantly predicted achievement: ~ < .001. The
results also demonstrated that PIQ did not significantly
predict WRAT scores. VIQ did predict WRAT Reading and
Math scores, but though the correlation was significant,
it did not predict Spelling scores. Hale said, "The Math
variable . was confounded with Spelling, and Reading
was confounded with both Spelling and Math" (p. 174). The
VIQ correlations with WRAT Reading, Spelling, and Math
were .54, .49, and .64 respectively (Hale).
Prewett and Giannuli (1991) correlated WISC-R VIQ,
PIQ, and FSIQ with the Woodcock-Johnson Tests of
Achievement-Revised (WJTA-R), the Kaufman Test of
Educational Achievement-Comprehensive Form (K-TEA), and
the Peabody Individual Achievement Test-Revised (PIAT-R).
The subjects were 66 students who were referred to a

26
school psychologist for academic problems. The average
age for the WISC-R sample was 9 years 7 months. Results
demonstrated that the WJTA-R Letter-Word Identification,
Passage Comprehension, and Broad Reading subtests and
subscales correlated with WISC-R VIQ .69, .68, and .70
respectively (Prewett and Giannuli, 1991). The K-TEA
Reading Decoding, Reading Comprehension, and Reading
Composite correlated with the VIQ .68, .68, and .69. The
PIAT-R Reading Recognition, Reading Comprehension, and
Total Reading score correlated with WISC-R VIQ .69, .66,
and .67 respectively. In all cases, the FSIQ correlated
significantly with all reading achievement measures, but
with smaller Pearson correlation coefficients than did the
VIQ; these ranged from a low of .54 to a high of .63.
McGrew (1987) conducted a study to determine the
relationships between the Woodcock-Johnson Tests of
Cognitive Ability (WJ-COG), the WISC-R subtests, and the
Woodcock-Johnson Tests of Achievement (WJ-ACH) Broad
Reading, Broad Mathematics, Broad Written Language, and
Broad Knowledge composites. He sampled 167 children from
the third and fifth grade from 12 elementary schools in
Minnesota. McGrew used three separate cannonical
correlations to determine (1) the correlations, (2) the
significant variates and loadings, {3) the proportion of
variance accounted for by the unrotated variates, and (4)
the redundancy involved in each pair of measures examined.
The results of the correlation between the WISC-R and WJ-
27
ACH were: Variate one, .880; Variate two, .630 with .2. <
.001. The redundant variance accounted for from the WISC
R subtests and the WJ-ACH composites indicated that the
WISC-R had 26.58% redundancy with the WJ-ACH Knowledge
Cluster. Further, all WISC-R verbal subtests except
Arithmetic loaded on this acquired knowledge/achievement
ability.
The second Variate that significantly accounted for
redundancy between the WISC-R and WJ-ACH was reported to
be comprised of Reading, Math, and Written Language in the
achievement domain (McGrew, 1987). The quantitative
domain between the WJ-ACH Broad Math cluster and the WISC
R Arithmetic subtest accounted for the highest loadings of
this group. Overall, McGrew reported 30.56% redundancy
between the WISC-R and the four WJ-ACH clusters. It
appears that the variance accounted for in broad measures
of achievement in reading, written language, math, and
general knowledge can account for considerable variability
in performance on the WISC-R.
Correlations between the CogAT and ITBS-G
The group administered CogAT-4 measures Verbal,
Nonverbal, and Quantitative abilities in children in
grades K through 12. During the standardization process,
the CogAT-4 was correlated with the ITBS-G (Thorndike &
Hagen, 1987). The CogAT-4 Technical Manual gives
correlation coefficients of the SASs of the CogAT-4 with
the Grade-Equivalent scores of the ITBS-G to illustrate
28
the criterion-related validity of the CogAT-4 with a group
administered achievement measure (Thorndike & Hagen). The
average correlation of the ITBS-G Complete Composite with
the Verbal Battery of the CogAT-4 from grade 2 through
grade 8 was .83, with grade 2 being .67, which is
considerably below the other correlation coefficients
which were .85 or .86. The average correlation of the
ITBS-G Complete Composite with the Quantitative Battery of
the CogAT-4 from grade two through grade eight was .78,
with a low of .73 in grade two, to a high of .80 at grade
six. The average correlation of the ITBS-G Complete
Composite with the Nonverbal Battery of the CogAT-4 from
grade two through grade eight was .69, with a low of .60
at grade two, to a high of .72 at grades four and five.
The Vocabulary subtest, the Reading subtest, the
Basic Composite, and the Complete Composite of the ITBS-G
correlated with the CogAT-4 Verbal Battery .80 and above
at numerous grade levels. The Math Composite correlated
with the Quantitative Composite .80 and above at grades 5,
6, 7 and 8. The Complete Composite correlated with the
Quantitative Composite .80 at grade 6, and .79 at three
other grade levels. Overall, the lowest correlations
observed between the CogAT-4 SASs and the ITBS-G scores in
the standardization sample were in kindergarten through
grade 2 (Thorndike & Hagen).
Predictive validity was demonstrated by correlating
the CogAT-4 scores obtained at grades five, seven, and

29
nine with ITBS-G composites administered at grade nine
(Thorndike & Hagen, 1987). Scores on the CogAT-4 Verbal
Battery at grades five, seven, and nine correlated with
the ITBS-G Complete Composite administered at grade nine
.82, .86, and .88, respectively. Scores on the CogAT-4
Quantitative Battery at grades five, seven, and nine
correlated with the ITBS-G Complete Composite administered
at grade nine .77, .81, and .83 respectively. Scores on
the CogAT-4 Nonverbal Battery at grades five, seven, and
nine correlated with the ITBS-G Complete Composite
administered at grade nine .67, .68, and .71 respectively.
In surmnation, the correlations between the ITBS-G Complete
Composite and the CogAT-4 scores demonstrate that the
relationship between an achievement test and components of
a more general cognitive measure is a strong one, and that
relationship is greatest after second grade.
Factor Analyses of the CoqAT-4 and the ITBS-G
Confirmatory factor analysis with the CogAT-4
demonstrated that all subtests have substantial loadings
of a general factor, and that this is the main source of
variance found in each respective subtest (Thorndike &
Hagen, 1987). A distinct verbal factor surfaced in all
three subtests of the Multilevel Edition, but in only one
of the two subtests of the Primary Battery: Oral
Vocabulary. Verbal Classification demonstrated a negative
loading due to children relying on pictures for
information rather than words (Thorndike & Hagen). A

30
clear nonverbal factor appeared in both the Multilevel
Edition and the Primary Battery. A distinct quantitative
factor appeared in both subtests of the Primary Battery,
but only appeared weakly in two of the three subtests of
the Multilevel Edition: Number Series and Equation
Building, not Quantitative Relations (Thorndike & Hagen).
In summary, all subtests portray a strong general factor
and both versions display a solid nonverbal factor. The
Multilevel Edition has a solid verbal factor but weak
loadings on the Quantitative factor. The Primary Battery
has moderate loadings on the Quantitative factor and
weaker loadings on the verbal factor (Thorndike & Hagen).
Therefore, the CogAT-4 may not predict WISC-III VIQ very
well at the primary level; it may, however, predict the
PIQ fairly well across both levels.
How does the ITBS-G factor structure relate to the
WISC-R/WISC-III factor structure? According to Willson
(1989), factor analyses on the ITBS-G consistently
displayed three factors: a verbal or reading factor, an
arithmetic factor, and a mechanics of language factor.
Klein (1981) performed a factor analyses on ITBS forms 7
and 8 (predecessors to Form G) and found two oblique
factors: the three mathematics subtests clustered together
on one factor and Vocabulary and the two Language
subtests, Spelling and Usage clustered on the other
factor. In part, her summation was that there was
considerable intercorrelation between subtests.

31
Martin and Dunbar (1985) performed a hierarchical
factor analysis of the ITBS forms 7 and 8 and found
evidence of construct validity for the Language and
Mathematics subscales. They also identified Verbal and
Visual Information factors; however they constructed
composites derived from subtest items, not the entire
subtests. They did this in order to determine second
order factors, which they found. A main finding with both
the Klein (1981) and the Martin and Dunbar studies that
pertains to the present research is the confirmation of a
general factor in the ITBS subsumed under the Verbal and
Mathematics composites.
In summation, the results of various factor analyses
demonstrate that both the CogAT and the ITBS seem to have
a general factor, a verbal factor, a quantitative factor,
and a visual/nonverbal factor, but the factors have
different loadings at different levels of the respective
tests. The WISC-III VIQ and FSIQ both have substantial
loadings of a general and a verbal factor as well
(Sattler, 1992). The PIQ might be construed to have a
visual/nonverbal factor subsumed within its PIQ and POI.
Correlations between the WISC-R/III and the ITBS
There is a limited amount of research of a
correlational nature between the WISC-III and the ITBS
beyond the studies just mentioned (H. D. Hoover personal
conununication, March 21, 1994; S. B. Dunbar, personal
conununication, March 21, 1994).

32
The WISC-III Manual (Wechsler, 1991) reports the
average correlations across five group-administered
achievement tests which include the ITBS Form G, but the
Manual does not give information pertaining to any one
achievement test by itself, only the group of five. The
Manual stated "Correlations were obtained within test
series, corrected for the variability of the WISC-III
scores ... , and the weighted average obtained with
Fisher's z transformation" (Wechsler, 1991, p. 209).
Total achievement was defined as the mean of the Normal
Curve Equivalent (NCE) scores for Reading and Mathematics
(Wechsler, 1991). The achievement tests' factors were
Total Achievement, Reading Achievement, Mathematics
Achievement, and Written Language Achievement (Wechsler,
1991).
The range of correlations given for the VIQ, PIQ, and
FSIQ with these achievement factors was from .43 to .74,
with a mean of .61; the VCI, POI, FDI, and PSI Index
factors ranged in correlation with the above achievement
factors from a low of .37 to a high of .70, with a mean of
.53 (Wechsler, 1991). Additional information on only the
ITBS correlations with the WISC-III from the Psychological
Corporation Psychological Measurement Group-WISC-III was
unavailable (Aurelio Prifitera, Ph.D., personal
communication, March 11, 1994) and is not available in the
literature.
Dean (1979) conducted a study with 46 Mexican-

33
American children from 8.3 to 10.5 years of aqe who were
given the WISC-R then the ITBS forms 7 and 8 a year and a
half later. Correlations between individual WISC-R
subtests and ITBS Vocabulary, Reading, and Arithmetic
Skills ranged from modest on the Verbal subtests to mild
on the Performance subtests. Dean (1979) maintained that
the Verbal IQ accounted for approximately 40\ of the
variance in ITBS scores with this population. It should
be noted that for these Mexican-American children,
however, the primary language used in their homes was
purported to be Spanish. Dean also pointed out that one
should expect lower correlations because of the heavy
dependence in the ITBS on reading ability that is not
present in the WISC-R.
If Information, Vocabulary, Arithmetic, Similarities,
and Comprehension subtests of the WISC-III are culturally
loaded and more highly correlated with academic
achievement (Ge), if achievement predicts achievement
better than more general cognitive measures, and if the
Verbal Scale of the WISC-III is more highly correlated
with, or actually equates to, achievement, then
traditional achievement measures such as the ITBS-G should
correlate with and predict Verbal IQ with reasonable
accuracy. Further, the Nonverbal Scale of the CogAT-4
should correlate with and predict WISC-III PIQ better than
ITBS-J scores could. Separately and together, they should
be able to predict WISC-III VIQ, PIQ, and FSIQ

respectively better than has been previously possible.
Hypotheses
34
The following six hypotheses are to be tested: (1)
the CogAT-4 Verbal scores and Quantitative scores will
correlate moderately with the VIQ and the FSIQ of the
WISC-III; (2) the CogAT-4 Nonverbal scores will correlate
moderately with the PIQ of the WISC-III; (3) the ITBS-J
Vocabulary, Reading, and Language Skills composites will
correlate moderately with WISC-III VIQ, FSIQ, and VCI
factors; (4) the ITBS-J Mathematics composite will
correlate moderately with WISC-III VIQ and FSIQ; (5) the
CogAT-4 Verbal, Quantitative, and Nonverbal scores along
with the ITBS-J composites will significantly predict the
variability observed in all of the WISC-III scores; and
{6) the combination of ITBS-J composites and the three
CogAT-4 scores will better predict WISC-III FSIQ by
accounting for more of the total variance than either of
the tests alone.

Subjects
CHAPTER II
Method
35
Initially, data were collected from 78 children aged
6 through 11 years, who were attending four elementary
schools within a rural southeastern Illinois community.
This locale is a predominantly white rural community
within the Midwestern United States. Because CogAT-4 or
ITBS-J scores were incomplete for some subjects, it was
decided that subjects with missing values on any variable
would be excluded from the study, in order to maintain a
consistent n throughout the analyses.
The 73 subjects whose scores were ultimately used in
the grade one through six computations included 9 children
in the first grade (12.3\), 25 children in the second
grade (34.2%), 17 children in the third grade (23.3\), 7
children in the fourth grade (9.6\), 13 children in the
fifth grade (17.8%), and 2 children in the sixth grade
(2.7\). There were three 6-year-olds, fifteen 7-year
olds, twenty-one 8-year-olds, fifteen 9-year-olds, seven
10-year-olds, and twelve 11-year-olds included in these
calculations. The mean age was 8.60 years (SD = 1.65
years). There were 38 boys, comprising 52\ of the study
sample, and 35 girls, comprising 48\ of the study sample.
Separate calculations were also completed with children in
grades two through six, aged 7 through 11 years, in order
to utilize the Nork Study Skills Composite (N Total) from

36
the ITBS-J. It was believed that this composite might
account for considerable variance in WISC-III scores in
the "older" children; this composite is not used with
children below second grade. The final overall N for the
"common" composites from both the ITBS-J--and CogAT-4-
used with children in the first through the sixth grades
was 73. The n used for composites from the ITBS-J with
children in the second through the sixth grade only, was
64.
The subjects included in the study were one black
child, two half black and half white children, with the
remainder of the sample being all white. Socioeconomic
status (SES) was not a variable in the present study,
because of difficulties in obtaining a large enough sample
to include it. Children from special education, however,
were included in the study. Three children were reported
by their parents as having learning disabilities, two
children were reported by their parents as having ADHD,
and four children were reported by their parents to be
participating in Chapter One programming within the four
elementary schools sampled.
As of 1989, the characteristics of the population,
from which the sample was drawn include: (1) an area of
approximately 21,000 inhabitants; (2) a per capita income
of approximately $9,700; (3) for persons 25 years of age
and older, approximately 79% possessed at least a high
school diploma, with 33% of the people possessing G

bachelor's degree or higher level degree; (4)
approximately 54% of the people were female, with 46%
being male; and (5) approximately 96% of the population
were white, with only 3% being black (U.S. Bureau of
Census, 1990).
Procedures
37
Subjects were solicited by seeking consent of the
parents of children who had given consent to have their
children's IQ tested by three classes of graduate students
in a Specialist in School Psychology Program at a local
state university (see Appendix for consent forms). The
students were administered both the ITBS-J and the WISC-
I I I in 1993-1995, with the CogAT-4 having been
administered in 1992-1995 as part of district-wide
testing. Each participant completed the ITBS-J, the
CogAT-4, and WISC-III all during a one-year period. The
CogAT-4 and ITBS-J scores were obtained archivally through
the Assistant Superintendent in charge of curriculum and
instruction. WISC-III scores were obtained from the
previously mentioned graduate students. The ITBS-J and
WISC-III scores were matched by year of administration to
insure that ability levels did not changed as a function
of time. CogAT-4 scores were drawn from the same year
that the WISC-III was administered, or the year before,
when not given during the same year.

38
Data Analysis
All data were analyzed using standardized scores with
multiple regression analyses. Analyses were done using
the Statistical Package for the Social Sciences, Personal
Computer Plus Version 2.0 (SPSS-PC+) software. To test
the first, second, third, and fourth hypotheses,
correlation coefficients are reported individually from
the matrix with CogAT-4 scores and ITBS-J composites
corresponding to the standard WISC-III IQ scales and the
four Index Factors. To test the fifth hypothesis, a
simple regression was done with all variables to determine
if the independent variables significantly predicted WISC
I II scores, and how much total variance could be accounted
for. To test the sixth hypothesis, first, CogAT-4 scores
were used alone in stepwise fashion to predict WISC-III
scores. Then, ITBS-J scores were used alone to predict
WISC-III scores. Thereafter, a stepwise multiple
regression procedure was implemented whereby both CogAT-4
scores and ITBS-J scores were used as independent
variables to predict WISC-III scores.
Basic and Complete Composites of the ITBS-J were not
used as predictors because these large composites are
believed to lack predictive specificity, but are
nevertheless listed in the matrices. A prediction
equation with the associated standard error of estimation
is also presented for each combination of the predictors
yielded according to grade range. Grades one through six

39
utilize the "common" composites from the ITBS-J from those
respective grades. Those include the Vocabulary
Composite, the Reading Composite, the Language Composite,
and the Math Composite. Grades two throvgh six include
one additional composite: the Work Study Skills Composite.
Hereafter, the following abbreviations will be used
in all tables throughout this study: Voe = ITBS-J
Vocabulary Composite; Read = ITBS-J Reading Composite;
Lang = ITBS-J Language Composite; WTotal = ITBS-J Work
Study Skills Composite; Math = ITBS-J Mathematics
Composite; Basic = ITBS-J Basic Composite; Complete = ITBS-J Complete Composite; CogVerb = CogAT-4 Verbal
Composite; CogQuan = CogAT-4 Quantitative Composite; and
CogNonVerb = CogAT-4 Nonverbal Composite. The
conventional abbreviations as previously defined will be
used for all WISC-III scores throughout the following
pages. These are VIQ = Verbal IQ scaled score; PIQ = Performance IQ scaled score ; FSIQ = Full Scale IQ scaled
score; VCI = Verbal Comprehension Index score; POI = Perceptual Organization Index score ; FDI = Freedom From
Distractibility Index score; and PSI = Processing Speed
Index score.

40
CHAPTER III
Results
Table 1 displays the means, standard deviations,
minimum scores, maximum scores, and the associated n for
each variable.
Table 1
Means, standard Deviations. Minimums, Maximums, and Number of Subjects
Variable Minimum Maximum
Age 8.60 1.45 6 11 Voe 62.41 19.52 15 99 Read 61.96 21.18 1 99 Lang 60.48 19.38 1 99 WTotal 59.88 19.78 7 99 Math 59.81 21.20 7 99 Basic 61.99 19.47 13 99 Complete 63.29 19.95 7 99 CogVerb 110.88 16.88 51 139 CogQuan 114.63 18.55 60 150 CogNonVerb 111.40 15.53 61 149 VIQ 110.52 14.09 60 140 PIQ 107.74 14.49 74 137 FSIQ 109.96 14.20 65 139 VCI 111.08 14.45 59 137 POI 107.03 14.00 67 133 FDI 106. 05 13.52 72 137 PSI 110.38 14.31 83 146
n
73 73 73 73 64 73 73 73 73 73 73 73 73 73 73 73 73 73
The WISC-III means obtained in this study were all above
those reported in the standardization sample. Mean scores
ranged from a low of 106 to a high of 111. The WISC-III
standardization mean is 100. The variability of scores
observed in the present study was less than the §12. = 15 of
the standardization sample. It averaged to 14. The

41
CogAT-4 mean scores ranged from 111 to 115. This is again
above the mean found in the standardization sample: 100.
The standard deviation for the CogAT-4 is 16. The means
demonstrated with the ITBS-J in the present study ranged
from 60 to 63. The NCE mean is 50. The variability
observed in these scores was less than the standardization
sample also (i.e., SD= 21). It ranged from 19 to 21.
In order to examine the first, second, third, and
fourth hypotheses, Pearson correlation matrices were
constructed. In the pages that follow, all data will be
reported and examined separately for children in the grade
two through six group, aged 7 through 11 years, and the
grade one through six group, aged 6 through 11 years, in
order to utilize the Work Study Skills Total from the
ITBS-J, and maximize the clinical utility of information
obtained from this study.
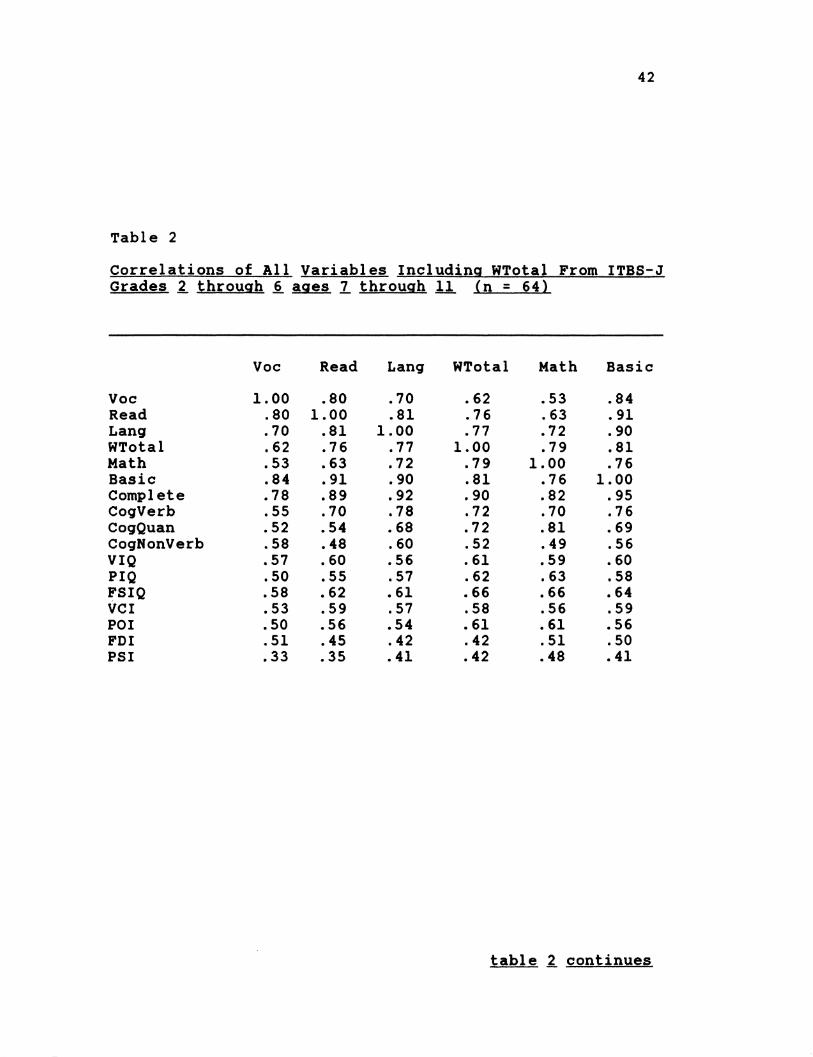
Hypothesis ~ The first hypothesis was to determine
whether the CogAT-4 Verbal scores and Quantitative scores
would correlate moderately with the VIQ and FSIQ of the
WISC-III. Table 2 illustrates that with the grade two
through six group, the CogAT-4 Verbal and Quantitative
scores correlated with the WISC-III VIQ .67 and .63,
respectively, 2 = .001. With regard to FSIQ, Table 2
illustrates that with the grade two through six group, the
CogAT-4 Verbal and Quantitative scores correlated with the
WISC-III FSIQ .73 and .68, respectively, 2 = .001.
42
Table 2
Correlations of All Variables Including NTotal From ITBS-J Grades .2.. through ..§. ages 2 through 11 (n = 64)
Voe Read Lanq NTotal Math Basic
Voe 1.00 .80 .70 .62 .53 .84 Read .80 1.00 .81 .76 .63 .91 Lanq .70 .81 1.00 .77 .72 .90 NTotal .62 . 76 .77 1.00 .79 .81 Math .53 .63 .72 .79 1.00 .76 Basic .84 .91 .90 .81 .76 1.00 Complete .78 .89 .92 . 90 .82 .95 CoqVerb .55 .70 . 78 .72 .70 .76 CogQuan .52 .54 .68 .72 .81 .69 CogNonVerb .58 .48 .60 .52 .49 .56 VIQ .S7 .60 .S6 .61 .S9 . 60 PIQ .so .SS .57 .62 .63 .58 FSIQ .S8 .62 .61 .66 .66 .64 VCI .S3 .59 .S7 .58 .S6 .S9 POI .so .S6 .S4 • 61 .61 .S6 FDI .51 .45 .42 .42 .51 .so PSI .33 .3S .41 .42 .48 .41
table .2.. continues

I_ -
43
Correlations of All Variables Including WTotal From ITBS-J Grades £ through ~ ages 2 through 11 (n = 64)
Complete CogVerb CogQuan CogNonVerb VIQ PIQ
Voe .78 .55 .52 .58 .57 .50 Read .89 .70 .54 .48 . 60 .55 Lang .92 .78 .68 .60 .56 .57 WTotal . 90 .72 .72 .52 .61 .62 Math .82 .70 .81 .49 .59 .63 Basic .95 .76 .69 .56 .60 .58 Complete 1.00 .82 .76 .63 .69 .67 CogVerb .82 1.00 .75 .61 .67 .68 CogQuan . 7 6 .75 1.00 .62 .63 .63 CogNonVerb .63 .61 .62 1.00 .50 .68 VIQ .69 . 67 .63 .so 1.00 .69 PIQ .67 .68 .63 .68 .69 1.00 FSIQ .73 .73 .68 .64 .92 .91 VCI .68 .69 .58 .47 . 97 .66 POI .66 .68 .63 .69 .71 .97 FDI .so .42 .58 .49 .64 .58 PSI .43 .43 .43 .36 .33 .67
table £ continues

44
Correlations of All Variables Including WTotal From ITBS-J Grades ~ through 6 ages 2 through 11 (n = 64)
FSIQ VCI POI FDI PSI
Voe .58 .53 .50 .51 .33 Read .62 .59 .56 .45 .35 Lang .61 .57 .54 .42 .41 WTotal .66 .58 .61 .42 .42 Math .66 .56 .61 .51 .48 Basic .64 .59 .56 .50 .41 Complete .73 .68 .66 .so .43 CogVerb .73 .69 .68 .42 .43 CogQuan .68 .58 .63 .58 .43 CogNonVerb .64 .48 .69 .49 .36 VIQ .92 . 97 .71 .64 .33 PIQ .91 .66 . 97 .58 . 67 FSIQ 1.00 . 90 .91 .67 .54 VCI . 90 1.00 .70 .50 .28 POI .91 .70 1.00 .55 .51 FDI .67 .50 .55 1.00 .45 PSI .54 .28 .51 .45 1.00
45
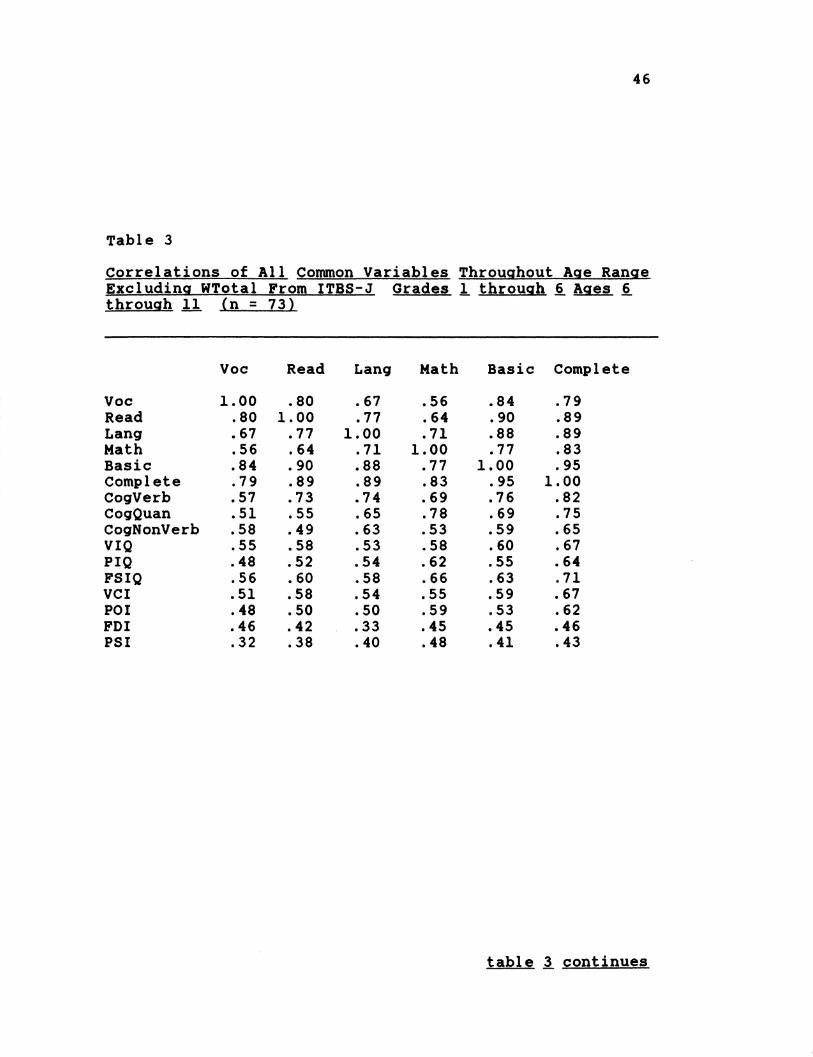
Table 3 demonstrates that with the grade one through
six group, the CogAT-4 Verbal and Quantitative scores
correlated with the WISC-III VIQ at .63 and .63,
respectively, .2. = .001. With regard to FSIQ, Table 3 also
demonstrates that with the grade one through six group,
the CogAT-4 Verbal and Quantitative scores correlated with
the WISC-III FSIQ at .68 and .67, respectively, .2. = .001.
46
Table 3
Correlations of All Common Variables Throughout Age Ranae Excluding WTotal From ITBS-J Grades ~ through .§..Ages .§.. through 11 {n = 73)
Voe Read Lang Math Basic Complete
Voe 1.00 .80 .67 .56 .84 .79 Read .80 1.00 .77 .64 .90 .89 Lang .67 .77 1.00 .71 .88 .89 Math .56 .64 .71 1.00 .77 .83 Basic .84 . 90 .88 .77 1.00 .95 Complete .79 .89 .89 .83 .95 1.00 CogVerb .57 .73 .74 .69 .76 .82 CogQuan .Sl .SS .6S .78 .69 .7S CogNonVerb .58 .49 .63 .53 .59 .65 VIQ .55 .S8 .53 .58 .60 .67 PIQ .48 .52 .54 .62 .55 .64 FSIQ .S6 . 60 .58 .66 .63 .71 VCI .51 .58 .54 .55 .59 .67 POI .48 . 50 .so .59 .53 .62 FDI .46 .42 .33 .45 .4S .46 PSI .32 .38 .40 .48 .41 .43
table ~ continues

47
Correlations of All Common Variables Throughout Age Range Excluding WTotal From ITBS-J Grades i through ~ Ages ~ through 11 (n = 73)
CogVerb CogQuan CogNonVerb VIQ PIQ FSIQ
Voe .57 .51 .58 .55 .48 .56 Read .73 .55 .49 .58 .52 .60 Lano .74 .65 .63 .53 .54 .58 Math .69 .78 .53 .58 .62 .66 Basic .76 .69 .59 .60 .55 .63 Complete .82 .75 .65 . 67 .64 .71 CogVerb 1.00 .74 .59 .63 .61 .68 CooQuan . 74 1.00 . 60 .63 .60 .67 CogNonVerb .59 . 60 1.00 .51 .66 .64 VIQ .63 .63 .51 1.00 . 67 .92 PIQ .61 .60 .66 .67 1.00 . 91 FSIQ .68 .67 .64 .92 .91 1.00 VCI .66 .58 .48 . 97 .63 .88 POI .59 .59 .66 .68 .96 .90 FDI .39 .57 .44 .64 .57 .66 PSI .45 .44 .37 .35 .67 .56
table 3 con~inues

48
Correlations of All Common Variables Throughout Age Range Excluding WTotal From ITBS-J Grades 1 through 6 Ages 6 through 11 (n = 73)
VCI POI FDI PSI
Voe .51 .48 .46 .32 Read .58 .50 .42 .38 Lang .54 .so .33 .40 Math .55 .59 .45 .48 Basic .59 .53 .45 .41 Complete . 67 .62 .46 .43 CogVerb .66 .59 .39 .45 CogQuan .58 .59 .57 .44 CogNonVerb .48 .66 .44 .37 VIQ . 97 .68 .64 .35 PIQ .63 .96 .57 .67 FSIQ .88 . 90 .66 .56 VCI 1.00 .65 .49 .29 POI .65 1.00 .53 .49 FDI .49 .53 1.00 .46 PSI .29 .49 .46 1.00

49
The results suggest that the CogAT-4 Verbal and
Quantitative scores do correlate moderately with the VIQ
and FSIQ of the WISC-III for children in grades one
through six and children in grades two through six.
Hypothesis £.:.. The second hypothesis concerned
whether the CogAT-4 Nonverbal scores would correlate
moderately with the PIQ of the WISC-III. Tables 2 and 3
illustrate that the CogAT-4 Nonverbal scores correlated
with the WISC-III PIQ at .68 and .66 1R_ = .001)
respectively, lending support for this hypothesis.
Hypothesis ~ Hypothesis number three concerned
whether the ITBS-J Vocabulary, Reading, and Language
Skills Composites would be moderately correlated with
WISC-III VIQ, the VCI Factor score, and FSIQ. The data
supported this hypothesis as well. Table 2 illustrates
that with the grade two through six group, Vocabulary,
Reading, and Language Skills Composites correlated with
WISC-III VIQ, .57, .60, and .56, respectively, ~ = .001.
Table 3 illustrates that with the grade one through six,
Vocabulary, Reading, and Language Skills Composites
correlated with WISC-III VIQ at .55, .58, and .53,
respectively, ~ = .001.
With regard to VCI, Table 2 demonstrates that with
the grade two through six group, Vocabulary, Reading, and
Language Skills Composites correlated with the WISC-III
VCI .53, .59, and .57, respectively,~= .001. Table 3
illustrates that with the grade one through six group,

50
Vocabulary, Reading, and Language Skills Composites
correlated with WISC-III VCI .51, .58: and .54,
respectively, ~ = .001. With regard to PSIQ, Table 2
demonstrates that with the grade two thr~ugh six,
Vocabulary, Reading, and Language Skills Composites
correlated with WISC-III FSIQ at .58, .62, and .61,
respectively, ~ = .001. Table 3 illustrates that with the
grade one through six, Vocabulary, Reading, and Language
Skills Composites correlated with WISC-III FSIQ at .56,
.60, and .58, respectively, ~ = .001.
Hypothesis ~ Hypothesis number four concerned
whether the ITBS-J Mathematics Composite would correlate
moderately with WISC-III VIQ and FSIQ. Table 2
illustrates that with the grade two through six group, the
ITBS-J Mathematics Composite correlated with the WISC-III
VIQ and FSIQ, .59 and .66, respectively, ~ = .001. Table
3 demonstrates that with the grade one through six group,
the ITBS-J Mathematics Composite correlated with the WISC
III VIQ and FSIQ, .58 and .66, respectively, 1...P. = .001),
indicating that hypothesis number four was also supported.
Hypothesis ~ Hypothesis number five concerned
whether the CogAT-4 Verbal, Quantitative, and Nonverbal
scores along with the ITBS-J Composites would
significantly predict the variability observed in all of
the WISC-III scores. In order to examine hypothesis
number five, a stepwise multiple regression was conducted
using both the scores from the CoqAT-4 and ITBS-J as
51
predictors of WISC-III scores. Tables 4 and 5 illustrate
that the VIQ, PIQ, FSIQ, VCI, POI, FDI, and PSI scores
were all predicted at the .OS level of significance using
multiple predictors in stepwise fashion. This was true
with the grade two through six group {aged 7 through 11
years) as well as the grade one through six group {aged 6
through 11 years).

52
Table 4
Stepwise Multiple Regressions with Scores from the CogAT-4 and the ITBS-J Including WTotal from ITBS-J Grades £ through 6 ages 7 through 11 {n = 64)
Dependent Variable/
Predictor
VIQ
CogVerb. Voe.
.67
.71 .44 .49
Adj. R2
Change
.44 :05
F to Enter
7.07 2.74
Overall F
.0000 49.94
.0080 31.35
Regression Equation: Y' = 48.88 + .44 (CogVerb score) + .22 (Voe Score) Standard Error of Estimate: 10.30
PIQ
CogVerb. .68 CogNonVerb .76 Math .78
.46
.56
.59
.46
.10
.03
7.38 4.00 2.16
.0000
.0002
.0344
54.52 41.88 31.17
Regression Equation: Y' = 29.85 + .24 (CogVerb score) + .38 (CogNonVerb score) + .17 (Math score) Standard Error of Estimate: 9.46
FSIQ
CogVerb .73 CogNonVerb .77 Math . 79
.52
.58
.61
.52
.06
.03
8.39 3.00 2.38
.0000
.0039
.0205
70.43 44.28 33.67
Regression Equation: Y' = 33.83 + .33 (CogVerb score) + .27 (CogNonVerb score) + .18 (Math score) Standard Error of Estimate: 9.14
table .! continues

53
Stepwise Multiple Regressions with Scores from the CogAT-4 and the ITBS-J Including WTotal from ITBS-J Grades ~ through 6 ages 7 through 11 (n = 64)
Dependent Variable/
Predictor
VCI
CogVerb Voe
.69
.71
Adj. R:a.
.47
.50
Adj. RA
Change
.47
.03
F to Enter
7.54 2.02
.0000
.0477
Overall F
56.87 31.89
Regression Equation: Y' = 44.42 + .51 (CogVerb score) + .17 (Voe score) Standard Error of Estimate: 10.59
POI
CogNonVerb .69 CogVerb .76
.46
.57 .46 .11
7.43 3.97
.0000
.0002 55.20 42.09
Regression Equation: Y' = 23.76 + .40 (CogNonVerb score) + .36 (CogVerb score) Standard Error of Estimate: 9.42
FDI
CogQuan Voe.
.58
.63 .32 .37
.32
.05 5.59 2.42
.0000
.0186 31.29 19.79
Regression Equation: Y' = 60.21 + .29 (CogQuan score) + .19 (Voe score) Standard Error of Estimate: 10.40
PSI
Math .48 .22 .22 4.32 .0001 18.64
Regression Equation: Y' = 91.21 + .32 (Math score) Standard Error of Estimate: 12.76

54
Table 5
Stepwise Multiple Regressions with Score~ from the CogAT-4 and ITBS-J Excluding WTotal from ITBS-J Grades !. through .§_ Ages .§_ through 11 (n = 73)
Dependent Variable/
Predictor
VIQ
CogVerb CogQuan Voe
.63
. 67
.70
.39
.44
.47
Adj. R:a
Change
.39
.05
.03
F to Enter
6.84 2.73 2.23
.0000
.0081
.0290
Overall F
46.85 29.26 22.27
Regression Equation: Y' = 48.31 + .22 (CogVerb score) + .24 (CogQuan score) + .17 (Voe score) Standard Error of Estimate: 10.26
PIQ
CogNonVerb .66 Math .73
.43
.52 .43 .09
7.38 3.91
.0000
.0002 54.48 40.35
Regression Equation: Y' = 44.64 + .43 (CogNonVerb score) + .26 (Math score) Standard Error of Estimate: 10.01
FSIQ
CogVerb . 68 CogNonVerb .74 Math .77
.45
.53
.57
.45
.08
.04
7.79 3.63 2.64
.0000
.0005
.0102
60.62 42.12 32.81
Regression Equation: Y' = 39.30 + .25 (CogVerb score) + .28 (CogNonVerb score) + .19 (Math score) Standard Error of Estimate: 9.31
table 5 continues

55
Stepwise Multiple Regressions with Scores from the CogAT-4 and ITBS-J Excluding WTotal from ITBS-J Grades i through ~Ages ~ through 11 (n = 73)
Dependent Variable/
Predictor
VCI
CogVerb .66
Adj. R::t
.43
Adj. R~
Change
.43
F to Enter
7.42 .0000
Overall F
55.03
Regression Equation: Y' = 48.39 + .57 (CogVerb score) Standard Error of Estimate: 10.92
POI
CogNonVerb .66 Math .72
.43
.50 .43 .07
7.37 3.43
.0000
.0010 54.37 37.18
Regression Equation: Y' = 45.56 + .43 (CogNonVerb score) + .22 (Math score) Standard Error of Estimate: 9.89
FDI
CogQuan Voe
.57
.60 .32 .34
.32
.02 5.84 2.01
.0000
.0479 34.15 19.84
Regression Equation: Y' = 58.29 + .33 (CogQuan score) + .15 (Voe score) Standard Error of Estimate: 10.95
PSI
Math .48 .22 .22 4.58 .0000 21.00
Regression Equation: Y' = 91.09 + .32 (Math score) Standard Error of Estimate: 12.66

I
L_
56
Hypothesis ~ The sixth, and last, hypothesis
concerned whether the combination of ITBS-J Composites and
the three CogAT-4 scores would better predict WISC-III
FSIQ by accounting for more of the total variance than
either of the tests alone. To test this hypothesis, a
stepwise multiple regression was conducted using the
ITBS-J scores alone as predictors followed by the same
procedure using the CogAT-4 scores as predictors. Then,
the results were compared to the results found when the
variables from both tests were included together. Table 4
illustrates an adjusted R~ of .61 in predicting FSIQ in
children in grades two through six, aged 7 through 11
years, using both instruments. This table displays The
CogAT-4 Verbal and Nonverbal scores, along with the ITBS-J
Math Composite as the best three predictors available.
The variables were entered in the following order: CogAT-
4 Verbal score, Nonverbal score, then ITBS-J Math
Composite score. The total variance accounted for at each
step was as follows: .52, .58, and .61 respectively. By
comparison, Table 6 illustrates an adjusted f? of only .49
in predicting FSIQ in children in grades two through six,
aged 7 through 11 years, when using only the ITBS-J
composites as predictors. The variables were entered in
the following order: W Total score, Vocabulary score,
then the ITBS-J Math Composite score. The total variance
accounted for at each step was as follows: .42, .47, and
.49 respectively.

57
Table 6
Stepwise Multiple Regressions with Scores from the ITBS-J Only Including WTotal Grades £through ~Ages 1._ through 11 (n = 64)
Dependent Variable/
Predictor
VIQ
WTotal Voe
.61
.66 .36 .42
.36
. 06
F to Enter
6.09 2.75
.0000
.0078
Overall F
37.04 24.20
Regression Equation: Y' = 77.48 + .30 (WTotal score) + .24 (Voe score) Standard Error of Estimate: 10.86
PIQ
WTotal .61 .36 .36 6.10 .0000 37.25
Regression Equation: Y' = 80.29 + .46 (WTotal score) Standard Error of Estimate: 11.76
FSIQ
WTotal Voe Math
.66
.70
.72
.42
. 47
.49
.42
.05
.02
6.95 2.58 2.04
.0000
.0121
.0458
48.28 29.63 22.12
Regression Equation: Y' = 73.61 + .19 (WTotal score) + .21 (Voe score) + .19 (Math score) Standard Error of Estimate: 10.28
table ~ continues

58
Stepwise Multiple Regressions with Scores from the ITBS-J Only Including WTotal Grades 2 through .§.Ages 2 through ll (n = 64)
Dependent Variable/
Predictor
VCI
Read Math
.60
.63
Adj. R~
.34
.38
Adj. R ;l.
Change
.34
.04
F to Enter
5.94 2.24
.0000
.0287
Overall F
35.24 21. 23
Regression Equation: Y' = 80.97 + .30 {Read score) + .19 {Math score) Standard Error of Estimate: 11.54
POI
WTotal .60 .35 .35 6.04 .0000 36.52
Regression Equation: Y' = 80.69 + .44 {WTotal score) Standard Error of Estimate: 11.41
FDI
Voe Math
.51
.58 .25 .32
.25
.07 4.73 2.82
.0000
.0064 22.35 16.37
Regression Equation: Y' = 79.32 + .23 {Voe score) + .20 {Math score) Standard Error of Estimate: 10.69
PSI
Math .44 .18 .18 3.95 .0002 15.58
Regression Equation: Y' = 92.39 + .30 {Math score) Standard Error of Estimate: 12.96
59
Table 5 illustrates a multiple adjusted R~ of
.57 in predicting FSIQ in children in grades one through
six, aged 6 through 11 years, using both instruments,
excluding the W Total Composite from the ITBS-J. Again,
this table displays the CogAT-4 Verbal and Nonverbal
scores, along with the ITBS-J Math Composite as the best
three predictors available. The variables were entered in
the following order: CogAT-4 Verbal score, Nonverbal
score, then ITBS-J Math Composite score. The total
variance accounted for at each step was as follows: .45,
.53, and .57 respectively. By comparison, Table 7
illustrates a multiple adjusted R~ of only .45 in
predicting FSIQ in children in grades one through six,
aged 6 through 11 years, when using only the ITBS-J
composites as predictors, again excluding the W Total
Composite from the ITBS-J. The variables were entered in
the following order: Math Composite score then Vocabulary
score. The total variance accounted for at each step was
as follows: .39 then .45.

Table 7
Stepwise Multiple Regressions with Scores from the ITBS-J Only Excluding WTotal Grades ~ through .§.Ages .§. through 11 (n = 73)
Dependent Variable/
Predictor
VIQ
Read Math
.58
.64 .33 .39
Adl R
Change
.33
.06
F to .2 Enter
6.05 2.92
.0000
.0046
Overall F
36.64 24.49
Regression Equation: Y' = 81.93 + .25 (Read score} + .22 (Math score} Standard Error of Estimate: 10.88
PIQ
Math Voe
.58
.62 .33 .37
.33
.04 6.11 2.32
.0000
.0234 37.36 22.48
Regression Equation: Y' = 77.44 + .30 (Math score} + .19 (Voe score} Standard Error of Estimate: 11.47
FSIQ
Math Voe
.63
.69 .39 .45
.39
.06 6.90 3.18
.0000
.0022 47.63 31.85
Regression Equation: Y' = 76.95 + .30 (Math score} + .23 (Voe score} Standard Error of Estimate: 10.39
table L continues

61
Stepwise Multiple Regressions with Scores from the ITBS-J Only Excluding WTotal Grades !. through .i Ages .i through ll (n = 73)
Dependent Variable/
Predictor
VCI
Read Math
.58
.62
Adj. R~
.32
.36
Adj. R;::z
Change
.32
.04
F to Enter
6.03 2.36
.0000
.0212
Overall F
36.41 22.12
Regression Equation: Y' = 82.61 + .28 (Read score) + .19 (Math score) Standard Error of Estimate: 11.39
POI
Math Voe
.56
.60 .30 .34
.30
.04 5.72 2.41
.0000
.0185 32.76 20.36
Regression Equation: Y' = 78.47 + .27 (Math score) + .19 (Voe score) Standard Error of Estimate: 11.27
FDI
Voe Math
.46
.51 .20 .24
.20
.04 4.38 2.31
.0000
.0235 19.20 12.85
Regression Equation: Y' = 82.25 + .21 (Voe score) + .17 (Math score) Standard Error of Estimate: 11.64
PSI
Math .44 .19 .19 4.24 .0001 17.98
Regression Equation: Y' = 92.12 + .30 (Math score) Standard Error of Estimate: 12.84

62
Table 8 illustrates a multiple adjusted ~ of .56 in
predicting FSIQ in children in grades one through six,
aged 6 through 11 years, when using only the CogAT-4
Verbal, Quantitative, and Nonverbal scores as predictors.
The variables were entered in the following order: CogAT-
4 Verbal score, Nonverbal score, then CogAT-4 Quantitative
score.

63
Table 8
Stepwise Multiple Regressions with Scores from the CogAT-4 Only Grades ~ through ~Ages ~ through 11 (n = 73)
Dependent Variable/
Predictor
VIQ
CogVerb CogQuan
.63
.67
Adj. R~
.39
.44
Adj. R~
Change
.39
.OS
F to Enter
6.89 2.71
Overall F
.0000 47.51
.0084 29.53
Regression Equation: Y' = 45.55 + .31 (CogVerb score) + .27 (CogQuan score) Standard Error of Estimate: 10.49
PIQ
CogNonVerb .66 CogVerb .71
.43
.so .43 .07
7.43 3.32
.0000 55.20
.0014 36.98
Regression Equation: Y' = 27.82 + .42 (CogNonVerb score) + .29 (CoqVerb score) Standard Error of Estimate: 10.21
FSIQ
CogVerb .68 CogNonVerb .74 CogQuan .76
.45
.53
.56
,45 .08 .03
7.84 3.66 2.18
.0000
.0005
.0329
61.49 42.74 31. 57
Regression Equation: Y' = 27.84 + .26 (CogVerb score) + .27 (CoqNonVerb score) + .20 (CogQuan score) Standard Error of Estimate: 9.39
table ~ continues

64
Stepwise Multiple Regressions with Scores from the CogAT-4 Only Grades l. through ..[ Ages ..[ through 11 (n = 73)
Dependent Variable/
Predictor
VCI
CogVerb .66
Adj. R~
.43
AdJ· R
Change
.43
F to Enter
7.47
Overall F
.0000 55.78
Regression Equation: Y' = 48.30 + .57 (CoqVerb score) Standard Error of Estimate: 10.85
POI
CogNonVerb .65 CoqQuan .70
.42
.48 .42 .06
7.35 2.93
.0000 54.00
.0045 34.15
Regression Equation: Y' = 33.08 + .42 (CogNonVerb score) + .24 (CoqQuan score) Standard Error of Estimate: 10.10
FDI
CogQuan .57 .32 .32 5.89 .0000 34.70
Regression Equation: Y' = 58.44 + .42 (CoqQuan score) Standard Error of Estimate: 11.11
PSI
CogVerb .45 .19 .19 4.28 .0001 18.33
Regression Equation: Y' = 68.03 + .38 (CogVerb score) Standard Error of Estimate: 12.78
65
The total variance accounted for at each step was
as follows: .45, .53, and .56 respectively. This score
(.56) is quite close to the multiple adjusted R~ of .57
found in predicting FSIQ in children in grades one through
six, aged 6 through 11 years, using both the CogAT-4 and
ITBS-J as predictors. Still, the data support the sixth
and final hypothesis: The ITBS-J Composites and the three
CogAT-4 scores will better predict WISC-III FSIQ by
accounting for more of the total variance than either of
the tests alone. This was a narrow victory with the
children in grades one through six, aged 6 through 11
years, when using only the CogAT-4 Verbal, Quantitative,
and Nonverbal scores as predictors, but not so narrow when
using only the ITBS-J composites as predictors.
Tables 4 through 7 of fer regression equations
utilizing the best predictors available from either the
CogAT-4 and the ITBS-J, or the ITBS-J only, for each of
the seven dependent variables of the WISC-III for each of
two respective groups: children in grades two through six,
aged 7 through 11 years, or children in grades one through
six, aged 6 through 11 years. Table 8 offers regression
equations utilizing the best predictors from the CogAT-4
only for each of the seven dependent variables of the
WISC-III for children in grades one through six, aged 6
through 11 years. In all cases, the standard error of
estimation is given with each dependent variable being
predicted.

66
CHAPTER IV
Discussion
The data collected and analyzed in this study suggest
that the ITBS-J and CogAT-4 correlate moderately with the
WISC-III VIQ, PIQ, FSIQ, VCI, POI, FDI, and PSI.
Comparing the adjusted multiple R squares (adjusted R~s)
of the CogAT-4 and the ITBS-J, as opposed to only the
ITBS-J, with children in grades two through six, aged 7
through 11 years, it is readily apparent that whenever
possible, one should use scores from both measures in
order to account for more of the total variance observed
in the various WISC-III scores. For example, using both
the CogAT-4 and the ITBS-J as predictors with this grade
and age range (see Table 4), the following adjusted R~s
are derived: VIQ: .49; PIQ: .59; FSIQ: .61; VCI: .SO; POI!
.57; FDI: .37 and PSI: .22. Using only the ITBS-J as a
predictor with this grade and age range (see Table 6), the
following adjusted R~s are yielded: VIQ: .42; PIQ: .36;
FSIQ: . 49; VCI: . 38; POI: . 35; FDI: . 32; and PSI: .18.
Comparing the adjusted R~s between using the CogAT-4
and the ITBS-J, as opposed to only the ITBS-J, with
children in grades one through six, aged 6 through 11
years, it is also apparent that whenever possible, one
should again use scores from both measures in order to
account for more of the total variance observed in the
various WISC-III scores. For example, using both the
CogAT-4 and the ITBS-J as predictors with this grade and

age range (see Table S), the following adjusted R~s are
derived: VIQ: .47; PIQ: .S2; FSIQ: .S7; VCI: .43; POI:
67
.SO; FDI: .34 and PSI: .22. By comparison, using only the
ITBS-J as a predictor with this grade and age range (see
Table 7), the following adjusted R~s are yielded: VIQ:
.39; PIQ: .37; FSIQ: .45; VCI: .36; POI: .34; FDI: .24;
and PSI: .19.
Comparing the adjusted Jtls between using the CogAT-4
and the ITBS-J, as opposed to only the CogAT-4, again with
children in grades one through six, aged 6 through 11
years, it is again readily apparent that whenever
possible, one should use scores from both measures in
order to account for more of the total variance observed
in the various WISC-III scores. For example, using both
the CogAT-4 and the ITBS-J as predictors with this grade
and age range (see Table S), the following adjusted Ras
are derived: VIQ: .47; PIQ: .52; FSIQ: .S7; VCI: .43; POI:
.50; FDI: .34 and PSI: .22. By comparison, using only the
CogAT-4 as a predictor with this grade and age range (see
Table 8), the following adjusted R~s are yielded: VIQ:
.44; PIQ: .SO; FSIQ: .56; VCI: .43; POI: .48; FDI: .32;
and PSI: .19. Out of all of these, only VCI was not
improved by using scores from both tests as predictors; it
merely stayed the same in both cases.
It is also apparent that the children in grades two
through six, aged 7 through 11 tended toward higher
adjusted Irs than did the whole group, which included

68
children in grades one through six, aged 6 through 11,
even when using both the ITBS-J and the CogAT-4 as
predictors. For the older group (see Table 4), the
adjusted R~s were VIQ: .49; PIQ: S9; FSIQ: .61; VCI: .SO;
POI: .57; FDI: .37; and PSI: .22. By comparison, using
the whole sample, including children in grades one through
six, aged 6 through 11 years (see Table 5), the adjusted
R~s were VIQ: .47; PIQ: .S2; FSIQ: .57; VCI: .43; POI:
.SO; FDI: .34; and PSI: .22. Of all of these, only PSI
did not improve as a function of increased age; it merely
stayed the same in both cases. It should be noted that
the above changes were displayed by merely adding the
scores from 9 first graders to the older sample.
The present study provides considerable information
in that it makes available correlation matrices for the
ITBS-J and CogAT-4 with the various WISC-III scores. It
also provides a listing of how much variance in the WISC
III scores can be accounted for by scores from the ITBS-J
alone, the CogAT-4 alone, or a combination of the two.
It also provides a large assortment of regression
equations, each with its own respective standard error of
estimation, useful in predicting premorbid cognitive
functioning in children from this area.
An application of the proposed method for determining
premorbid intellectual functioning in the different
cognitive domains measured by the WISC-III would first
require the practitioner to obtain the most recent ITBS-J

69
National Percentile Ranks (NPRs) and CogAT-4 scores on the
child. Care should be taken to assure that the scores and
NPRs are not significantly deviant from past ITBS and
CogAT scores, and/or the child's grades in like areas. If
the most recent scores are significantly different from
previous scores, the practitioner should select the most
recent scores available that seem to be most
representative of the child's actual skills, again
considering the other scores and grade levels, in like
areas, for comparison purposes. After that, the
practitioner would consult the back of any ITBS-J
Teacher's Guide for the conversion chart with which to
convert the ITBS percentile ranks in each respective
achievement area to normal curve equivalents (NCEs)
(Hieronymus et al., 1990). Once this is done, the
practitioner simply inserts those scores into the
respective regression equation that best reflects the
grade and age range of the child in question. A predicted
WISC-III score results.
For example, John Doe, a nine-year-old, 4th grade boy
is suspected of having a loss of cognitive functioning
resulting from TBI. The practitioner reviewed the child's
past ITBS scores, CogAT scores, and like grades and found
that the most recent ITBS-J scores and CogAT-4 scores were
not significantly deviant from previous scores and grades.
The NPRs from the ITBS-J were Vocabulary 76, Reading 60,
Language Total 73, Work Study Skills Total 60, and

70
Mathematics Total 52. After conversion of the NPRs using
the chart in any ITBS Teacher's Guide, the following NCEs
were yielded: Vocabulary 65, Reading 55, Language Total
63, Work Study Skills Total 55, and Mathematics Total 51.
The CogAT-4 scores were Verbal 104, Quantitative 115, and
Nonverbal 99. The CogAT-4 scores do not need conversion.
Because John Doe is in the fourth grade and has a W
Total score on the ITBS, and because predictions are
improved with older children, as previously explained,
Table 4 is the most appropriate table to consult for the
prediction of WISC-III scores for John. In the interest
of brevity, only the VIQ, PIQ, and FSIQ will be predicted,
though it is "best practice" to predict every possible
Scale or Factor Index score from the WISC-III, so as to
profile the premorbid, as opposed to postmorbid, strengths
and weaknesses of the child in question. The appropriate
equations and computations follow:
VIQ' = 48.88 + .44 (CogVerb score) + .22 (Voe score) VIQ' = 48.88 + .44 (104) + .22 (65) VIQ' = 108.94 or 109 rounded
Standard Error of Estimate: 10.30
PIQ' = 29.85 + .24 (CogVerb score) + .38 (CogNonVerb score) + .17 (Math score)
PIQ' = 29.85 + .24 (104) + .38 (99) + .17 (51) PIQ' = 101.10 or 101 rounded
Standard Error of Estimate: 9.46
FSIQ' = 33.83 + .33 (CogVerb score) + .27 (CogNonVerb score) + .18 (Math score)
FSIQ' = 33.83 + .33 (104) + .27 (99) + .18 (51) FSIQ' = 104.06 or 104 rounded
Standard Error of Estimate: 9.14 or 9.00 rounded

71
The example scores were all near the mean, but much lower
or much higher scores can also predicted for each
respective area in the same way.
Comparing the results of the present study to the
results of the Reynolds and Gutkin (1979) study--each in
its respective ability to predict premorbid intellectual
functioning in normal children as measured by the WISC-R,
or in this case, the WISC-III, it is quite apparent that
the Rs of the current study using both the ITBS-J and
CogAT-4 as predictors {VIQ .70-.71; PIQ .73-.78; & FSIQ
.77-.79), well surpassed even the optimistic results
reported by Reynolds and Gutkin (VIQ .44; PIQ .37; & FSIQ
.44), even though later studies did not find results with
the Reynolds and Gutkin method that were significant:
Klesges and Sanchez (1981) VIQ .19, PIQ .13, and FSIQ .18;
Klesges (1982) VIQ .14, PIQ .13, and FSIQ .14. It should
also be noted that even when using only the ITBS-J to
predict VIQ, PIQ, and FSIQ, the results of present study
still surpassed the Rs found in the Reynolds and Gutkin
study: Present study VIQ .64-.66, PIQ .61-.62, and FSIQ
.69-.72; Reynolds and Gutkin study VIQ .44, PIQ .37, and
FSIQ .44.
A further strength of the present study over using
demographic variables to predict intellectual functioning
in children is that the current study makes use of the
individual child's own scores across various tests--and
their correlations with measured intelligence--to make

72
predictions. This is as opposed to makinq use of more
general demographic variables across a large population--a
stratified sample of 2200 subjects--then applying them to
the individual case to make predictions (Reynolds and
Gutkin, 1979).
A not so surprizing finding of the present study is
that the CoqAT-4 alone better predicted WISC-III scores
than did the ITBS-J alone. Establishing that a group
administered general cognitive measure better predicted
the results of an individually administered general
cognitive measure is not a revelation; however,
establishing the relationship between particular elements
of a more specific achievement test and an individually
administered general cognitive measure once again helps
make the point that specific achievements figure quite
heavily into general cognitive abilities.
Limitations of the present study include: (1) the
use of a sample of children that is restricted to the
before mentioned predominantly white, rural southeastern
Illinois community; (2) the use of a sample of children
which doe~ not consider SES, grade, or age as variables;
(3) the use of more second graders than any other group;
(4) the use of only 3 six-year-olds and only 2 sixth
graders; (5) the fact that the mean VIQ, FSIQ, VCI, and
PSI were 110 or 111, undoubtedly due to the sampling
procedures used and the specific locale from which the
children were drawn; and (6) the fact that adjusted R~s

73
of from only .19 to .22 were found in predicting PSI from
the WISC-III.
At present, there is no better method available to
predict VIQ, PIQ, FSIQ, VCI, POI, FDI, and PSI in children
from this area. Further, it is assumed that this method
is the best yet devised for predicting premorbid cognitive
functioning for children suspected of having a loss of
functioning as a result of TBI. However, caution should
be exercised in applying these regression equations to
other populations. In fact, because of the low percentage
of minorities included in the present study, it is
suggested that one use these regression equations with
extreme caution for minority children.
Going further, it could also be argued that one
should not apply these regression equations to any
populations other than the one from which this sample was
drawn. While this is a conservative view and is probably
largely true, the method proposed here still might be
useful with similar populations in that it maps and
quantifies the relationship between elements of measures
that are routinely given in many areas and the various
scores from the WISC-III. Because the correlations
between the CogAT-4 and the ITBS-J with the WISC-III are
quite high, and because the relationship between
intelligence and achievement, or intelligence and group
administered cognitive measures is, and historically has
been accepted as, a matter of fact, this proposed method

74
is probably the only procedure around that has the ability
to dispassionately quantify the common elements of this
class of predictors with the scores from the WISC-III.
It is not suggested that the use of this method
should preclude reviewing a child's premorbid and
postmorbid ITBS scores, CogAT scores, and grades. On the
contrary, it is suggested that past and more current ITBS
scores, CogAT scores, and grades in like
achievement/cognitive areas be directly compared as
suggested in the example case above. Being more specific,
if a child's premorbid reading grades were Cs and Bs, but
his or her ITBS-J Reading Composite were below the 15th
percentile, it could be assumed with reasonable accuracy
that the child did not put forth the effort that he or she
could have on the ITBS-J. Following ''best practices" in
this case, it would be suggested that the scores that are
suspect be excluded from any predictions.
It is suggested that further research in this area be
done using larger samples that are stratified by race,
sex, SES, and grade and/or age. It is also proposed that
specificity in predictions be increased by generating
regression equations for given grades and/or ages.
Lastly, it is suggested that others pursue similar studies
with other achievement tests and group administered
cognitive measures, so that in the future, intelligence
levels can be predicted as easily as achievement levels
are currently predicted from knowledge of intelligence.
75
References
Anastasi, A. (1989). Review of the Cognitive
Abilities Test, Form 4. In J. C. Conoley & J. J. Kramer
(Eds.), The Tenth Mental Measurements Yearbook, (pp. 192-
193). Lincoln, Nebraska: University of Nebraska Press.
Assistance to States for the Education of Children
with Disabilities Program and Preschool Grants for
Children with Disabilities; Final Rule (IDEA); 34 C.F.R.
Cong. 300-301 (Vol. 57, No. 189) (1992).
Begali, V. (1992). Head injury in children and
adolescents: A resource and ~eview for school and allied
professionals (2nd ~ Brandon, VT: Clinical Psychology
Publishing Company. Inc.
Covin, T. M. & Lubimiv, A. J. (1976). Concurrent
validity of the WRAT. Perceptual and Motor Skills, ~
573-574.
Dean, R. S. (1979). Predictive validity of the
WISC-R with Mexican-American children. Journal of School
Psychology, 17 (1), 55-58.
Donders, J. (1993). WISC-R subtest patterns in
children with traumatic brain injury. The Clinical
Neuropsychologist, 2 (4), 430-442.
Education and Cultural Resources, Education, State
Board of Education, Instruction for Specific Student
Populations, 23 Illinois Administrative Code, Chap. I, S.
Subchapter f Part 226 (1994).
Fuchs, D. (1989). Review of the Cognitive Abilities

Test, Form 4. In J. C. Conoley & J. J. Kramer (Eds.),
The Tenth Mental Measurement~ Yearbook, (pp. 193-197).
Lincoln, Nebraska: University of Nebraska Press.
76
Hale, R. L. (1978). The WISC-Ras a predictor of
WRAT performance. Psychology in the Schools, 15 (2), 172-
175.
Hieronymus A. N., & Hoover, H. D. (1986/87). Manual
for school administrators: levels 5-14, {ITBS Forms G/H).
Chicago, IL: Riverside.
Hieronymus A. N., Hoover, H. D., Frisbie, D. A., &
Dunbar, S. B. (1990). Manual for School Administrators,
Supplement, Levels 5-14 (ITBS Form J). Chicago, IL:
Riverside.
Hieronymus A. N., Hoover, H. D., Lindquist, E. F.,
Oberly, K. R., & Cantor, N. K. (1990). Teachers Guide,
Multilevel Battery Levels 9-14, {ITBS Form J). Chicago,
IL: Riverside.
Horn, L. J. (1988). Thinking about human abilities.
In J. R. Nesselroade & R. B. Cattel (Eds.), Handbook of
multivariate experimental psychology, 2nd ed. New York:
Plenum Press.
Individuals with Disabilities Education Act (IDEA),
20 U.S.C. 1400-1485, LRP Publications (1990).
Kamphaus, R. W. & Reynolds, C. R. (1987). Clinical
and research applications of the K-ABC. Circle Pines,
Minnesota: American Guidance Service.
Kaplin, E., Fein, D., Morris, R., & Delis, D.

(1991). Manual for WAIS-R ~a neuropsychological
instrument. San Antonio, TX: The Psychological
Corporation.
Kaufman, A. S. & Kaufman, N. L. (1983). Kaufman
Assessment Battery for Children: Interpretive Manual.
Circle Pines, Minnesota: American Guidance Service.
77
Klein, A. E. (1981). Redundancy in the IOWA Tests
of Basic Skills. Educational and Psychological
Measurement, ~ 537-544.
Klesges, R. C. (1982). Establishing premorbid
levels of intellectual functioning in children: An
empirical investigation. Clinical Neuropsychology, _i (1),
15-17.
Klesges, R. C. & Sanchez, V. C. {1981). Cross
validation of an index of premorbid intellectual
functioning in children. Journal of Consulting and
Clinical Psychology, ~ 141.
Kraus, F. J. (1987). Epidemiology of head injury.
In P. R. Cooper (Ed.), Head Iniury (2nd ed., pp. 1-19).
Baltimore: Williams & Wilkins.
Lane, S. {1992). Review of the IOWA Tests of Basic
Skills, Form J. In J. C. Conoley & J. J. Kramer (Eds.),
The Eleventh Mental Measurements Yearbook, (pp. 421-423).
Lincoln, Nebraska: University of Nebraska Press.
Little, S. G. (1992). The WISC-III: everything old
is new again. School Psychology Quarterly, 2 (2), 148-
154.

78
Martin, D. J., & Dunbar, S. B. (1985). Hierarchical
factoring in a standardized achievement battery.
Educational and Psychological ~easurement, ~ 343-351.
McGrew, K. S. (1987). A multivariate analysis of
the Wechsler/Woodcock-Johnson discrepancy controversy.
Journal of Psychoeducational Assessment, ~ 49-60.
Mira, M. P., Tucker, B. F., & Tyler, J. S. (1992).
Traumatic brain iniury in children and adolescents: A
sourcebook for teachers and other school personnel.
Austin, TX: Pro-Ed.
Naglieri, J. A. (1985). Use of the WISC-Rand K-ABC
with learning disabled, borderline mentally retarded, and
normal children. Psychology in the Schools, 11_ (2), 133-
141.
Prewett, P. N. & Giannuli, M. M. (1991).
Correlations of the WISC-R , Stanford-Binet Intelligence
Scale: Fourth Edition, and the reading subtests of three
popular achievement tests. Psychological Reports, ~
1232-1234.
Reynolds, c. R. & Gutkin, T. B. (1979). Predicting
the premorbid intellectual status of children using
demographic data. Clinical Neuropsycholoqy, .l (2), 36-38.
Ruff, R. M., Levin, H. S., & Marshall, L. F. (1986).
Neurobehavioral methods of assessment and the study of
outcome in minor head injury. Journal of Head Trauma
Rehabilitation, .l (2), 43-52.
Sattler, J. M. (1992). Assessment of children

79
(revised and updated third edition}. San Dieqo, CA:
Author.
Schwarting, F. G. & Schwarting, K. R. (1977}. The
relationship of the WISC-R and WRAT: A study based upon a
selected population. Psychology in the Schools, 14 (4},
431-433.
Sellers, A.H., & Nadler, J. D. (1992}. A survey of
current neuropsychological assessment procedures used for
different age groups. Psychotherapy in Private Practice,
11 (3), 47-57.
Shurtleff, H. A., Fay, G. E., Abbott, R. D. &
Berninger, V. W. (1988). Cognitive and
neuropsychological correlates of academic achievement: A
levels of analysis assessment model.
Journal of Psychoeducational Assessment, ~ 298-308.
Sternberg, R. J. (1984). The Kaufman Assessment
Battery for Children: An information-processing analysis
and critique. The Journal of Special Education, 18 (3},
269-279.
Thorndike, R. L., & Hagen, E. (1986). Cognitive
Abilities Test: Preliminary Examiner's Manual/Multilevel
Edition. (CogAT Form 4 levels A-H). Chicago: Riverside.
Thorndike, R. L., & Hagen, E. (1987). Cognitive
Abilities Test: Technical Manual. {CogAT Form 4 levels
1-2 and A-H). Chicago: Riverside.
Townes, B. D., Trupin, E.W., Martin, D. C., &
Goldstein, D. (1980). Neuropsychological correlates of

academic success amonq elementary school children.
Journal of Consulting and Clinical Psychology, 48 (6),
675-684.
U. s. Bureau of the Census. (1990). Census of
population: General population characteristics,
Illinois (CP-1-15). Washington, DC: U. s. Government
Printinq Office.
80
U. S. Bureau of the Census. (1990). Census of
population and housing: Summary social, economic, and
housing characteristics, Illinois (CHP-5-15). Washington,
DC: U. S. Government Printing Office.
Wechsler, D. (1974). Manual for the Wechsler
Intelligence Scale for Children (Revised). New York: The
Psychological Corporation.
Wechsler, D. (1981). Manual for the Wechsler Adult
Intelligence Scale (Revised). San Antonio, TX: The
Psychological Corporation.
Wechsler, D. (1991). Manual for the Wechsler
Intelligence Scale for Children-Third Edition. San
Antonio, TX: The Psychological Corporation.
Wesman, A. G. (1968). Intelliqent testing.
American Psychologist, 23 (4), 267-274.
Willson, V. L. (1989). Review of the IOWA Tests of
Basic Skills, Forms G and H. In J. C. Conoley & J. J.
Kramer (Eds.), The Tenth Mental Measurements Yearbook,
(pp. 395-398). Lincoln, Nebraska: University of Nebraska
Press.

81
Wilson, R. S., Rosenbaum, G., Brown, G., Rourke, D.,
Whitman, D., & Grisell. (1978). An index of premorbid
intelligence. Journal of Consulting and Clinical
Psychology, ~ 1554-1555.
Witt, J. C. & Gresham, F. M. (1985). Review of the
Wechsler Intelligence Scale for Children (Revised). In V.
Mitchell (Ed.), The Ninth Mental Measurements Yearbook,
(pp. 1716-1719). Lincoln, Nebraska: University of
Nebraska Press.

82
Appendix
INFORMED CONSENT
Dear Parent,
My name is Kent Riley, and I am a graduate student in the Specialist in School Psychology Program at Eastern Illinois University. Under the supervision and guidance of Dr. OehlerStinnett, I am conducting a study correlating scores on the Iowa Tests of Basic Skills-Form G and the Cognitive Abilities Test with the individually administered, Wechsler Intelligence Scale for Children-3rd Edition (WISC-III). The Iowa and Cognitive Abilities tests are routinely given to all children in the Charleston area by the school district. The valuable information obtained from this study would allow school psychologists or other professionals to better predict children's performance on the WISC-III, so as to make better informed educational decisions for the children of this area.
In 1993, you graciously allowed graduate students at Eastern Illinois University to test your child with the above mentioned intelligence test. Now, to gather the information that I need to conduct my study, I need your permission to access your child's Cognitive Abilities Test scores and Iowa Test scores for 1992/1993 through Jeannie Walters, Assistant Superintendent in charge of curriculum and instruction. I also need your persmission to use the scores that your child obtained on the WISC-III intelligence test in 1993. Of course, ALL INFORMATION OBTAINED WILL BE KEPT CONFIDENTIAL, and the results of the study will be reported only as group data with no names attached. If you wish to have a copy of the results, check below. Please return this consent form in the stamped and pre-addressed envelope that is enclosed, and thank you very much for your support in this valuable research.
D
D
D
I wish to be sent a copy of the results
YES, I grant permission for the Iowa scores, Cognitive Abilites scores, and WISC-III scores on my child to be obtained and used for the purposes of the study as outlined above.
NO, I do not grant permission for the Iowa scores, Cognitive Abilites scores, and WISC-III scores on my child to be obtained and used for the purposes of the study as outlined above.
I need more information. Please contact me at the number or address below.
Parent's Signature Address
Child's Full Name Phone

83
INFORMED CONSENT
Dear Parent,
My name is Kent Riley, and I am a graduate student in the Specialist in School Psychology Program at Eastern Illinois University. Under the supervision and guidance of Dr. OehlerStinnett, I am conducting a study correlating scores on the Iowa Tests of Basic Skills-Form G and the Cognitive Abilities Test with the individually administered, Wechsler Intelligence Scale for Children-3rd Edition (WISC-III). The Iowa and Cognitive Abilities tests are routinely given to all children in the Charleston area by the school district. The valuable information obtained from this study would allow school psychologists or other professionals to better predict children's performance on the WISC-III, so as to make better informed educational decisions for the children of this area.
In 1994, you graciously allowed graduate students at Eastern Illinois University to test your child with the above mentioned intelligence test. Now, to gather the information that I need to conduct my study, I need your permission to access your child's Cognitive Abilities Test scores and Iowa Test scores for 1993/1994 through Jeannie Walters, Assistant Superintendent in charge of curriculum and instruction. I also need your persmission to use the scores that your child obtained on the WISC-III intelligence test in 1994. Of course, ALL INFORMATION OBTAINED WILL BE KEPT CONFIDENTIAL, and the results of the study will be reported only as group data with no names attached. If you wish to have a copy of the results, check below. Please return this consent form in the stamped and pre-addressed envelope that is enclosed, and thank you very much for your support in this valuable research.
D
D
D
I wish to be sent a copy of the results
YES, I grant permission for the Iowa scores, Cognitive Abilites scores, and WISC-III scores on my child to be obtained and used for the purposes of the study as outlined above.
HO, I do not grant permission for the Iowa scores, Cognitive Abilites scores, and WISC-III scores on my child to be obtained and used for the purposes of the study as outlined above.
I need more information. Please contact me at the number or address below.
Parent's Signature
~~~~~~~~~~~~~ Address Child's Full Name
Phone

84
INFORMED CONSENT
Dear Parent,
My name is Kent Riley, and I am a graduate student in the Specialist in School Psychology Program at Eastern Illinois University. Under the supervision and guidance of Dr. OehlerStinnett, I am conducting a study correlating scores on the Iowa Tests of Basic Skills-Form G and the Cognitive Abilities Test with the individually administered, Wechsler Intelligence Scale for Children-3rd Edition (WISC-III). The Iowa and Cognitive Abilities tests are routinely given to all children in the Charleston area by the school district. The valuable information obtained from this study would allow school psychologists or other professionals to better predict children's performance on the WISC-III, so as to make better informed educational decisions for the children of this area.
In 1995, you graciously allowed graduate students at Eastern Illinois University to test your child with the above mentioned intelligence test. Now, to gather the information that I need to conduct my study, I need your permission to access your child's Cognitive Abilities Test scores and Iowa Test scores for 1994/1995 through Jeannie Walters, Assistant Superintendent in charge of curriculum and instruction. I also need your persmission to use the scores that your child obtained on the WISC-III intelligence test in 1995. Of course, ALL INFORMATION OBTAINED WILL BE KEPT CONFIDENTIAL, and the results of the study will be reported only as group data with no names attached. If you wish to have a copy of the results, check below. Please return this consent form in the stamped and pre-addressed envelope that is enclosed, and thank you very much for your support in this valuable research.
D
D
D
I wish to be sent a copy of the results
YES, I grant permission for the Iowa scores, Cognitive Abilites scores, and WISC-III scores on my child to be obtained and used for the purposes of the study as outlined above.
NO, I do not grant permission for the Iowa scores, Cognitive Abilites scores, and WISC-III scores on my child to be obtained and used for the purposes of the study as outlined above.
I need more information. Please contact me at the number or address below.
Parent•s Signature Address
Child's Pull Name Phone

85
INFORMED CONSENT
Dear Parent,
My name is Kent Riley, and I am a graduate student in the Specialist in School Psychology Program at Eastern Illinois University. I am conducting a study correlating scores on the Iowa Tests of Basic Skills-Form G and the Cognitive Abilities Test with the individually administered, Wechsler Intelligence Scale for Children-3rd Edition {WISC-III). The Iowa and Cognitive Abilities tests are routinely given to all children in the Charleston area by the school district. The valuable information obtained from this study would allow school psychologists or other professionals to better predict children's performance on the WISC-III, so as to make better informed educational decisions for the children of this area.
I would like your permission to administer the above mentioned intelligence test to your child, to use those intelligence test scores in my study, and to access, and also use, your child's Cognitive Abilities Test scores and Iowa Test scores for 1994/1995 through Jeannie Walters, Assistant Superintendent in charge of curriculum and instruction. After testing, I. will be glad to discuss your child's performance on the intelligence test with you. Of course, ALL INFORMATION OBTAINED WILL BE KEPT CONFIDENTIAL, and the results of the study will be reported only as group data with no names attached. If you wish to have a copy of the results of the study, check below. Please return this consent form to school with your child as soon as possible. Thank you very much for your support in this valuable research.
D
D
D
I wish to be sent a copy of the results
YES, I grant permission for Kent A. Riley to administer the WISC-III intelligence test to my child, for Mr. Riley to access my child's Iowa scores and Cognitive Abilites Test scores through the channel listed above, and for Mr. Riley to use the above scores for the purposes of his study as explained above.
NO, I do not grant permission for Kent A. Riley to administer the WISC-III intelligence test to my child, for Mr. Riley to access my child's Iowa scores and Cognitive Abilites Test scores through the channel listed above, or for Mr. Riley to use the above scores for the purposes of his study as explained above.
I need more information. Please contact me at the number or address below.
Date: Parent's Signature Address
Child's Full Name Phone
I WILL CONTACT YOU SOON TO SET UP A TIME TO TEST YOUR CHILD.