Prediction of Gas Storage Capacity and the Recovery of Coal Bed
13
International Journal of Applied Science and Technology Vol. 1 No. 2; April 2011 82 Preliminary Study on Gas Storage Capacity and Gas-in-Place for CBM Potential in Balingian Coalfield, Sarawak Malaysia Kong Chai Chen Sonny Irawan Chow Weng Sum Saleem Qadir Tunio* Geosciences and Petroleum Engineering Department Universiti Teknologi PETRONAS Tronoh 31750, Perak, Malaysia E-mail: [email protected]*, Phone: 0060-53687055* Sponsoring information: Universiti Teknologi PETRONAS, MALAYSIA Abstract This project focuses on Coal Bed Methane (CBM) potential in Balingian coalfield, Sarawak. One block in Balingian area is picked as an area for preliminary assessment. Liang formation (Balingian Coal) is lignite coal with a mean vitrinite reflectance of 0.32%, coal seam thickness from 0.33- 29.69 ft. According to Geoscience and Mineral Department Malaysia, the moisture content is in between 12.9% to 18.7%, volatile matter varies at 37.8% to 43.4% with fixed carbon ranges from 40.3% to 43.4%. The coal contains a very low ash content of 2.7% and sulphur content less than 1%. Four different core samples were used with porosity and permeability values from 1.58% to 5.12% and 0.15mD to 46.15mD. Gas storage capacity at different pressures was determined from adsorption isotherm test based on modified Boyle’s law. Adsorption isotherm test result showed maximum adsorbed methane in coal is 374.62scf/ton at maximum pressure of 1219.58 psia. Linear regression of Langmuir Volume and Langmuir Volume showed 714.29scf/ton and 1024.5psia respectively. Value of maximum absorbed methane used in gas-in-place calculation yields 15.207 Bscf in area of 6.094km 2 . The result is compared with other similar coal fields. As a conclusion, Balingian coal field showed a very good prospect to produce first CBM in Malaysia based on this study. Key Words: Langmuir, Gas storage capacity, CBM and Gas-in-place 1. Introduction Coalbed Methane (CBM) is categorized as unconventional hydrocarbon which is produced from coal seams. CBM explorations, operations and developments have been started a few decades ago, especially in the United States. Since 1700’s, coal mining has started in deeper depth in United Kingdom and a catastrophic methane explosion has occurred. When the coal is mined, estimated 60% to 80% of the combustible gas is emitted into the mine atmosphere where the accumulated gas creates explosion hazards [1]. Ventilation system was the only conventional method practiced during that time when methane is diluted into the air to lower the concentration and vented out to the surface. In between year 1876 to 1948, it is recorded at least one major US coal mine explosion per year occurs. The deeper, larger and higher rank coalbed are mined, more gas will be emitted, the conventional ventilation possibly may not adequate to control the emission. Thus, more advance technology required to drain the huge amount methane effectively. Prior to this, extensive studies have been carried out until 1970 where the coalbed methane potential is assessed. The first sale of captured CBM to pipeline was started in year 1974 [2]. CBM is a clean-burning fuel which helps to decrease air pollution. The total annual production from 11 coal basins in US has exceeded 1.5 Tcf with more than 15,000 producing CBM wells. This number of production accounted for 10% of annual US natural gas production is reported in 2001 [3]. Similarly, countries like Australia, Canada, United Kingdom, China, India and Indonesia have successfully exploited CBM as source of energy today. This research presents the preliminary study of CBM potential in Sarawak coal bearing strata through the prediction of gas storage capacity and gas-in-place. The result of gas storage capacity provides a strong level of confidence in coalbed reservoir resource and reservoir evaluation [4]. On top of that, a preliminary stage for gas-in-place analysis will be conducted based on available information such as reservoir drainage area, gross reservoir rock thickness, average in-situ density and average in-situ gas content. The coal structure with its permeability and porosity will be determined experimentally to study the characteristic of Balingian coal.
Transcript of Prediction of Gas Storage Capacity and the Recovery of Coal Bed

International Journal of Applied Science and Technology Vol. 1 No. 2; April 2011
82
Preliminary Study on Gas Storage Capacity and Gas-in-Place for CBM Potential
in Balingian Coalfield, Sarawak Malaysia
Kong Chai Chen
Sonny Irawan
Chow Weng Sum
Saleem Qadir Tunio*
Geosciences and Petroleum Engineering Department
Universiti Teknologi PETRONAS
Tronoh 31750, Perak, Malaysia
E-mail: [email protected]*, Phone: 0060-53687055*
Sponsoring information: Universiti Teknologi PETRONAS, MALAYSIA
Abstract
This project focuses on Coal Bed Methane (CBM) potential in Balingian coalfield, Sarawak. One block in
Balingian area is picked as an area for preliminary assessment. Liang formation (Balingian Coal) is lignite
coal with a mean vitrinite reflectance of 0.32%, coal seam thickness from 0.33- 29.69 ft. According to
Geoscience and Mineral Department Malaysia, the moisture content is in between 12.9% to 18.7%, volatile
matter varies at 37.8% to 43.4% with fixed carbon ranges from 40.3% to 43.4%. The coal contains a very low
ash content of 2.7% and sulphur content less than 1%. Four different core samples were used with porosity
and permeability values from 1.58% to 5.12% and 0.15mD to 46.15mD. Gas storage capacity at different
pressures was determined from adsorption isotherm test based on modified Boyle’s law. Adsorption isotherm
test result showed maximum adsorbed methane in coal is 374.62scf/ton at maximum pressure of 1219.58 psia.
Linear regression of Langmuir Volume and Langmuir Volume showed 714.29scf/ton and 1024.5psia
respectively. Value of maximum absorbed methane used in gas-in-place calculation yields 15.207 Bscf in area
of 6.094km2. The result is compared with other similar coal fields. As a conclusion, Balingian coal field
showed a very good prospect to produce first CBM in Malaysia based on this study.
Key Words: Langmuir, Gas storage capacity, CBM and Gas-in-place
1. Introduction
Coalbed Methane (CBM) is categorized as unconventional hydrocarbon which is produced from coal seams.
CBM explorations, operations and developments have been started a few decades ago, especially in the United
States. Since 1700’s, coal mining has started in deeper depth in United Kingdom and a catastrophic methane
explosion has occurred. When the coal is mined, estimated 60% to 80% of the combustible gas is emitted into
the mine atmosphere where the accumulated gas creates explosion hazards [1]. Ventilation system was the
only conventional method practiced during that time when methane is diluted into the air to lower the
concentration and vented out to the surface.
In between year 1876 to 1948, it is recorded at least one major US coal mine explosion per year occurs. The
deeper, larger and higher rank coalbed are mined, more gas will be emitted, the conventional ventilation
possibly may not adequate to control the emission. Thus, more advance technology required to drain the huge
amount methane effectively. Prior to this, extensive studies have been carried out until 1970 where the
coalbed methane potential is assessed. The first sale of captured CBM to pipeline was started in year 1974 [2].
CBM is a clean-burning fuel which helps to decrease air pollution. The total annual production from 11 coal
basins in US has exceeded 1.5 Tcf with more than 15,000 producing CBM wells. This number of production
accounted for 10% of annual US natural gas production is reported in 2001 [3]. Similarly, countries like
Australia, Canada, United Kingdom, China, India and Indonesia have successfully exploited CBM as source
of energy today.
This research presents the preliminary study of CBM potential in Sarawak coal bearing strata through the
prediction of gas storage capacity and gas-in-place. The result of gas storage capacity provides a strong level
of confidence in coalbed reservoir resource and reservoir evaluation [4]. On top of that, a preliminary stage for
gas-in-place analysis will be conducted based on available information such as reservoir drainage area, gross
reservoir rock thickness, average in-situ density and average in-situ gas content. The coal structure with its
permeability and porosity will be determined experimentally to study the characteristic of Balingian coal.

© Centre for Promoting Ideas, USA www.ijastnet .com
83
2. Literature Review
2.1 CBM formation and production
Coal is formed from peat, the deposited plant-derived organic material through coalification. Coalification
occurs at different rates in different environments. Biochemical degradation initiates the coalification process
but with burial increasing overburden pressures and subsurface temperature cause physiochemical process that
continues coalification. As water, carbon dioxide and methane are released, the coal increases in rank, starting
from lignite, sub-bituminous, bituminous, anthracite, and graphite. Bituminous coal rank contains the highest
gas volume in it.
Coal acts as both the source rock and reservoir rock for methane. Methane is generated by microbial
(biogenic) or thermal (thermogenic) processes shortly after burial and throughout the diagenetic cycle which
resulting from further burial. Hydraulic pressure, rather than a pressure seal or closed structure (common for
conventional oil and gas fields), is the major trapping force for CBM. Coal is extremely porous (openings) but
with low permeability (connected openings). Most coals contain methane, but much of it cannot be
economically produced without the presence of natural fractures (cleats) to connect the pores. CBM is stored
in coal matrices (primary storage) as well as in cleats and natural fractures (secondary storage). Coal cleats are
classified geometrically with the primary cleats which are called face cleats that is more continuous and the
secondary cleats which are called butt cleats that is less continuous. When the coal bed is depressurised, the
gas which is adsorbed in the coal matrices begins to diffuse by Fick’s Law [5] and enter the fracture/cleat
network. Methane and carbon dioxide are the major components of CBM.
CBM production is usually initiated by pumping out water from the reservoir to allow the gas to desorb from
the coal matrix and diffuse to the cleat but some wells may not be economical if too much water has to be
pumped. Some coal beds may never be dewatered, depending on the hydrology. If CBM fields are associated
with a conventional gas trap, like the Drunkards Wash area in Price, Utah [6], gas flows freely upon
completion of the well without the need for dewatering. CBM, unlike conventional oil and gas production,
usually shows an increase in the amount of production at first and then steadily declines. As a coal is
dewatered, the cleat system progressively opens farther and farther away from the well. As this process
continues, gas flow increases from the expanding volume of dewatered coal. Water production decreases with
time, which makes gas production from the well more economical.
2.2 Overview of Balingian coalfield
Balingian Coalfield is one of the 4 major coal fields in Sarawak situated at 45km from Sibu town. The first
study of the Mukah-Balingian coalfield was begun in 1994 with a very short detail of outcrop study. In 1996
to 2000, Mukah-Balingian coal field was split into two individual reports for further field evaluation. Mukah
coalfield is located at northern part of Begrih formation whilst Balingian coalfield is located at the southern
part of Begrih formation as shown in the Figure 1[7]
Balingian East Block of Balingian coalfield is located in the north central part of Sarawak which centred at
latitude of 2o 43’ and longitude of 112
o 24.5’. The area is located about 30km to 40km to southeast of Mukah
town. The evaluation coal resource of Balingian East block was carried out by the Geological Survey of
Malaysia from 1996 to 2000. The Liang formation forms the Balingian coalfield is from Upper Miocene age.
The Liang formation is composed of conglomerate, sandstone, siltstone, mudstone, shale and lignite which are
similar lithological properties to Balingian formation.
The only different between those two formations are poorly consolidated and enriched in conglomeratic bed
within the Liang formation. [8, 9] The dip angle of Liang formation showed 12o to 15
o toward south. There is
no major fault/fold except northward propagating fold thrust at the southern of Liang formation due to Belaga
formation which is located at the south of Liang Formation
The distribution and orientation of cleats system in a coal field provide important information regarding the
pathway of the methane flow in the reservoir. Balingian coalfield has the face cleats strike at NNE-SSW,
whilst its butt cleats have a bimodal pattern with cleats trending at NNW-SSE and NE-SW direction. A study
has done by Hussein and Dorani [9] showed 11 coal seams were detected with a maximum thickness of
7.39meters. The potential resource is approximately 203.11 million tonnes which consisting 23.35 million
tonnes of measured reserve, 82.43 million tonnes of indicated reserve and 97.33 million tonnes of inferred
reserve.

International Journal of Applied Science and Technology Vol. 1 No. 2; April 2011
84
2.3 Proximate Analysis and Ultimate Analysis
Proximate analysis is used to determine the percentage of ash, moisture, fixed carbon and volatile matter. The
variables are measured in weight percent (wt %) and are calculated in several different basis. This analysis
helps to identify the quality of the coal and its rank. As for ultimate analysis, it is to determine the percentage
of carbon, hydrogen, nitrogen, sulphur. In addition proximate and ultimate analysis data will be used as the
fundamental consideration for future concerns, for instance: coal trading and its utilisations. Both analyses are
analysed in accordance to ASTM test method performed in Coal Quality Testing Laboratory by Mineral and
Geoscience Department Malaysia, Sarawak. In 1994, the report showed the entire Mukah-Balingian coalfields
are sub-bituminous coal but later in 2000, Balingian coal was found to be in lignite. Table 1 shows the
summary of comparison between coals from both fields.
The list of ASTM Standard Specification Technique can be found in Appendix A
2.4 Adsorption isotherm test
Adsorption isotherm test is performed to determine the gas storage capacity at different pressure steps and
generating a Langmuir equation for Balingian coal. Adsorption isotherm test by using modified Boyle’s Law
[10] which involve several steps as such as:
Sample preparation: sample selection, sample crushing (ASTM D1214-89), proximate analysis test,
and equilibrium moisture content restoration
Measuring isotherm adsorption with high purity methane at six pressure steps
Gas storage capacity is evaluated at the equilibrium endpoints for each pressure step. The change in gas
storage capacity at the endpoints can be calculated using equation below:
1
1
1
2
1
1
1
20368.32 gtvgtv
c
tvgrgr
c
rs BB
m
VBB
m
VG ... (Eq. 1)
Where,
sG = Change in gas storage capacity, scf/ton
rV = Reference cell volume, cm³
cm = Mass of coal, gm
2grB = Gas formation volume factor at the final reference
cell pressure
1grB = Gas formation volume factor at the initial reference
cell pressure
tvV = Adsorption cell void volume, cm³
2gtvB = Gas formation volume factor at the final adsorption
cell pressure
1gtvB = Gas formation volume factor at the initial adsorption
cell pressure
The gas formation volume factor can be determined using equation below.
69.459
69.459
scsc
scg
Tpz
TzpB ........................................ (Eq. 2)
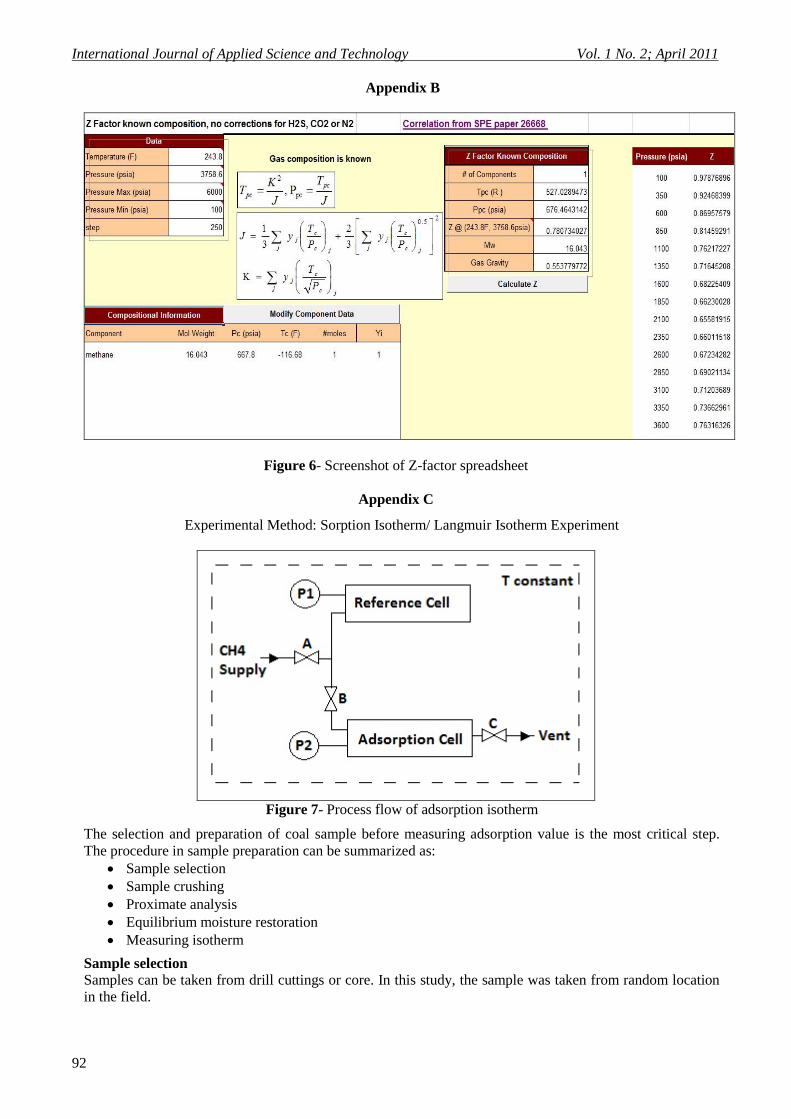
Real gas deviation factor is determined from correlation by Piper L.D.,et al [11] as shown in Appendix B.
After all 6 pressure steps with gas content values are recorded, a graph of gas content against end pressure is
plotted. In order to determine Langmuir pressure and volume, Equation 3 is used:
L
L
L V
Pp
VV
P
1 ....................................................... (Eq. 3)
Where, 1/VL is the slope and PL/VL is the intersection of P/V against end pressure graph
A full procedure and apparatus setup can be referred in Appendix C
2.5 Method for Determining Gas-In-Place
Gas-in-place volume is the total amount of gas stored within a specific reservoir bulk volume. Yee et al.
proposed below mathematical equation linking four properties [12] as such:

© Centre for Promoting Ideas, USA www.ijastnet .com
85
cc GAhG
7.1359 ............................................. (Eq. 4)
Where,
G = gas-in-place, standard cubic feet (scf)
A = drainage area, acres
h = thickness, feet
c
= average in-situ density, g/cm³
cG
= average in-situ gas content, scf/ton
The first three values can be estimated from boring log, areal map and core analysis. For the fourth value, the
gas content can be obtained from the calculated gas content by Equation 4. It is important that the gas in place
is corrected for moisture and ash as they adsorb negligible amount of gas. Higher quantities of moisture and
ash reduce the amount of gas present in the coal.
3. Problem Statement
Malaysia has been exported about 1 million tonnes of coal from the Sadong Colliery coal field in Sarawak
since 1874. Such amount of energy implies a huge resource of coal existed in Sarawak. However, there are no
evidence shows that the gas production (to keep the mine safe from explosion) is utilised and highly possible
it has been released freely into the air. In 2010, mostly gas field in peninsular Malaysia is depleting. It came
into PETRONAS concern to meet the supply demand of natural gas for country usage and exports. Hence,
PETRONAS aims to venture in unconventional gas resources and study in year 2010. This study is carried out
as preliminary study in order to estimate total resources of CBM available in Balingian Field, Sarawak. In
addition, a number of wells were drilled in the Teres and Penipah valleys of the Mukah Coal Field in more
that 2000m of Cycle I to Cycle III within Balingian Province had shown an indication of oil and gas existence
at a depth of 200m [7].
4. Objectives
The objectives of this research are:
1. To study the permeability and porosity of the coal sample
2. To determine the gas content/gas storage capacity through calculation and experiment
3. To evaluate gas-in-place based on the field data
5. Research Methodology
To achieve these objectives, a research methodology is outlined in Figure 2:
6. Results and Discussions
6.1 Porosity and permeability
Four samples of Balingian coals are examined by using PoroPerm equipment in the lab. Each examined
sample is 3 inches in length and 1.5 inches in diameter. The result of the porosity and permeability is shown in
Table 2:
A coal that has permeability ranging from 1 mD to 10mD is considered fairly good, whilst above 10md is
excellent. In the initial experiment before the 4 above samples examined, a coal core is plugged from the bulk
coal by using core plugging equipment with water as coolant. The plugged core has the same length and
diameter as of 4 samples. Earlier mentioned in the literature review [13], the plugged core must be kept wet all
the times prior to prevent unnatural fracture. However, the limitation of the PoroPerm equipment is the
examined core must be a dry core. Hence this core is dried in the oven at 24 o Celsius for 12 hours. As a result,
this core showed a permeability of 1,220.65 mD, a porosity of 14.09% and a pore volume of 7.80 cc.
Such a high permeability and porosity of the core doesn’t show the exact reservoir properties because the
fractures are not natural fracture due to excessive of coal matrix shrinkage. Palmer and Mansoori explained
that the shrinkage of coal matrix is turned out to cause the formation permeability to increase significantly,
particularly when the pressure decreases below the desorption pressure [14]. Therefore, 4 above samples
above are plugged without coolant in order to maintain the exact core properties. Each core shows different
permeability value and porosity value due to the different number of cleats network. Higher permeability and
porosity tend to have more cleats network
6.2 Adsorption isotherm result
The gas content is further studied in adsorption isotherm test which 130g of crushed coal is used. The
reference volume calculated is 98.77 cc, whilst the calculated void volume in the adsorption cell is 84.22 cc.

International Journal of Applied Science and Technology Vol. 1 No. 2; April 2011
86
Table 3 shows the pressure values in the adsorption cell and reference cell at initial state and final state for
every pressure step. Table 4 is the calculated gas formation volume factor for each state of adsorption cell and
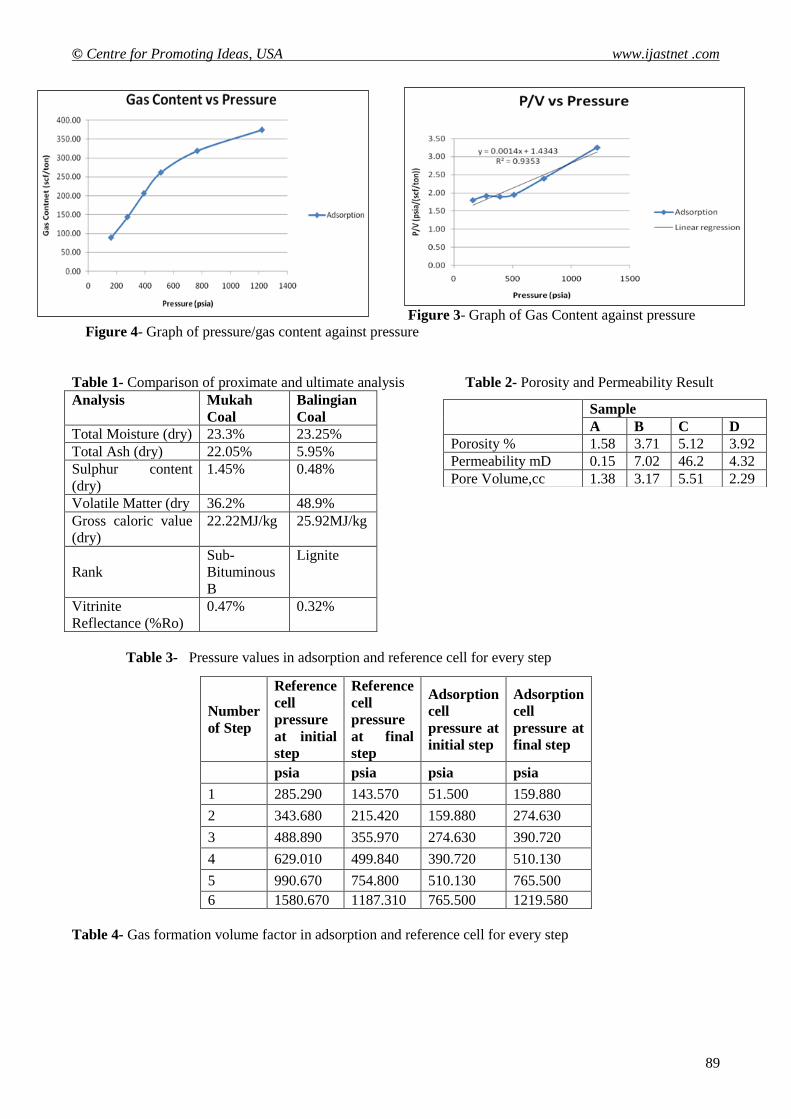
reference cell. The changes of gas content in each step are plotted in Figure 3. At the end of the pressure step,
the total accumulated gas content at 1219.58psia is 374.62scf/ton which is shown in Table 5.
Based on the changes of gas content values in every step, a regression line is drawn on the P/V against P
graph as shown in Figure 4 for Langmuir pressure and Langmuir volume value determination. The Langmuir
pressure is 1024.5 psia and Langmuir Volume is 714.29 scf/ton. Langmuir volume indicates the maximum
level of gas storage capacity and Langmuir pressure is equal to the pressure at which coal storage capacity is
equal to one-half the Langmuir pressure.
6.3 Gas-in-place result
1219.58psia is considered as the maximum pressure where 374.62scf/ton of methane can be stored in the coal
matrix. By using this gas content value, the value of gas-in-place is calculated as shown in table 6. According
to the result above, the values used for the parameters above are based on the limited information such as the
average drainage area, average reservoir thickness and average in-situ density
The average drainage area was measured based on the resource evaluation method by US Geological Survey.
400m of radius from each drill hole was drawn on the map to estimate area of influence (measured resources)
and the area is measured by planimeter. This is the only option in area determination since there is very
limited information [4].
However, in the actual reservoir, there are different types of geologic heterogeneities such as permeability
facies change, coal seam pinch out, channel sandstone deposits and fault offset [4]. Thus, such heterogeneities
disrupt the lateral coalbed continuity which requires a better and accurate reservoir area analysis. Besides,
permeability anisotropy contributes the inaccuracy in drainage area determination. As discussed in literature
review, the coal structure contains cleat system which is not uniform throughout the coal in a given reservoir.
The spacing, aperture and effective porosity of the cleats strongly affected the reservoir permeability. The
permeability and porosity result proven each sample provide different values. As a result, the drainage area
may be substantially different from rule-of-thumb well spacing-based area estimation due to permeability
anisotropy that causes the effective drainage area around the wellbore to have an elliptical shape. Both
geologic heterogeneities and permeability anisotropies are highly site dependent.
Reservoir thickness of each drill hole that encountered coal seams was taken from the lithology test performed
by the GeoQuest Sdn. Bhd. An average reservoir thickness was taken in this evaluation.The density of coal is
a function of its composition. Similar to the average drainage area, the density properties and coal
compositional are not uniform throughout the coalbed reservoir due to geologic variables such as depositional
environment, overlying and underlying rock lithologies, coal rank, equilibrium moisture content, mineral
matter content and maceral composition. In this evaluation, a rule-of-thumb value of 1.335 g/cm³ is used for
the in-situ rock density [15, 16, and 17].
Despite of that, moisture content affects the coal density as well. Moisture in coal reduces its capacity to
adsorb. Based on the previous research, bituminous coals have low in-situ moisture content which is less that
10% whereas the sub-bituminous coal has very high in-situ moisture content which is more than 25% [18, 19,
20, 21]. This shows that the moisture content varies inversely proportional to coal rank. For comparison,
Powder River Basin sub-bituminous coal has an in-situ moisture content of 27% and an ash content of 5%,
hence the density is only about 1.33g/cm³ [20]
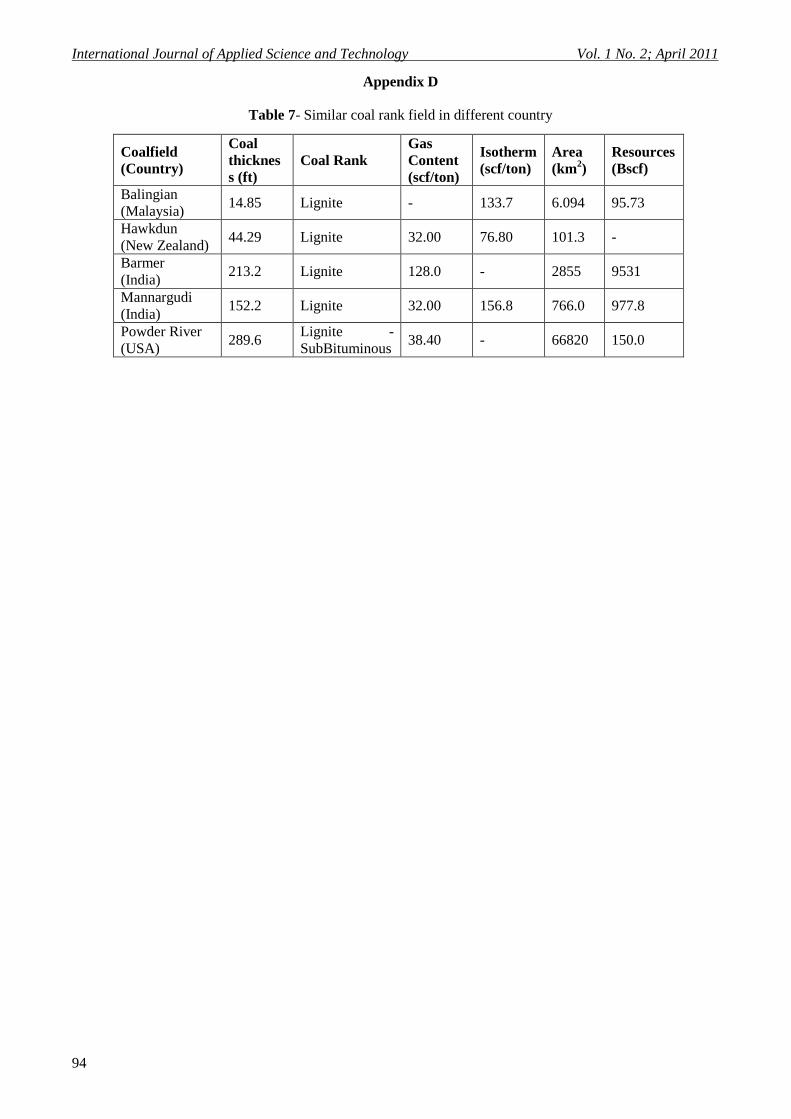
6.4 Comparison between Balingian and other similar coalfields
Based on Table 7 in Appendix D, Hawkdun field was compared with Powder River basin field in Manhire, et
al’s report due to similar coal characteristic and gas content. Despite low gas content, Powder River basin
coals has proven a significant result to successfully developed as a producing CBM fields due to several
postive factors. One of them is the very high permeability which is reflected in gas flow rates of between 500
and 5,000 m3/day being reported [22]. The recorded permeability achieved by Powder River basin is between
80 to 200mD. Nevertheless, Government of India has used the similar approach to evaluate their lignite
coalfields; Barmer and Mannargudi, for block bidding purpose in developing their CBM projects [23,24,25].
Hence, similar coal rank field, Mannargudi and Hawkdun projected similar gas content measurement by direct
method measurements. Mannagudi was reported to have about 977.81Bscf of resources which is quite
significant compares to the Fairview Bituminous coalfield in Australia. Nevertheless, the Balingian coal
showed a very good CBM resources (GIP) for a very small drainage area of about 6km2. Hawkdun field has
recorded gas storage capacity of 76.8scf/ton at pressure of 3000kPa [26].

© Centre for Promoting Ideas, USA www.ijastnet .com
87
Therefore, the ratio of gas storage capacity over pressure of Hawkdun field was used to determine the gas
storage capacity of Balingian at similar pressure. As a result, the gas storage capacity of Balingian field is
double of gas storage capacity of Hawkdun field. On top of that, Balingian field has an excellent permeability
of 46.15mD as it is a one of the contributors to the success of Powder River basin field. Based on these
justifications, Balingian field has proven a great potential for futher and detail study.
7. Conclusion and Further Directions
Based on the adsorption isotherm test and gas-in-place calculation, Balingian coalfield yields a very good
prospect of CBM potential for further detail study due to several reasons:
a) the highest recorded permeability of 46.17mD
b) the area of 6.0937 km2 is able to contain a resource of CBM of 95.37 0Bscf
References
[1] Kim, A.G. (1977). Estimating Methane Content of Bituminous Coalbeds from Adsorption Data, U.S.
Bureau of Mines Report of Investigations, RI8245.
[2] McLennan, J.D., Schafer, P.S. and Pratt, T.J., eds. (1995). A Guide to Determining Coalbed Gas, Gas
Research Institute Report GRI-94/0396, Chicago, Illinois.
[3] Leach WH Hr (2002). New Technology for CBM Production, Opportunities in Coalbed Methane: A
Supplement to Oil and Gas Investor, December 2002, Oil and Gas Investor/Hart Publications, Houstan,
Texas, USA.
[4] Nelson C.R. (1999). Effects of Coalbed Reservoir Property Analysis Methods on Gas-In-Place
Estimates, paper no. SPE 57443.
[5] Aminian K., Coalbed Methane, Fundamental Concepts. [online] Available : http://karl.nrcce.wvu.edu/
regional/CoalbedMethane_Aminian_Paper_2.pdf
[6] Burns, T.D., and Lamarre, R.A., 1997, Drunkard’s Wash project. Coalbed methane production from
Ferron coals in east-central Utah: Tuscaloosa, Abstracts volume, International Coalbed Methane
Symposium, The University of Alabama (pp. 507–520).
[7] Sia, S.G., and Wan Hasiah A. (2010). Preliminary Assessment of the Coalbed Methane Potential of the
Mukah‐Balingian Coal Field,Sarawak, poster presentation at Petroleum Geology Conference and
Exhibition, Kuala Lumpur.
[8] Sia, S.G. and Dorani, J., 2000 (Unpublished). Evaluation of Coal Resources of the Mukah Coalfield,
Sarawak, Malaysia, Minerals and Geoscience Department, Sarawak, GSKL 002/10/148, 49p
[9] Hussein, M.J. and Dorani, J., 2000 (Unpublished). Evaluation of The Coal resources of The East Block
of The Balingian Coal Field, Sarawak, GSKL 002/10/150, 36p
[10] Mavor, M.J., Owen, L.B., Pratt, T.J. (1990). Measurement and Evaluation of Coal Sorption Isotherm
Data, paper no. SPE 20728
[11] Piper L.D., et al. Compressibility factors for naturally occurring petroleum gasses, Texas A&M U.,
Intera Petroleum Production Div.
[12] Yee, D., J.P. Seidle, and W.B. Hanson (1993). Gas Sorption on Coal and Measurement of Gas Content,
Hydrocarbons From Coal, American Association of Petroleum Geologists, Tulsa, Oklahoma, (pp. 203-
218)
[13] R. Puri, Amoco Production Co. And JC Evanoff and ML Brugler, Core Laboratories (1991).
Measurement of Coal Cleat Porosity and Relative Permeability Characteristics.
[14] Ian Palmer and John Mansoori (1996). How Permeability Depends on Stress and Pore Pressure in
Coalbeds: A New Model, Amoco Tulsa Technology Center.
[15] Rightmire, C.T., Eddy, G.E., and Kirr, J.N., eds. (1984). Coalbed Methane Resources of the United
States, AAPG Studies in Geology Series #17, American Association of Petroleum Geologists, Tulsa,
Oklahoma (page no. 375 )
[16] Malone, P.G., Briscoe, F.H., Camp, B.S., and Boyer, C.M., II (1987). Methods of Calculating Coalbed
Methane Reserves with Insight into the Advantages and Disadvantages of Each Method, paper no.
8716, Proc., 1987 Coalbed Methane Symposium, The University of Alabama, Tuscaloosa, Alabama,
(pp. 73-79)
[17] Richardson, J.S., Sparks, D.P., and Burkett, W.C. (1991). The TEAM Project Reserve Analysis: A
Comprehensive Evaluation to Predict Ultimate Recovery of Coalbed Methane, paper no. 9105, Proc.,
1991 Coalbed Methane Symposium, The University of Alabama, Tuscaloosa, Alabama, (pp. 293-306).
[18] Neavel, R.C., Smith, S.E., Hippo, E.J., and Miller, R.N. (1986). Interrelationships between Coal
Compositional Parameters, Fuel, Volume. 65 (pp. 312-320).

International Journal of Applied Science and Technology Vol. 1 No. 2; April 2011
88
[19] Unsworth, J.F., Fowler, C.S., and Jones, L.F. (1989). Moisture in Coal: 2. Maceral Effects on Pore
Structure, Fuel, Volume. 68 (pp. 18-26).
[20] Nelson, C.R., ed. (1989). Chemistry of Coal Weathering, Elsevier Science Publishers, New York (page.
230).
[21] Pratt, T.J., Mavor, M.J., and DeBruyn, R.P. (1999). Coal Gas Resource and Production Potential of
Sub-bituminous Coal in the Powder River Basin, paper no. SPE 55599.
[22] Manhire D.A, Hayton S. Coal Seam Gas in New Zealand: Perspective from New Zealand’s most active
CSG explorers, In-house Report for Kenham Holdings, 12 pages
[23] Pandey J.K. Methane Mitigation in Indian Coal Mining, Central Mining Research Institute, Dhanbad-
826001, India, 11 pages
[24] Ministry of Petroleum & Natural Gas, Government of India (2009). Notice inviting offers for
exploration and production of coal bed methane – fourth offer (CBM-IV), 18 pages
[25] Ministry of Petroleum & Natural Gas, Government of India (2006). Notice inviting offers for
explorations and production of Coalbed Methane, third offer of blocks, 20/2/2006, 21 pages
[26] Pope S.J., et al. Developments in coal seam gas exploration, Geologist, CRL Energy Ltd, PO Box 29-
415, Christchurch, New Zealand, 8 pages.
Figure 1- Mukah-Balingian Coalfield map
Figure 2- Research methodology
Core Properties Analysis
Adsorption Isotherm Test Gas Content Analysis
Gas-in-place Analysis
determination
START
cc GAhG
7.1359
To determine porosity
and permeability by
PoroPerm
END
© Centre for Promoting Ideas, USA www.ijastnet .com
89
Figure 3- Graph of Gas Content against pressure
Figure 4- Graph of pressure/gas content against pressure
Table 1- Comparison of proximate and ultimate analysis Table 2- Porosity and Permeability Result
Analysis Mukah
Coal
Balingian
Coal
Total Moisture (dry) 23.3% 23.25%
Total Ash (dry) 22.05% 5.95%
Sulphur content
(dry)
1.45% 0.48%
Volatile Matter (dry 36.2% 48.9%
Gross caloric value
(dry)
22.22MJ/kg 25.92MJ/kg
Rank
Sub-
Bituminous
B
Lignite
Vitrinite
Reflectance (%Ro)
0.47% 0.32%
Table 3- Pressure values in adsorption and reference cell for every step
Number
of Step
Reference
cell
pressure
at initial
step
Reference
cell
pressure
at final
step
Adsorption
cell
pressure at
initial step
Adsorption
cell
pressure at
final step
psia psia psia psia
1 285.290 143.570 51.500 159.880
2 343.680 215.420 159.880 274.630
3 488.890 355.970 274.630 390.720
4 629.010 499.840 390.720 510.130
5 990.670 754.800 510.130 765.500
6 1580.670 1187.310 765.500 1219.580
Table 4- Gas formation volume factor in adsorption and reference cell for every step
Sample
A B C D
Porosity % 1.58 3.71 5.12 3.92
Permeability mD 0.15 7.02 46.2 4.32
Pore Volume,cc 1.38 3.17 5.51 2.29

International Journal of Applied Science and Technology Vol. 1 No. 2; April 2011
90
Number
of Step
Reference
cell Bg at
initial
step
Reference
cell Bg at
final step
Adsorption
cell Bg at
initial step
Adsorption
cell Bg at
final step
Bgr1 Bgr2 Bgtv1 Bgtv2
1 0.051 0.105 0.294 0.093
2 0.042 0.069 0.093 0.054
3 0.029 0.041 0.054 0.037
4 0.022 0.029 0.037 0.028
5 0.014 0.018 0.028 0.018
6 0.008 0.011 0.018 0.011
Table 5- Changes of gas content for every pressure step.
Numb
er of
Step
Adsorpti
on cell
pressure
at final
step
Gas
Conte
nt at
Step
Start
Gas
Conte
nt at
Step
End
Pressure/
Gas
Content
psia scf/ton scf/ton psia/(scf/t
on)
1 159.880 0 88.80 1.80
2 274.630 88.80 143.24 1.92
3 390.720 143.24 206.01 1.90
4 510.130 206.01 261.54 1.95
5 765.500 261.54 318.90 2.4
6 1219.580 318.90 374.62 3.26
Table 6- Gas content and gas-in-place result
Parameters Value
Area, acres 1505.9
Thickness, ft 93.133
Average in-situ density,
g/cm³
1.3350
Average in-situ gas content,
scf/ton
374.62
Gas-in-place, Bscf 95.370

© Centre for Promoting Ideas, USA www.ijastnet .com
91
APPENDICES
Appendix A
MINERAL AND GEOSCIENCE DEPARTMENT MALAYSIA, SARAWAK
COAL QUALITY TESTING LABORATORY
Identification of test method used
Material tested: - Coal and Coke
Type of test Standard specification
technique/method used
Laboratory test method
reference
Total Moisture
ASTM D 3302 - 07: Standard Test
Method for Total Moisture in Coal
WP/CQL/COAL-01
Moisture In-house Test Method based on ASTM D
3173 – 03: Standard Test Method for
Moisture in the Analysis Sample of Coal
and Coke
WP/CQL/COAL-02
Ash In-house Test Method based on ASTM D
3174 – 04: Standard Test Method for Ash
in the Analysis Sample of Coal and Coke
WP/CQL/COAL-03
Volatile Matter In-house Test Method based on ASTM D
3175 – 07: Standard Test Method for
Volatile Matter in the Analysis Sample of
Coal and Coke
WP/CQL/COAL-04
Proximate Analysis (incl.
Fixed Carbon)
ASTM D 3172 – 07: Standard Practice for
Proximate Analysis for Coal and Coke
WP/CQL/COAL-05
Carbon
Hydrogen
Nitrogen
ASTM D 5373 – 02 (Re-approved 2007):
Standard Test Methods for Instrumental
Determination of Carbon, Hydrogen and
Nitrogen in Laboratory Samples of Coal
and Coke
WP/CQL/COAL-06
Sulphur ASTM D 4239 – 05: Standard Test
Methods for Sulphur in the Analysis
Sample of Coal and Coke using High
Temperature Tube Furnace Combustion
Methods: Method C – High Temperature
Combustion Method with Infrared
Absorption Procedure
WP/CQL/COAL-07
Gross Calorific Value ASTM D 5865 – 07: Standard Test
Method for Gross Calorific Value of Coal
and Coke
WP/CQL/COAL-08
Sample Preparation ASTM D 2013 – 07: Standard Practice for
Preparing Coal Samples for Analysis
WP/CQL/COAL-12
Ultimate Analysis ASTM D 3176 – 89 (Re-approved 2002):
Standard Practice for Ultimate Analysis of
Coal and Coke
WP/CQL/COAL-13
Calculation of Coal
Analysis to Different
bases
ASTM D 3180 – 07: Standard Practice for
Calculating Coal and Coke Analyses from
As-Determined to Different Bases
WP/CQL/COAL-14
Figure 5- Proximate and Ultimate Analysis Code of Standard
International Journal of Applied Science and Technology Vol. 1 No. 2; April 2011
92
Appendix B
Figure 6- Screenshot of Z-factor spreadsheet
Appendix C
Experimental Method: Sorption Isotherm/ Langmuir Isotherm Experiment
Figure 7- Process flow of adsorption isotherm
The selection and preparation of coal sample before measuring adsorption value is the most critical step.
The procedure in sample preparation can be summarized as:
Sample selection
Sample crushing
Proximate analysis
Equilibrium moisture restoration
Measuring isotherm
Sample selection
Samples can be taken from drill cuttings or core. In this study, the sample was taken from random location
in the field.

© Centre for Promoting Ideas, USA www.ijastnet .com
93
Sample crushing
Random samples were crushed together to 60 mesh screen size in order to minimize the time required for
methane to diffuse through the sample and to obtain the composite/ uniform sample. The idea of mixing the
samples from different coal seams or coal of different ash content is to create desired average.
Proximate Analysis
As reported in literature review, the chemical properties of the coal will be used to quantify the mass of coal
present in the isotherm sample. In this case, the proximate value will be taken from the analyses done by the
Geoscience and Mineral Department of Malaysia. As a rule of thumb, it is preferable to select samples with
an ash content of 15% or lower to avoid non-coal affects upon the diffusion behaviour.
Equilibrium moisture restoration (ASTM 1412: ISO 1018)
1. 150 to 200 gram is air-dried to constant weight
2. The sample then is place in the tray and sprayed with a volume of deionized water approximately
equivalent to residual moisture content
3. The residual moisture content is estimated from the difference in the weight of small (approximately
10 to 20 grams), air dried sample before and after drying in a convection oven at 104o Celsius
4. The sample is then placed in vacuum desiccators over a saturated solution of K2SO4.
The vacuum desiccator is evacuated to about 30 mm Hg and the temperature is maintained at 30 ±
0.2o Celcius until the sample reaches a constant weight. If the sample is lignite, it requires 72 hours to
reach equilibrium.
Measuring Isotherm
1. Determination of void volume (Vvoid) using helium calibration
a. The 130g sample is filled into adsorption cell.
b. The reference cell is injected with helium while the connecting valve B between reference cell and
adsorption cell remain closed and allow the pressure to equalize.
c. The helium is flowed into adsorption cell by opening the connecting valve B until the adsorption and
reference cell reaches the thermodynamic equilibrium condition (Valve A is closed)
d. Total volume of the reference and adsorption cells, V2, initial pressure, P1, equilibrium pressure, P2,
and reference cell volume, V1 are determined. Void = V2-V1 is used to determine the void volume
2. Determination of the adsorption of methane
a. Both cell is vacuumed
b. The reference cell is filled with methane while the connecting valve between reference cell and
adsorption cell remain closed at 200psi.
c. The methane is flowed into adsorption cell by opening the connecting valve until the pressure
stabilized. Pressure declination is recorded as a function of time in every 30 sec interval.
d. Once equilibrium is reached, the connecting valve is close. Equilibrium pressure is measured.
e. Step b to step d are repeated with different pressures with incremental of 100psi each step for 6 step.
f. Pressure against time graph is plotted.
g. Gas storage capacity is evaluated at the equilibrium endpoints for each pressure step. Total gas capacity
is the sum of the individual end point gas capacities. The change in gas storage capacity at the
endpoints can be calculated using the Equation 1.
h. The gas formation volume factor can be determined using equation below:
scsc
scg
Tpz
zTpB ........................................................................................................................... (Eq.
5)
Where,
gB = Gas formation volume factor
scp = Pressure at standard conditions, psia
z = Real gas deviation factor
T = Temperature, oR
p = Pressure, psia
scz = Real gas deviation factor at standard condition
scT = Temperature at standard condition, oR
International Journal of Applied Science and Technology Vol. 1 No. 2; April 2011
94
Appendix D
Table 7- Similar coal rank field in different country
Coalfield
(Country)
Coal
thicknes
s (ft)
Coal Rank
Gas
Content
(scf/ton)
Isotherm
(scf/ton)
Area
(km2)
Resources
(Bscf)
Balingian
(Malaysia) 14.85 Lignite - 133.7 6.094 95.73
Hawkdun
(New Zealand) 44.29 Lignite 32.00 76.80 101.3 -
Barmer
(India) 213.2 Lignite 128.0 - 2855 9531
Mannargudi
(India) 152.2 Lignite 32.00 156.8 766.0 977.8
Powder River
(USA) 289.6
Lignite -
SubBituminous 38.40 - 66820 150.0