Predicting Volume of Distribution in Humans: Performance ...
45
Predicting Volume of Distribution in Humans: Performance of in silico Methods for A Large Set of Structurally Diverse Clinical Compounds Neha Murad 1,4,# , Kishore K. Pasikanti 1,4,#, *, Benjamin D. Madej 3,4 , Amanda Minnich 2,4 , Juliet M. McComas 1,4 , Sabrinia Crouch 1,4 , Joseph W. Polli 1,4 and Andrew D. Weber 1,4 # Equal contributions (co-first authors) 1 GlaxoSmithKline, 1250 S. Collegeville Road, Collegeville, 19426-0989, PA, USA 2 Lawrence Livermore National Laboratory, P.O. Box 808, Livermore, CA 94551, USA 3 Frederick National Laboratory for Cancer Research, P.O. Box B, Frederick, MD 21702- 1201, USA 4 Accelerating Therapeutics for Opportunities in Medicine (ATOM) Consortium, 499 Illinois Street, San Francisco, CA 94158-2518, USA *To whom correspondence should be addressed. Kishore Kumar Pasikanti ATOM, 499 Illinois Street, San Francisco, CA 94158-2518, USA Tel, +16109174036 Email: [email protected] This article has not been copyedited and formatted. The final version may differ from this version. DMD Fast Forward. Published on November 25, 2020 as DOI: 10.1124/dmd.120.000202 at ASPET Journals on November 25, 2021 dmd.aspetjournals.org Downloaded from
Transcript of Predicting Volume of Distribution in Humans: Performance ...

Predicting Volume of Distribution in Humans: Performance of
in silico Methods for A Large Set of Structurally Diverse
Clinical Compounds
Neha Murad1,4,#, Kishore K. Pasikanti1,4,#,*, Benjamin D. Madej3,4, Amanda Minnich2,4,
Juliet M. McComas1,4, Sabrinia Crouch1,4, Joseph W. Polli1,4 and Andrew D. Weber1,4
#Equal contributions (co-first authors)
1GlaxoSmithKline, 1250 S. Collegeville Road, Collegeville, 19426-0989, PA, USA
2Lawrence Livermore National Laboratory, P.O. Box 808, Livermore, CA 94551, USA
3Frederick National Laboratory for Cancer Research, P.O. Box B, Frederick, MD 21702-
1201, USA
4Accelerating Therapeutics for Opportunities in Medicine (ATOM) Consortium, 499
Illinois Street, San Francisco, CA 94158-2518, USA
*To whom correspondence should be addressed.
Kishore Kumar Pasikanti
ATOM, 499 Illinois Street, San Francisco, CA 94158-2518, USA Tel, +16109174036
Email: [email protected]
This article has not been copyedited and formatted. The final version may differ from this version.DMD Fast Forward. Published on November 25, 2020 as DOI: 10.1124/dmd.120.000202
at ASPE
T Journals on N
ovember 25, 2021
dmd.aspetjournals.org
Dow
nloaded from
Running title:
In silico Prediction of Volume of Distribution in Humans
Corresponding Author:
Kishore Kumar Pasikanti
ATOM, 499 Illinois Street, San Francisco, CA 94158-2518, USA Tel, +16109174036
Email: [email protected]
Number of text pages:29
Number of tables:4
Number of figures:6
Number of references:37
Number of words in the Abstract:245
Number of words in the Introduction:735
Number of words in the Discussion:1504
List of Abbreviations
VD,ss: Volume of Distribution at steady state; fup: fraction unbound in plasma; BPR:
Blood to Plasma partition ratio; ML: Machine Learning; Kp: Tissue-to-plasma partition
coefficient
This article has not been copyedited and formatted. The final version may differ from this version.DMD Fast Forward. Published on November 25, 2020 as DOI: 10.1124/dmd.120.000202
at ASPE
T Journals on N
ovember 25, 2021
dmd.aspetjournals.org
Dow
nloaded from

1
Abstract
Volume of distribution at steady state (VD,ss) is one of the key pharmacokinetic parameters
estimated during the drug discovery process. Despite considerable efforts to predict VD,ss,
accuracy and choice of prediction methods remain a challenge, with evaluations constrained to
a small set (<150) of compounds. To address these issues, a series of in silico methods for
predicting human VD,ss directly from structure were evaluated using a large set of clinical
compounds. Machine learning (ML) models were built to predict VD,ss directly, and to predict
input parameters required for mechanistic and empirical VD,ss predictions. In addition, LogD,
fraction unbound in plasma (fup) and blood to plasma partition ratio (BPR) were measured on
254 compounds to estimate impact of measured data on predictive performance of mechanistic
models. Furthermore, impact of novel methodologies such as measuring partition (Kp) in
adipocytes and myocytes (n=189) on VD,ss predictions was also investigated. In predicting VD,ss
directly from chemical structures, both mechanistic or empirical scaling using a combination of
predicted rat and dog VD,ss demonstrated comparable performance (62-71% within 3-fold). The
direct ML model outperformed other in silico methods (75% within 3-fold, r2=0.5, AAFE=2.2)
when built from a larger dataset. Scaling to human either from predicted VD,ss of rat or dog
yielded poor results (<47% within 3-fold). Measured fup and BPR improved performance of
mechanistic VD,ss predictions significantly (81% within 3-fold, r2=0.6, AAFE=2.0). Adipocyte
intracellular Kp showed good correlation to the VD,ss, but was limited in estimating the
compounds with low VD,ss.
Significance Statement: This work advances the in-silico prediction of VD,ss directly from
structure and with the aid of in vitro data. Rigorous and comprehensive evaluation of various
methods using a large set of clinical compounds (n=956) is presented. The scale of both
techniques and number of compounds evaluated is far beyond any previously presented. The
This article has not been copyedited and formatted. The final version may differ from this version.DMD Fast Forward. Published on November 25, 2020 as DOI: 10.1124/dmd.120.000202
at ASPE
T Journals on N
ovember 25, 2021
dmd.aspetjournals.org
Dow
nloaded from
2
novel data set (n=254) generated using a single protocol for each in vitro assay reported in this
study could further aid in advancing VD,ss prediction methodologies.
This article has not been copyedited and formatted. The final version may differ from this version.DMD Fast Forward. Published on November 25, 2020 as DOI: 10.1124/dmd.120.000202
at ASPE
T Journals on N
ovember 25, 2021
dmd.aspetjournals.org
Dow
nloaded from

3
Introduction
The current drug discovery path is a sequential, time-consuming process with a high attrition
rate (Hinkson et al., 2020). Attrition of small-molecule drug candidates due to poor
pharmacokinetic (PK) profiles has diminished significantly in recent years (Waring et al., 2015).
This advancement can partly be attributed to the unprecedented emphasis on screening
compounds based on PK parameters in drug discovery phase (Ferreira and Andricopulo, 2019).
PK is a well-recognized and fundamental property that influences drug concentrations at target,
which ultimately determines a drug’s efficacy and safety (Ferreira and Andricopulo, 2019).
Volume of distribution at steady state (VD,ss) is a key PK parameter that describes the
relationship between drug concentration measured in plasma or blood to the amount of drug in
the body at equilibrium (Smith et al., 2015). Estimation of apparent VD,ss is of utmost importance
because it influences maximal concentration (Cmax) and half-life (t1/2) in plasma and target
tissues, which in turn determines dose and dosing regimen in the clinic (del Amo et al., 2013).
Towards this end, VD,ss in humans is commonly predicted using preclinical in vivo and in vitro
data in conjunction with various allometric scaling methods such as Oie and Tozer method
(Jones et al., 2011). Alternatively, VD,ss can be extrapolated from tissue-to-plasma partition
coefficients (Kp) from preclinical species, generally rat (Nigade et al., 2019). These experiments
are resource intensive and require the synthesis of compounds; these limitations further hinder
the ability to predict human VD,ss early in drug discovery or during lead optimization. Thus,
considerable effort has been undertaken to develop predictive in silico models to accelerate and
reduce the cost of drug discovery processes (Wenzel et al., 2019). As VD,SS is dependent on
the tissue partitioning of compounds, numerous studies have focused on developing in silico
approaches to predict tissue partitioning based on physicochemical properties such as pKa and
LogP, plasma protein binding (PPB), and blood to plasma partitioning ratio (BPR) (Graham et
al., 2012; del Amo et al., 2013). Poulin and Theil were one of the first to propose a mechanistic
This article has not been copyedited and formatted. The final version may differ from this version.DMD Fast Forward. Published on November 25, 2020 as DOI: 10.1124/dmd.120.000202
at ASPE
T Journals on N
ovember 25, 2021
dmd.aspetjournals.org
Dow
nloaded from

4
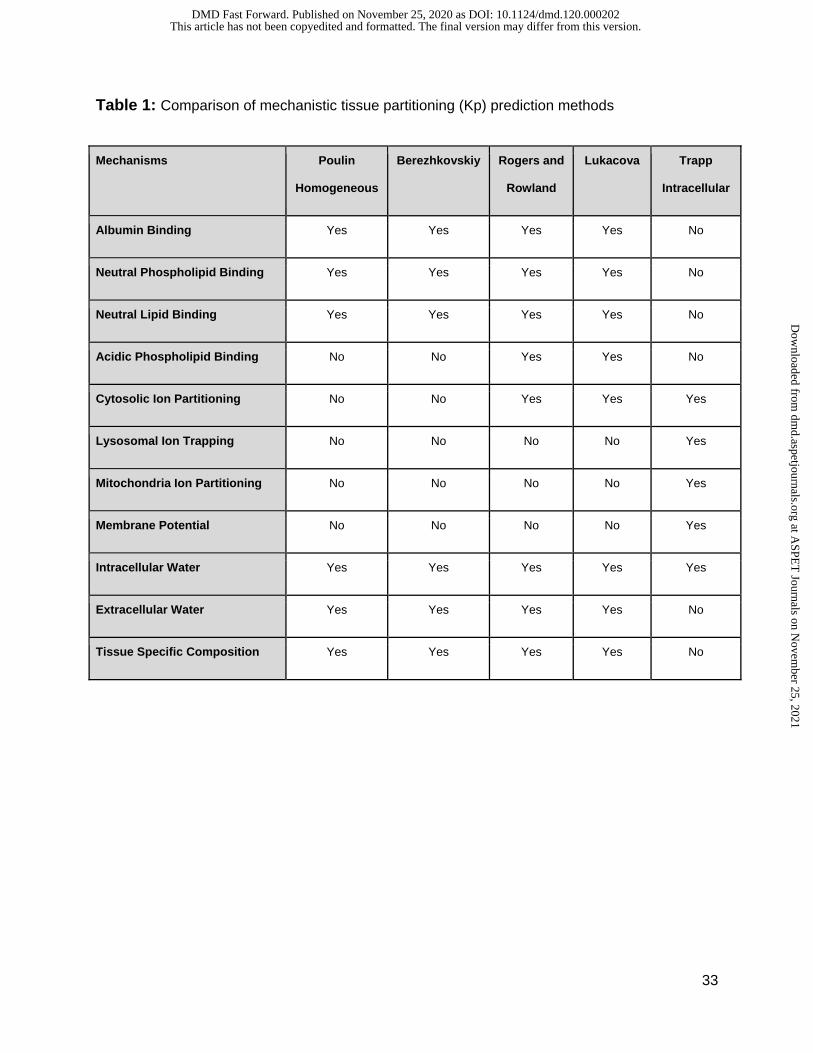
Kp prediction method (Poulin and Krishnan, 1995; Poulin and Theil, 2002). This method
incorporates several important mechanisms like albumin binding, neutral lipid and phospholipid
binding. Berezhkovskiy (Berezhkovskiy, 2004) is another method similar to Poulin and Theil.
Rogers and Rowland (Rodgers et al., 2005; Rodgers and Rowland, 2006) is by far the most
comprehensive Kp prediction method in terms of mechanisms captured. It includes all the
mechanisms captured in previous published methods along with the addition of acidic
phospholipid and cytosolic ion partitioning. A drawback for the Rogers and Rowland method is
that there are two sets of equations based on the dissociation constant or pKa of the
compounds and the cutoff or switch between these equations was set at a pKa of 7. This results
in a discontinuous relationship between the dissociation constant and plasma tissue partitioning.
Finally, the method is also heavily dependent on accurate pKa predictions. To address these
issues, a modified Rodgers and Rowland method was developed (Lukacova et al., 2008) that
employs a single continuous combined equation for compounds regardless of pKa. Ion
partitioning into acidic or basic intracellular compartments (lysosomes and mitochondria) was
described by Trapp, et al and can be used as an aid to Kp prediction method for compounds
where ion trapping is expected (Trapp et al., 2008). Key mechanisms that play a crucial role in
partitions itself between plasma and the specific organ tissue implemented by each prediction
method is summarized in Table 1.
Prediction of VD,ss accurately remains a challenge that has not been adequately solved (Smith et
al., 2015). Few studies have evaluated the performance of various VD,ss prediction methods;
however, these reports were either in preclinical species (Graham et al., 2012) or used a small
set (<150) of clinical compounds (Jones et al., 2011; Korzekwa and Nagar, 2017; Chan et al.,
2018; Nigade et al., 2019; Mayumi et al., 2020). Recently, Lombardo et al. published a manually
curated dataset of VD,ss for 1352 drugs following IV dosing (Lombardo et al., 2018), which
presented an opportunity to evaluate the predictive performance of various VD,ss methodologies
This article has not been copyedited and formatted. The final version may differ from this version.DMD Fast Forward. Published on November 25, 2020 as DOI: 10.1124/dmd.120.000202
at ASPE
T Journals on N
ovember 25, 2021
dmd.aspetjournals.org
Dow
nloaded from

5
in determining human VD,ss. Therefore, we investigated the (1) performance of the most
common VD,ss prediction strategies, (2) sensitivity of input parameters that influence VD,ss
predictions, (3) impact of experimental data on mechanistic VD,ss predictions, and (4) if novel
methodologies such as using adipocyte and myocyte cell partitioning could improve VD,ss
predictions.
Materials and Methods
Experimental Approaches
VD,ss prediction strategies investigated are broadly categorized into two approaches based on
the starting data for the analysis, which is either fully in silico (e.g., structural) or in vitro
(experimental). Based on the compound availability, an initial in vitro experimental data set of
331 compounds (Lombardo et al., 2018) was identified. Predictive performances were
assessed using 956 for the in silico and 254 compounds for the in vitro experimental
approaches, respectively.
For the in silico approach, VD,ss was predicted directly from chemical structure (using compound
SMILES as input) by using the following four approaches (1) mechanistic VD,ss prediction using
predicted physicochemical properties from commercial software (ADMET predictor 9.0) or (2)
using machine learning (ML) models generated by the ATOM consortium, (3) allometric scaling
from predicted VD,ss for preclinical species such as rat and dog ML models and (4) direct human
VD,ss predictions using ML model built using clinical compounds (see schematic shown in Figure
1).
In the ‘experimental data’ approach, two distinct experimental datasets were generated. The
first experimental dataset included measurement of physicochemical properties under a single
This article has not been copyedited and formatted. The final version may differ from this version.DMD Fast Forward. Published on November 25, 2020 as DOI: 10.1124/dmd.120.000202
at ASPE
T Journals on N
ovember 25, 2021
dmd.aspetjournals.org
Dow
nloaded from
6
protocol for each in vitro experiments, which included LogD, fraction unbound in plasma (fup),
and blood to plasma partition ratio (BPR) for 331 clinical compounds (Lombardo et al., 2018).
The above experimental data was used as input parameters individually or in combination to
predict mechanistic VD,ss (Lukacova et al., 2008) . In addition, novel experiments were
conducted to determine partition of compounds in human adipocytes and myocytes for 200
compounds that were a subset of the above selected 331 compounds. In silico and
experimental methodologies are further described in detail below. Percentage of compounds
that had accurately predicted VD,ss within 2, 3 or 10-fold, r2 (Pearson correlation coefficient) and
Absolute Average Fold Error (AAFE) were used as key criteria for comparison of predictive
performance of each method.
In silico Methods
VD,ss of the clinical compounds dataset (Lombardo et al., 2018) was sub-divided based on if
experimental data was directly measured (331 compounds) or not (970 compounds). Evaluation
of in silico methods was performed on both datasets. It is important to note that all the
evaluations were performed on a complete hold-out set. For example, when predicting VD,ss for
experimental dataset, none of the compounds in the experimental dataset were a part of any of
the ML model building datasets.
ADMET Mechanistic VD,ss Prediction: ADMET Predictor (version 9.0) was used to predict
pKa (S+Acidic_pKa, S+Basic_pKa), fraction unbound in plasma (hum_fup%, converted to fup),
blood to plasma ratio (BPR), Log P/D (S+logD, S+LogP) from chemical structure. These
parameters were subsequently used as input parameters to predict mechanistic Kp and human
VD,ss predictions (Lukacova et al., 2008). Predicted values of the input parameters were limited
This article has not been copyedited and formatted. The final version may differ from this version.DMD Fast Forward. Published on November 25, 2020 as DOI: 10.1124/dmd.120.000202
at ASPE
T Journals on N
ovember 25, 2021
dmd.aspetjournals.org
Dow
nloaded from
7
to typical assay limits for each of the input parameters (hum_fup%: 0.1 to 100%, BPR: 0 to 200,
Log P and Log D: -3 to 10).
This article has not been copyedited and formatted. The final version may differ from this version.DMD Fast Forward. Published on November 25, 2020 as DOI: 10.1124/dmd.120.000202
at ASPE
T Journals on N
ovember 25, 2021
dmd.aspetjournals.org
Dow
nloaded from

8
ATOM Mechanistic, Allometry and Direct ML predictions
ATOM Mechanistic VD,ss Prediction: Datasets generated by GlaxoSmithKline (Supplemental
Table S1) containing molecular structure information and physicochemical parameters (LogD,
fup, BPR) were split into train, validation and test subsets. Model training and evaluation was
generally performed as previously described (Minnich et al., 2020). Briefly, a grid search
hyperparameter optimization technique was employed to train several machine learning models
(Neural Networks (NN) and Random Forests (RF)) with different hyperparameter combinations
(learning rate, layer sizes, number of nodes, dropout rates for NN and maximum depth, number
of trees for RF), splitting strategies (random and scaffold) and featurization techniques (graph
convolution, ecfp, MOE descriptors and Mordred descriptors). Additional details related to
datasets and model performances are described in Supplemental Table S1. Models with highest
validation set R2 (coefficient of determination calculated using sklearn’s r2_score package)
regression score function were selected to predict fup, BPR, LogD from chemical structures.
These parameters were subsequently utilized to predict mechanistic Kp and human VD,ss
predictions by Lukacova method (Lukacova et al., 2008) as described in ‘ADMET Mechanistic
VD,ss Prediction’ section above.
Allometric Scaling: Rat fup, rat VD,ss, dog fup, dog VD,ss and human fup values were
predicted using ATOM ML models built on GSK proprietary datasets as described in ‘ATOM
Mechanistic VD,ss Prediction’ section (Supplemental Table S1). Subsequently, human VD,ss was
predicted using following three methods:
(1) Single species allometry scaling from rat (Jones et al., 2011)
𝐻𝑢𝑚𝑎𝑛 𝑉𝐷𝑠𝑠 = (𝑅𝑎𝑡 𝑉𝐷𝑠𝑠) × (𝐻𝑢𝑚𝑎𝑛 𝑓𝑢𝑝
𝑅𝑎𝑡 𝑓𝑢𝑝)
This article has not been copyedited and formatted. The final version may differ from this version.DMD Fast Forward. Published on November 25, 2020 as DOI: 10.1124/dmd.120.000202
at ASPE
T Journals on N
ovember 25, 2021
dmd.aspetjournals.org
Dow
nloaded from

9
(2) Single species allometry scaling from dog (Jones et al., 2011)
𝐻𝑢𝑚𝑎𝑛 𝑉𝐷𝑠𝑠 = (𝐷𝑜𝑔 𝑉𝐷𝑠𝑠) × (𝐻𝑢𝑚𝑎𝑛 𝑓𝑢𝑝
𝐷𝑜𝑔 𝑓𝑢𝑝)
(3) Predicted from rat and dog VD,ss using two species (Wajima et al., 2003)
𝑙𝑜𝑔 (𝐻𝑢𝑚𝑎𝑛 𝑉𝐷𝑠𝑠)
= (0.07714 ×𝑙𝑜𝑔 (𝑅𝑎𝑡 𝑉𝐷𝑠𝑠) ×𝑙𝑜𝑔 (𝐷𝑜𝑔 𝑉𝐷𝑠𝑠) ) + 0.5147 𝑙𝑜𝑔 (𝐷𝑜𝑔 𝑉𝐷𝑠𝑠)
+ 0.586
Direct ML models: An alternative approach to mechanistic prediction of human VD,ss is to
build machine learning (ML) models to predict volumes of distribution directly from chemical
structures. For this approach, regression models based on molecular structure were fit to
directly predict the log base 10 experimental human VD,ss values of clinical compounds
(Lombardo et al., 2018). Compounds were clustered by Bemis-Murcko scaffold, and
subsequently divided into training, validation, and test sets starting with the largest cluster size
to the smallest cluster size. A train/validation/test split of 70%/10%/20% was used to train and
evaluate random forest and neural network models as described for the in vitro parameter
models (Minnich et al., 2020). Neural network models sampled different combinations of
learning rates, layer sizes, and number of nodes. Random forest models sampled different
maximum tree depth and number of trees. Several featurization approaches were used
including DeepChem’s (https://github.com/deepchem/deepchem) graph convolution model,
ECFP, and calculated MOE and Mordred descriptors. Models were selected by picking the
model with the maximum validation set R2. Clinical compounds were grouped into two sets. The
first set of compounds were the 287 compounds that were selected for experimental
measurements (BPR, fup, and logD). The second set of compounds were the 970 additional
compounds described in Lombardo et al. (Lombardo et al., 2018) without further experimental
This article has not been copyedited and formatted. The final version may differ from this version.DMD Fast Forward. Published on November 25, 2020 as DOI: 10.1124/dmd.120.000202
at ASPE
T Journals on N
ovember 25, 2021
dmd.aspetjournals.org
Dow
nloaded from

10
measurements. These sets were used in two ways for fitting and prediction. (1) To compare
predictive performance of the direct ML models against the other in vitro approaches; models
were trained using the 970 human VD,ss of compounds without further experimental
measurements. The VD,ss ML model was then used to predict VD,ss for the 287 compounds with
new experimental measurements for comparison with in vitro methods. (2) A very challenging
(due to small size of training set) external test set was used by inverting the previous approach.
Models were developed using 287 compounds with new experimental measurements. Then, the
fit model was used to predict VD,ss for the 970 compounds without further experimental
measurements. In both approaches, the set of compounds used for model development was
further split into training, validation, and internal test sets as previously described.
Experimental Data
LogD: The Chromatographic Hydrophobicity Index (CHI) (Valko et al., 1997) values were
measured using reversed phase HPLC column (50 x 2 mm 3 µM Gemini NX C18, Phenomenex,
UK) with fast acetonitrile gradient at starting mobile phase of pHs 2, 7.4 and 10.5. CHI values
are derived directly from the gradient retention times using calibration parameters for standard
compounds. The CHI value approximates to the volume % organic concentration when the
compound elutes. CHI is linearly transformed into ChromlogD (Young et al., 2011) by least-
square fitting of experimental CHI values to calculated ClogP values for over 20,000 research
compounds using the following formula: ChromlogDpH=7.4 = 0.0857CHI-2.00.
Blood to Plasma Partition Ratio (BPR): In vitro measurement of blood to plasma partition
was conducted in human blood (K2EDTA as anticoagulant) obtained from a commercial source
(BioReclamation IVT, Liverpool, NY). Hematocrit (the ratio of volume of red blood cells (RBC) to
This article has not been copyedited and formatted. The final version may differ from this version.DMD Fast Forward. Published on November 25, 2020 as DOI: 10.1124/dmd.120.000202
at ASPE
T Journals on N
ovember 25, 2021
dmd.aspetjournals.org
Dow
nloaded from
11
total blood) was measured by centrifugation of the whole blood at 3000 rpm for 10 minutes
using micro-hematocrit capillary tubes. Control plasma was prepared from a portion of the whole
blood by centrifugation at 3,000 g for 10 minutes. Both whole blood and control plasma samples
were warmed at 37°C in a water bath for 30 minutes. Subsequently, the test compounds (1 µM
in the final concentration) and controls (Methazolamide (BPR ~1) and Metoprolol (BPR ~40))
were spiked into blood and incubated at 37°C (5% CO2) with shaking at 200 rpm for 60 minutes
along with control samples. After incubation for 60 minutes, the incubated whole blood was
removed from the water bath and the plasma was separated by centrifugation at 1,000 g for 10
minutes. Aliquots of the control plasma were also removed. All plasma samples (50 µL) were
treated with 400 µL of ice-cold acetonitrile containing an internal standard (100 ng/mL
tolbutamide in acetonitrile). After the removal of protein by centrifugation at 1,640 g (3,000 rpm)
for 10 minutes at 4°C, the supernatants were transferred to HPLC autosampler plate. Test
compounds and internal standard response (or peak area) ratio in whole blood and its resulting
plasma were measured using LC/MS/MS. Blood to plasma partition was calculated by ratio of
mass spectrometric response of compounds in blood samples after 60 min incubation to mass
spectrometric response in plasma samples.
Fraction Unbound in Plasma (fup): In vitro measurement of fup was conducted using a
rapid equilibrium dialysis (RED) device. Fup values of test compounds and a positive control
(Warfarin) were determined at a single time point of 4 hours post incubation. Considering high
surface-to-volume ratio of the membrane compartment in RED device, equilibrium is expected
to be achieved within 4 hours of incubution (Waters et al., 2008). Stock solutions of test
compounds and Warfarin were prepared in dimethyl sulfoxide (DMSO) at concentrations of 5
mM and subsequently diluted to a final concentration of 0.5 mM in DMSO:water (1:1, v/v).
Incubation mixtures were prepared by diluting the stock solution into human plasma obtained
from a commercial source (BioReclamation IVT, Liverpool, NY). Final concentrations of
This article has not been copyedited and formatted. The final version may differ from this version.DMD Fast Forward. Published on November 25, 2020 as DOI: 10.1124/dmd.120.000202
at ASPE
T Journals on N
ovember 25, 2021
dmd.aspetjournals.org
Dow
nloaded from

12
compounds in incubation mixture were 5 µM. Human plasma was pre-warmed in a water bath at
37°C prior to the experiment. 400 µL of the stopping solution (100 ng/mL tolbutamide in
acetonitrile) was added to a 96-deep well sample collection plate on ice. In a RED device, 500
µL of phosphate buffered saline (PBS) was added to the white chambers (receiver side) and
aliquots (300 µL) of each incubation mixture were spiked into the red wells (donor side). A
sample (40 µL) of the incubation mixture was transferred into the 0-minute wells on the sample
collection plate. The device and remaining spiked plasma samples were incubated at 37°C for 4
hours with shaking at 150 rpm. After the incubation period, 40 µL of the remaining spiked
plasma was transferred to the sample collection plate. All samples in the RED device were
mixed by pipetting prior to aliquoting (40 µL) from each donor well into a well containing 160 µL
of PBS buffer. A sample (160 µL) of each receiver well was aliquoted into a tube containing 40
µL of blank plasma. PBS (160 µL) was added to the 0-minute and 240-minute stability wells.
Analysis of samples was performed using LC/MS/MS. For all samples, peak area ratios were
used to determine percent unbound. Plasma proteins were precipitated with 400 μL of
acetonitrile containing 100 ng/mL tolbutamide as a mass spectral internal standard. The
resulting mixtures were vortex‑ mixed, followed by centrifugation for 15 minutes at >3500
rpm/min. A sample (100 µL) of the supernatant/well was transferred to a clean 96 well plate
containing 100 µL of ultrapure water/well. The plate was vortexed for 1 minute at >1700
rpm/min. Aliquots (4 µL) of the resulting supernatant were injected onto the LC/MS/MS system
to obtain peak area ratios for each compound to determine fraction unbound in plasma.
Equilibrium dialysis method for measuring fup, is amenable to automation and is generally
accepted as the ‘gold standard’ (Trainor, 2007).
Adipocyte and Myocyte Partition: Intracellular partition of compounds in adipocytes and
myocytes were determined using protocol described previously (Treyer et al., 2018). Primary
human adipocytes and myocytes were obtained from commercial sources (Lonza, MD). The test
This article has not been copyedited and formatted. The final version may differ from this version.DMD Fast Forward. Published on November 25, 2020 as DOI: 10.1124/dmd.120.000202
at ASPE
T Journals on N
ovember 25, 2021
dmd.aspetjournals.org
Dow
nloaded from

13
compounds and controls at a final concentration of 0.5 μM were incubated with fully
differentiated myocytes and adipocytes plated in culture in triplicate at 37°C (5% CO2) with
shaking at 100 rpm for 45 mins. After the end of the incubation, the medium was transferred to a
stop solution containing acetonitrile and internal standard (100 ng/ml Tolbutamide in
Acetonitrile). The cell layer was washed with 200µL of cold Hank’s buffered salt solution (HBSS)
and extracted with stop solution (100 ng/mL tolbutamide in acetonitrile). Both the intracellular
and extracellular compound concentrations were analyzed using LC/MS/MS. The cell protein
concentration was determined by the bicinchoninic acid (BCA) assay. Intracellular drug
accumulation (Kp) were calculated from the peak area ratios of the analyte to internal standard
in the medium, cells, and protein concentration from following 𝐾𝑝𝑖𝑛𝑡𝑟𝑎−𝑐𝑒𝑙𝑙 equation. Protein
content was quantified using the BCA assay in representative wells to calculate the cellular
volume (𝑉𝑐𝑒𝑙𝑙), assuming 6.5 μL/mg protein (Treyer et al., 2018). Amount of drug in the cells
(𝐴𝑐𝑒𝑙𝑙) was estimated using peak area ratio and volume of cell lysate (area ratio x volume of cell
lysate). 𝐶𝑚𝑒𝑑𝑖𝑢𝑚 refers to corrected medium concentration. Intracellular accumulation was
determined using Cell Lysate Concentration × Volume of cell lysate (150 µl). Subsequently, the
𝐾𝑝𝑓𝑎𝑡 or 𝐾𝑝𝑚𝑢𝑠𝑐𝑙𝑒 are calculated accounting from protein binding in plasma.
𝐾𝑝𝑖𝑛𝑡𝑟𝑎−𝑐𝑒𝑙𝑙 =(
𝐴𝑐𝑒𝑙𝑙𝑉𝑐𝑒𝑙𝑙
)
𝐶𝑚𝑒𝑑𝑖𝑢𝑚
𝐾𝑝𝑓𝑎𝑡 = 𝑓𝑢𝑝 × 𝐾𝑝𝑎𝑑𝑖𝑝𝑜𝑐𝑦𝑡𝑒,𝑖𝑛𝑡𝑟𝑎−𝑐𝑒𝑙𝑙
𝐾𝑝𝑚𝑢𝑠𝑐𝑙𝑒 = 𝑓𝑢𝑝 × 𝐾𝑝𝑚𝑦𝑜𝑐𝑦𝑡𝑒, 𝑖𝑛𝑡𝑟𝑎−𝑐𝑒𝑙𝑙
Predictions Based on Experimental Data
This article has not been copyedited and formatted. The final version may differ from this version.DMD Fast Forward. Published on November 25, 2020 as DOI: 10.1124/dmd.120.000202
at ASPE
T Journals on N
ovember 25, 2021
dmd.aspetjournals.org
Dow
nloaded from
14
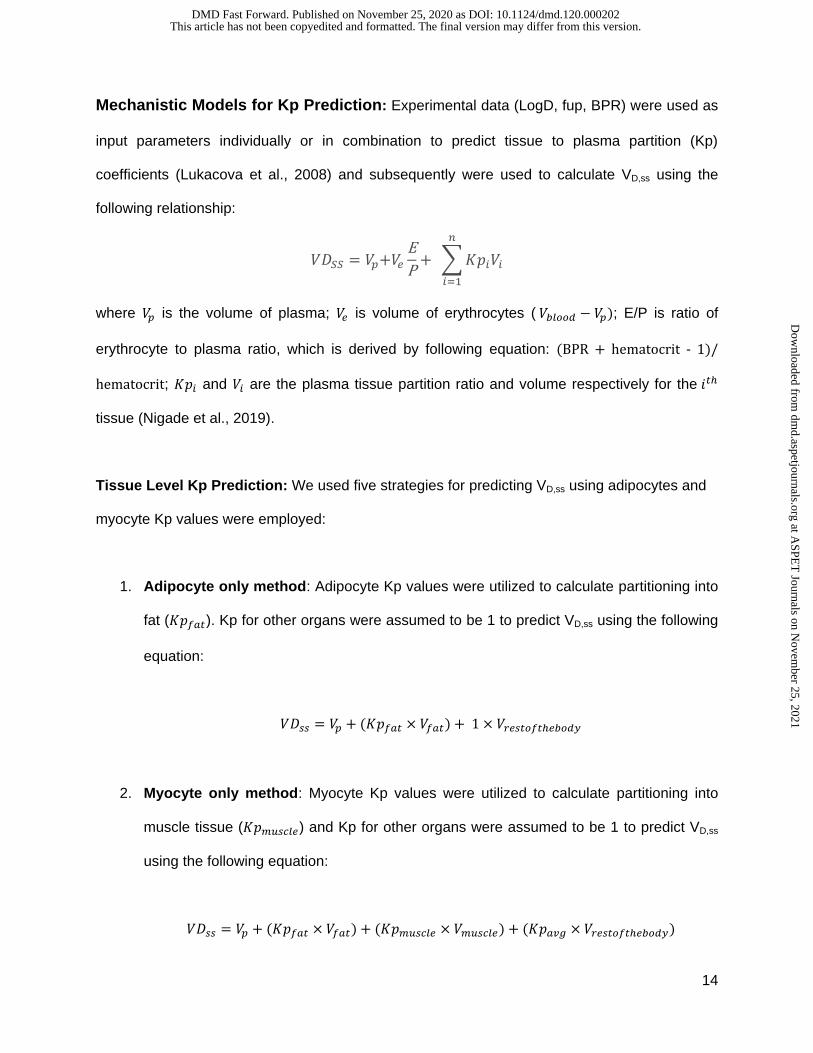
Mechanistic Models for Kp Prediction: Experimental data (LogD, fup, BPR) were used as
input parameters individually or in combination to predict tissue to plasma partition (Kp)
coefficients (Lukacova et al., 2008) and subsequently were used to calculate VD,ss using the
following relationship:
𝑉𝐷𝑆𝑆 = 𝑉𝑝+𝑉𝑒
E
P+ ∑ 𝐾𝑝𝑖𝑉𝑖
𝑛
𝑖=1
where 𝑉𝑝 is the volume of plasma; 𝑉𝑒 is volume of erythrocytes ( 𝑉𝑏𝑙𝑜𝑜𝑑 − 𝑉𝑝); E/P is ratio of
erythrocyte to plasma ratio, which is derived by following equation: (BPR + hematocrit - 1)/
hematocrit; 𝐾𝑝𝑖 and 𝑉𝑖 are the plasma tissue partition ratio and volume respectively for the 𝑖𝑡ℎ
tissue (Nigade et al., 2019).
Tissue Level Kp Prediction: We used five strategies for predicting VD,ss using adipocytes and
myocyte Kp values were employed:
1. Adipocyte only method: Adipocyte Kp values were utilized to calculate partitioning into
fat (𝐾𝑝𝑓𝑎𝑡). Kp for other organs were assumed to be 1 to predict VD,ss using the following
equation:
𝑉𝐷𝑠𝑠 = 𝑉𝑝 + (𝐾𝑝𝑓𝑎𝑡 × 𝑉𝑓𝑎𝑡) + 1 × 𝑉𝑟𝑒𝑠𝑡𝑜𝑓𝑡ℎ𝑒𝑏𝑜𝑑𝑦
2. Myocyte only method: Myocyte Kp values were utilized to calculate partitioning into
muscle tissue (𝐾𝑝𝑚𝑢𝑠𝑐𝑙𝑒) and Kp for other organs were assumed to be 1 to predict VD,ss
using the following equation:
𝑉𝐷𝑠𝑠 = 𝑉𝑝 + (𝐾𝑝𝑓𝑎𝑡 × 𝑉𝑓𝑎𝑡) + (𝐾𝑝𝑚𝑢𝑠𝑐𝑙𝑒 × 𝑉𝑚𝑢𝑠𝑐𝑙𝑒) + (𝐾𝑝𝑎𝑣𝑔 × 𝑉𝑟𝑒𝑠𝑡𝑜𝑓𝑡ℎ𝑒𝑏𝑜𝑑𝑦)
This article has not been copyedited and formatted. The final version may differ from this version.DMD Fast Forward. Published on November 25, 2020 as DOI: 10.1124/dmd.120.000202
at ASPE
T Journals on N
ovember 25, 2021
dmd.aspetjournals.org
Dow
nloaded from
15
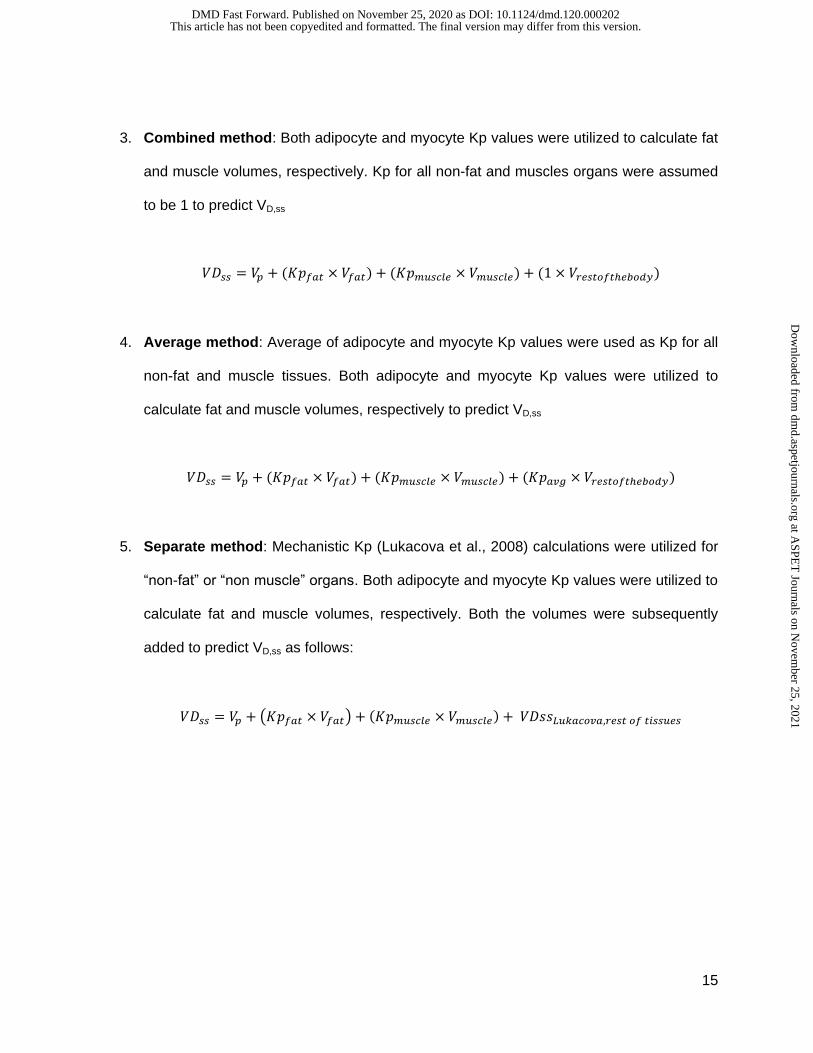
3. Combined method: Both adipocyte and myocyte Kp values were utilized to calculate fat
and muscle volumes, respectively. Kp for all non-fat and muscles organs were assumed
to be 1 to predict VD,ss
𝑉𝐷𝑠𝑠 = 𝑉𝑝 + (𝐾𝑝𝑓𝑎𝑡 × 𝑉𝑓𝑎𝑡) + (𝐾𝑝𝑚𝑢𝑠𝑐𝑙𝑒 × 𝑉𝑚𝑢𝑠𝑐𝑙𝑒) + (1 × 𝑉𝑟𝑒𝑠𝑡𝑜𝑓𝑡ℎ𝑒𝑏𝑜𝑑𝑦)
4. Average method: Average of adipocyte and myocyte Kp values were used as Kp for all
non-fat and muscle tissues. Both adipocyte and myocyte Kp values were utilized to
calculate fat and muscle volumes, respectively to predict VD,ss
𝑉𝐷𝑠𝑠 = 𝑉𝑝 + (𝐾𝑝𝑓𝑎𝑡 × 𝑉𝑓𝑎𝑡) + (𝐾𝑝𝑚𝑢𝑠𝑐𝑙𝑒 × 𝑉𝑚𝑢𝑠𝑐𝑙𝑒) + (𝐾𝑝𝑎𝑣𝑔 × 𝑉𝑟𝑒𝑠𝑡𝑜𝑓𝑡ℎ𝑒𝑏𝑜𝑑𝑦)
5. Separate method: Mechanistic Kp (Lukacova et al., 2008) calculations were utilized for
“non-fat” or “non muscle” organs. Both adipocyte and myocyte Kp values were utilized to
calculate fat and muscle volumes, respectively. Both the volumes were subsequently
added to predict VD,ss as follows:
𝑉𝐷𝑠𝑠 = 𝑉𝑝 + (𝐾𝑝𝑓𝑎𝑡 × 𝑉𝑓𝑎𝑡) + (𝐾𝑝𝑚𝑢𝑠𝑐𝑙𝑒 × 𝑉𝑚𝑢𝑠𝑐𝑙𝑒) + 𝑉𝐷𝑠𝑠𝐿𝑢𝑘𝑎𝑐𝑜𝑣𝑎,𝑟𝑒𝑠𝑡 𝑜𝑓 𝑡𝑖𝑠𝑠𝑢𝑒𝑠
This article has not been copyedited and formatted. The final version may differ from this version.DMD Fast Forward. Published on November 25, 2020 as DOI: 10.1124/dmd.120.000202
at ASPE
T Journals on N
ovember 25, 2021
dmd.aspetjournals.org
Dow
nloaded from
16
Results
As summarized in Figure 1, we investigated the performance of the most common VD,ss
prediction strategies, sensitivity of input parameters that influence VD,ss predictions, impact of
experimental data on mechanistic VD,ss predictions, and if adipocyte and myocyte cell
partitioning could improve predictive performance by using a large compound dataset. An in
silico only approach was applied using a set of 956 compounds (the ATOM in silico set) related
to the Lombardo IV dosing drug set (n=1352 drugs) where VD,ss values were reported
(Lombardo et al., 2018). A separate set of compounds, the ATOM experimental set (n=254
compounds), had additional in vitro data collected under uniform experimental conditions (see
Methods; Table S2) and was used as a comparator against the purely in silico methods.
Although, the ATOM experimental dataset was selected based on the compound availability
from an initial set of 331 drugs, it represented chemical diversity of the clinical dataset
(Supplementary Figure S1).
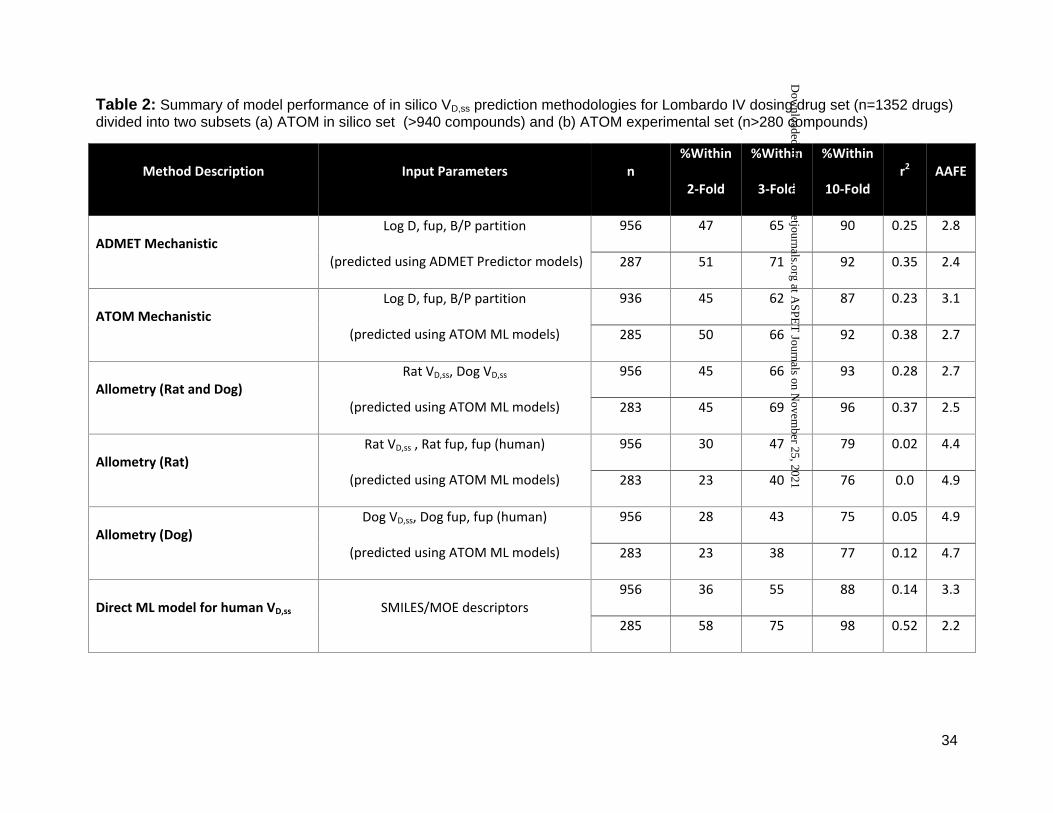
The comparative assessments of various in silico approaches evaluated to predict human VD,ss
for two discrete sets of compounds are summarized in Table 2 and Figure 2. Details of ATOM
ML models used to predict input parameters for mechanistic VD,ss predictions is shown in
(Supplemental Table S1). Model/featurization combination that resulted in best models varied
by datasets. MOE or graph convolution featurization with random forest or neural network
models most frequently outperformed other featurization and models investigated in this study.
Relative to other in silico methods, mechanistic VD,ss predictions (both by ATOM and ADMET
ML models) and two species allometry demonstrated superior predictive performance with 62-
71% of compounds within 3-fold of observed VD,ss for both datasets (Table 2). In contrast,
scaling from single species using allometric methods performed poorly, with only 38-47% of
compounds within 3-fold (Table 2). Trends in predictive performance (such as % within 2, 3 and
This article has not been copyedited and formatted. The final version may differ from this version.DMD Fast Forward. Published on November 25, 2020 as DOI: 10.1124/dmd.120.000202
at ASPE
T Journals on N
ovember 25, 2021
dmd.aspetjournals.org
Dow
nloaded from
17
10-fold, AAFE and Pearson’s r2) across various in silico models were comparable using either
the smaller or larger data sets (Table 2, 283 and 956 compounds), with an exception for direct
ML model. Predictive performance of the direct ML model to predict VD,ss increased significantly,
when the ML model was built using a larger dataset (Table 2, Figure 3). Percentage of
compounds within 2, 3 and 10-fold increased to 58%, 75% and 98% from 36%, 55% and 88%,
respectively (Table 2, Figure 2). Similarly, there was significant improvement in r2 values (from
0.14 to 0.52) and AAFE (decreased from 3.3 to 2.2). The scatter plots of direct ML model
predictions are shown in Figure 3. Additional scatter plots of predicted VD,ss compared to
reported (Lombardo et al., 2018) values across both datasets, and various in silico methods are
presented in Supplementary Figure S2.
Experimentally measured LogD, fup, BPR in vitro assays for 254 compounds are summarized in
Supplemental Table S2. Although 331 compounds were originally included, some of the
compounds showed analytical or recovery issues in different assays and were removed from
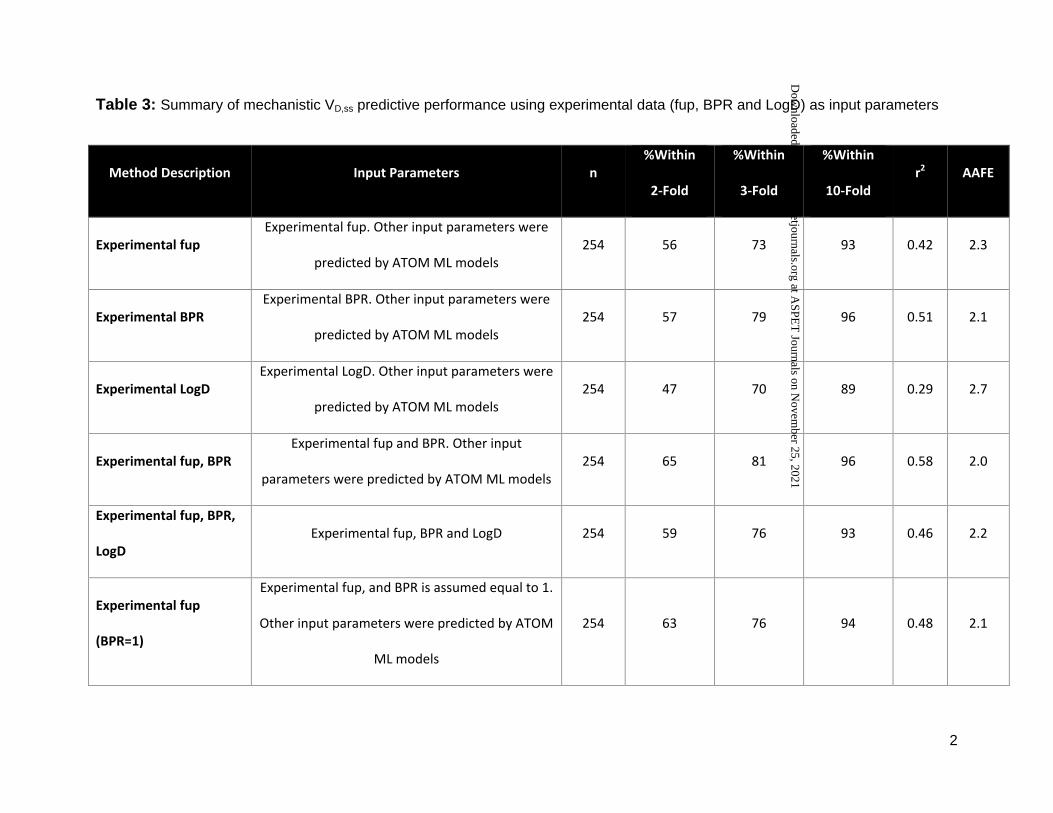
the datasets. Table 3 and Figure 4 summarizes predictive performance of various combinations
of experimental data (Supplemental Table S2) as input parameters. Scatter/KDE plots of
mechanistic VD,ss predictions using various combinations of experimental data (fup, BPR and
LogD) as input parameters are shown in Supplementary Figure S4. The highest percentage of
compounds within 3-fold of prediction error was observed when experimentally determined fup
and BPR were used as input parameters, with 81% of the compounds within 3-fold of Lombardo
reference values; a good correlation between predicted and observed values (r2 = 0.58) was
seen.
Correlation between observed and predicted VD,ss for 254 compounds using experimental fup
and BPR data as inputs parameters is shown in Figure 5. Among the experimental parameters
investigated, VD,ss predictions were sensitive to BPR. VD,ss predictions within 3-fold dropped to
This article has not been copyedited and formatted. The final version may differ from this version.DMD Fast Forward. Published on November 25, 2020 as DOI: 10.1124/dmd.120.000202
at ASPE
T Journals on N
ovember 25, 2021
dmd.aspetjournals.org
Dow
nloaded from

18
73% from 81% and r2 reduced from 0.58 to 0.42, when only fup was used instead of fup and
BPR. In absence of experimental data, assuming BPR as 1 could be recommended as better
performance was observed when BPR value was assumed to be 1 instead of inputting ML
predicted values (Table 3); 63% of the compounds were predicted within 2-fold when BPR was
assumed to be 1 compared to 56% when BPR was predicted from ML models in combination
with measured fup. This highlights that VD,ss predictions are sensitive to errors in BPR
predictions from ML models and that the best performance across all the methods is with
measured fup and BPR values. In contrast, complementing measured LogD to mechanistic
predictions with fup and BPR measured data did not improve predictive performance any further
(Table 3). Since predicted values from LogD ML models (both ADMET and ATOM) were in
close agreement with measured values (Supplementary Figure S3), it is not surprising to see
that measurement of LogD values did not improve VD,ss predictions. Figure 5A displays
correlation of predicted to observed VD,ss classified by ionization class (Lombardo et al., 2018).
Anionic and zwitterionic compounds are the best-predicted classes compared to neutral
compounds. Kernel Density Estimation (KDE, Seaborn Python library
https://seaborn.pydata.org/tutorial/distributions.html) plot in Figure 5B demonstrates underlying
distribution of the points in the Figure 5A scatter plot. Figure 5B suggests that overall predictions
using mechanistic predictions using measured fup and BPR are directly correlated and majority
of the predictions are on the unity line. Highlighting, there is no overall trend of over-predicting
or underpredicting VD,ss.
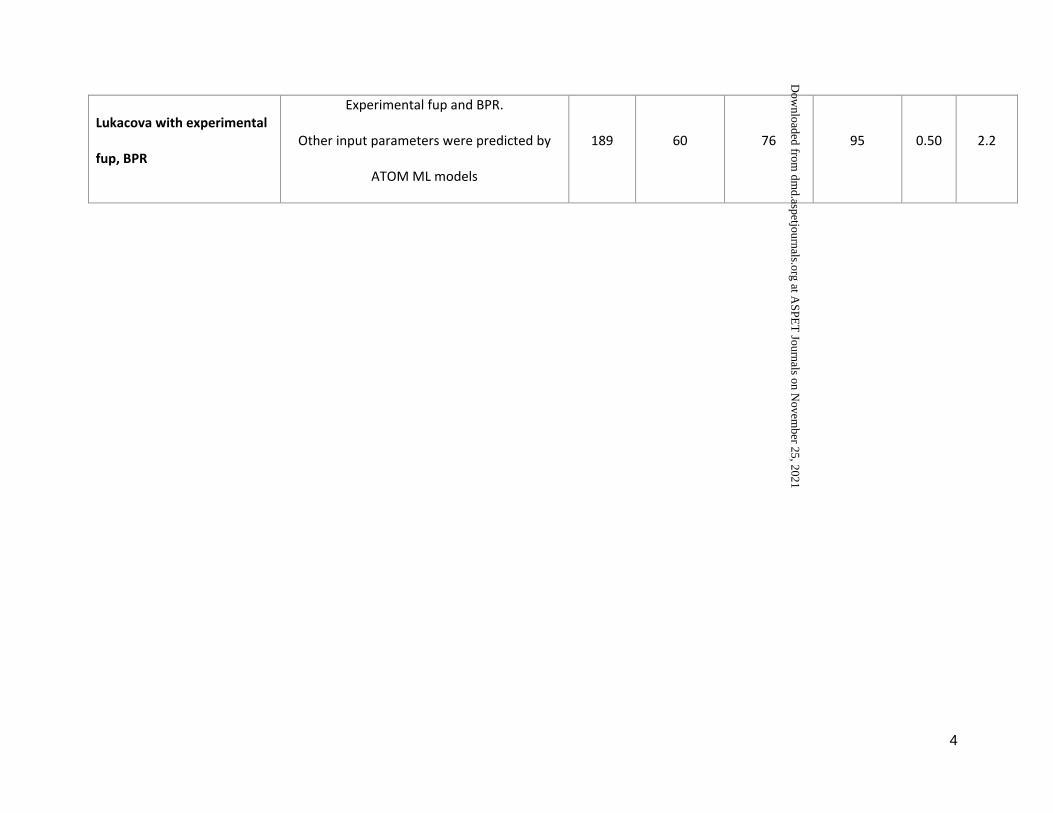
As fat and muscle contribute to 60% of body volume, impact of experimental adipocyte and
myocyte cell partition in improving VD,ss prediction was investigated. Measured intracellular
partitioning of 189 compounds in adipocytes and myocytes is presented in Supplemental Table
S3. The impact of adipocyte and myocyte cell partition on predictive performance for same set
of compounds was compared to that from the best predictive model (fup and BPR experimental
This article has not been copyedited and formatted. The final version may differ from this version.DMD Fast Forward. Published on November 25, 2020 as DOI: 10.1124/dmd.120.000202
at ASPE
T Journals on N
ovember 25, 2021
dmd.aspetjournals.org
Dow
nloaded from

19
data as input parameters; Table 4 and Figure 6). Good correlation between observed vs
predicted VD,ss was noted when either adipocyte or myocyte or both Kp values were utilized (r2
of 0.41-0.48, Table 4). Although % of compounds within 3-fold, r2 and AAFE were not
significantly different using either adipocytes or myocyte partitioning, % of compounds within 2-
fold was significantly higher when VD,ss was predicted using adipocyte Kp values (54% vs 41%,
Table 4). Combination of both adipocyte and myocyte partitioning with different strategies did
not improve predictive performance any further (Table 4). For the same set of compounds, VD,ss
predicted using only fup and BPR experimental data demonstrated higher % of compounds with
2 and 3-fold compared to predictions based on adipocyte or myocyte data (Table 4 and Figure
6).
Across all the prediction methods evaluated using different datasets, there was a good
correlation between AAFE and percentage of compounds within 2 or 3-fold of observed. As
anticipated, prediction methods where lower AAFEs were observed demonstrated highest
percentage of compounds within 3-fold. Among all the methods investigated, mechanistic VD,ss
predictions utilizing measured fup and BPR as input parameters demonstrated superior
performance with lowest AAFE, highest r2 and % of compounds within 3-fold.
Discussion
Mechanistic VD,ss Predictions: Kp calculations utilize physiological parameters of the tissue
and physicochemical properties of the drug to ascertain how compounds partitions themselves
between plasma and tissue. Based on preliminary evaluations and other reports in the literature
(Graham et al., 2012), the Lukacova method (Lukacova et al., 2008) was utilized as a method of
choice for mechanistic VD,ss predictions. Key prerequisite input parameters to predict
This article has not been copyedited and formatted. The final version may differ from this version.DMD Fast Forward. Published on November 25, 2020 as DOI: 10.1124/dmd.120.000202
at ASPE
T Journals on N
ovember 25, 2021
dmd.aspetjournals.org
Dow
nloaded from

20
mechanistic VD,ss are pKa, LogD, LogP, fup, and BPR. Therefore, estimating these input
parameters either by in silico methods or by experimental measurements, and impact of
measured parameters on mechanistic VD,ss predictions have been explored.
Mechanistic VD,ss predictions using input parameters predicted by either ATOM ML models or
ADMET Predictor demonstrated similar performance across datasets (Table 2). Therefore,
either of the two ML models set (ATOM or ADMET Predictor) can be used to predict
mechanistic VD,ss in silico. It is important to note that ML models for BPR (ATOM ML or ADMET
Predictor (from user manual)) were built using very small datasets (Supplemental Table S1),
and predictive performances of ML models to predict BPR are questionable. When predicted
BPR values were replaced with experimental data, significant improvement in mechanistic VD,ss
predictive performance was observed; r2 increased from 0.38 to 0.51 and %within 3-fold
increased from 66 to 79% highlighting the sensitivity of VD,ss predictions to BPR values (Table 3,
Figure 4). As BPR is a key parameter, particularly for calculation of intracellular acidic
phospholipid binding of strongly basic drugs, it could be anticipated to improve the predictions.
However, impact of BPR measurement was not definitely demonstrated in literature until
recently (Yau et al., 2020). The current evaluations (Table 3) clearly demonstrate the
importance of measuring BPR in predicting VD,ss and the need to fill the existing gaps in BPR
datasets used to build predictive ML models. It is noteworthy that with only two in vitro
measurements (fup and BPR), 81% of compounds are within 3-fold of observed VD,ss (Table 3),
with AAFE of 2.0.
Fup values are measured routinely in drug discovery as it can impact both the pharmacokinetics
and pharmacodynamics of a drug (Smith et al., 2010). On the other hand, BPR of compounds in
early discovery phase is relatively less routinely measured and might lead to missed
opportunities not only in predicting VD,ss (as observed in this study), but also the impact on
This article has not been copyedited and formatted. The final version may differ from this version.DMD Fast Forward. Published on November 25, 2020 as DOI: 10.1124/dmd.120.000202
at ASPE
T Journals on N
ovember 25, 2021
dmd.aspetjournals.org
Dow
nloaded from
21
overall pharmacokinetics of a compound (Kalamaridis and DiLoreto, 2014). Comparable
predictive performance was noted by Chan et al. (Chan et al., 2018) using a smaller dataset of
152 clinical compounds. They demonstrated that mechanistic VD,ss predictions were accurate or
superior to empirical approaches based on the extrapolation of VD,ss from preclinical species
(Chan et al., 2018). In addition to superior performance of mechanistic VD,ss prediction methods
(using either ML predicted or experimental input parameters), a mechanistic approach uniquely
offers the ability to calculate partitioning (Kp) of compounds into various tissues.
Allometric scaling: Traditionally, prediction of human VD,ss has relied on scaling of VD,ss
obtained from preclinical species using allometric equations (Jones et al., 2011). While
allometry has some limitations in predicting distribution of highly protein bound drugs, it has
been a valuable technique to predict human PK parameters to determine first-time-in-human
(FTIH) dose (Choi et al., 2019). To leverage existing data from animal studies during early drug
discovery, use of QSAR predicted VD,ss employing allometric scaling from preclinical species
was explored. While there continue to be translational questions about inter-species scaling, it
was hypothesized that deployment of this technique could allow for much wider chemical space
coverage relative to human VD,ss trained models, as well as to provide insight into mechanisms
not captured by mechanistic models such as transporter-driven tissue uptake. Although, ML
models to predict VD,ss and fup values in preclinical species have demonstrated good
performance (Supplemental Table S1), single species scaling performed poorly in predicting
human VD,ss (Table 2, <50% were within 3-fold). This poor performance could be due to
magnification of errors in predictions of VD,ss and/or fup values in addition to limitations of single
species scaling. Several studies have shown that plasma protein binding corrections
significantly enhanced predictive performance of allometric scaling from preclinical VD,ss (Zou et
al., 2012). As the VD,ss predictions inversely proportional to fup in preclinical species (see
Methods for equations), errors in the predictions of fup values will have significant impact on
This article has not been copyedited and formatted. The final version may differ from this version.DMD Fast Forward. Published on November 25, 2020 as DOI: 10.1124/dmd.120.000202
at ASPE
T Journals on N
ovember 25, 2021
dmd.aspetjournals.org
Dow
nloaded from

22
VD,ss predictions. Therefore, we investigated VD,ss comparisons without fup corrections. Direct
correlation of predicted dog VD,ss (without fup corrections) with human VD,ss demonstrated
improved performance with 48, 65 and 97% of compounds within 2, 3 and 10-fold of observed
human VD,ss ,respectively, when compared to fup accounting for the difference between dog and
human (23, 37 and 75%, Table 2). This supports that the poor predictive accuracy of dog fup
model magnified the prediction errors. However, similar improved performance or correlations
were not observed in the case extrapolating from rat VD,ss predictions. In constrast, human VD,ss
scaled using both rat and dog by Wajima method demonstrated predictive performance similar
to mechanistic models (Table 2). Although overall predictive performance is not significantly
different between the two methods, it is noteworthy that mechanistic models were relatively
better at predicting anionic compounds within 2-fold compared to Wajima method
(Supplementary Figure S7). VD,ss predictions classified by ionization class across various
methods can be found in Supplementary Figure S6.
Direct ML models: Previously, we observed that data set size has a direct impact on model
predictivity for several pharmacokinetic related datasets (Minnich et al., 2020). As anticipated,
ML models built using smaller datasets such as that for BPR, showed lower model performance
statistics compared to models built using larger dataset (Supplemental Table S1). Furthermore,
direct ML model built on larger dataset (using 970 clinical compounds) outperformed other in
silico methods, including mechanistic VD,ss method (Table 2). When utilizing direct ML models
built on a larger dataset, 75% of compounds (Table 2) were predicted within 3-fold of observed
VD,ss with excellent correlation (Figure 3b). It is important to highlight that the clinical dataset is
highly diverse across physico-chemical, in vitro ADME and in vivo PK properties (Lombardo et
al., 2018). Models built on diverse datasets of chemical space have a greater applicability
domain and generalizability (Simeon et al., 2019). Therefore, direct ML predictions of VD,ss might
be the most computationally efficient and predictive way to process in silico predictions of VD,ss
This article has not been copyedited and formatted. The final version may differ from this version.DMD Fast Forward. Published on November 25, 2020 as DOI: 10.1124/dmd.120.000202
at ASPE
T Journals on N
ovember 25, 2021
dmd.aspetjournals.org
Dow
nloaded from

23
for de novo compounds. One limitation of the current model is the relatively small training set,
possibly restricting the application of the model to certain chemotypes. In such cases, models
that are limited to structurally related analogs may prove more predictive than global models
built on diverse set of compounds (Simeon et al., 2019). Despite some differences in
hyperparameters and dataset splits used relative to our study, Simeon et al (Simeon et al.,
2019) demonstrated similar predictive performance for direct ML model built using a dataset of
941 compounds. These independent studies provide promising evidence of improved
performances of direct ML models with enhanced datasets of clinical compounds.
Predictions using adipocyte and myocyte cell partitioning: Muscle and fat are tissues with
larger physiological volumes (60% of tissue volume) and distribution of compounds to these
tissues have a major impact on the VD,ss of compounds in human (Davies and Morris, 1993).
Bjorkman et al. evaluated relative contributions of various tissue partition coefficients (Kp,
tissues) in predicting VD,ss in rat and observed an excellent linear correlation (>0.99) between
VD,ss, when calculated using only Kps from muscle and fat (Bjorkman, 2002). In this study, we
hypothesized that intracellular partitioning of compounds into human adipocytes and myocytes
in vitro could be used as a surrogate to determine fat and muscle Kp values and subsequently
be used to estimate human VD,ss. In addition, measuring Kp values directly in human cells could
improve translational to human tissues. Higher predictive performance was observed, but only
when one of the adipocyte partition or myocyte partition values was included to predict VD,ss
(Table 4). Adipocyte and myocyte partition values and predicted VD,ss were highly correlated
(r2>0.7), suggesting measurement of partition in only one cell type is adequate. Between the two
measurements, adipocyte partition (𝐾𝑝𝑓𝑎𝑡 only) showed better performance, particularly with
respect to % of compounds within 2-fold compared to myocyte partition (Kp muscle only).
Combination of both adipocyte and myocyte partition in various combinations did not provide
This article has not been copyedited and formatted. The final version may differ from this version.DMD Fast Forward. Published on November 25, 2020 as DOI: 10.1124/dmd.120.000202
at ASPE
T Journals on N
ovember 25, 2021
dmd.aspetjournals.org
Dow
nloaded from
24
significant improvement in VD,ss predictions (Table 4). Although, 𝐾𝑝𝑓𝑎𝑡 showed good correlation
to human VD,ss, it failed to predict compounds with low VD,ss (<1 L/kg) due to volume
contributions from other tissues (assumption of Kp=1) (Supplementary Figure S5a).
Surprisingly, predictive performance was lower when fat and muscle volumes were predicted
using both adipocyte and myocyte measured data, and volume of the remaining tissues were
predicted using mechanistic Kp prediction method. Only 56% of the compounds were within 3-
fold compared to 63% when Kp was assumed to be 1 for other tissues (Table 4). However, it
improved prediction of compounds with low VD,ss . Measured adipocyte and myocyte partition
data provided in Supplemental Table S3 enables further exploration of VD,ss prediction methods.
Conclusions: One of the purposes of comparing various in silico VD,ss prediction methods was
to establish the best in silico approaches to predict VD,ss for de novo compounds. Based on the
extensive comparisons of results across the in silico methods (Table 2), we conclude that (1)
the mechanistic VD,ss prediction methods using a combination of ML models for predicting
physicochemical properties paired with mechanistic equations for Kp, or (2) the Wajima method
employing predicted rat and dog VD,ss are our recommended in silico approaches to predict
human VD,ss. If a larger training dataset of chemically diverse VD,ss experimental values are
available, then direct ML predictions of VD,ss might be the most computationally efficient and
predictive way to process in silico predictions of VD,ss for de novo compounds. Once these de
novo compounds have been synthesized in discovery, it is most useful to experimentally
measure BPR and fup to get to a more accurate estimation of human VD,ss. Based on our
analysis, BPR is the most sensitive physicochemical property to determine VD,ss in silico.
Further, we investigated the utility of adipocyte and myocyte partitioning in predicting VD,ss. If fat
or muscle partition coefficients are being consider as part of the model, adipocyte. Kp
measurements may provide more predictive power than either myocyte Kp alone or adipocyte
and myocyte combined. In summary, the scale of prediction strategies evaluated and size of
This article has not been copyedited and formatted. The final version may differ from this version.DMD Fast Forward. Published on November 25, 2020 as DOI: 10.1124/dmd.120.000202
at ASPE
T Journals on N
ovember 25, 2021
dmd.aspetjournals.org
Dow
nloaded from
25
datasets used in this study are novel, and significantly larger than presented in the literature
thus far. In addition, we investigated novel methodologies such as adipocyte and myocyte
partitioning in predicting VD,ss. Finally, we have provided several novel in vitro data sets (e.g.,
BPR, adipocyte Kp, myocyte Kp) generated using a single protocol for 254 clinical compounds
that will enable the research community to further enhancement of VD,ss prediction methods.
This article has not been copyedited and formatted. The final version may differ from this version.DMD Fast Forward. Published on November 25, 2020 as DOI: 10.1124/dmd.120.000202
at ASPE
T Journals on N
ovember 25, 2021
dmd.aspetjournals.org
Dow
nloaded from

26
Authorship Contributions
Participated in research design: Polli, Pasikanti, Weber, Murad, Crouch
Conducted experiments: McComas, Pasikanti
Performed data analysis and in silico tools: Murad, Madej, Pasikanti, Minnich
Wrote or contributed to the writing of the manuscript: Pasikanti, Murad, Polli
This article has not been copyedited and formatted. The final version may differ from this version.DMD Fast Forward. Published on November 25, 2020 as DOI: 10.1124/dmd.120.000202
at ASPE
T Journals on N
ovember 25, 2021
dmd.aspetjournals.org
Dow
nloaded from

27
References
The Significance and Determination of Plasma Protein Binding, in: Encyclopedia of Drug
Metabolism and Interactions, pp 1-18.
Berezhkovskiy LM (2004) Volume of distribution at steady state for a linear pharmacokinetic
system with peripheral elimination. J Pharm Sci 93:1628-1640.
Bjorkman S (2002) Prediction of the volume of distribution of a drug: which tissue-plasma
partition coefficients are needed? J Pharm Pharmacol 54:1237-1245.
Chan R, De Bruyn T, Wright M, and Broccatelli F (2018) Comparing Mechanistic and Preclinical
Predictions of Volume of Distribution on a Large Set of Drugs. Pharm Res 35:87.
Choi GW, Lee YB, and Cho HY (2019) Interpretation of Non-Clinical Data for Prediction of
Human Pharmacokinetic Parameters: In Vitro-In Vivo Extrapolation and Allometric
Scaling. Pharmaceutics 11.
Davies B and Morris T (1993) Physiological parameters in laboratory animals and humans.
Pharm Res 10:1093-1095.
del Amo EM, Ghemtio L, Xhaard H, Yliperttula M, Urtti A, and Kidron H (2013) Applying linear
and non-linear methods for parallel prediction of volume of distribution and fraction of
unbound drug. PLoS One 8:e74758.
Ferreira LLG and Andricopulo AD (2019) ADMET modeling approaches in drug discovery. Drug
Discov Today 24:1157-1165.
Graham H, Walker M, Jones O, Yates J, Galetin A, and Aarons L (2012) Comparison of in-vivo
and in-silico methods used for prediction of tissue: plasma partition coefficients in rat. J
Pharm Pharmacol 64:383-396.
Hinkson IV, Madej B, and Stahlberg EA (2020) Accelerating Therapeutics for Opportunities in
Medicine: A Paradigm Shift in Drug Discovery. Front Pharmacol 11:770.
Jones RD, Jones HM, Rowland M, Gibson CR, Yates JW, Chien JY, Ring BJ, Adkison KK, Ku
MS, He H, Vuppugalla R, Marathe P, Fischer V, Dutta S, Sinha VK, Bjornsson T, Lave T,
and Poulin P (2011) PhRMA CPCDC initiative on predictive models of human
pharmacokinetics, part 2: comparative assessment of prediction methods of human
volume of distribution. J Pharm Sci 100:4074-4089.
This article has not been copyedited and formatted. The final version may differ from this version.DMD Fast Forward. Published on November 25, 2020 as DOI: 10.1124/dmd.120.000202
at ASPE
T Journals on N
ovember 25, 2021
dmd.aspetjournals.org
Dow
nloaded from
28
Kalamaridis D and DiLoreto K (2014) Drug Partition in Red Blood Cells, in: Optimization in Drug
Discovery: In Vitro Methods (Caldwell GW and Yan Z eds), pp 39-47, Humana Press,
Totowa, NJ.
Korzekwa K and Nagar S (2017) Drug Distribution Part 2. Predicting Volume of Distribution from
Plasma Protein Binding and Membrane Partitioning. Pharm Res 34:544-551.
Lombardo F, Berellini G, and Obach RS (2018) Trend Analysis of a Database of Intravenous
Pharmacokinetic Parameters in Humans for 1352 Drug Compounds. Drug Metab Dispos
46:1466-1477.
Lukacova V, Parrott N, Lave T, Fraczkiewicz G, Bolger M, and Woltosz W (2008) General
approach to calculation of tissue:plasma partition coefficients for physiologically based
pharmacokinetic (PBPK) modeling, in: AAPS National Annual Meeting and Exposition,
Atlanta (GA).
Mayumi K, Tachibana M, Yoshida M, Ohnishi S, Kanazu T, and Hasegawa H (2020) The Novel
In Vitro Method to Calculate Tissue-to-Plasma Partition Coefficient in Humans for
Predicting Pharmacokinetic Profiles by Physiologically-Based Pharmacokinetic Model
With High Predictability. J Pharm Sci 109:2345-2355.
Minnich AJ, McLoughlin K, Tse M, Deng J, Weber A, Murad N, Madej BD, Ramsundar B, Rush
T, Calad-Thomson S, Brase J, and Allen JE (2020) AMPL: A Data-Driven Modeling
Pipeline for Drug Discovery. J Chem Inf Model 60:1955-1968.
Nigade PB, Gundu J, Pai KS, Nemmani KVS, and Talwar R (2019) Prediction of volume of
distribution in preclinical species and humans: application of simplified physiologically
based algorithms. Xenobiotica 49:528-539.
Poulin P and Krishnan K (1995) An algorithm for predicting tissue: blood partition coefficients of
organic chemicals from n-octanol: water partition coefficient data. J Toxicol Environ
Health 46:117-129.
Poulin P and Theil FP (2002) Prediction of pharmacokinetics prior to in vivo studies. 1.
Mechanism-based prediction of volume of distribution. J Pharm Sci 91:129-156.
Rodgers T, Leahy D, and Rowland M (2005) Physiologically based pharmacokinetic modeling 1:
predicting the tissue distribution of moderate-to-strong bases. J Pharm Sci 94:1259-
1276.
This article has not been copyedited and formatted. The final version may differ from this version.DMD Fast Forward. Published on November 25, 2020 as DOI: 10.1124/dmd.120.000202
at ASPE
T Journals on N
ovember 25, 2021
dmd.aspetjournals.org
Dow
nloaded from

29
Rodgers T and Rowland M (2006) Physiologically based pharmacokinetic modelling 2:
predicting the tissue distribution of acids, very weak bases, neutrals and zwitterions. J
Pharm Sci 95:1238-1257.
Simeon S, Montanari D, and Gleeson MP (2019) Investigation of Factors Affecting the
Performance of in silico Volume Distribution QSAR Models for Human, Rat, Mouse, Dog
& Monkey. Mol Inform 38:e1900059.
Smith DA, Beaumont K, Maurer TS, and Di L (2015) Volume of Distribution in Drug Design. J
Med Chem 58:5691-5698.
Smith DA, Di L, and Kerns EH (2010) The effect of plasma protein binding on in vivo efficacy:
misconceptions in drug discovery. Nat Rev Drug Discov 9:929-939.
Trainor GL (2007) The importance of plasma protein binding in drug discovery. Expert Opin
Drug Discov 2:51-64.
Trapp S, Rosania GR, Horobin RW, and Kornhuber J (2008) Quantitative modeling of selective
lysosomal targeting for drug design. Eur Biophys J 37:1317-1328.
Treyer A, Mateus A, Wisniewski JR, Boriss H, Matsson P, and Artursson P (2018) Intracellular
Drug Bioavailability: Effect of Neutral Lipids and Phospholipids. Mol Pharm 15:2224-
2233.
Valko K, Bevan C, and Reynolds D (1997) Chromatographic Hydrophobicity Index by Fast-
Gradient RP-HPLC: A High-Throughput Alternative to log P/log D. Anal Chem 69:2022-
2029.
Wajima T, Fukumura K, Yano Y, and Oguma T (2003) Prediction of human pharmacokinetics
from animal data and molecular structural parameters using multivariate regression
analysis: volume of distribution at steady state. J Pharm Pharmacol 55:939-949.
Waring MJ, Arrowsmith J, Leach AR, Leeson PD, Mandrell S, Owen RM, Pairaudeau G, Pennie
WD, Pickett SD, Wang J, Wallace O, and Weir A (2015) An analysis of the attrition of
drug candidates from four major pharmaceutical companies. Nat Rev Drug Discov
14:475-486.
Waters NJ, Jones R, Williams G, and Sohal B (2008) Validation of a rapid equilibrium dialysis
approach for the measurement of plasma protein binding. J Pharm Sci 97:4586-4595.
Wenzel J, Matter H, and Schmidt F (2019) Predictive Multitask Deep Neural Network Models for
ADME-Tox Properties: Learning from Large Data Sets. J Chem Inf Model 59:1253-1268.
This article has not been copyedited and formatted. The final version may differ from this version.DMD Fast Forward. Published on November 25, 2020 as DOI: 10.1124/dmd.120.000202
at ASPE
T Journals on N
ovember 25, 2021
dmd.aspetjournals.org
Dow
nloaded from
30
Yau E, Olivares-Morales A, Gertz M, Parrott N, Darwich AS, Aarons L, and Ogungbenro K
(2020) Global Sensitivity Analysis of the Rodgers and Rowland Model for Prediction of
Tissue: Plasma Partitioning Coefficients: Assessment of the Key Physiological and
Physicochemical Factors That Determine Small-Molecule Tissue Distribution. AAPS J
22:41.
Young RJ, Green DV, Luscombe CN, and Hill AP (2011) Getting physical in drug discovery II:
the impact of chromatographic hydrophobicity measurements and aromaticity. Drug
Discov Today 16:822-830.
Zou P, Zheng N, Yang Y, Yu LX, and Sun D (2012) Prediction of volume of distribution at steady
state in humans: comparison of different approaches. Expert Opin Drug Metab Toxicol
8:855-872.
This article has not been copyedited and formatted. The final version may differ from this version.DMD Fast Forward. Published on November 25, 2020 as DOI: 10.1124/dmd.120.000202
at ASPE
T Journals on N
ovember 25, 2021
dmd.aspetjournals.org
Dow
nloaded from

31
Acknowledgments
Funding
This work represents a multi-institutional effort. Funding sources include the following: Lawrence
Livermore National Laboratory internal funds; the National Nuclear Security Administration;
GlaxoSmithKline, LLC; and federal funds from the National Cancer Institute, National Institutes
of Health, and the Department of Health and Human Services [Contract No. 75N91019D00024].
This work was performed under the auspices of the U.S. Department of Energy by Lawrence
Livermore National Laboratory [Contract No. DE-AC52-07NA27344].
Notes
Disclaimer. This document was prepared as an account of work sponsored by an agency of the
United States government. Neither the United States government nor Lawrence Livermore
National Security, LLC, nor any of their employees makes any warranty, expressed or implied,
or assumes any legal liability or responsibility for the accuracy, completeness, or usefulness of
any information, apparatus, product, or process disclosed, or represents that its use would not
infringe privately owned rights. Reference herein to any specific commercial product, process,
or service by trade name, trademark, manufacturer, or otherwise does not necessarily constitute
or imply its endorsement, recommendation, or favoring by the United States government or
Lawrence Livermore National Security, LLC. The views and opinions of authors expressed
herein do not necessarily state or reflect those of the United States government or Lawrence
Livermore National Security, LLC, and shall not be used for advertising or product endorsement
purposes. The authors declare no competing financial interest.
This article has not been copyedited and formatted. The final version may differ from this version.DMD Fast Forward. Published on November 25, 2020 as DOI: 10.1124/dmd.120.000202
at ASPE
T Journals on N
ovember 25, 2021
dmd.aspetjournals.org
Dow
nloaded from
32
Legends for Figures
Figure 1: Overview of human VD,ss prediction methods and input parameters (in silico and in
vitro data) evaluated in this study
Figure 2: Summary of model performance of in silico VD,ss prediction methodologies (a) ATOM
in silico set (n=956 compounds) and (b) ATOM experimental set (n=254 compounds)
Figure 3: Predicted vs observed VD,ss using direct ML models: (a) ML model built was using
smaller dataset (287 compounds) and predictions were tested on large in silico set (956
compounds) and (b) vice-versa. Crosslines indicate 2, 3 and 10-fold limits.
Figure 4: Predictive performance of mechanistic Kp prediction methods using various
combination of experimental (Exp) data
Figure 5: (a) Scatter plot (colored by ionic state reported in (Lombardo et al., 2018)) (b) Kernel
density plot showing correlation between observed and predicted VD,ss for 254 compounds using
experimental fup and BPR data as input parameters. Crosslines indicate 2, 3 and 10-fold limits.
Figure 6: Predictive performance using adipocyte (Kp fat) and myocyte (Kp muscle) partitioning
experimental data
This article has not been copyedited and formatted. The final version may differ from this version.DMD Fast Forward. Published on November 25, 2020 as DOI: 10.1124/dmd.120.000202
at ASPE
T Journals on N
ovember 25, 2021
dmd.aspetjournals.org
Dow
nloaded from
33
Table 1: Comparison of mechanistic tissue partitioning (Kp) prediction methods
Mechanisms Poulin
Homogeneous
Berezhkovskiy Rogers and
Rowland
Lukacova Trapp
Intracellular
Albumin Binding Yes Yes Yes Yes No
Neutral Phospholipid Binding Yes Yes Yes Yes No
Neutral Lipid Binding Yes Yes Yes Yes No
Acidic Phospholipid Binding No No Yes Yes No
Cytosolic Ion Partitioning No No Yes Yes Yes
Lysosomal Ion Trapping No No No No Yes
Mitochondria Ion Partitioning No No No No Yes
Membrane Potential No No No No Yes
Intracellular Water Yes Yes Yes Yes Yes
Extracellular Water Yes Yes Yes Yes No
Tissue Specific Composition Yes Yes Yes Yes No
This article has not been copyedited and formatted. The final version may differ from this version.DMD Fast Forward. Published on November 25, 2020 as DOI: 10.1124/dmd.120.000202
at ASPE
T Journals on N
ovember 25, 2021
dmd.aspetjournals.org
Dow
nloaded from
34
Table 2: Summary of model performance of in silico VD,ss prediction methodologies for Lombardo IV dosing drug set (n=1352 drugs) divided into two subsets (a) ATOM in silico set (>940 compounds) and (b) ATOM experimental set (n>280 compounds)
Method Description Input Parameters n %Within
2-Fold
%Within
3-Fold
%Within
10-Fold r2 AAFE
ADMET Mechanistic Log D, fup, B/P partition
(predicted using ADMET Predictor models)
956 47 65 90 0.25 2.8
287 51 71 92 0.35 2.4
ATOM Mechanistic Log D, fup, B/P partition
(predicted using ATOM ML models)
936 45 62 87 0.23 3.1
285 50 66 92 0.38 2.7
Allometry (Rat and Dog) Rat VD,ss, Dog VD,ss
(predicted using ATOM ML models)
956 45 66 93 0.28 2.7
283 45 69 96 0.37 2.5
Allometry (Rat) Rat VD,ss , Rat fup, fup (human)
(predicted using ATOM ML models)
956 30 47 79 0.02 4.4
283 23 40 76 0.0 4.9
Allometry (Dog) Dog VD,ss, Dog fup, fup (human)
(predicted using ATOM ML models)
956 28 43 75 0.05 4.9
283 23 38 77 0.12 4.7
Direct ML model for human VD,ss SMILES/MOE descriptors 956 36 55 88 0.14 3.3
285 58 75 98 0.52 2.2
This article has not been copyedited and formatted. The final version may differ from this version.DMD Fast Forward. Published on November 25, 2020 as DOI: 10.1124/dmd.120.000202
at ASPE
T Journals on N
ovember 25, 2021
dmd.aspetjournals.org
Dow
nloaded from
2
Table 3: Summary of mechanistic VD,ss predictive performance using experimental data (fup, BPR and LogD) as input parameters
Method Description Input Parameters n %Within
2-Fold
%Within
3-Fold
%Within
10-Fold r2 AAFE
Experimental fup Experimental fup. Other input parameters were
predicted by ATOM ML models 254 56 73 93 0.42 2.3
Experimental BPR Experimental BPR. Other input parameters were
predicted by ATOM ML models 254 57 79 96 0.51 2.1
Experimental LogD Experimental LogD. Other input parameters were
predicted by ATOM ML models 254 47 70 89 0.29 2.7
Experimental fup, BPR Experimental fup and BPR. Other input
parameters were predicted by ATOM ML models 254 65 81 96 0.58 2.0
Experimental fup, BPR,
LogD Experimental fup, BPR and LogD 254 59 76 93 0.46 2.2
Experimental fup
(BPR=1)
Experimental fup, and BPR is assumed equal to 1.
Other input parameters were predicted by ATOM
ML models
254 63 76 94 0.48 2.1
This article has not been copyedited and formatted. The final version may differ from this version.DMD Fast Forward. Published on November 25, 2020 as DOI: 10.1124/dmd.120.000202
at ASPE
T Journals on N
ovember 25, 2021
dmd.aspetjournals.org
Dow
nloaded from

3
Table 4: Performance of VD,ss prediction methods utilizing adipocyte and myocyte Kp experimental data
Method Description Input Parameters n %Within
2-Fold
%Within
3-Fold
%Within
10-Fold r2 AAFE
Kp fat only Kp Adipocyte, fup and BPR 189 54 68 97 0.42 2.4
Kp muscle only Kp Myocyte, fup and BPR 189 41 65 94 0.43 2.6
Kp fat and muscle Kp Adipocyte, Kp Myocyte, fup and BPR 189 36 63 92 0.46 2.9
Kp average of fat and muscle Kp Adipocyte, Kp Myocyte, fup and BPR 189 31 46 83 0.46 3.9
Kp fat and Kp muscle with
mechanistic predicted Kps
for other tissues
Kp Adipocyte, Kp Myocyte, fup and BPR,
predicted Kps using ATOM mechanistic
models for tissues other than fat and muscle
189 33 56 93 0.48 3.1
Kp fat and Kp muscle with
mechanistic predicted Kps
for other tissues using
experimental LogD
Kp Adipocyte, Kp Myocyte, fup and BPR,
predicted Kps using ATOM mechanistic
models for tissues other than fat and muscle
169 27 46 85 0.41 3.9
This article has not been copyedited and formatted. The final version may differ from this version.DMD Fast Forward. Published on November 25, 2020 as DOI: 10.1124/dmd.120.000202
at ASPE
T Journals on N
ovember 25, 2021
dmd.aspetjournals.org
Dow
nloaded from
4
Lukacova with experimental
fup, BPR
Experimental fup and BPR.
Other input parameters were predicted by
ATOM ML models
189 60 76 95 0.50 2.2
This article has not been copyedited and formatted. The final version may differ from this version.DMD Fast Forward. Published on November 25, 2020 as DOI: 10.1124/dmd.120.000202
at ASPE
T Journals on N
ovember 25, 2021
dmd.aspetjournals.org
Dow
nloaded from

Figure 1:
This article has not been copyedited and formatted. The final version may differ from this version.DMD Fast Forward. Published on November 25, 2020 as DOI: 10.1124/dmd.120.000202
at ASPE
T Journals on N
ovember 25, 2021
dmd.aspetjournals.org
Dow
nloaded from

Figure 2:
(a)
(b)
This article has not been copyedited and formatted. The final version may differ from this version.DMD Fast Forward. Published on November 25, 2020 as DOI: 10.1124/dmd.120.000202
at ASPE
T Journals on N
ovember 25, 2021
dmd.aspetjournals.org
Dow
nloaded from

Figure 3:
(a) (b)
This article has not been copyedited and form
atted. The final version m
ay differ from this version.
DM
D Fast Forw
ard. Published on Novem
ber 25, 2020 as DO
I: 10.1124/dmd.120.000202
at ASPET Journals on November 25, 2021 dmd.aspetjournals.org Downloaded from

Figure 4:
This article has not been copyedited and formatted. The final version may differ from this version.DMD Fast Forward. Published on November 25, 2020 as DOI: 10.1124/dmd.120.000202
at ASPE
T Journals on N
ovember 25, 2021
dmd.aspetjournals.org
Dow
nloaded from

Figure 5
(a)
(b)
This article has not been copyedited and formatted. The final version may differ from this version.DMD Fast Forward. Published on November 25, 2020 as DOI: 10.1124/dmd.120.000202
at ASPE
T Journals on N
ovember 25, 2021
dmd.aspetjournals.org
Dow
nloaded from
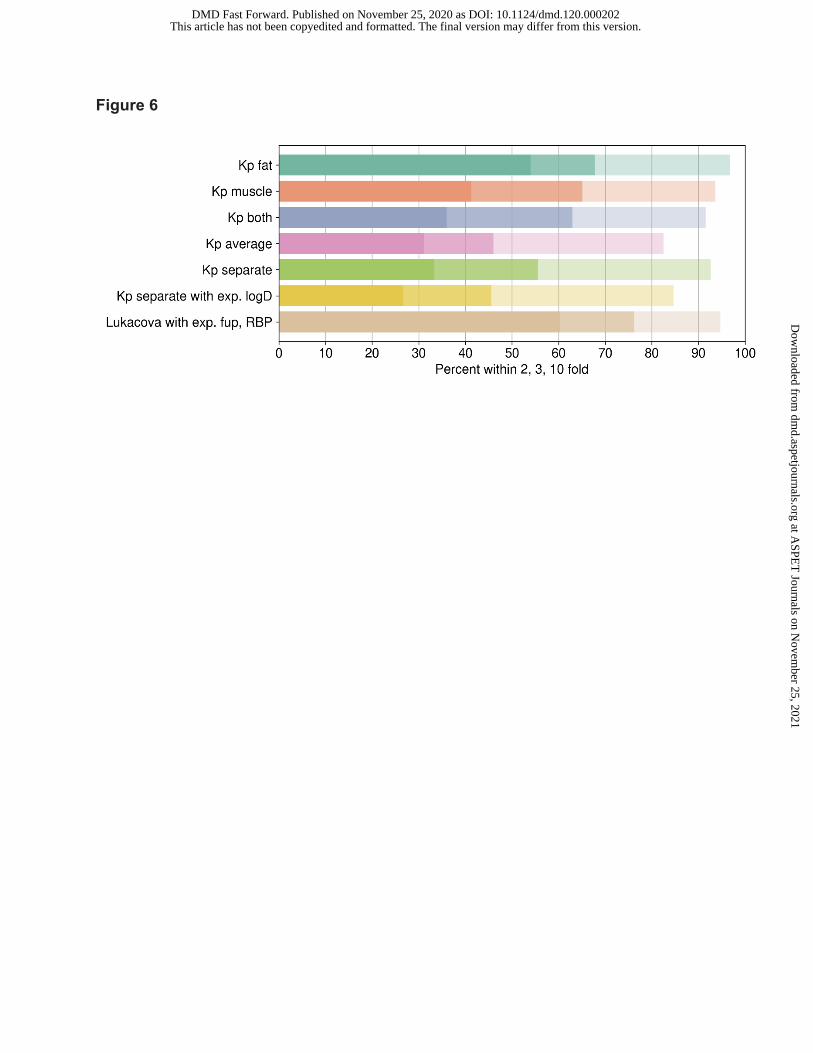
Figure 6
This article has not been copyedited and formatted. The final version may differ from this version.DMD Fast Forward. Published on November 25, 2020 as DOI: 10.1124/dmd.120.000202
at ASPE
T Journals on N
ovember 25, 2021
dmd.aspetjournals.org
Dow
nloaded from