
Predicting user demographics in social networks - Invited Talk at University of Warwick
54
-
Upload
nikolaos-aletras -
Category
Science
-
view
884 -
download
0
Transcript of Predicting user demographics in social networks - Invited Talk at University of Warwick

introduction
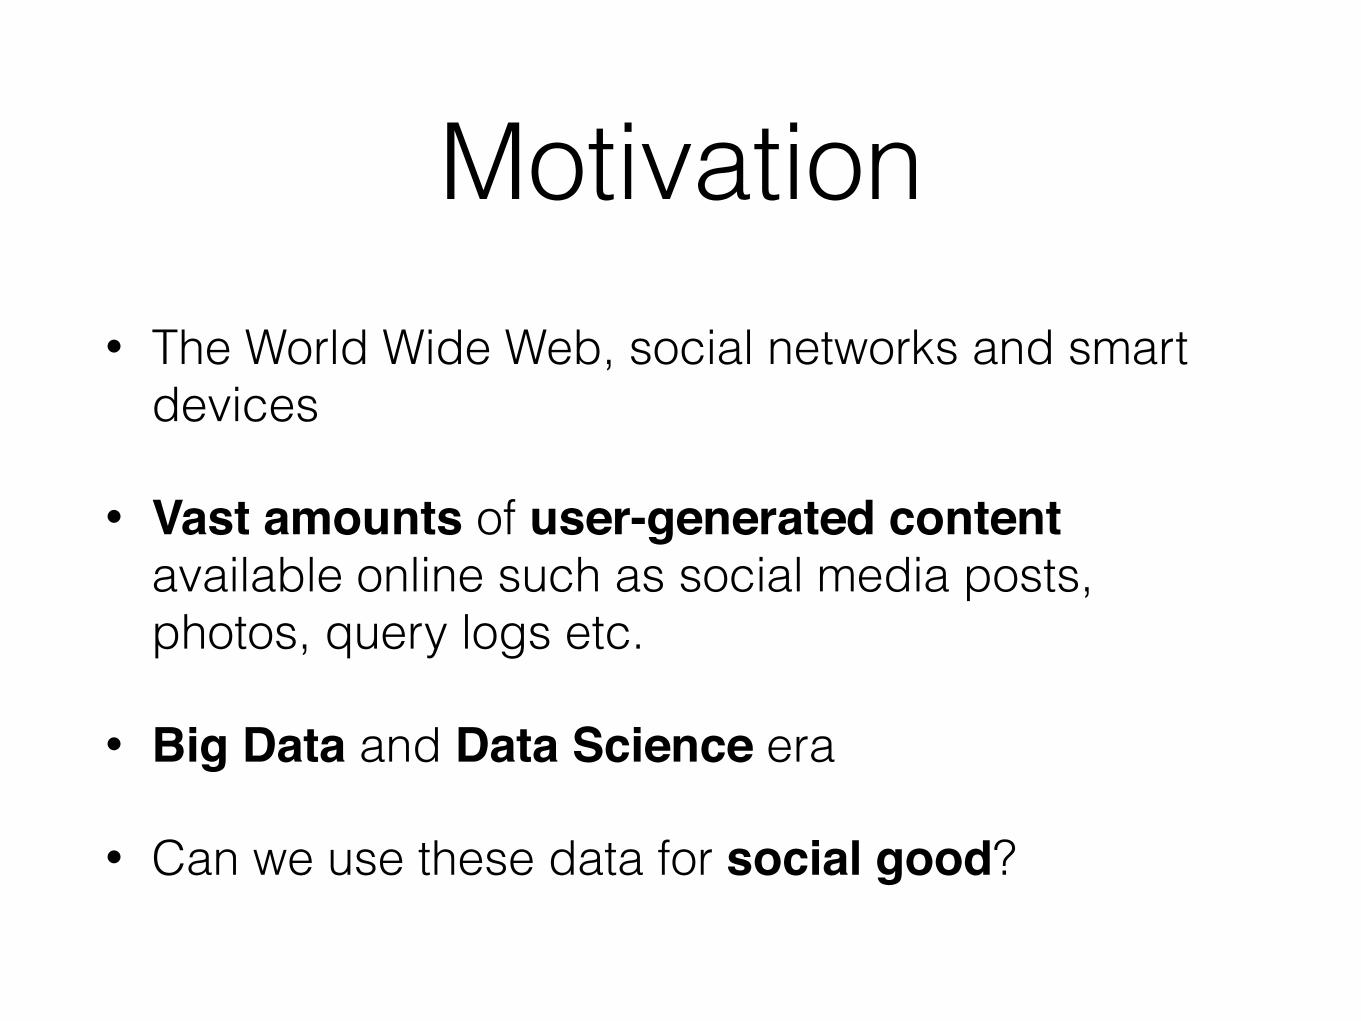
Motivation• The World Wide Web, social networks and smart
devices
• Vast amounts of user-generated content available online such as social media posts, photos, query logs etc.
• Big Data and Data Science era
• Can we use these data for social good?
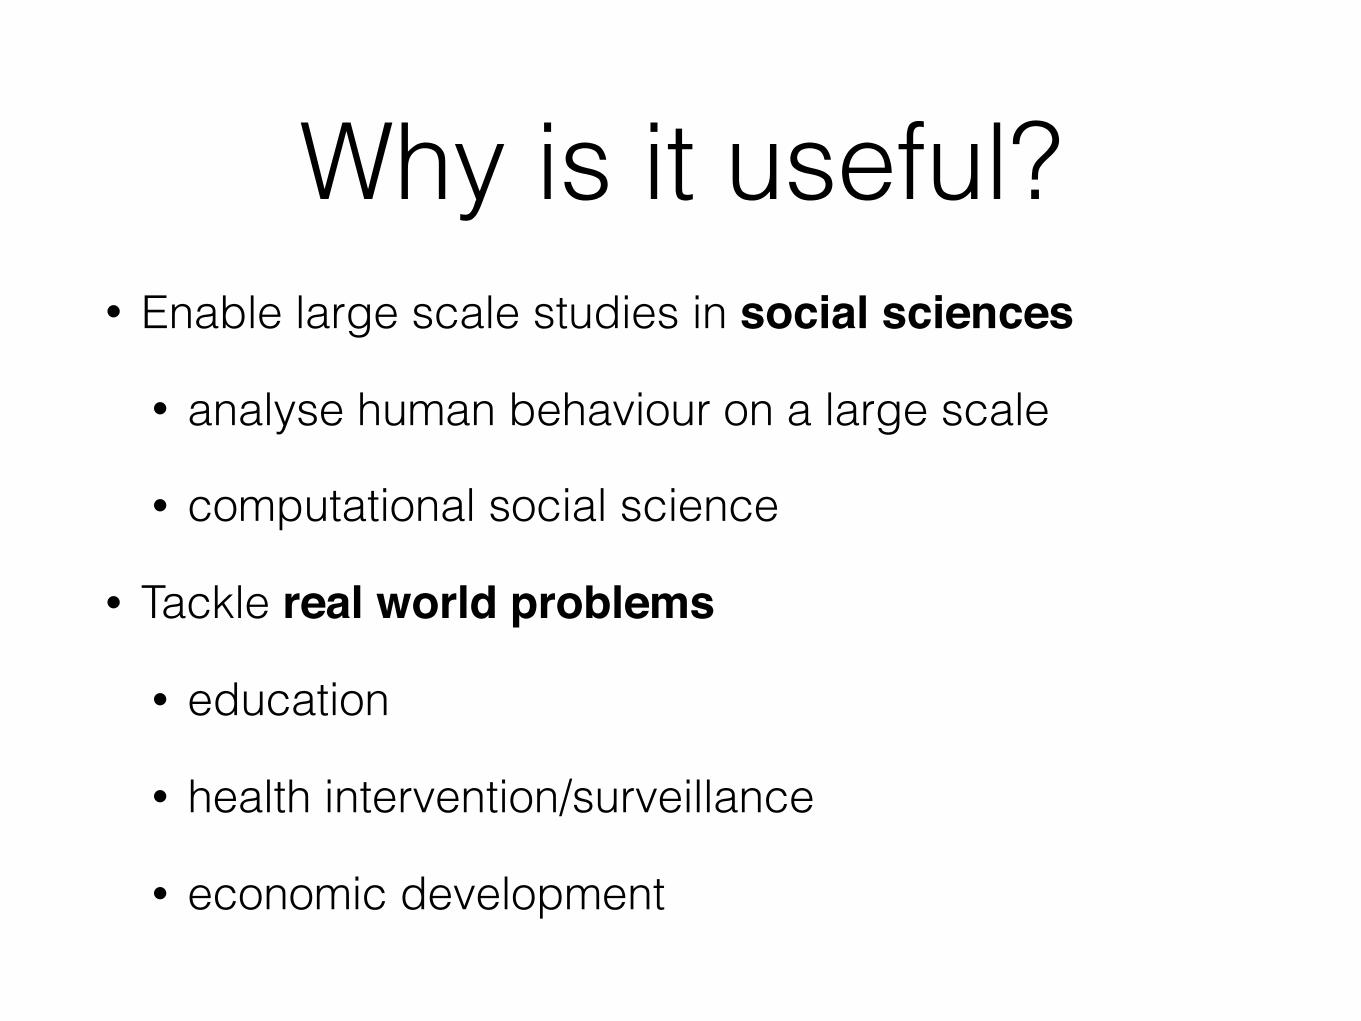
Why is it useful?• Enable large scale studies in social sciences
• analyse human behaviour on a large scale
• computational social science
• Tackle real world problems
• education
• health intervention/surveillance
• economic development
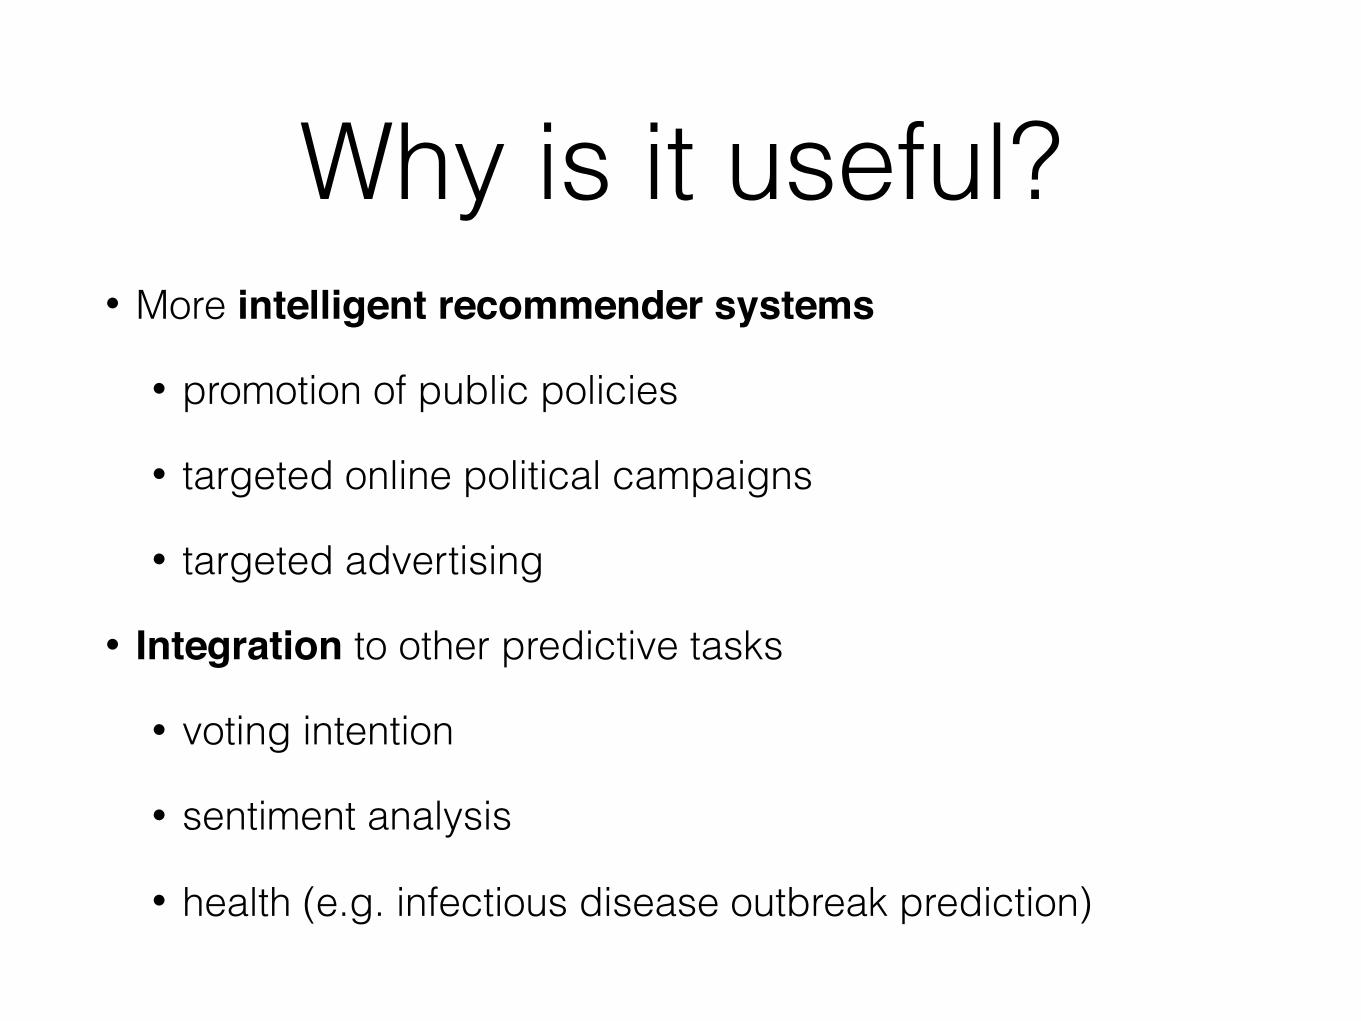
Why is it useful?• More intelligent recommender systems
• promotion of public policies
• targeted online political campaigns
• targeted advertising
• Integration to other predictive tasks
• voting intention
• sentiment analysis
• health (e.g. infectious disease outbreak prediction)
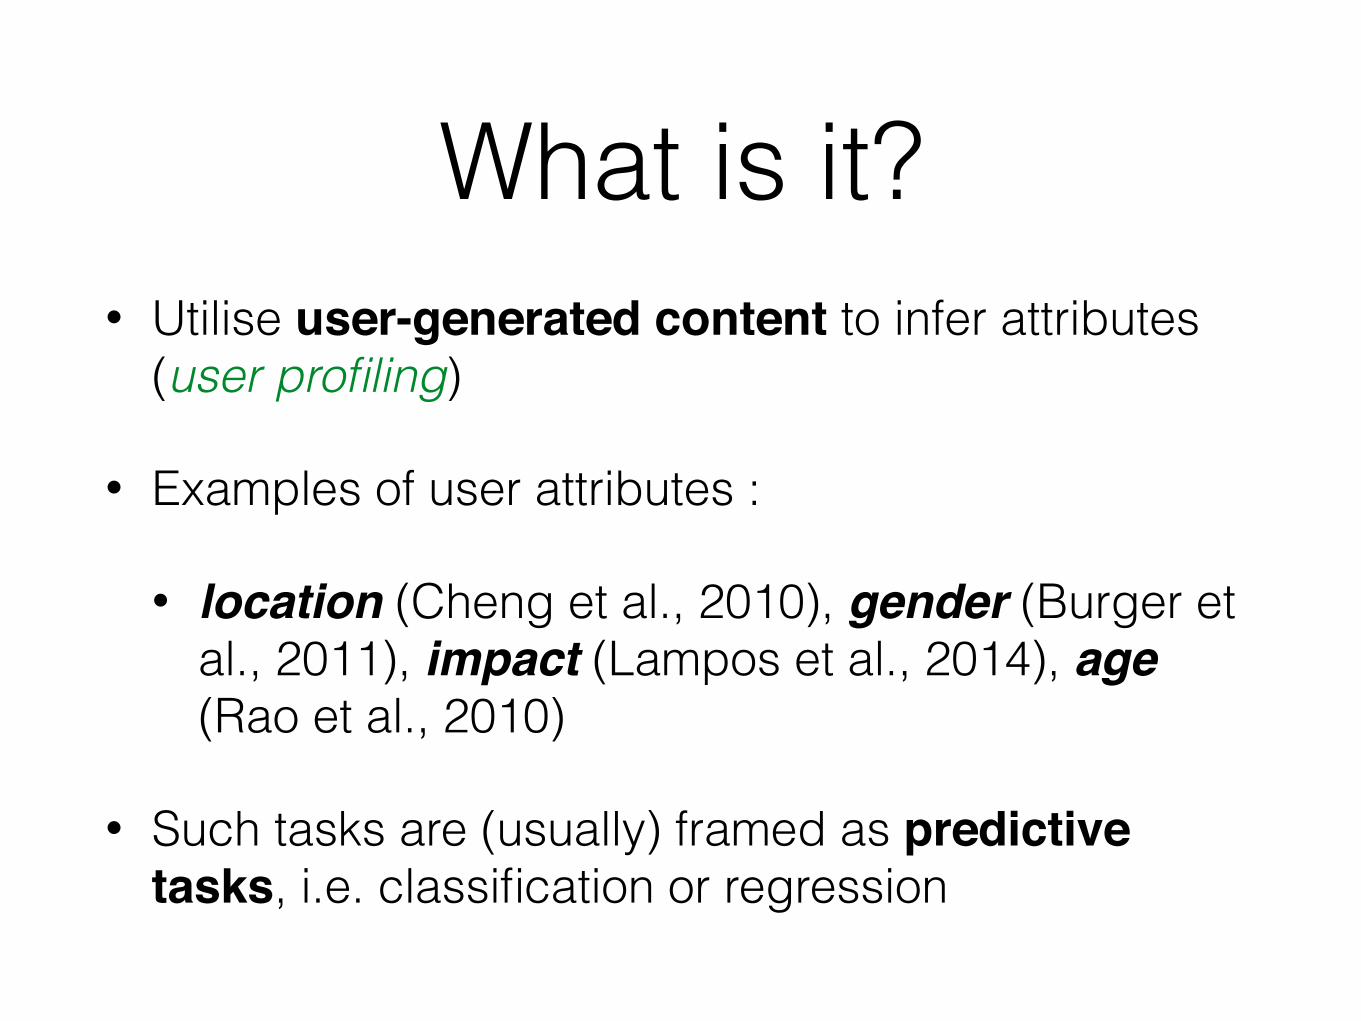
What is it?• Utilise user-generated content to infer attributes
(user profiling)
• Examples of user attributes :
• location (Cheng et al., 2010), gender (Burger et al., 2011), impact (Lampos et al., 2014), age (Rao et al., 2010)
• Such tasks are (usually) framed as predictive tasks, i.e. classification or regression
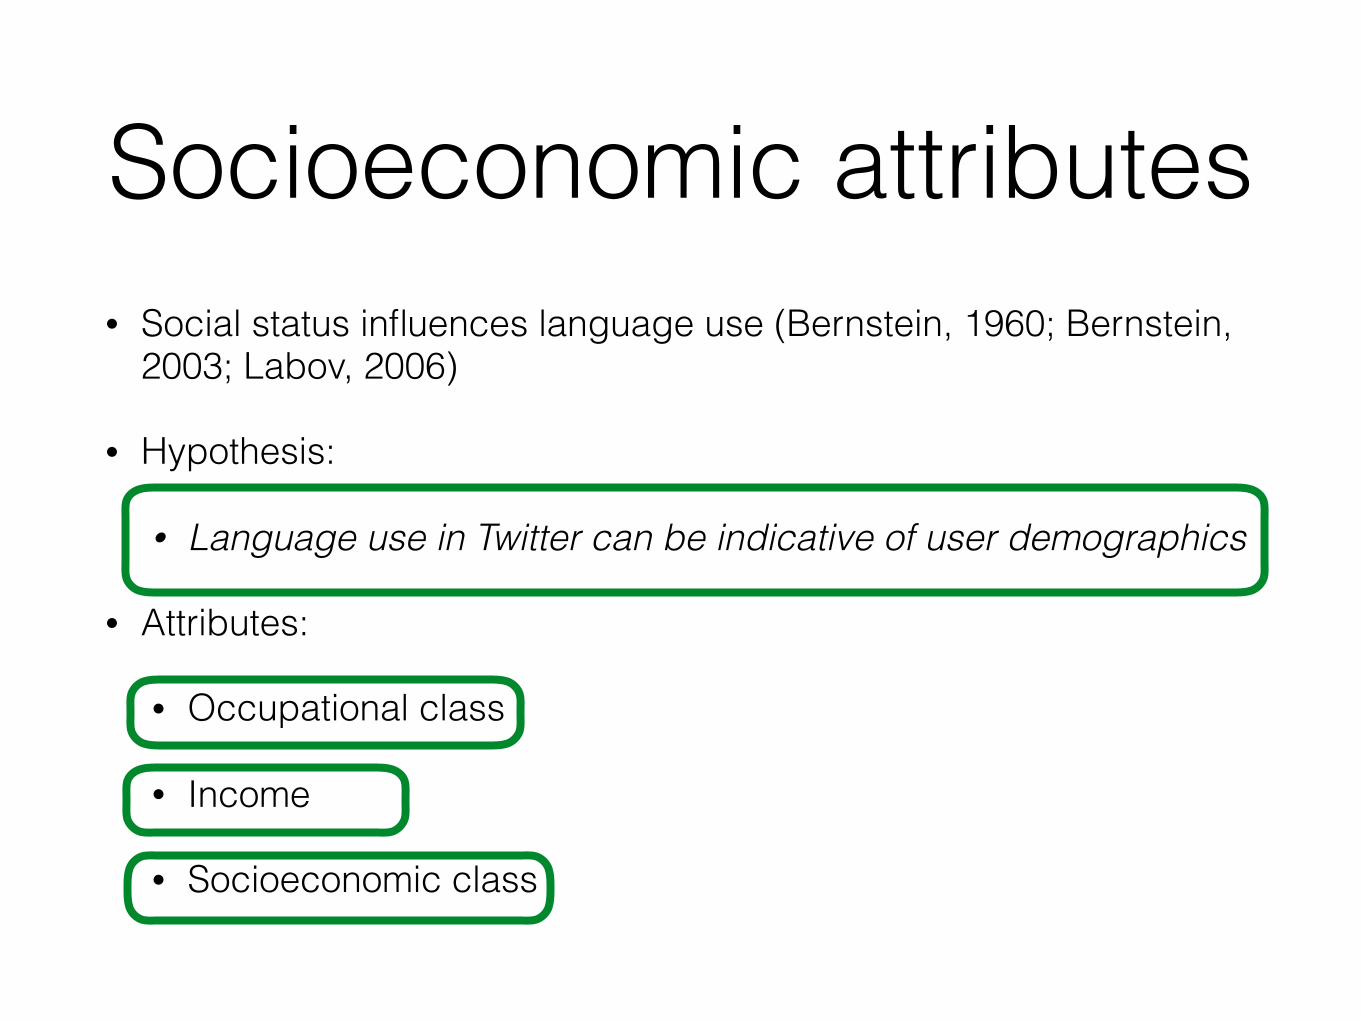
Socioeconomic attributes• Social status influences language use (Bernstein, 1960; Bernstein,
2003; Labov, 2006)
• Hypothesis:
• Language use in Twitter can be indicative of user demographics
• Attributes:
• Occupational class
• Income
• Socioeconomic class

data
SOC taxonomy
• Standard Occupational Classification (SOC):
• Taxonomy of jobs, grouped by skill requirements
• Developed by the UK Office for National Statistics
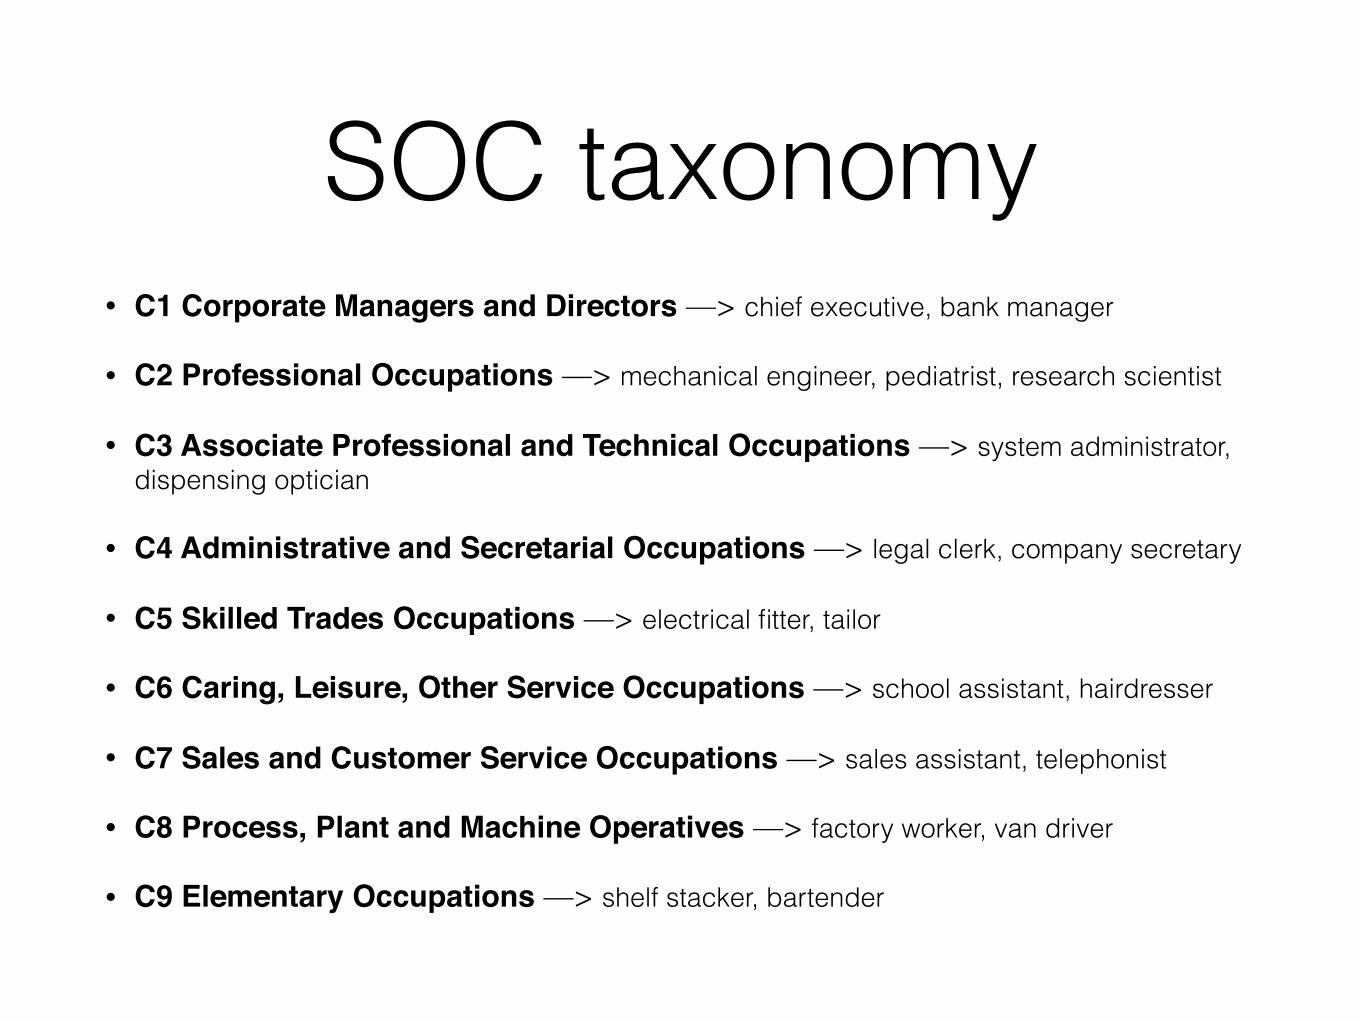
SOC taxonomy• C1 Corporate Managers and Directors —> chief executive, bank manager
• C2 Professional Occupations —> mechanical engineer, pediatrist, research scientist
• C3 Associate Professional and Technical Occupations —> system administrator, dispensing optician
• C4 Administrative and Secretarial Occupations —> legal clerk, company secretary
• C5 Skilled Trades Occupations —> electrical fitter, tailor
• C6 Caring, Leisure, Other Service Occupations —> school assistant, hairdresser
• C7 Sales and Customer Service Occupations —> sales assistant, telephonist
• C8 Process, Plant and Machine Operatives —> factory worker, van driver
• C9 Elementary Occupations —> shelf stacker, bartender
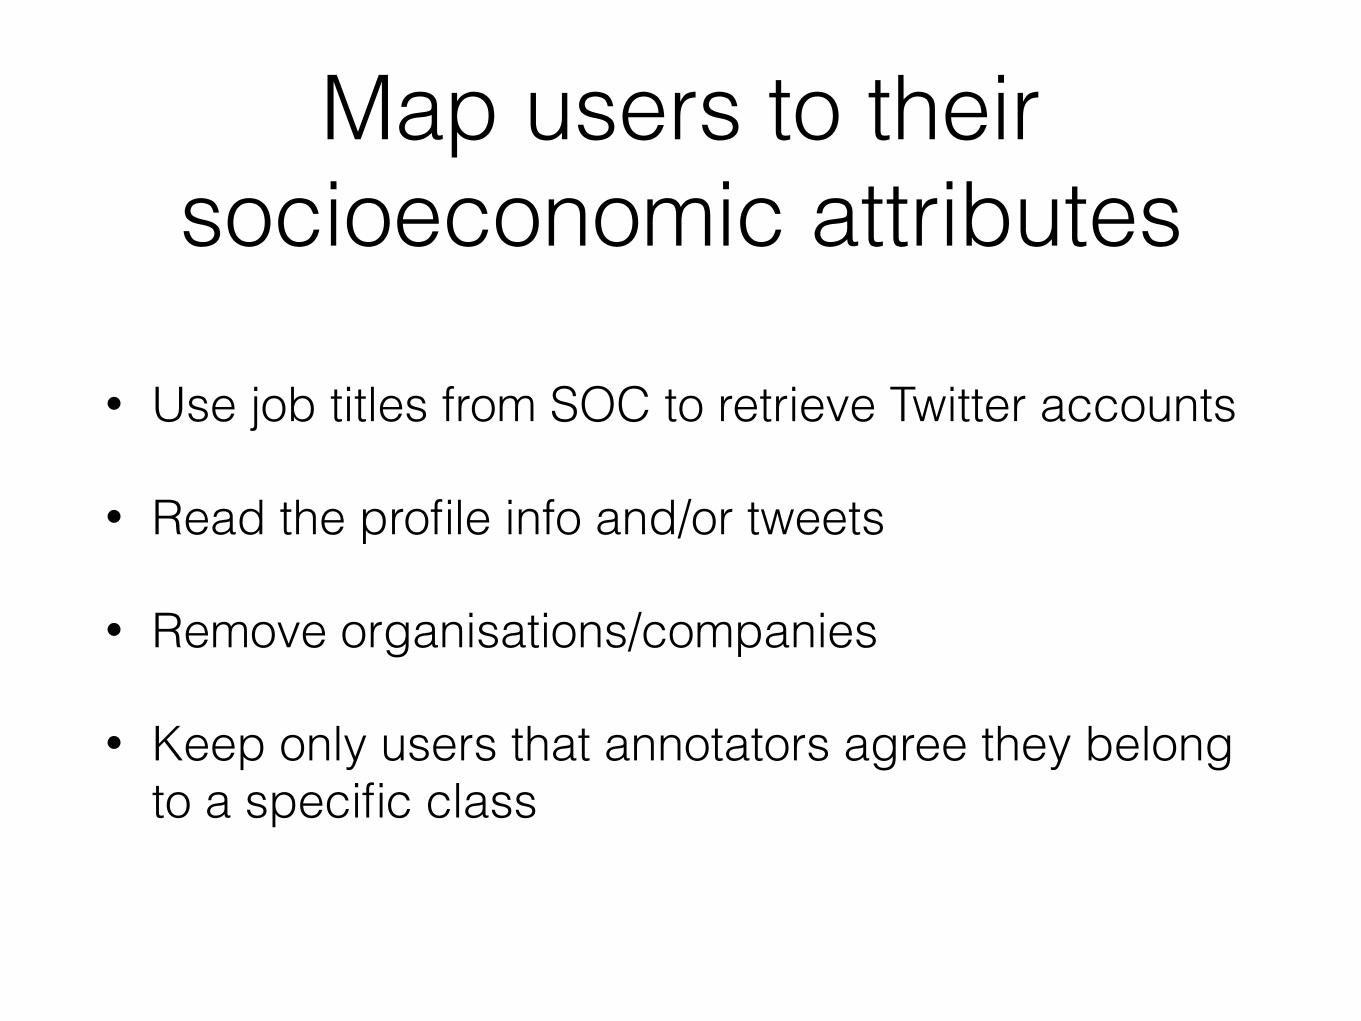
Map users to their socioeconomic attributes
• Use job titles from SOC to retrieve Twitter accounts
• Read the profile info and/or tweets
• Remove organisations/companies
• Keep only users that annotators agree they belong to a specific class
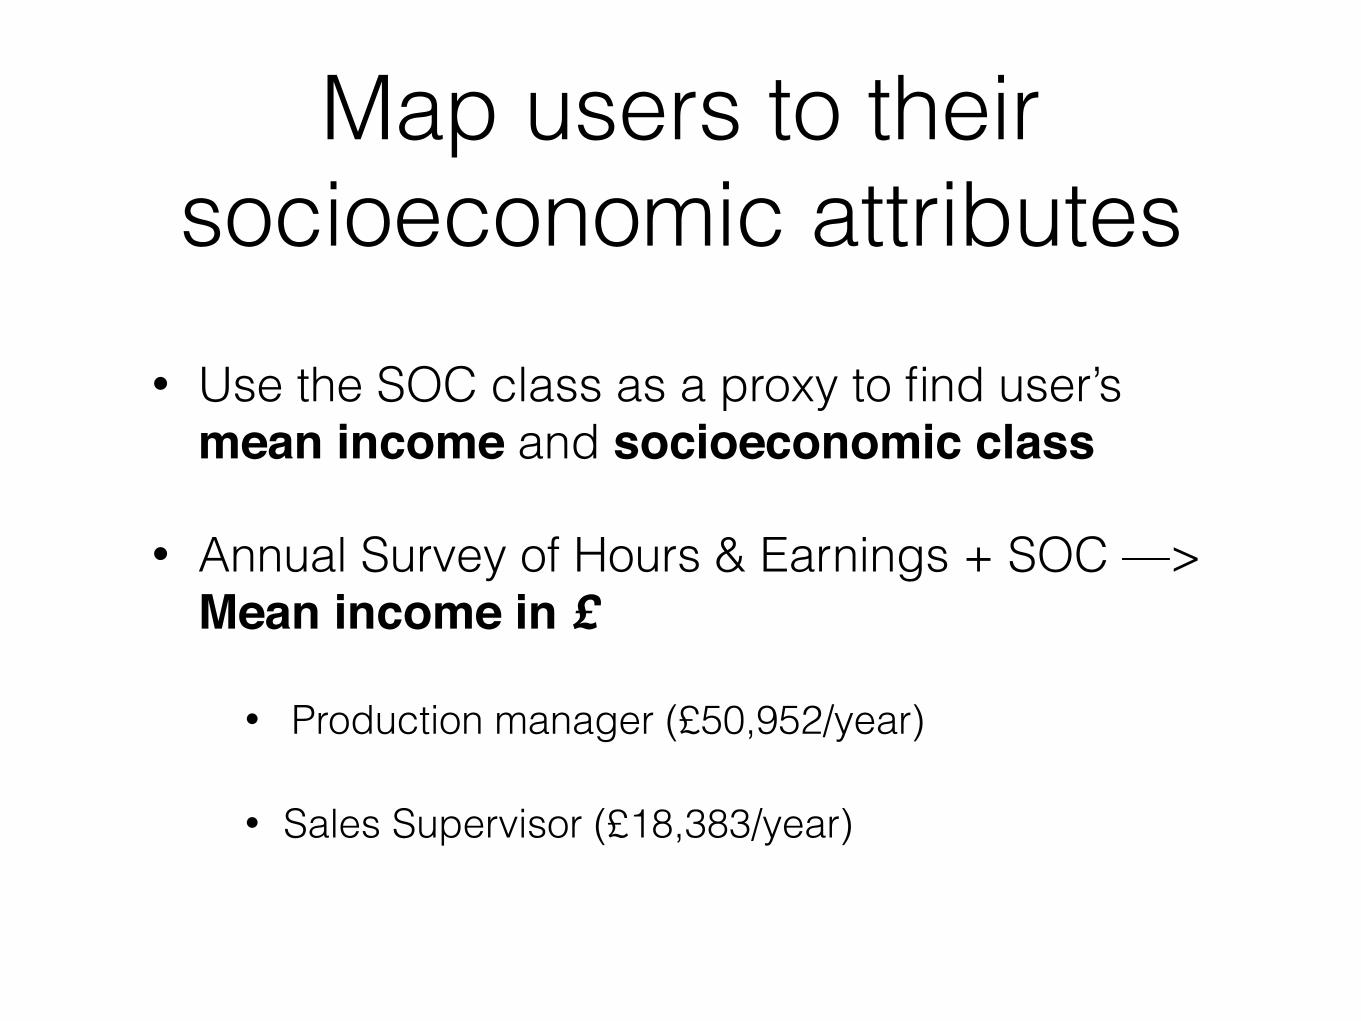
Map users to their socioeconomic attributes
• Use the SOC class as a proxy to find user’s mean income and socioeconomic class
• Annual Survey of Hours & Earnings + SOC —> Mean income in £
• Production manager (£50,952/year)
• Sales Supervisor (£18,383/year)
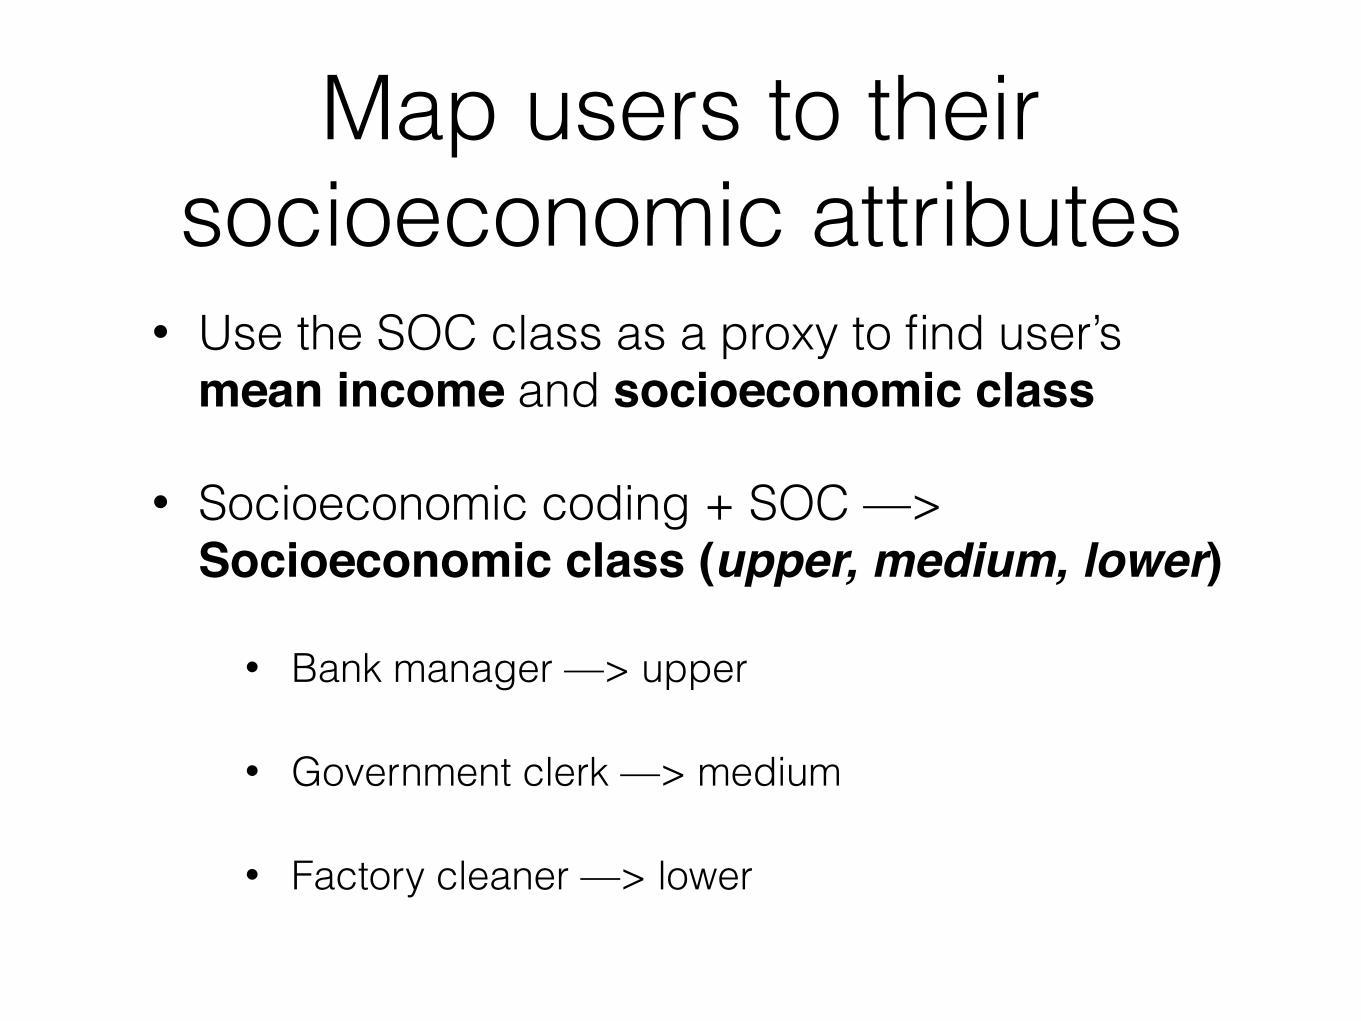
Map users to their socioeconomic attributes
• Use the SOC class as a proxy to find user’s mean income and socioeconomic class
• Socioeconomic coding + SOC —> Socioeconomic class (upper, medium, lower)
• Bank manager —> upper
• Government clerk —> medium
• Factory cleaner —> lower
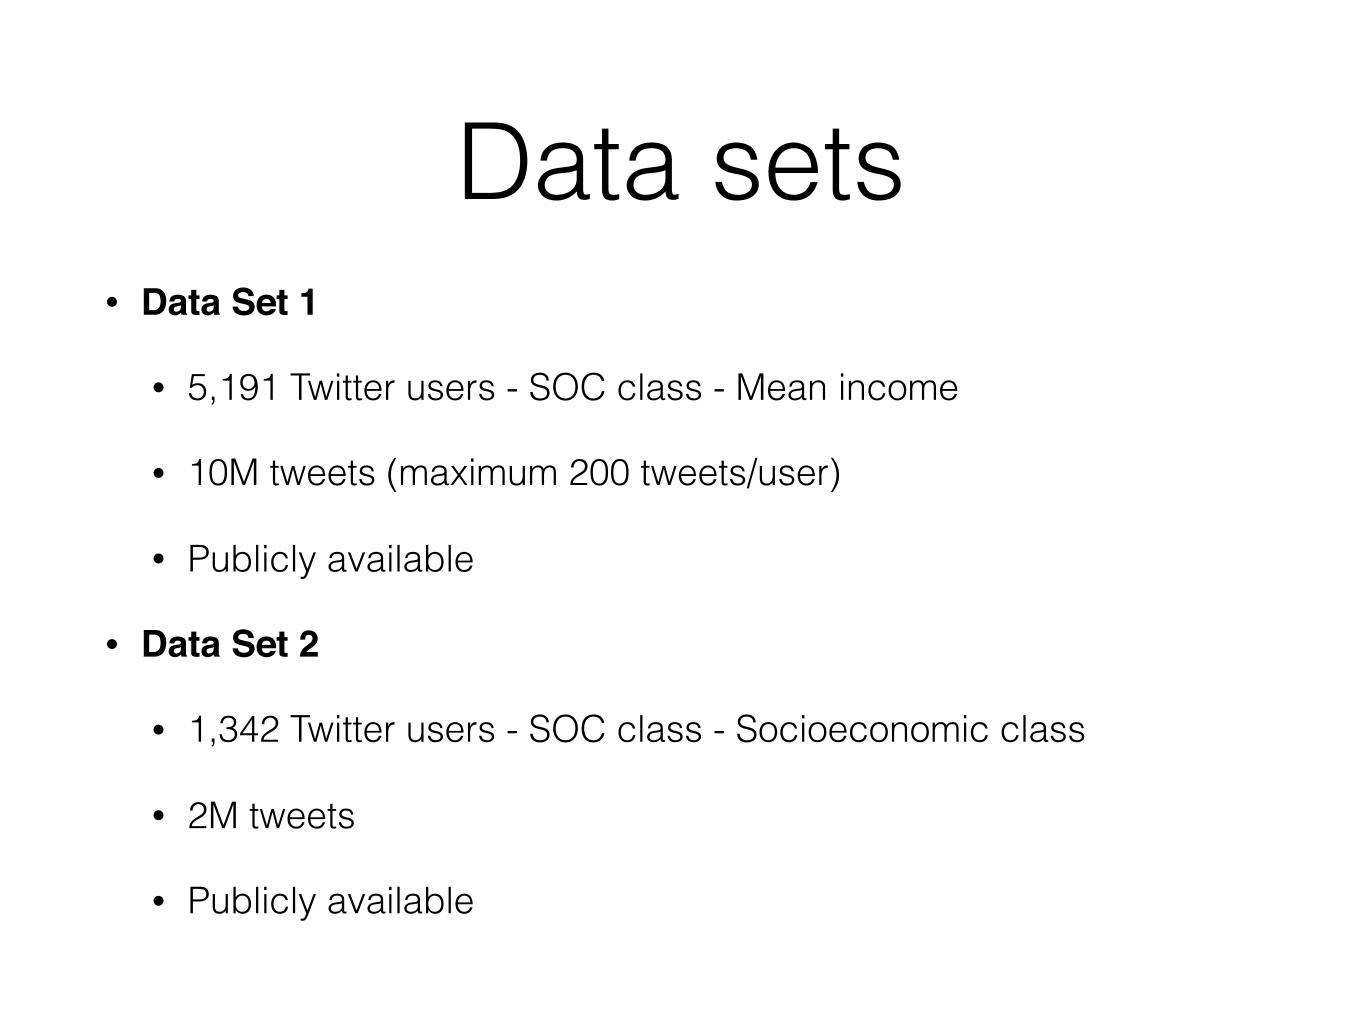
Data sets• Data Set 1
• 5,191 Twitter users - SOC class - Mean income
• 10M tweets (maximum 200 tweets/user)
• Publicly available
• Data Set 2
• 1,342 Twitter users - SOC class - Socioeconomic class
• 2M tweets
• Publicly available

models
Supervised Models
• Traditional linear models (e.g. logistic regression)
• Suport Vector Machines (SVMs)
• Gaussian Processes (GPs)
• Deep Neural Nets
Supervised Models
• We look for two main characteristics:
• Model non-linearities
• Interpretability
Gaussian Processes (GPs)• Bayesian
• kernel-based
• non-parametric
• non-linear
• modelling uncertainty
• interpretable models
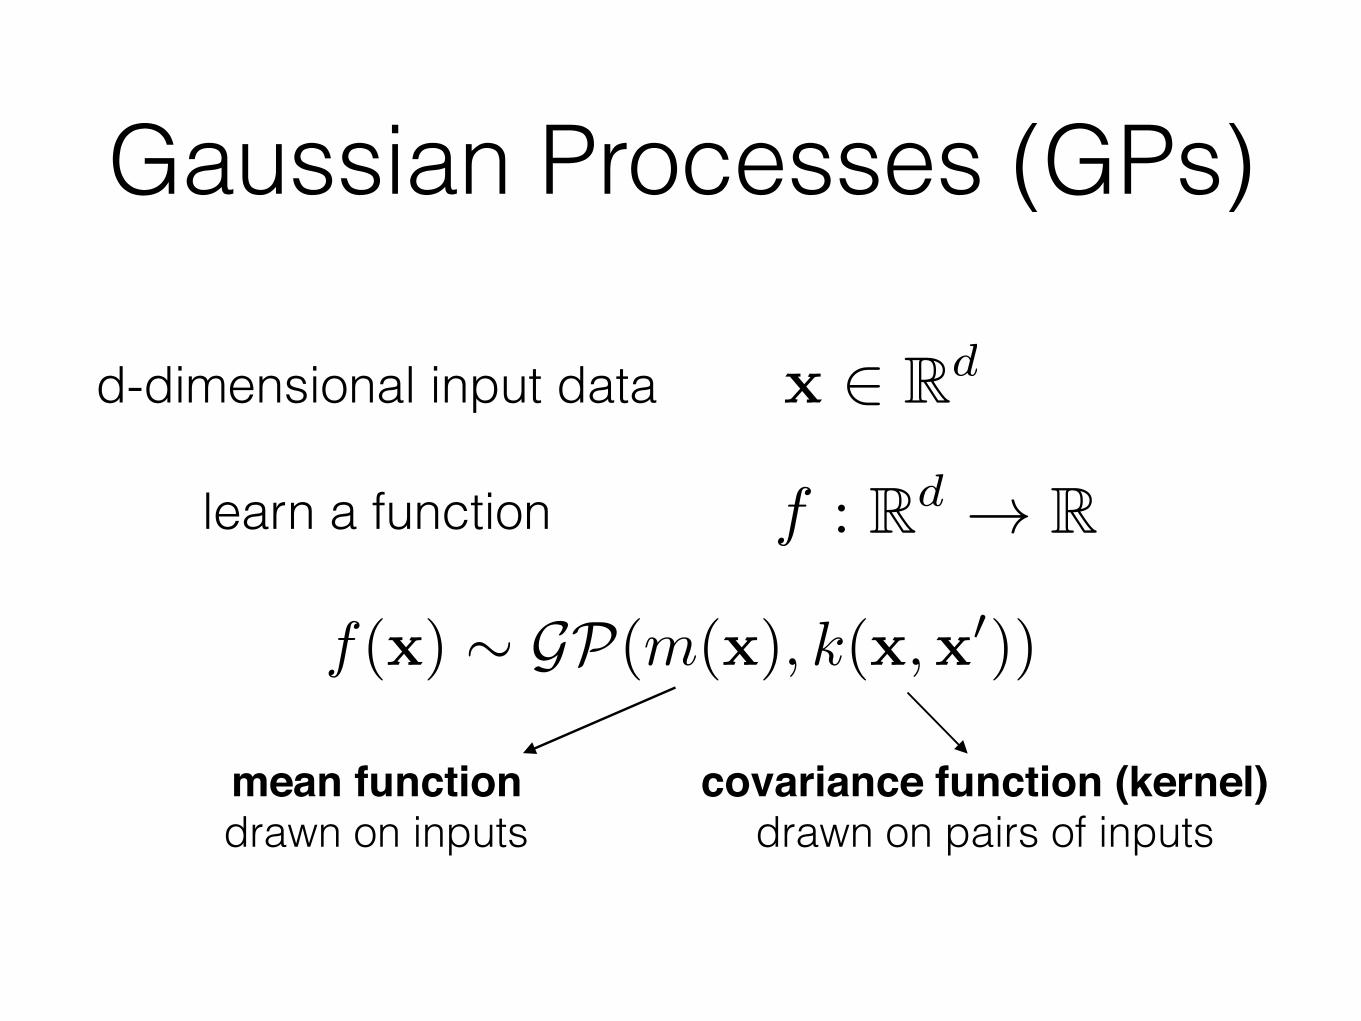
Gaussian Processes (GPs)
x 2 Rd
f : Rd ! R
f(x) ⇠ GP(m(x), k(x,x0))
d-dimensional input data
learn a function
mean functiondrawn on inputs
covariance function (kernel)drawn on pairs of inputs
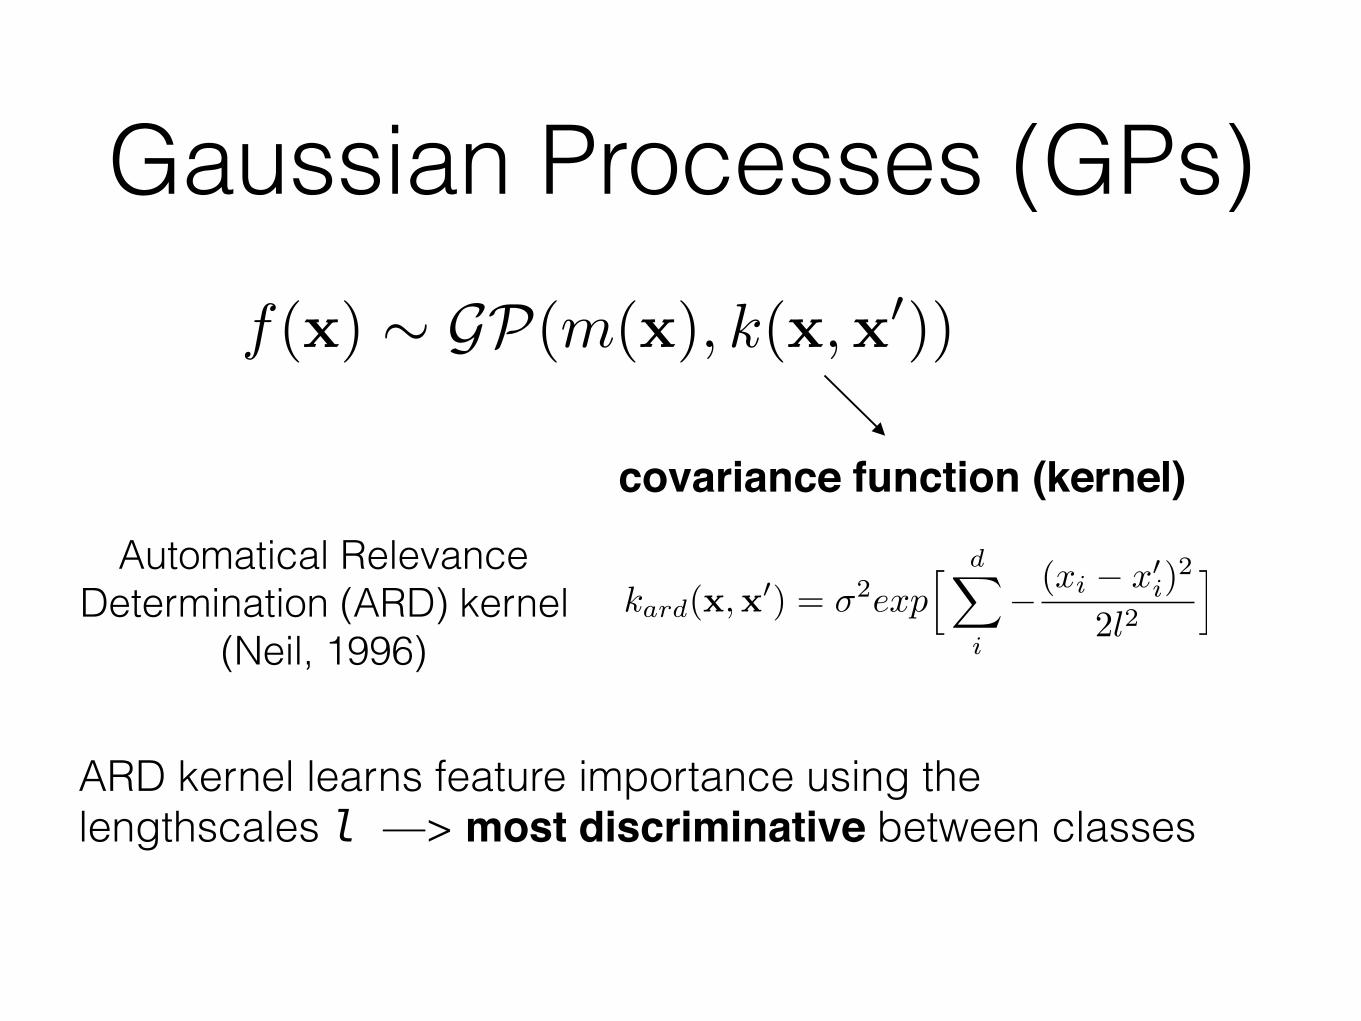
Gaussian Processes (GPs)f(x) ⇠ GP(m(x), k(x,x0))
covariance function (kernel)
Automatical Relevance Determination (ARD) kernel
(Neil, 1996)kard(x,x
0) = �
2exp
h dX
i
� (xi � x
0i)
2
2l2
i
ARD kernel learns feature importance using the lengthscales l —> most discriminative between classes
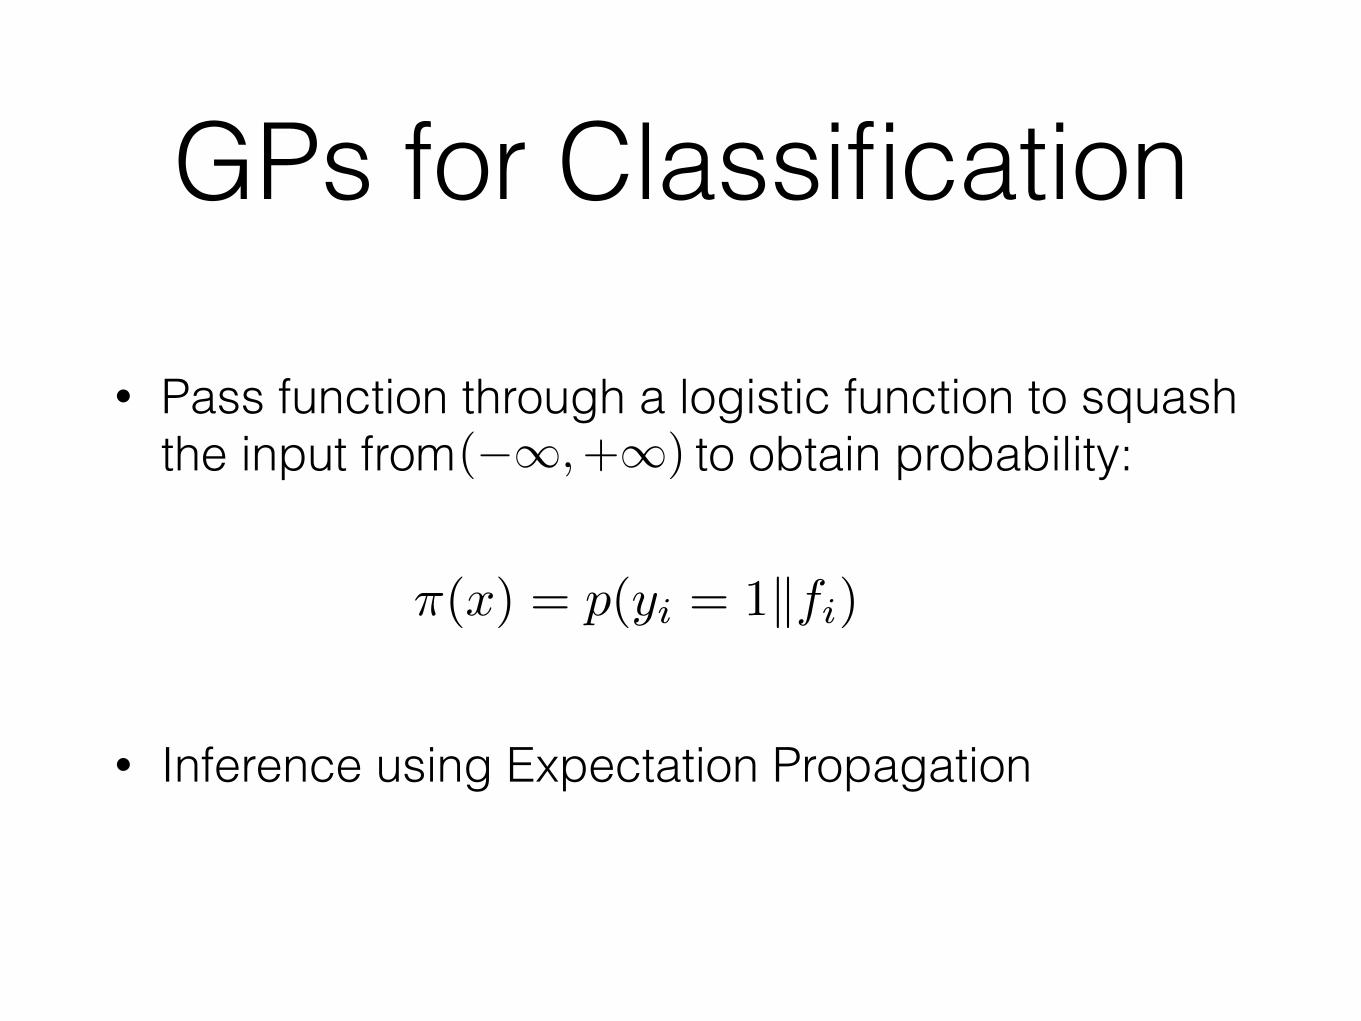
GPs for Classification
• Pass function through a logistic function to squash the input from to obtain probability:(�1,+1)
⇡(x) = p(yi = 1kfi)
• Inference using Expectation Propagation
Gaussian Processes (GPs)
• More information about GPs:
• http://www.gaussianprocess.org/
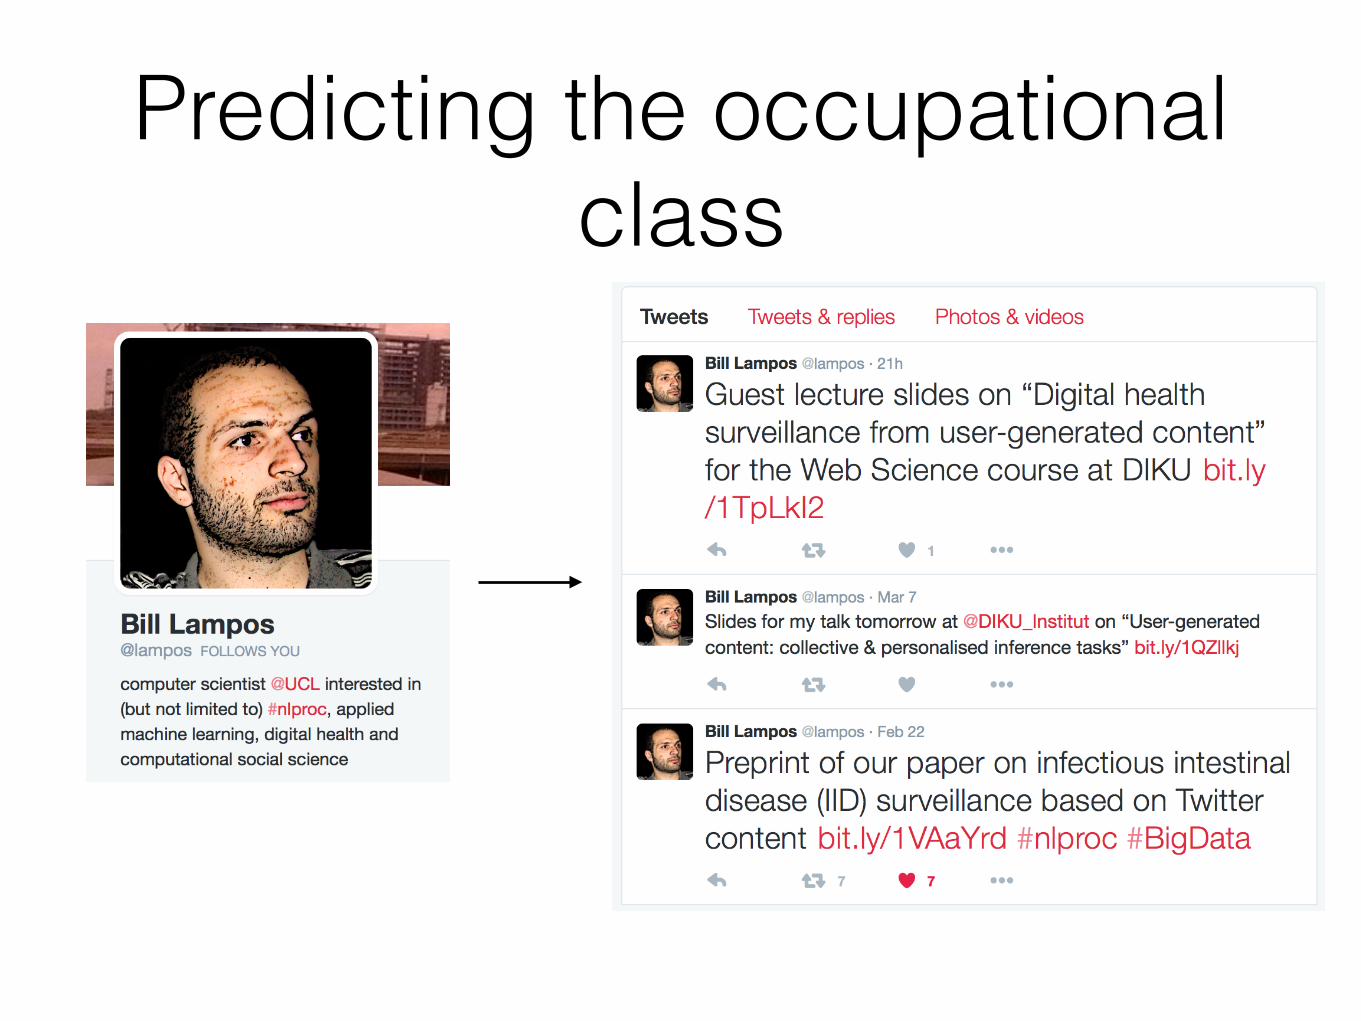
Predicting the occupational class
Preotiuc-Pietro et al. (2015, ACL)
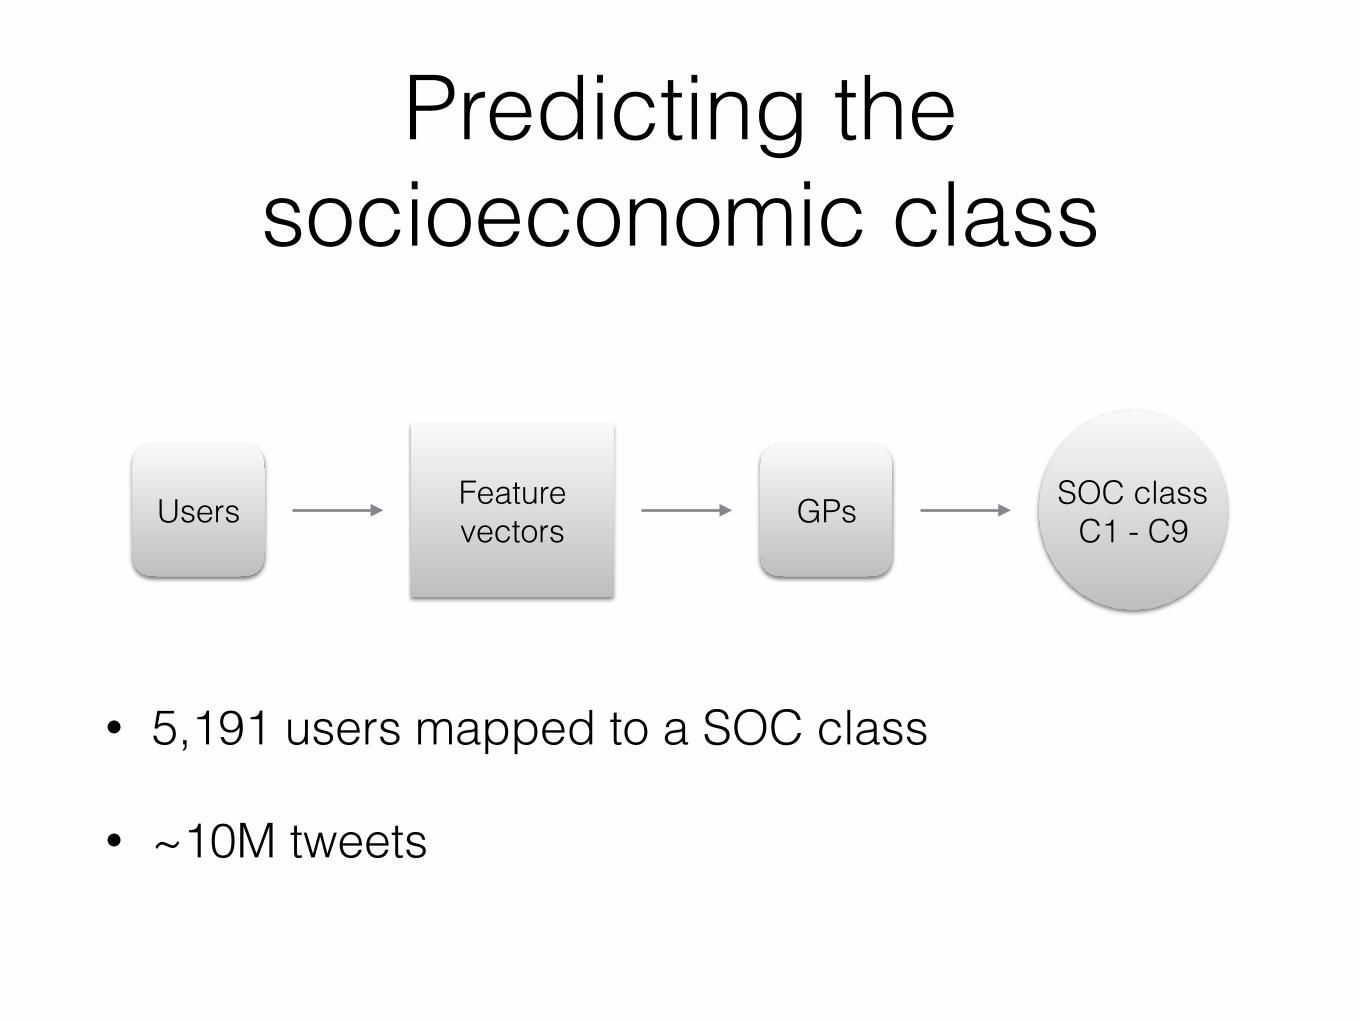
Predicting the socioeconomic class
Users Feature vectors GPs SOC class
C1 - C9
• 5,191 users mapped to a SOC class
• ~10M tweets
Predicting the occupational class
46.9
51.7 52.7
0%
10%
20%
30%
40%
C1 C2 C3 C4 C5 C6 C7 C8 C9
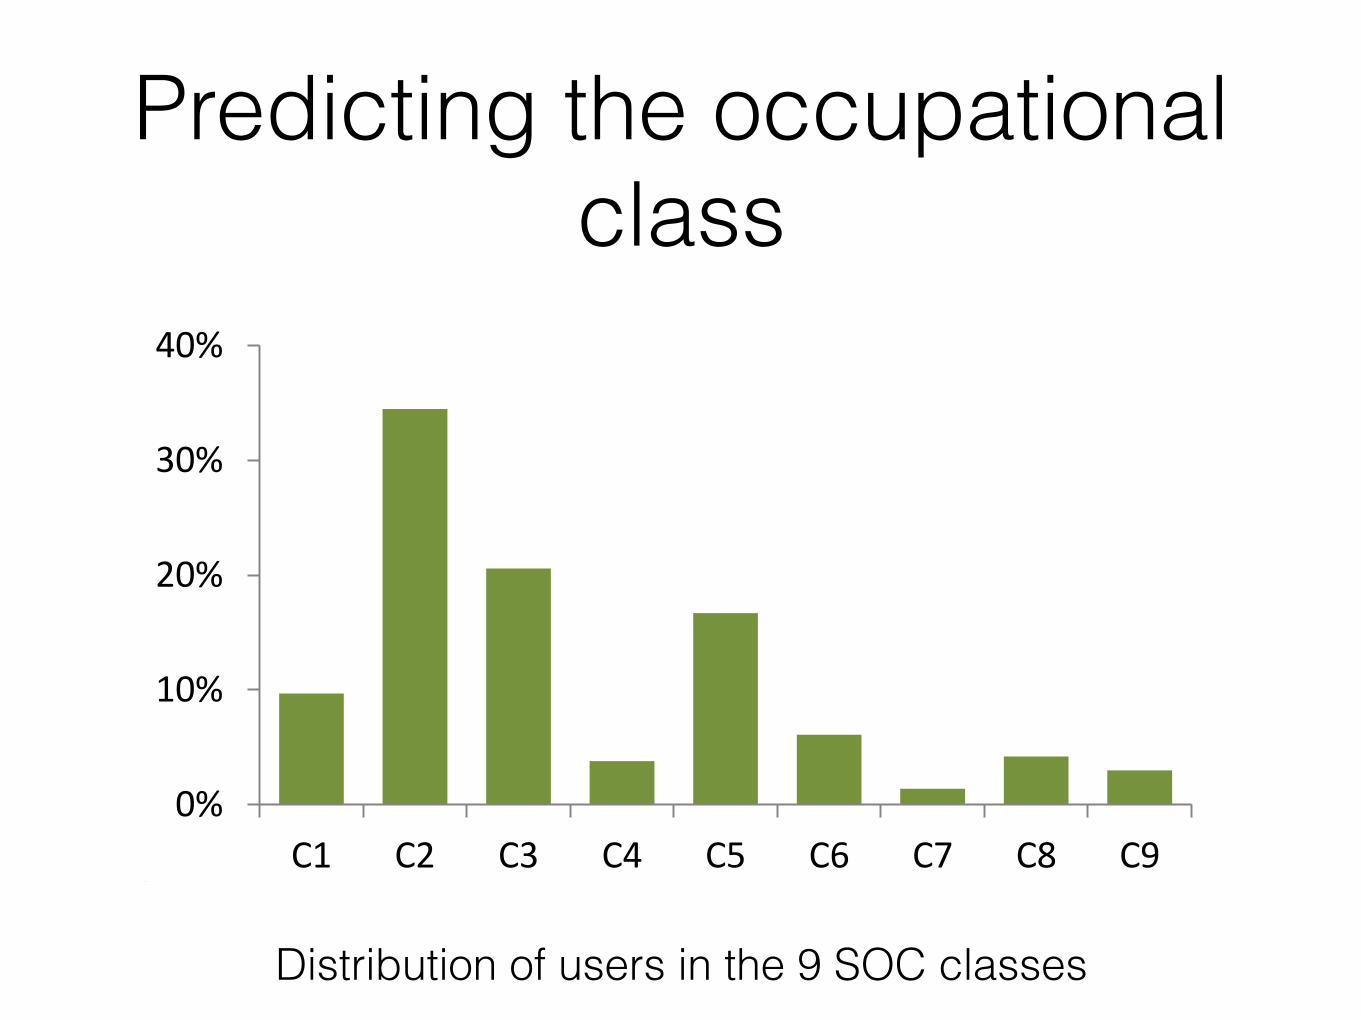
Distribution of users in the 9 SOC classes
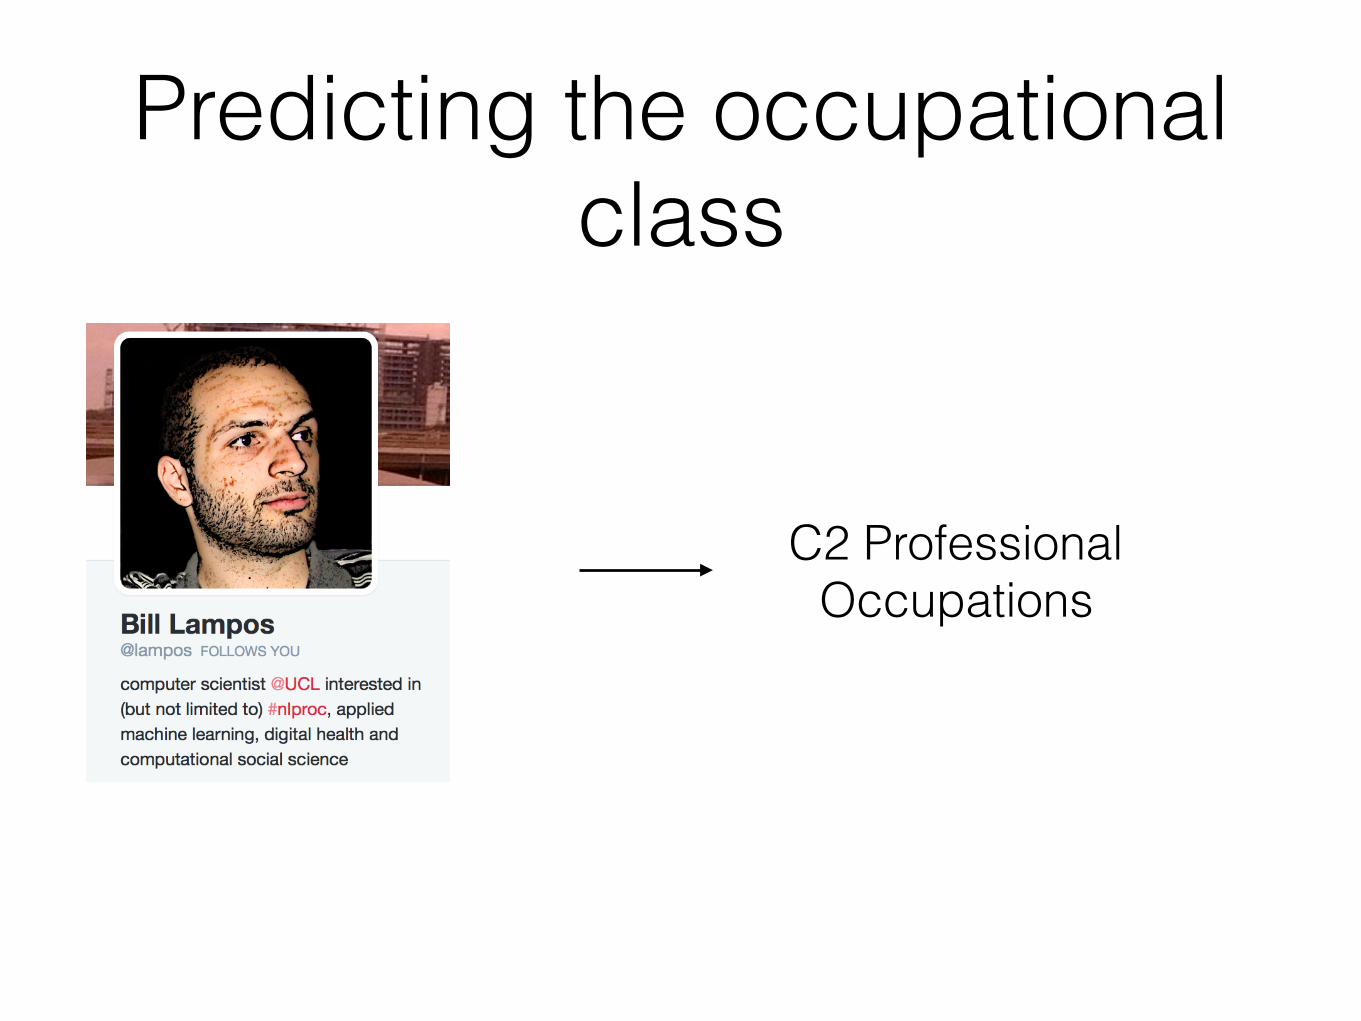
Predicting the occupational class
C2 Professional Occupations
Predicting the occupational class
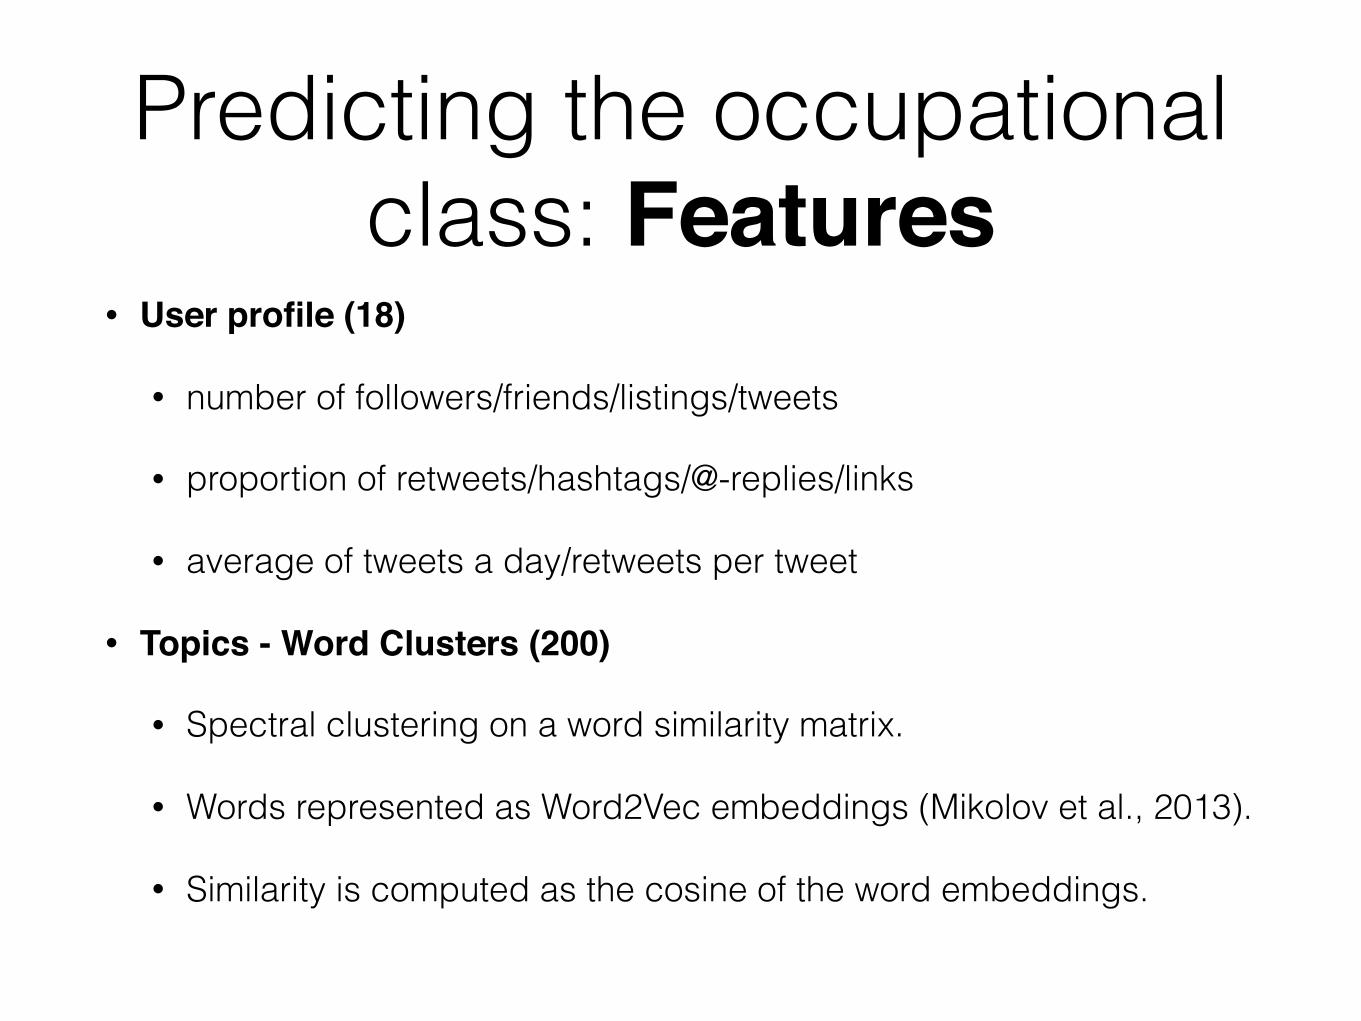
Predicting the occupational class: Features
• User profile (18)
• number of followers/friends/listings/tweets
• proportion of retweets/hashtags/@-replies/links
• average of tweets a day/retweets per tweet
• Topics - Word Clusters (200)
• Spectral clustering on a word similarity matrix.
• Words represented as Word2Vec embeddings (Mikolov et al., 2013).
• Similarity is computed as the cosine of the word embeddings.
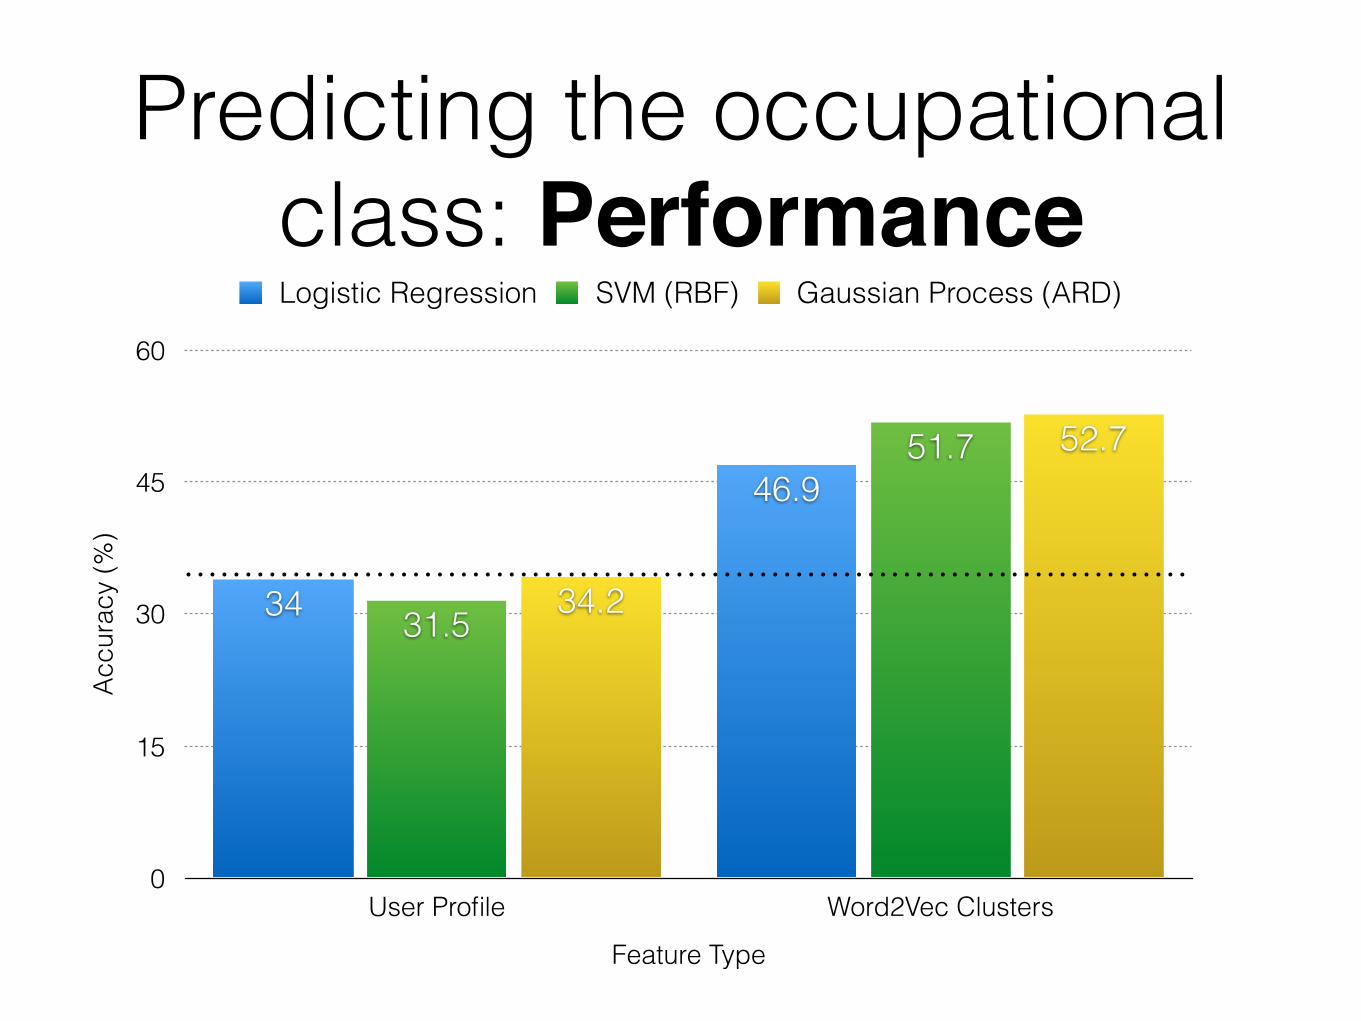
Predicting the occupational class: Performance
Accu
racy
(%)
0
15
30
45
60
Feature Type
User Profile Word2Vec Clusters
52.7
34.2
51.7
31.5
46.9
34
Logistic Regression SVM (RBF) Gaussian Process (ARD)
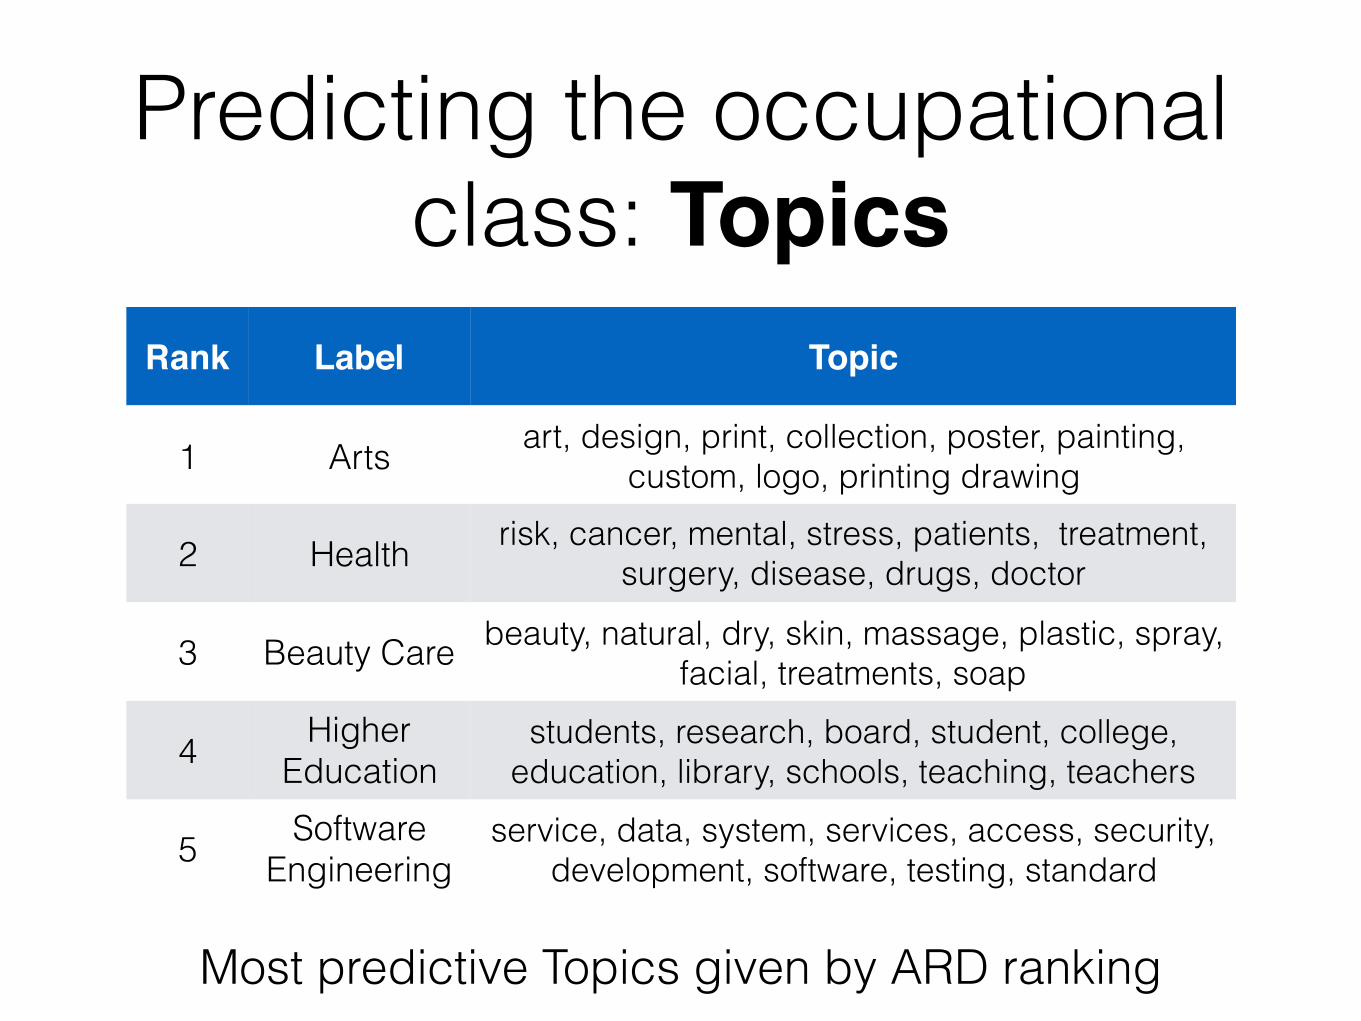
Predicting the occupational class: Topics
Rank Label Topic
1 Arts art, design, print, collection, poster, painting, custom, logo, printing drawing
2 Health risk, cancer, mental, stress, patients, treatment, surgery, disease, drugs, doctor
3 Beauty Care beauty, natural, dry, skin, massage, plastic, spray, facial, treatments, soap
4 Higher Education
students, research, board, student, college, education, library, schools, teaching, teachers
5 Software Engineering
service, data, system, services, access, security, development, software, testing, standard
Most predictive Topics given by ARD ranking
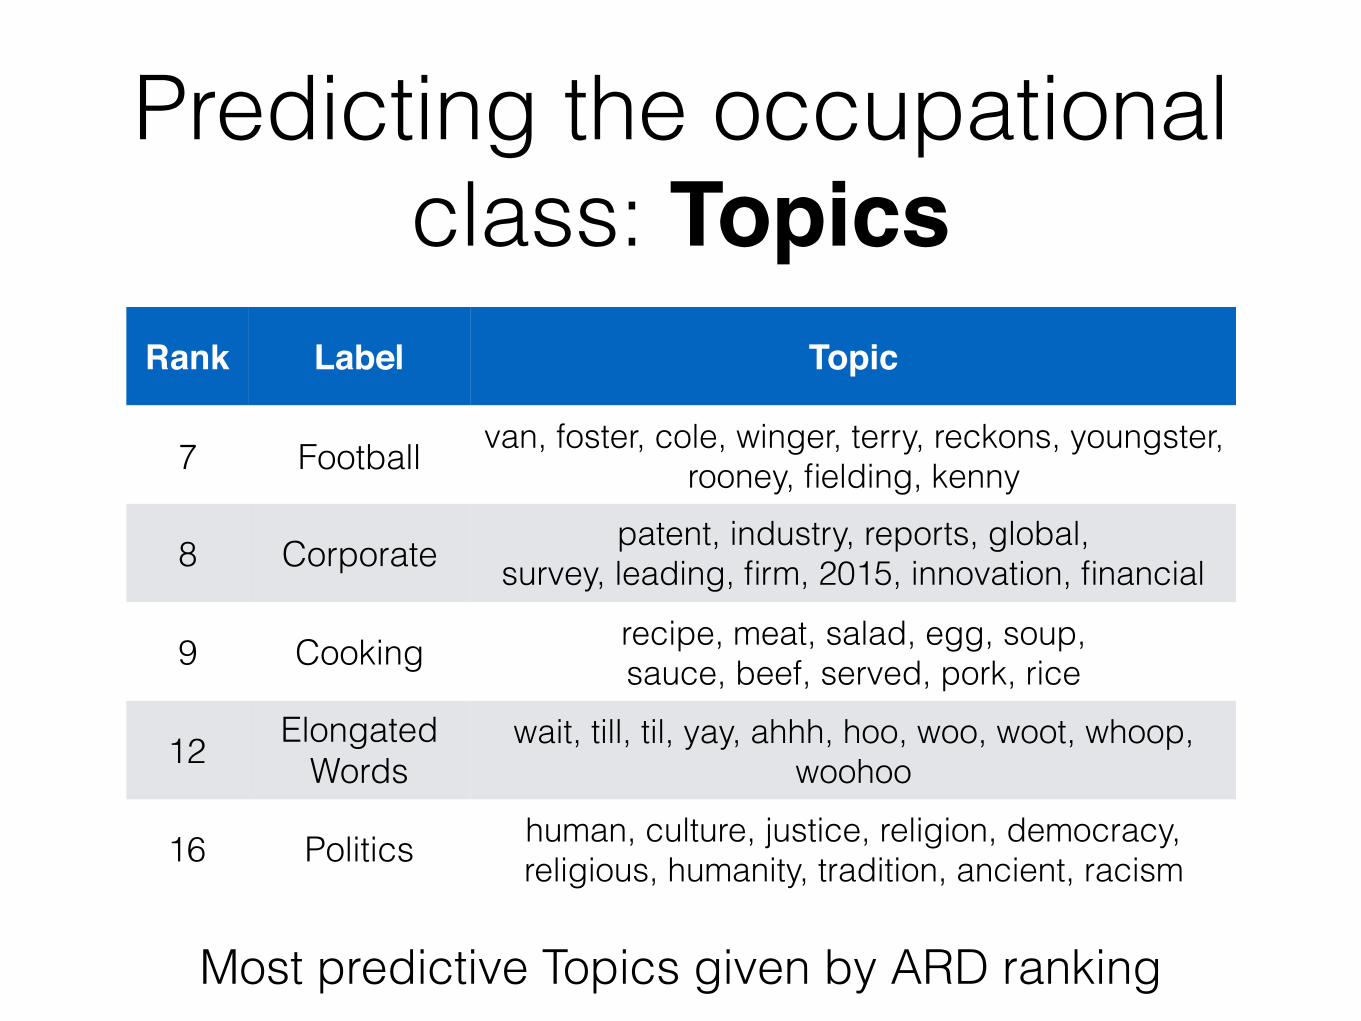
Predicting the occupational class: Topics
Rank Label Topic
7 Football van, foster, cole, winger, terry, reckons, youngster, rooney, fielding, kenny
8 Corporate patent, industry, reports, global, survey, leading, firm, 2015, innovation, financial
9 Cooking recipe, meat, salad, egg, soup, sauce, beef, served, pork, rice
12 Elongated Words
wait, till, til, yay, ahhh, hoo, woo, woot, whoop, woohoo
16 Politics human, culture, justice, religion, democracy, religious, humanity, tradition, ancient, racism
Most predictive Topics given by ARD ranking
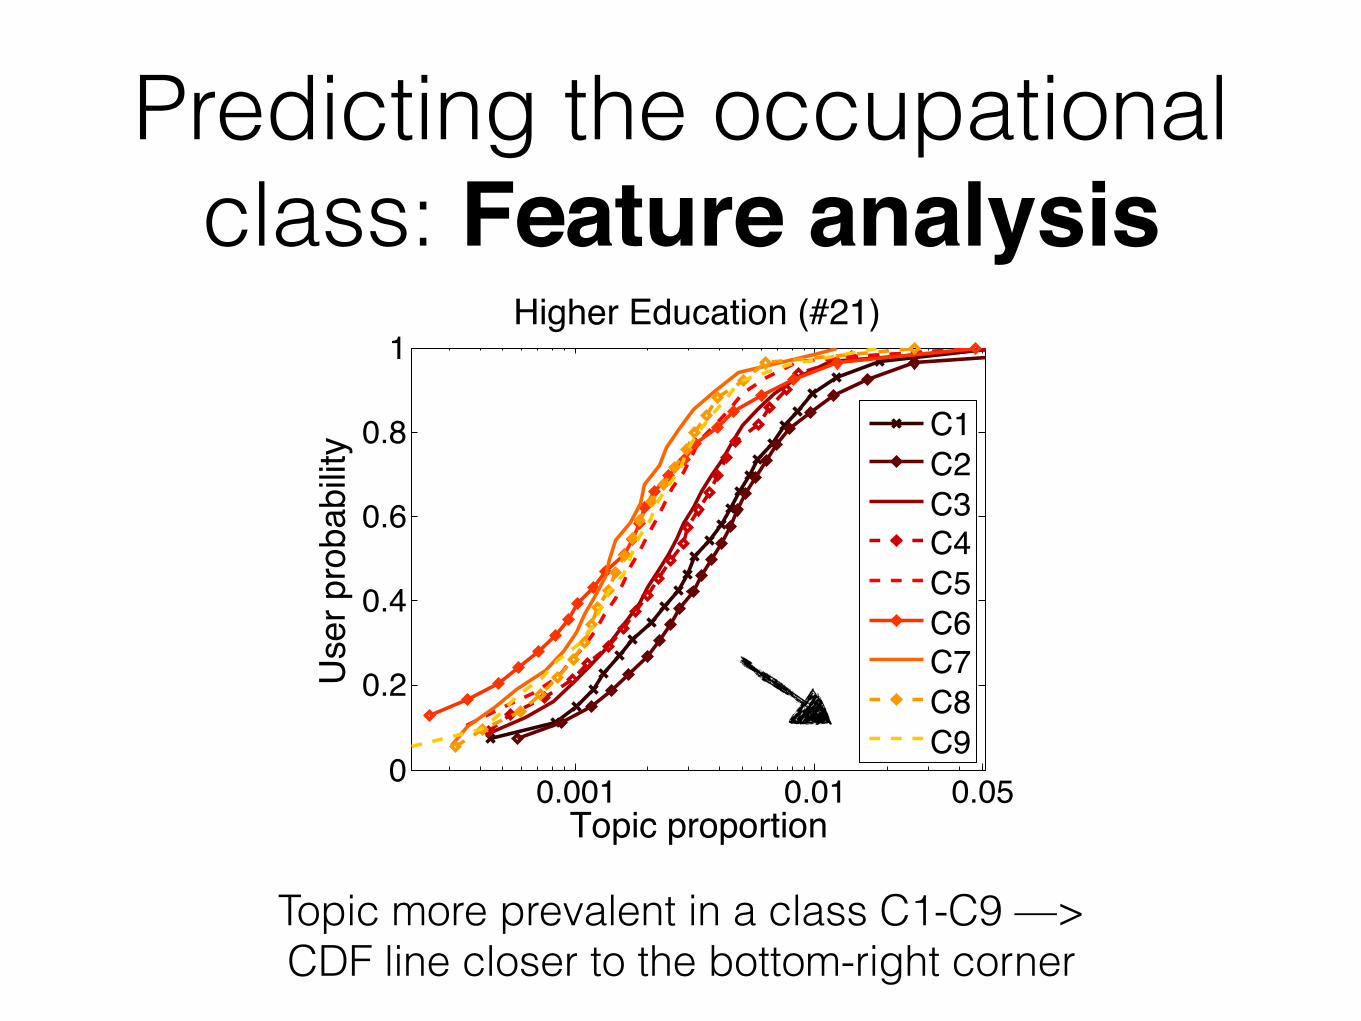
Predicting the occupational class: Feature analysis
0.001 0.01 0.050
0.2
0.4
0.6
0.8
1
Topic proportion
Use
r pro
babi
lity
Higher Education (#21)
C1C2C3C4C5C6C7C8C9
Topic more prevalent in a class C1-C9 —> CDF line closer to the bottom-right corner
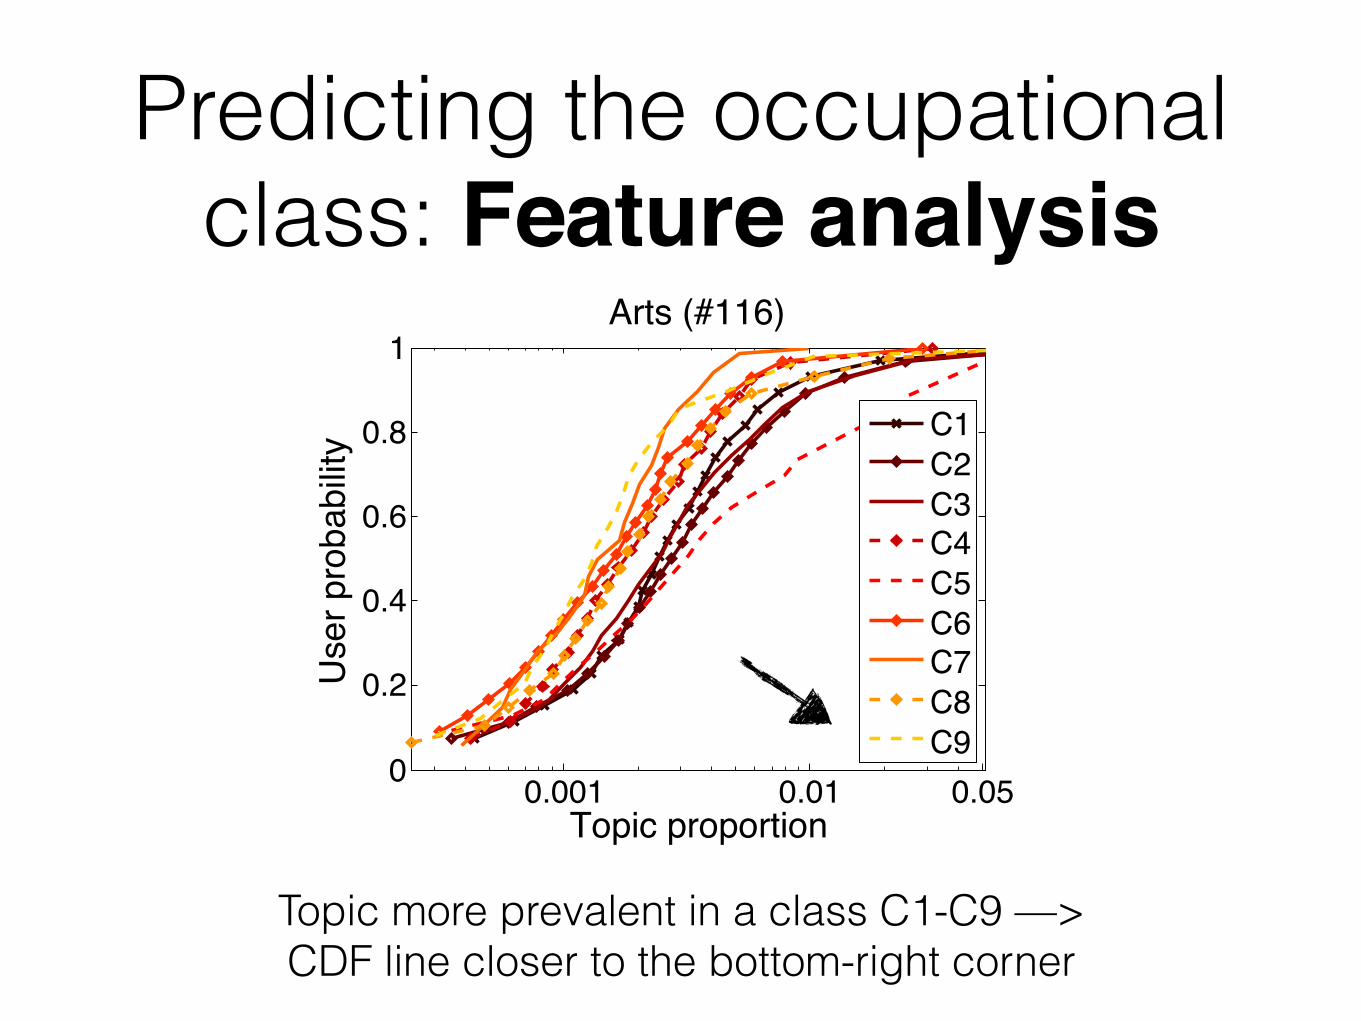
Predicting the occupational class: Feature analysis
0.001 0.01 0.050
0.2
0.4
0.6
0.8
1
Topic proportion
Use
r pro
babi
lity
Arts (#116)
C1C2C3C4C5C6C7C8C9
Topic more prevalent in a class C1-C9 —> CDF line closer to the bottom-right corner
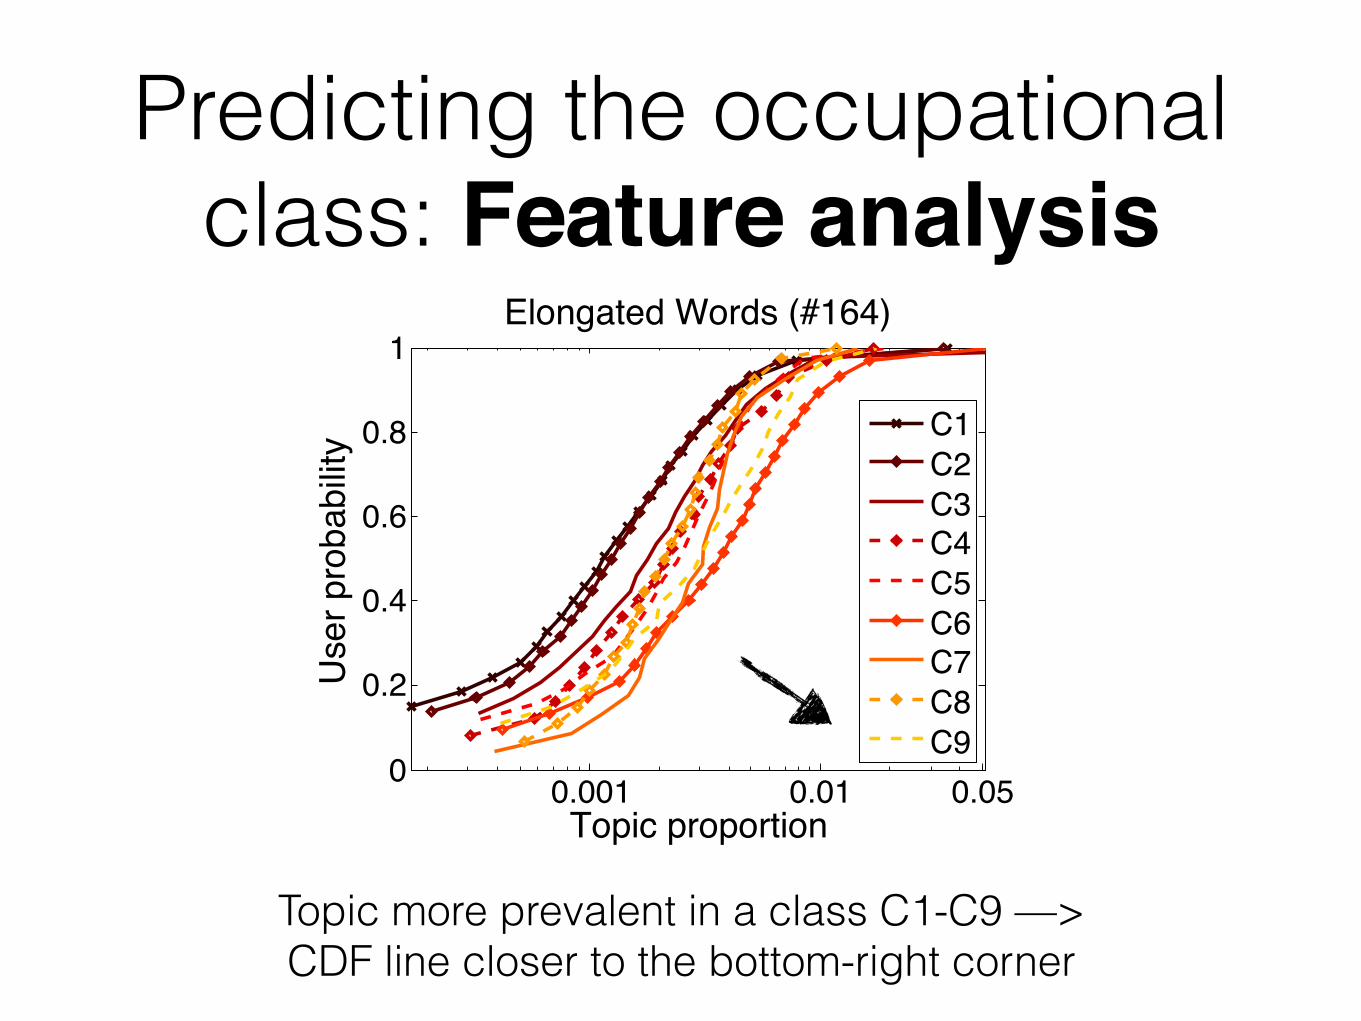
Predicting the occupational class: Feature analysis
0.001 0.01 0.050
0.2
0.4
0.6
0.8
1
Topic proportion
Use
r pro
babi
lity
Elongated Words (#164)
C1C2C3C4C5C6C7C8C9
Topic more prevalent in a class C1-C9 —> CDF line closer to the bottom-right corner
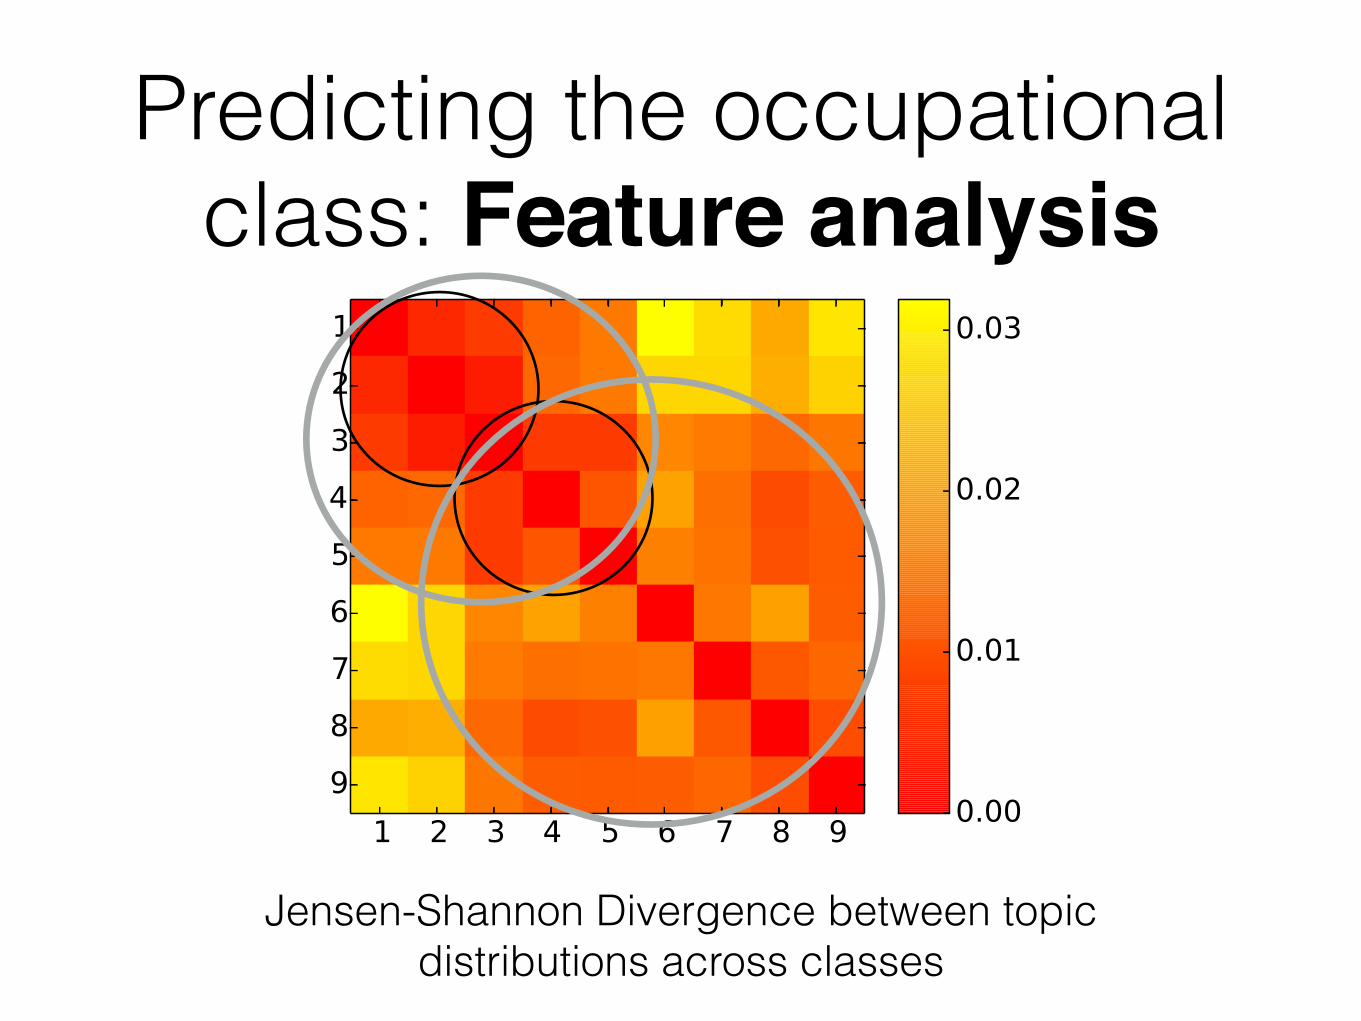
Predicting the occupational class: Feature analysis
Jensen-Shannon Divergence between topic distributions across classes
Predicting the income
Preotiuc-Pietro et al. (2015, PloS ONE)
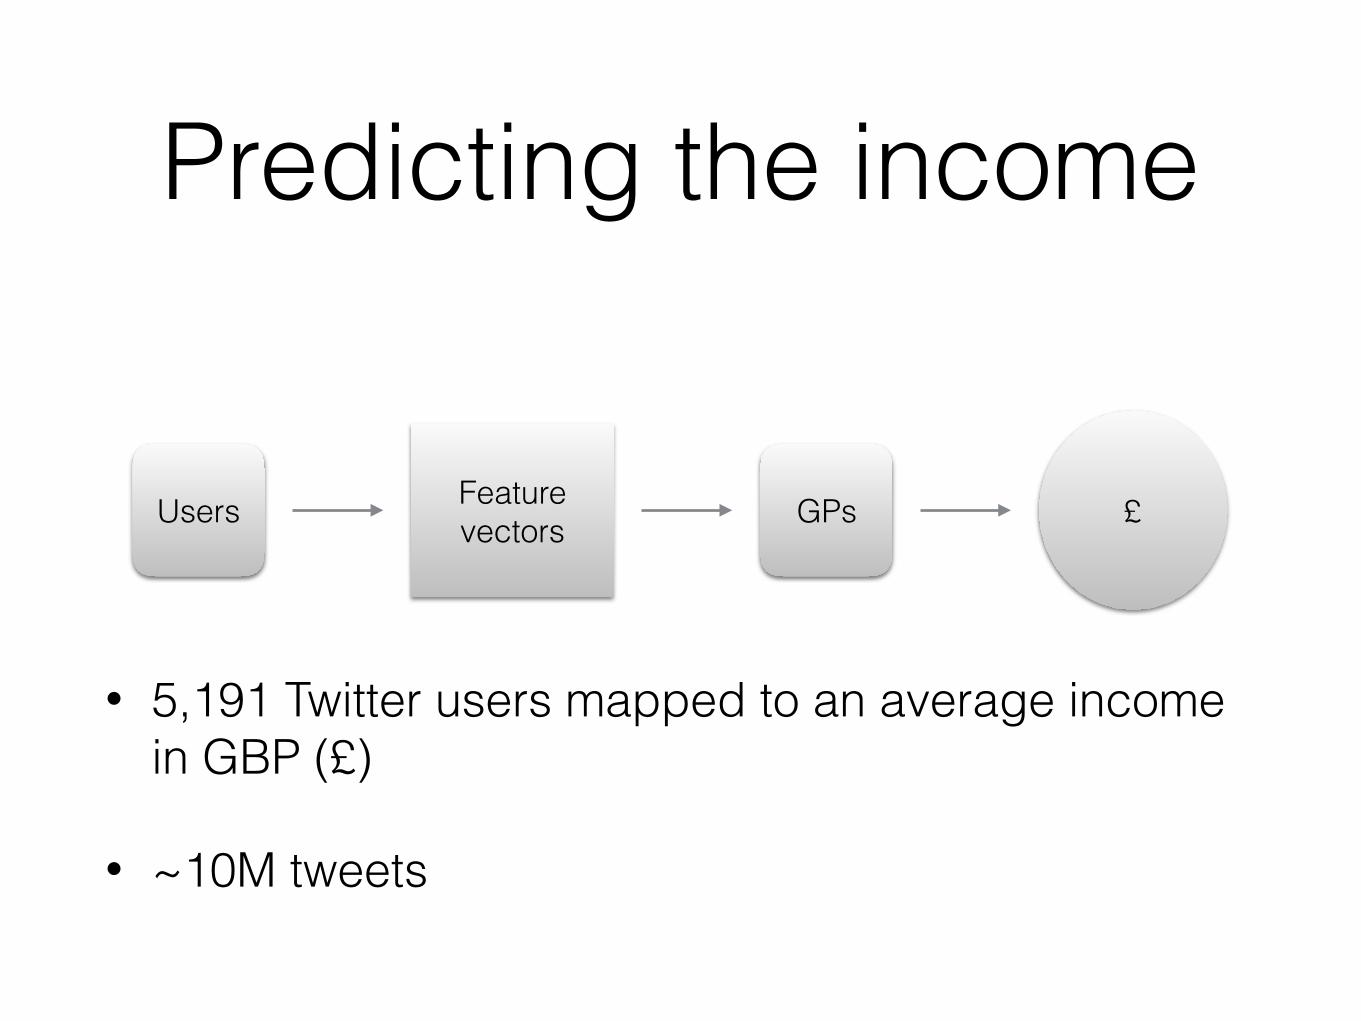
Predicting the income
Users Feature vectors GPs £
• 5,191 Twitter users mapped to an average income in GBP (£)
• ~10M tweets
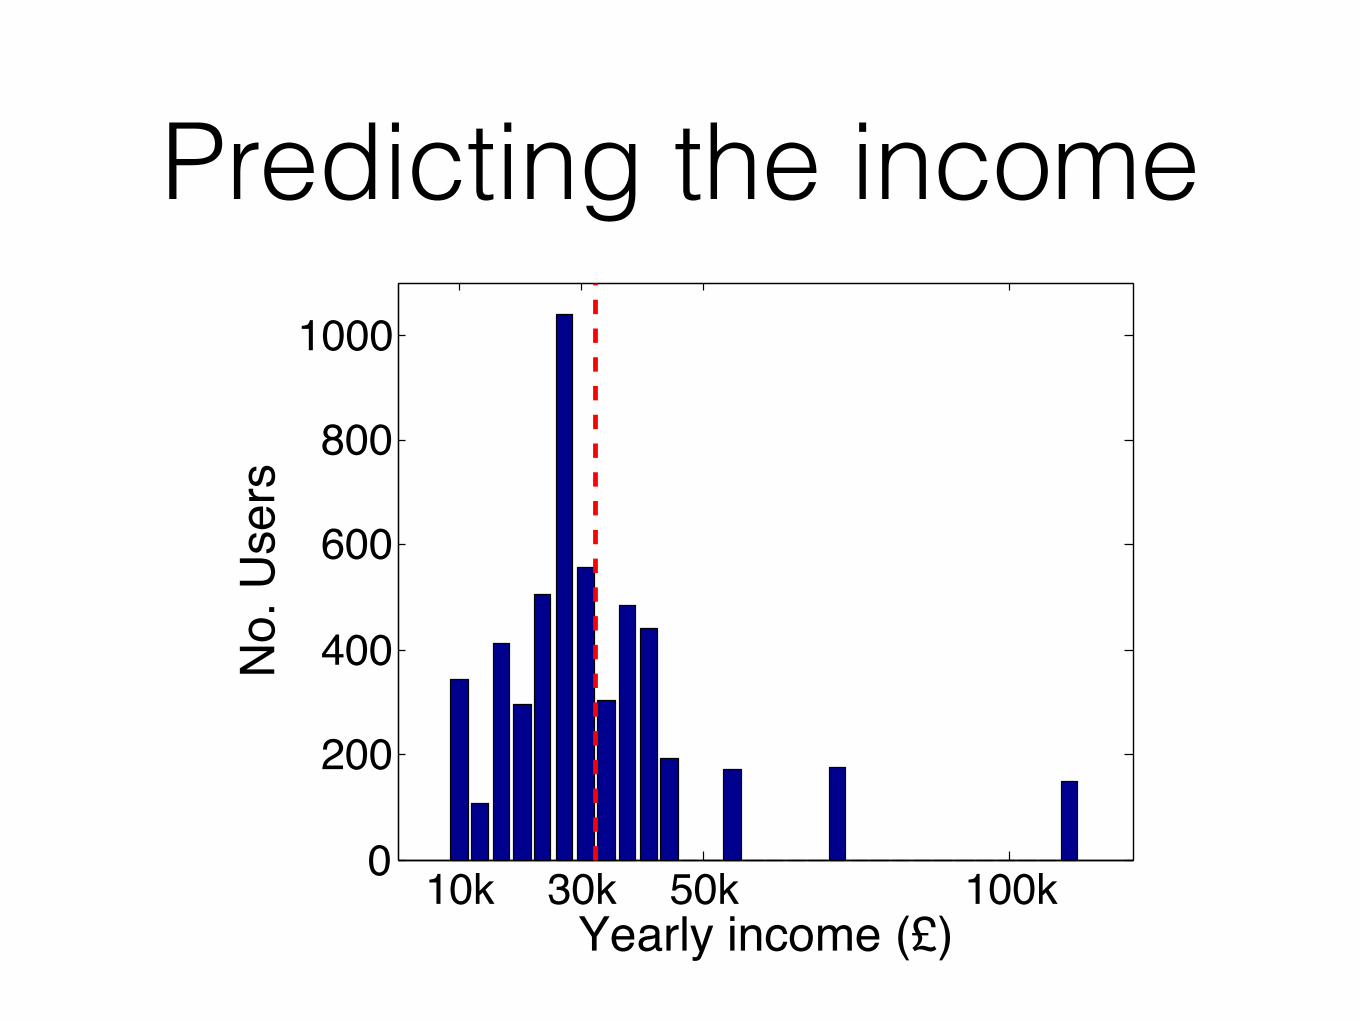
Predicting the income
10k 30k 50k 100k0
200
400
600
800
1000
Yearly income (£)
No.
Use
rs
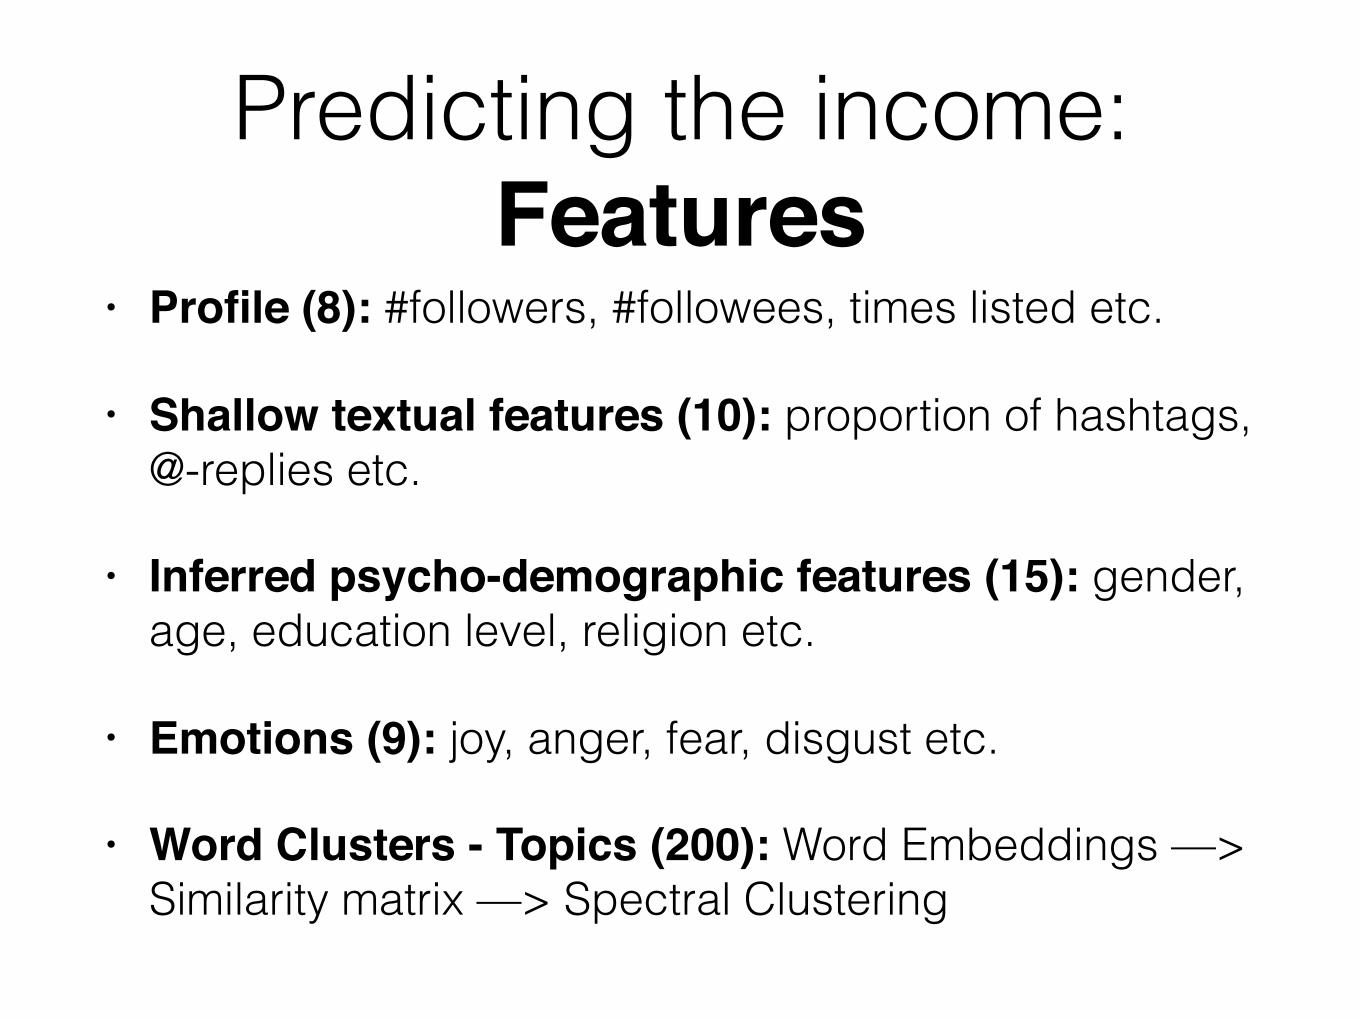
Predicting the income: Features
• Profile (8): #followers, #followees, times listed etc.
• Shallow textual features (10): proportion of hashtags, @-replies etc.
• Inferred psycho-demographic features (15): gender, age, education level, religion etc.
• Emotions (9): joy, anger, fear, disgust etc.
• Word Clusters - Topics (200): Word Embeddings —> Similarity matrix —> Spectral Clustering
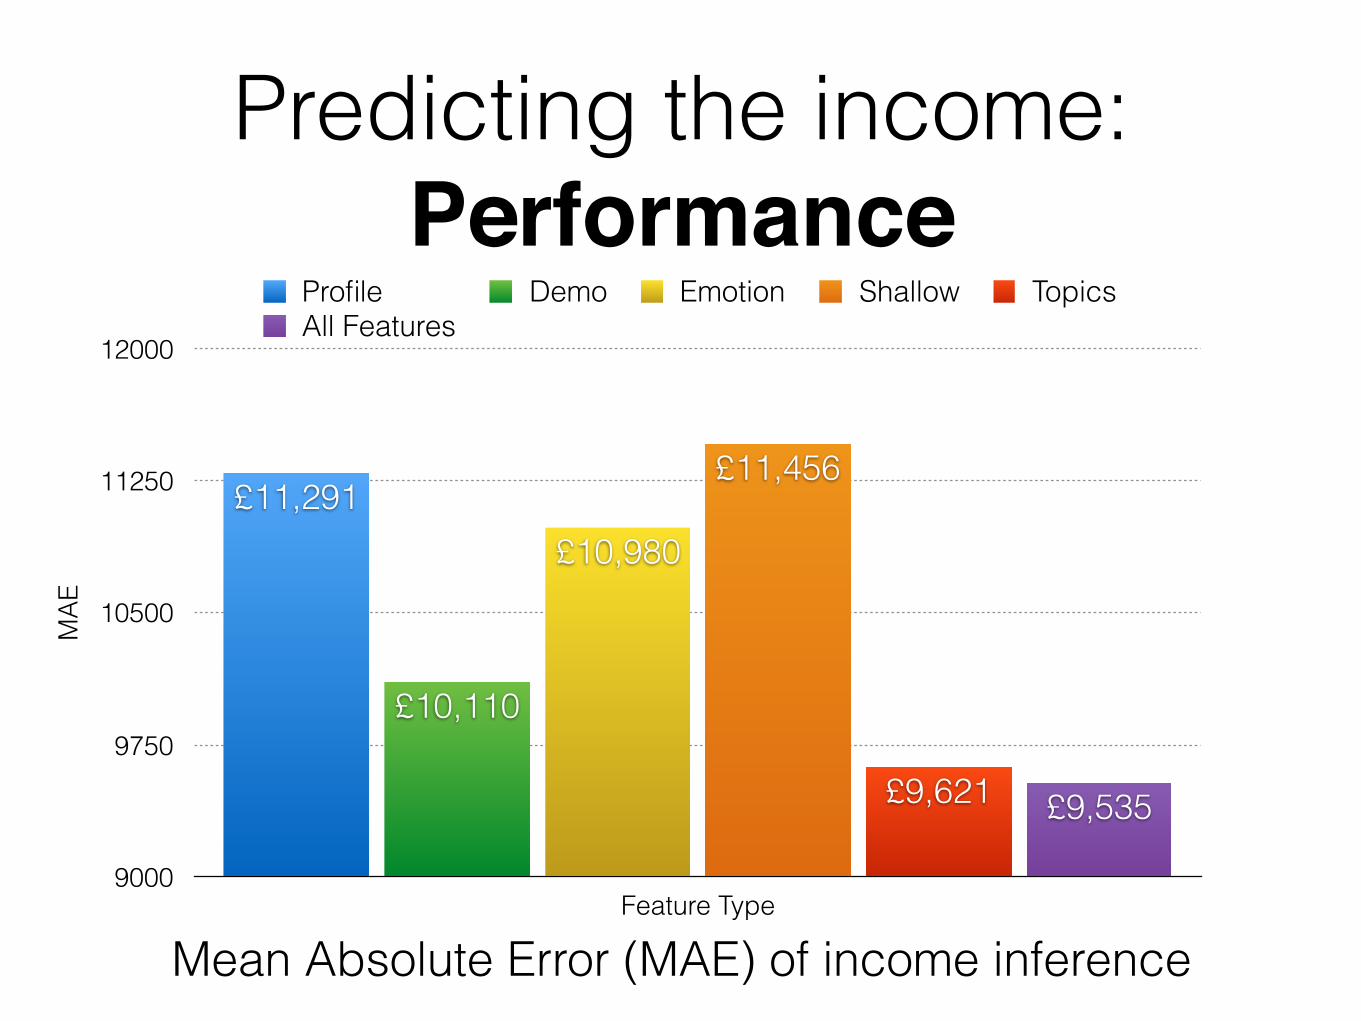
Predicting the income: Performance
MAE
9000
9750
10500
11250
12000
Feature Type
£9,535£9,621
£11,456
£10,980
£10,110
£11,291
Profile Demo Emotion Shallow TopicsAll Features
Mean Absolute Error (MAE) of income inference
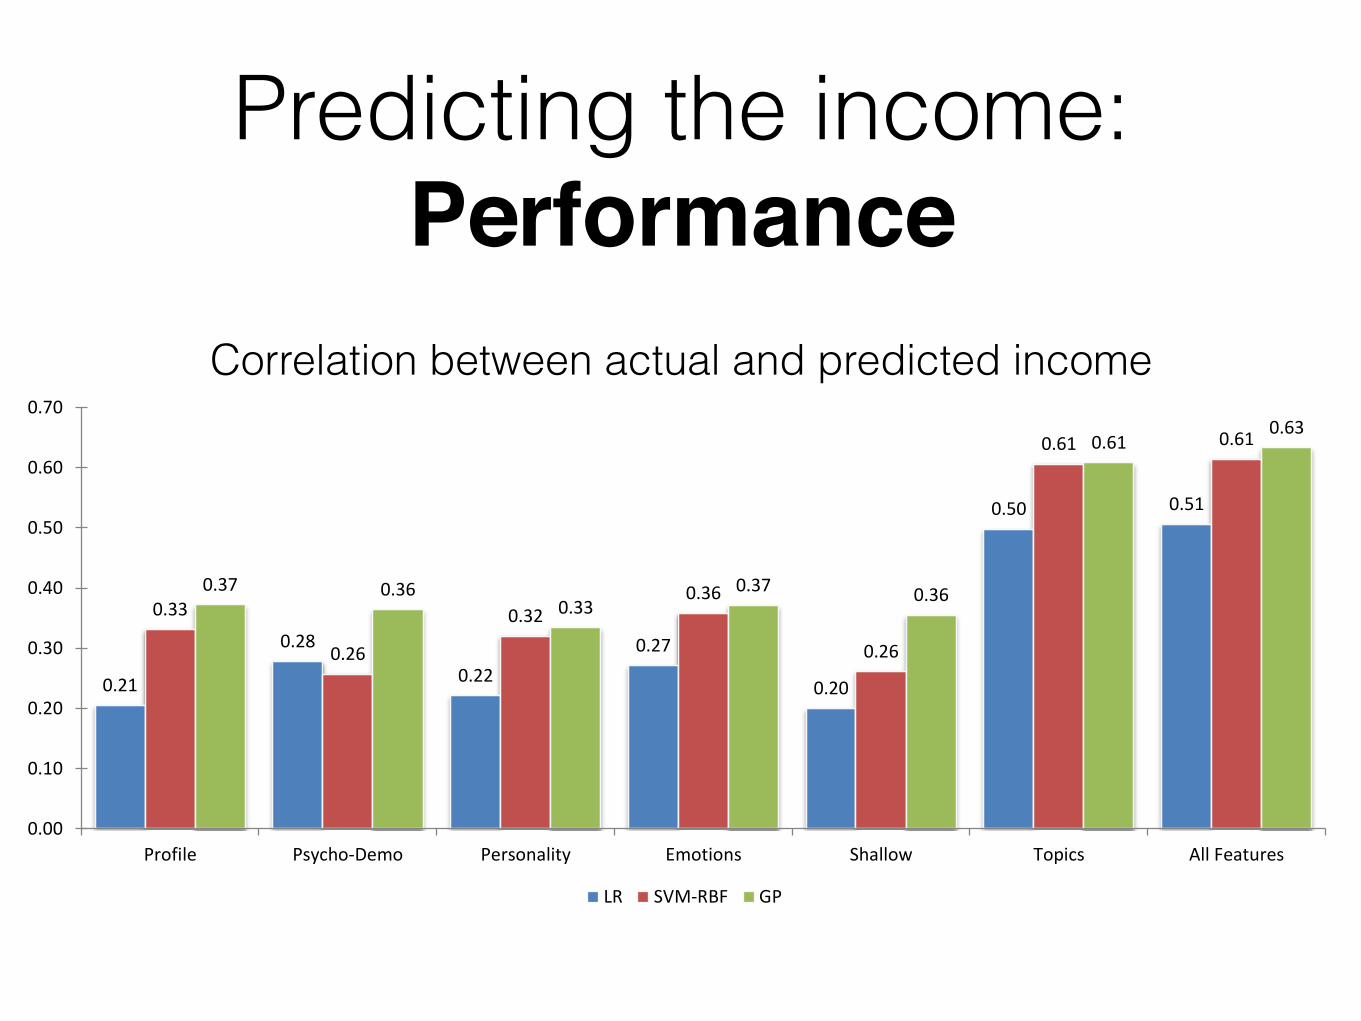
Predicting the income: Performance
0.21
0.28
0.22
0.27
0.20
0.50 0.51
0.33
0.26
0.32 0.36
0.26
0.61 0.61
0.37 0.36 0.33
0.37 0.36
0.61 0.63
0.00
0.10
0.20
0.30
0.40
0.50
0.60
0.70
Profile Psycho-Demo Personality Emotions Shallow Topics All Features
LR SVM-RBF GP
Correlation between actual and predicted income
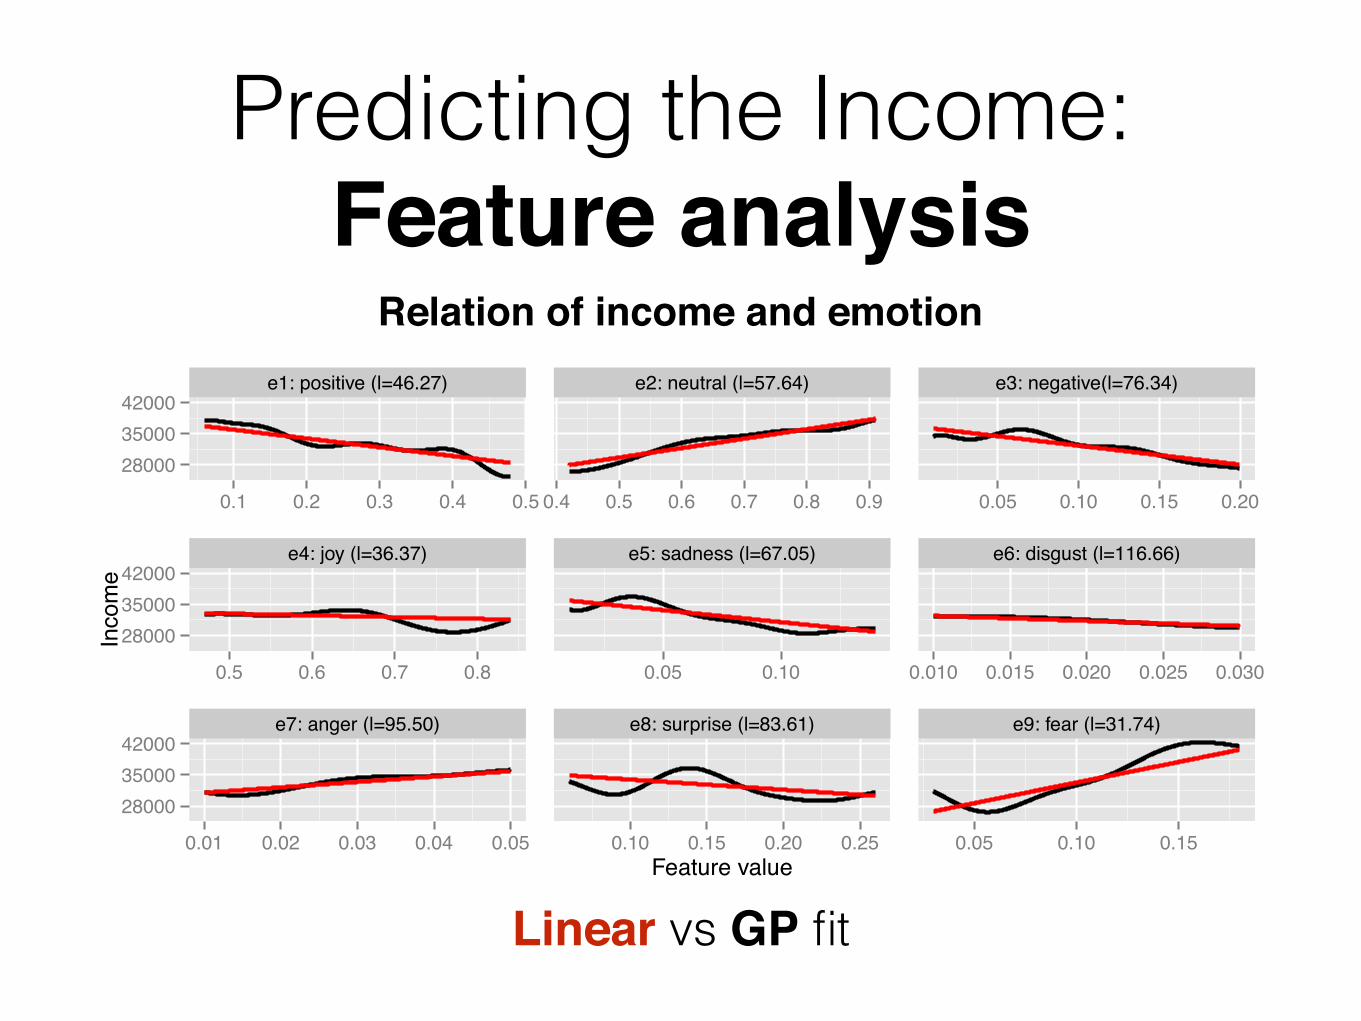
Predicting the Income: Feature analysis
e1: positive (l=46.27) e2: neutral (l=57.64) e3: negative(l=76.34)
e4: joy (l=36.37) e5: sadness (l=67.05) e6: disgust (l=116.66)
e7: anger (l=95.50) e8: surprise (l=83.61) e9: fear (l=31.74)
280003500042000
280003500042000
280003500042000
0.1 0.2 0.3 0.4 0.5 0.4 0.5 0.6 0.7 0.8 0.9 0.05 0.10 0.15 0.20
0.5 0.6 0.7 0.8 0.05 0.10 0.010 0.015 0.020 0.025 0.030
0.01 0.02 0.03 0.04 0.05 0.10 0.15 0.20 0.25 0.05 0.10 0.15Feature value
Inco
me
Linear vs GP fit
Relation of income and emotion
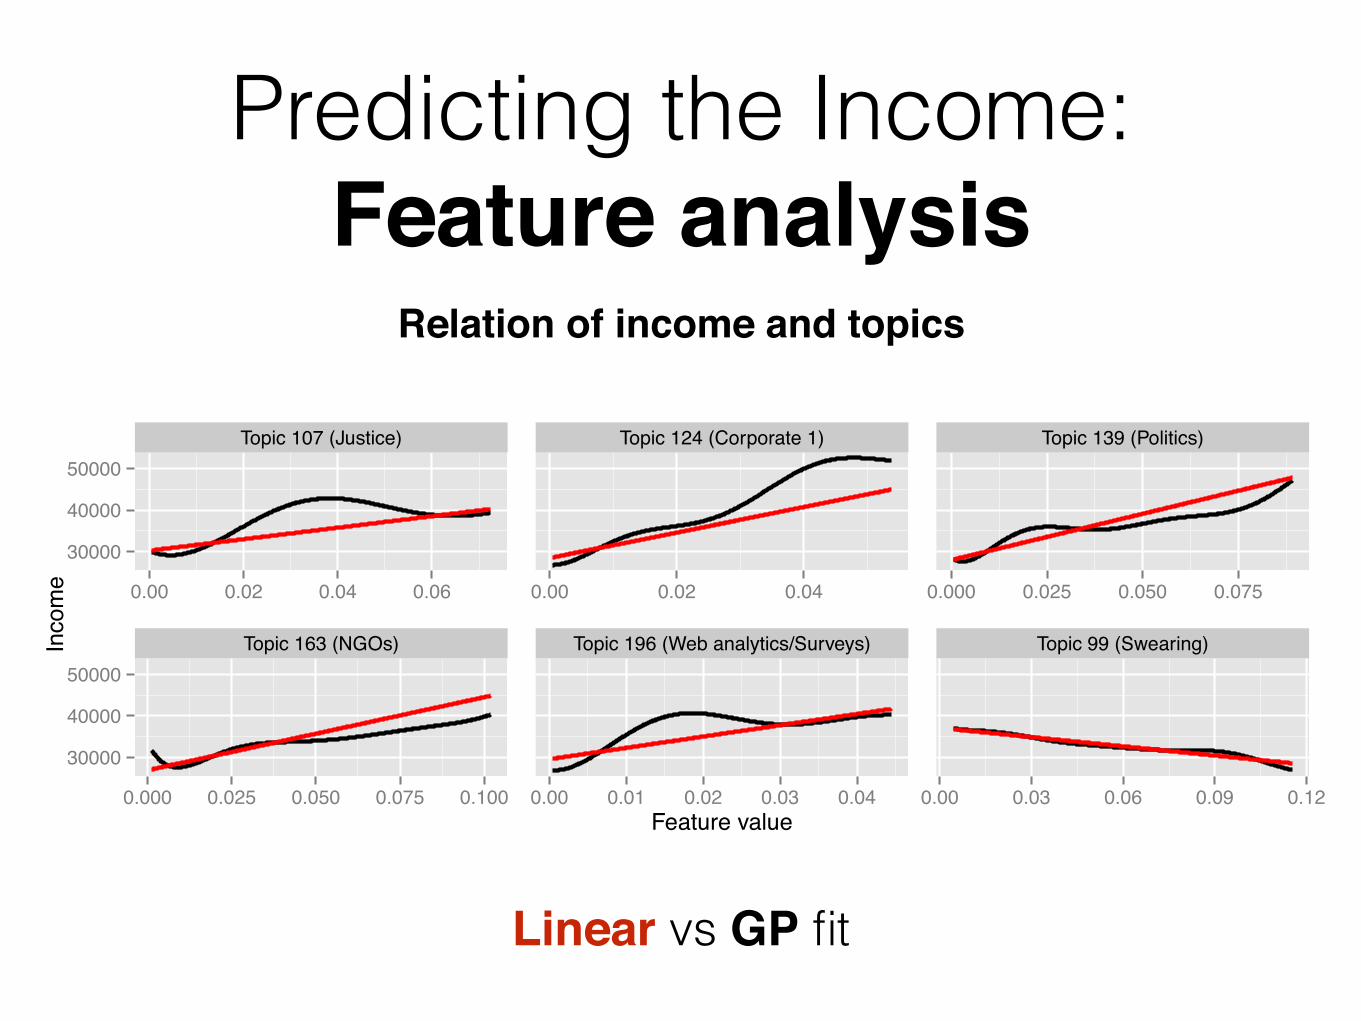
Predicting the Income: Feature analysis
Linear vs GP fit
Topic 107 (Justice) Topic 124 (Corporate 1) Topic 139 (Politics)
Topic 163 (NGOs) Topic 196 (Web analytics/Surveys) Topic 99 (Swearing)
30000
40000
50000
30000
40000
50000
0.00 0.02 0.04 0.06 0.00 0.02 0.04 0.000 0.025 0.050 0.075
0.000 0.025 0.050 0.075 0.100 0.00 0.01 0.02 0.03 0.04 0.00 0.03 0.06 0.09 0.12Feature value
Inco
me
Relation of income and topics
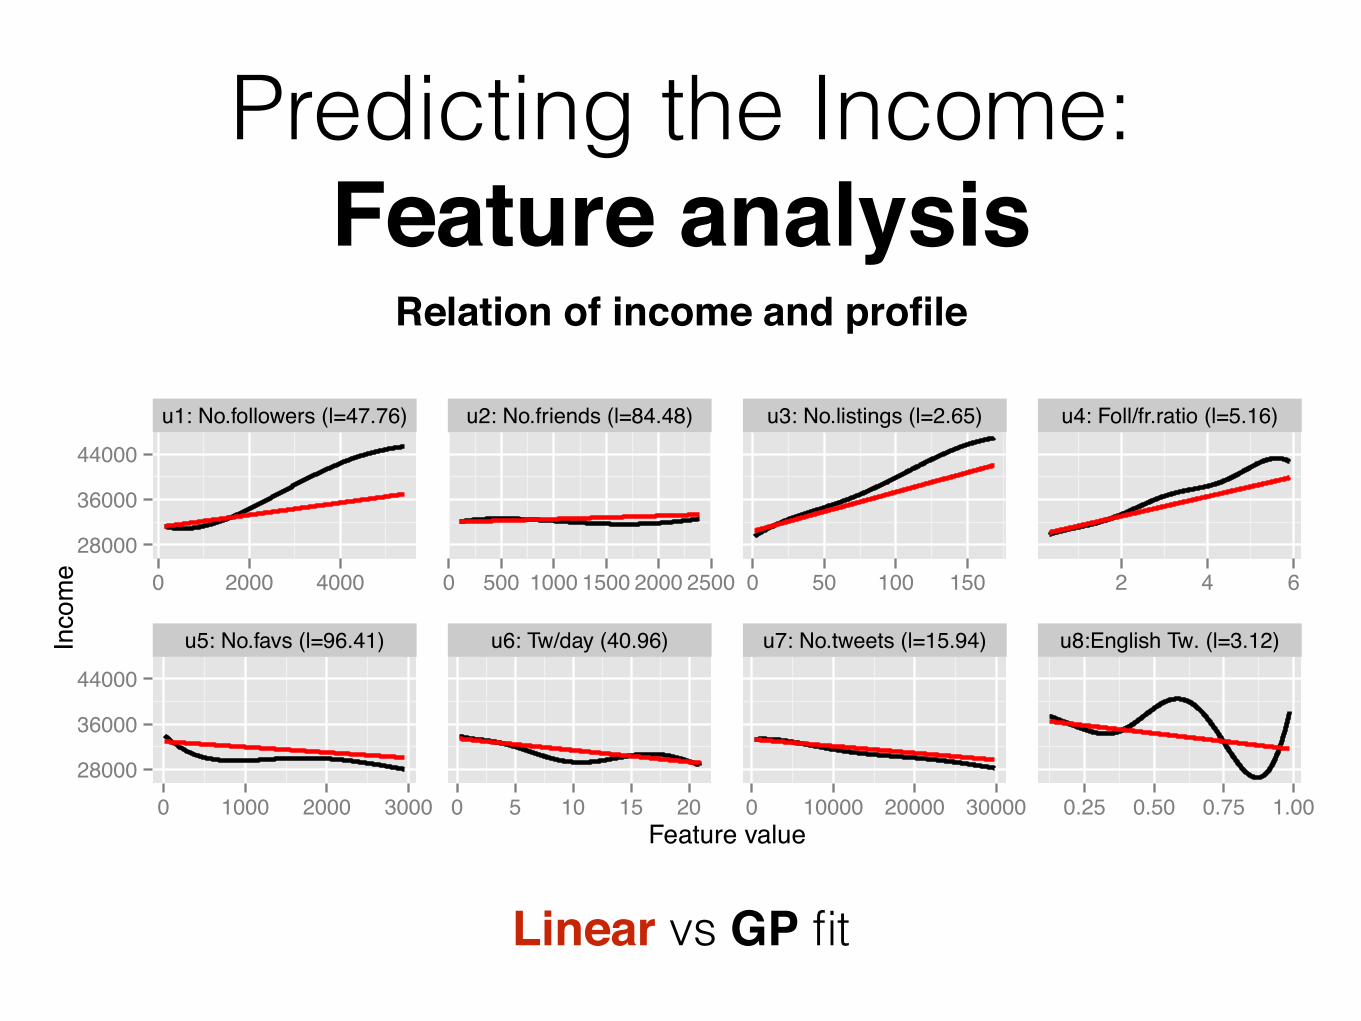
Predicting the Income: Feature analysis
Linear vs GP fit
u1: No.followers (l=47.76) u2: No.friends (l=84.48) u3: No.listings (l=2.65) u4: Foll/fr.ratio (l=5.16)
u5: No.favs (l=96.41) u6: Tw/day (40.96) u7: No.tweets (l=15.94) u8:English Tw. (l=3.12)
28000
36000
44000
28000
36000
44000
0 2000 4000 0 500 1000 1500 2000 2500 0 50 100 150 2 4 6
0 1000 2000 3000 0 5 10 15 20 0 10000 20000 30000 0.25 0.50 0.75 1.00Feature value
Inco
me
Relation of income and profile
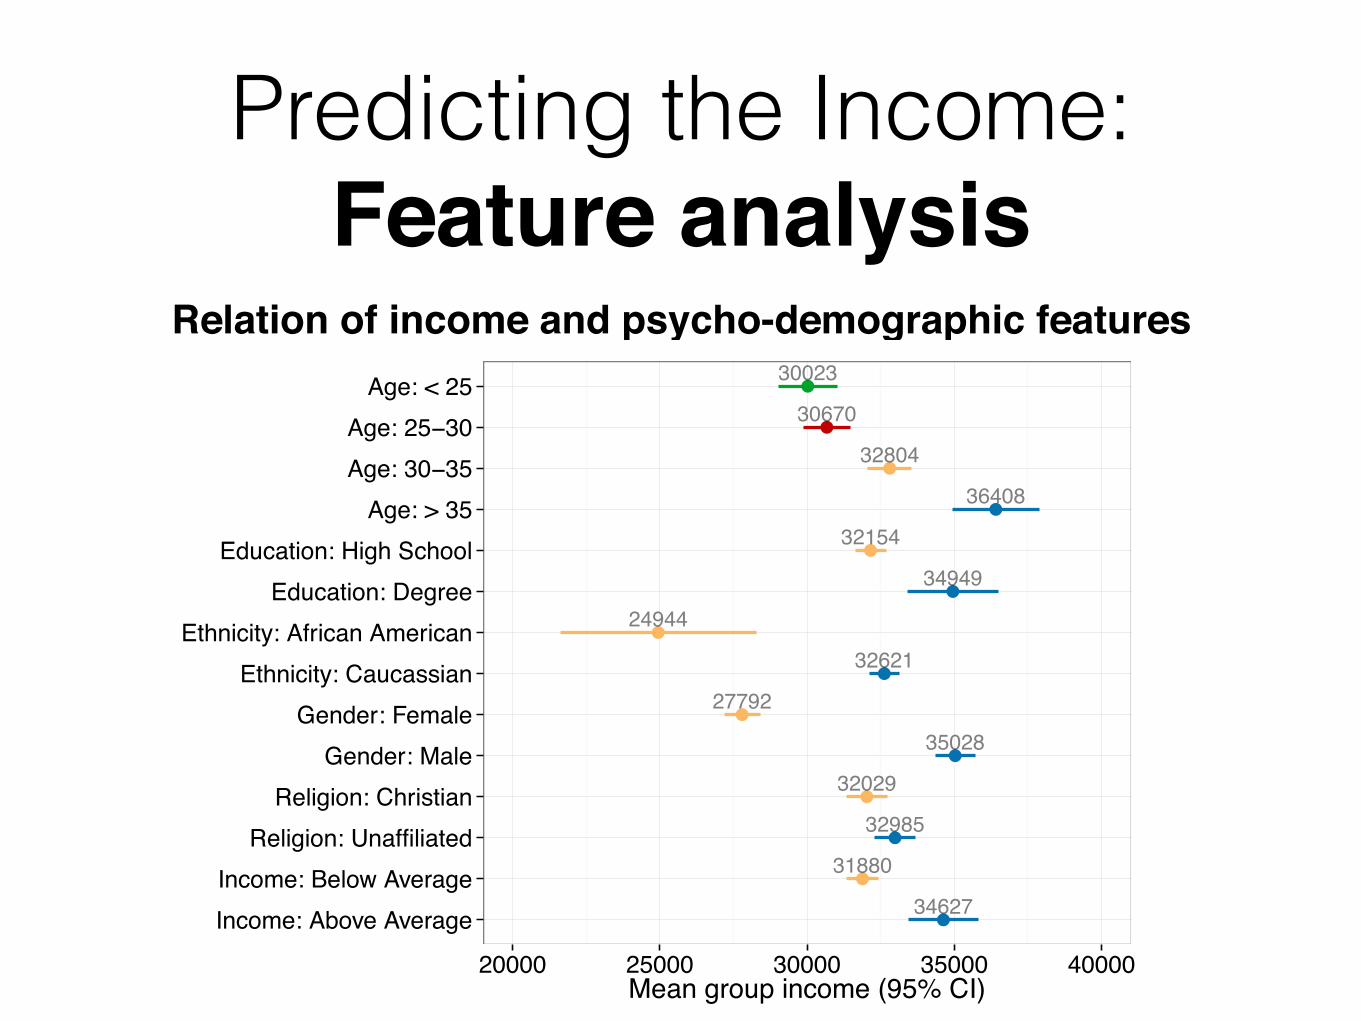
Predicting the Income: Feature analysis
Relation of income and psycho-demographic features
●
●
●
●
●
●
●
●
●
●
●
●
●
●30023
36408
30670
32804
34949
32154
24944
32621
27792
35028
31880
34627
32029
32985
Income: Above AverageIncome: Below Average
Religion: UnaffiliatedReligion: Christian
Gender: MaleGender: Female
Ethnicity: CaucassianEthnicity: African American
Education: DegreeEducation: High School
Age: > 35Age: 30−35Age: 25−30
Age: < 25
20000 25000 30000 35000 40000Mean group income (95% CI)
Predicting the socioeconomic class
Lampos et al. (2016, ECIR)
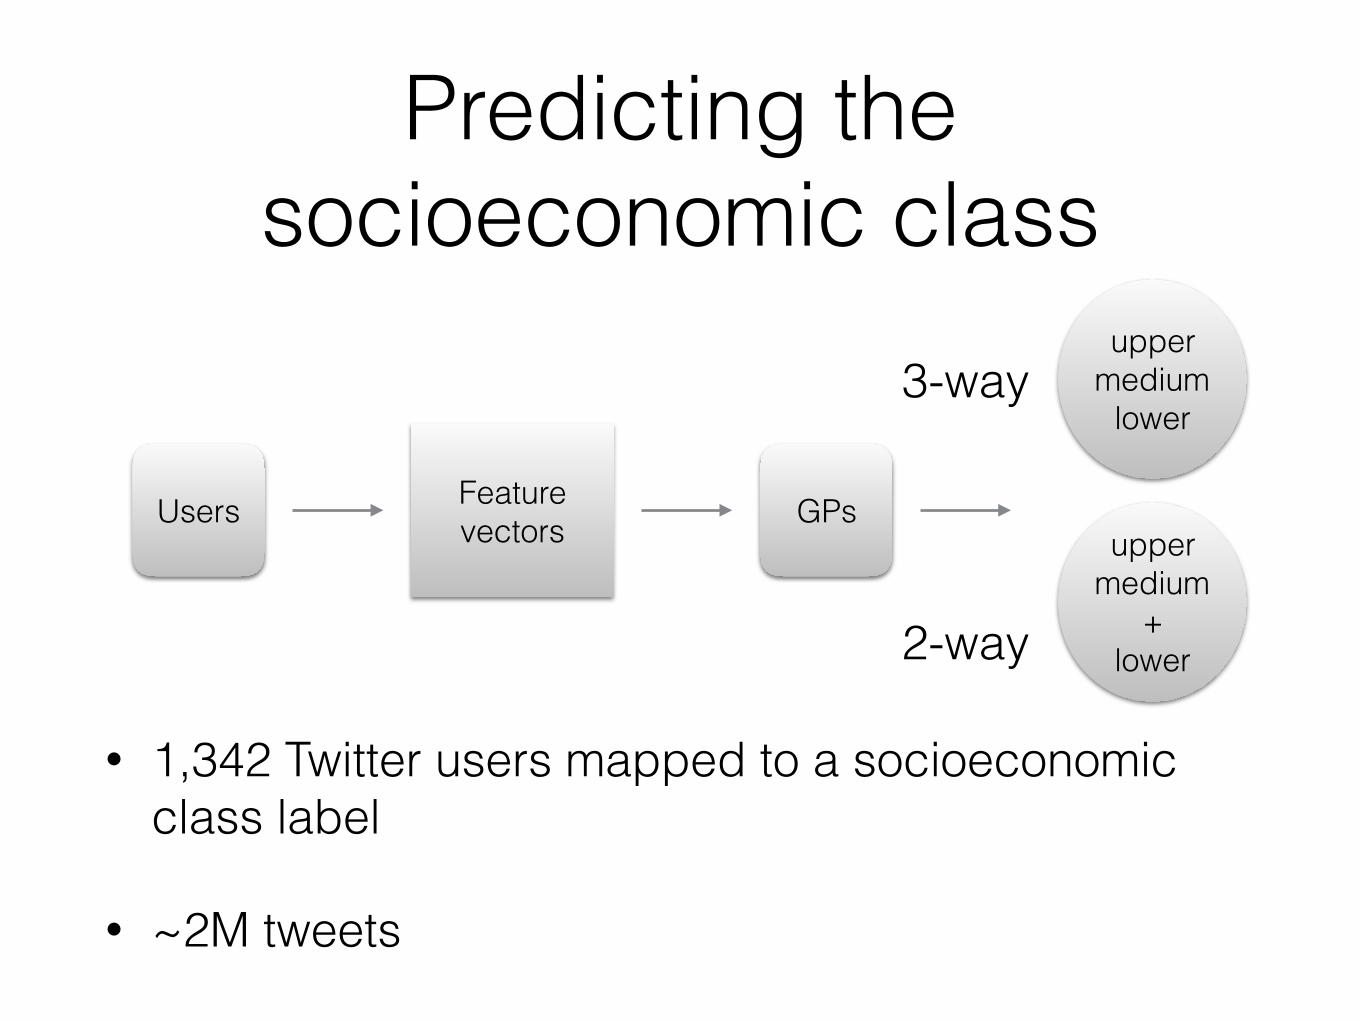
Predicting the socioeconomic class
Users Feature vectors GPs
upper medium
lower
• 1,342 Twitter users mapped to a socioeconomic class label
• ~2M tweets
upper medium
+ lower
3-way
2-way
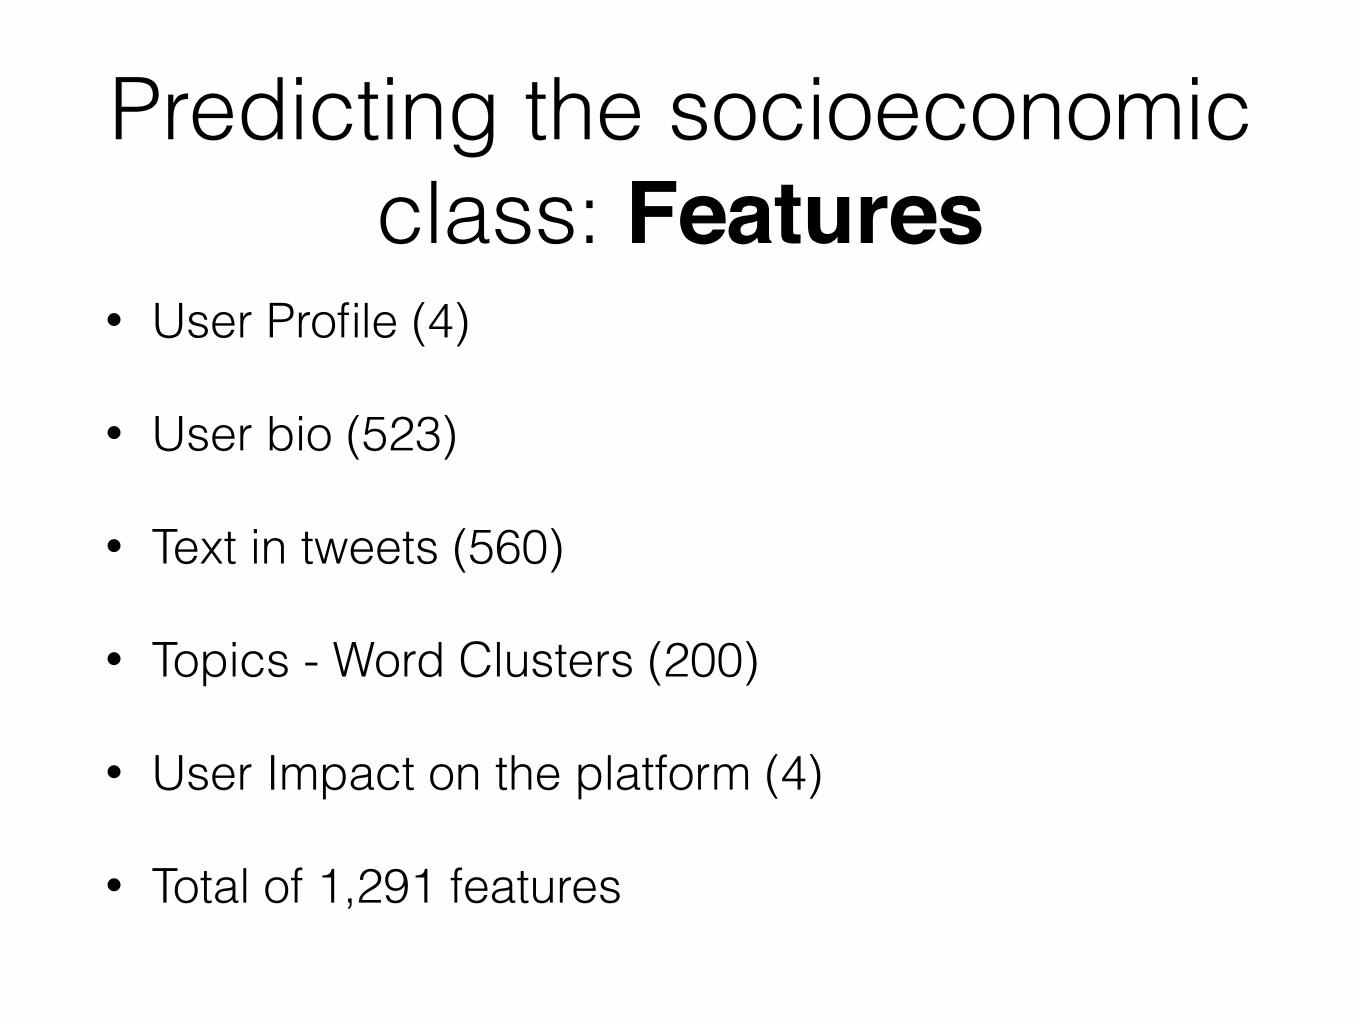
Predicting the socioeconomic class: Features
• User Profile (4)
• User bio (523)
• Text in tweets (560)
• Topics - Word Clusters (200)
• User Impact on the platform (4)
• Total of 1,291 features
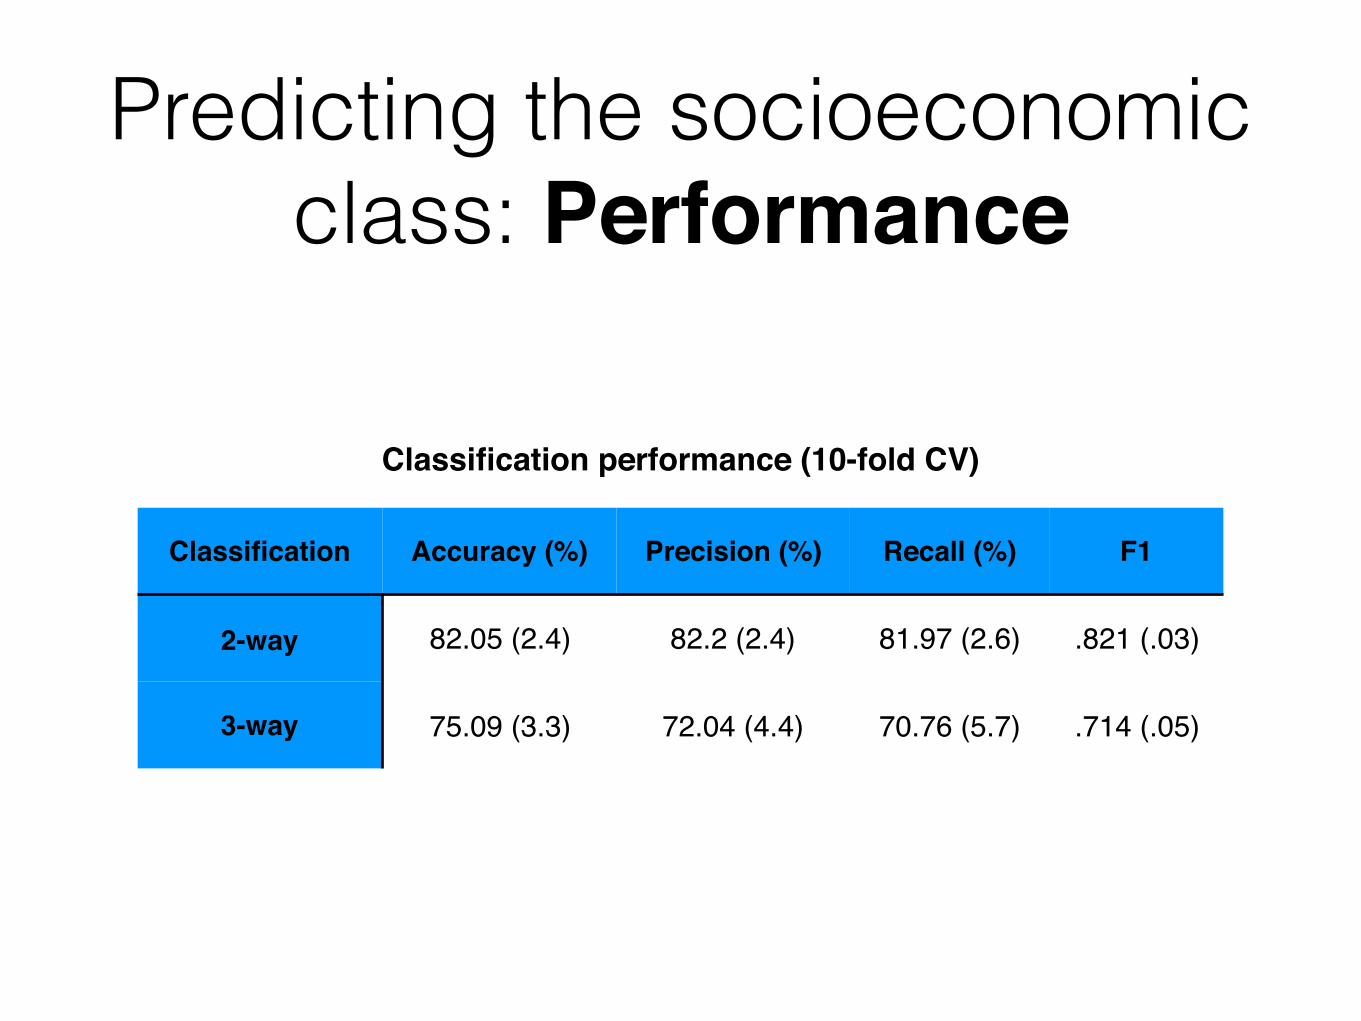
Predicting the socioeconomic class: Performance
Classification Accuracy (%) Precision (%) Recall (%) F1
2-way 82.05 (2.4) 82.2 (2.4) 81.97 (2.6) .821 (.03)
3-way 75.09 (3.3) 72.04 (4.4) 70.76 (5.7) .714 (.05)
Classification performance (10-fold CV)
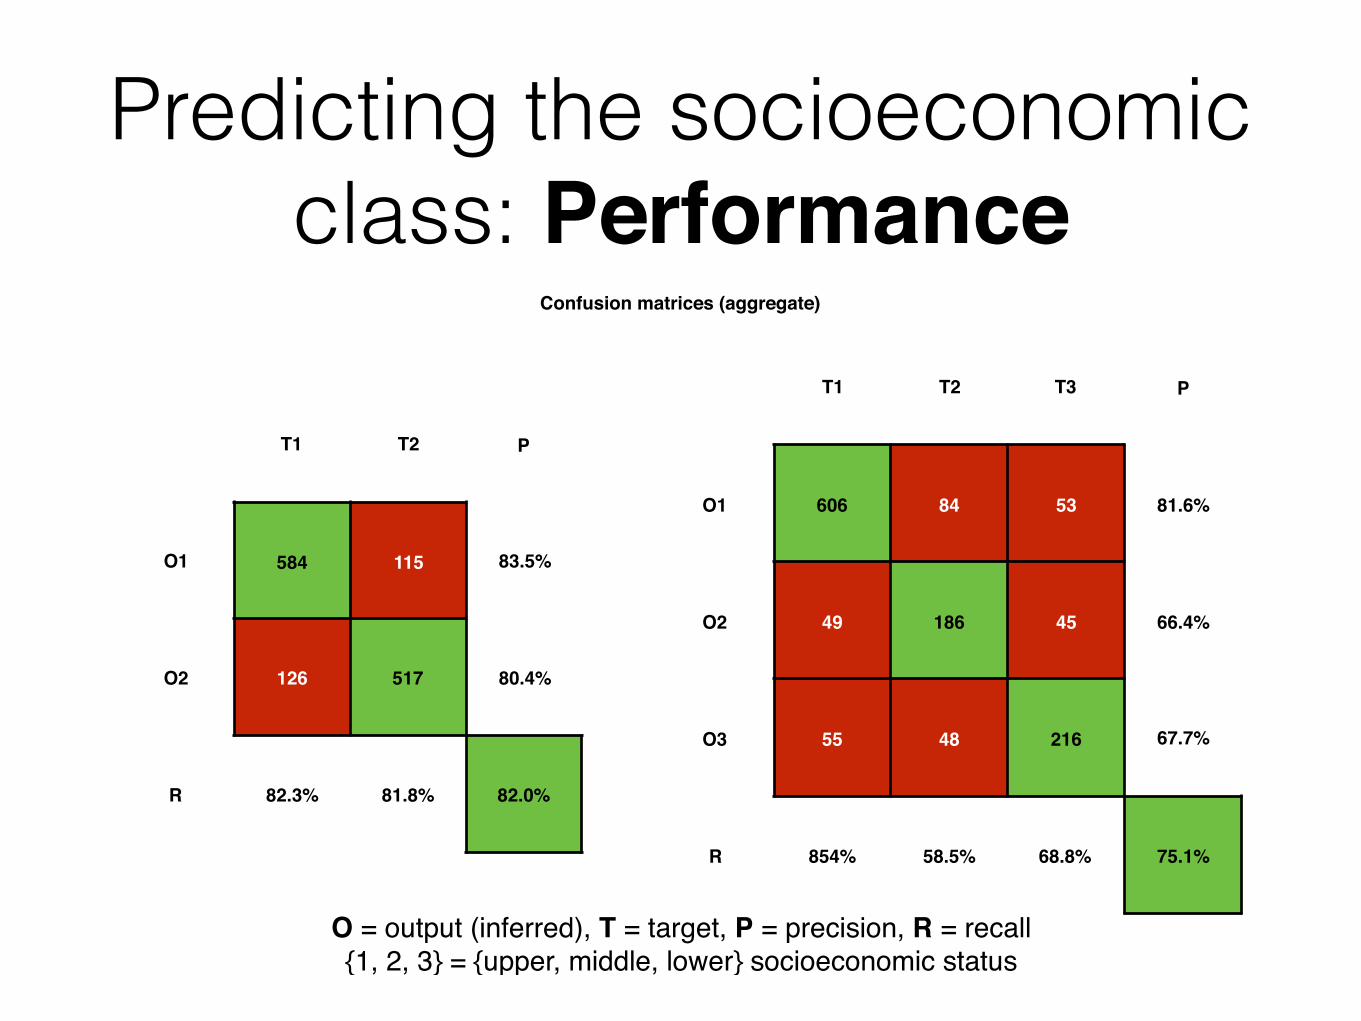
Predicting the socioeconomic class: Performance
T1 T2 P
O1 584 115 83.5%
O2 126 517 80.4%
R 82.3% 81.8% 82.0%
T1 T2 T3 P
O1 606 84 53 81.6%
O2 49 186 45 66.4%
O3 55 48 216 67.7%
R 854% 58.5% 68.8% 75.1%
Confusion matrices (aggregate)
O = output (inferred), T = target, P = precision, R = recall{1, 2, 3} = {upper, middle, lower} socioeconomic status
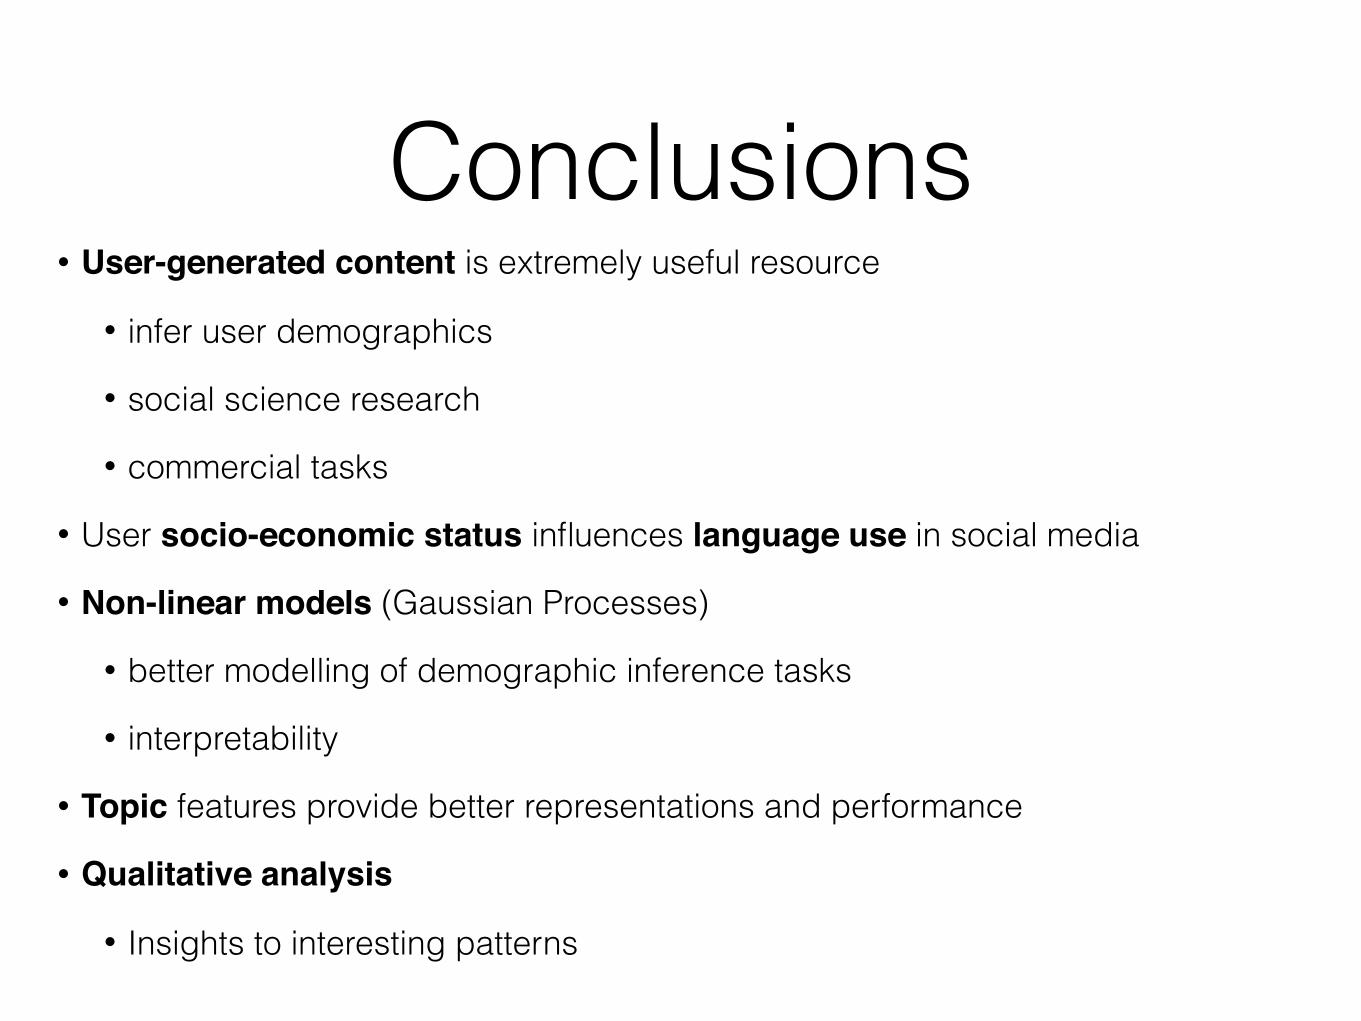
Conclusions• User-generated content is extremely useful resource
• infer user demographics
• social science research
• commercial tasks
• User socio-economic status influences language use in social media
• Non-linear models (Gaussian Processes)
• better modelling of demographic inference tasks
• interpretability
• Topic features provide better representations and performance
• Qualitative analysis
• Insights to interesting patterns
AcknowledgementsDaniel Preotiuc-Pietro……………………………………..UPenn
Vasileios Lampos……………………………………………..UCL
Ingemar J. Cox…………………….UCL & Uni. of Copenhagen
Jens K. Geyti………………………………………………….UCL
Bin Zou……..………………………………………………….UCL
Svitlana Volkova……………………………………………..PNNL
Yoram Bachrach…………………………….Microsoft Research
PublicationsD. Preoţiuc-Pietro, V. Lampos and N. Aletras (2015). An Analysis of the User Occupational Class through Twitter Content. In ACL.
D. Preoţiuc-Pietro, S. Volkova, V. Lampos, Y. Bachrach, N. Aletras (2015). Studying User Income through Language, Behaviour and Affect in Social Media. PLOS ONE.
V. Lampos, N. Aletras, J. K. Geyti, B. Zou, I. J. Cox (2016). Inferring the Socioeconomic Status of Social Media Users based on Behaviour and Language. In ECIR.

Thank you Questions?