I ALTRUISTIC PUNISHMENT IN FACT ALTRUISTIC AN EXPERIMENTAL APPROACH
predicting the success of altruistic requestsSentiment analysis and machine learning approach
Author: Emanuele Pesce
Supervisor: Prof. Sabrina Senatore
Aprile 2015
University of Salerno, department of computer science
0
outline
Introduction
Sentiment analysis
The problem: Random Act Of PizzaMachine learning and sentiment extraction
Machine learning approach
Dataset and features
Sentiment extractionSentiment compression
Success frequency rate
Classification modelsResultsConclusions and future works
1

introduction
sentiment analysis: what is it?
What is sentiment analysis (also known as opinion mining)?
∙ The task of identifying positive, negative and neutral opinions andemotions expressed in natural language
∙ It uses techniques like natural language processing, text analysis,statistics, machine learning and others
3
sentiment analysis: polarity
What is it?
∙ Given a text discover how people feel reading it
∙ Determinate if the text contains emotional states such as ”angry” or ”happy”
∙ So, the polarity of a text can be:
∙ positive∙ negative∙ neutral
An example
∙ I love this movie, but I hate the director
∙ The sentence above is composed by:
∙ I love this movie, that has a positive score of polarity∙ I hate the director, that has a negative score of polarity
∙ So it’s correct to say that the sentence, in its entirety, has a neutral polarity
4

sentiment analysis: domains
Often Sentiment Analysis is used in:
∙ Social media monitoring∙ Voice of costumers to track customer reviews∙ Survey response∙ Business analytics∙ Every situation in which text needs to be analyzed
5
predicting altruism through free pizza: the competition
∙ Predicting altruism through free pizza is a challenge launched byTim Althoff et all. on Kaggle
∙ Kaggle is a website which hosts competitions about machinelearning and computer science in generally
∙ The competition is based on Random Act Of Pizza
The Random Act of Pizza: what is it?∙ It is a Reddit forum community, where users can make requests forfree pizza
∙ For example: ”I’ll write a poem, sing a song, do a dance, play aninstrument, whatever! I just want a pizza”
∙ If someone buys a pizza to the requester, the request would beconsidered successful, if not that would be unsuccessful.
6

predicting altruism through free pizza: inputs and goals
Input
∙ The competition contains a dataset of textual requests for pizzafrom the Reddit community Random Act Of Pizza
∙ For each sample of the dataset there are many informationsconcerning both the request and the requester
Goal
∙ Given a post (or request), the goal is to predict if it will besuccessful or unsuccessful
7
machine learning and sentimentextraction
machine learning approach
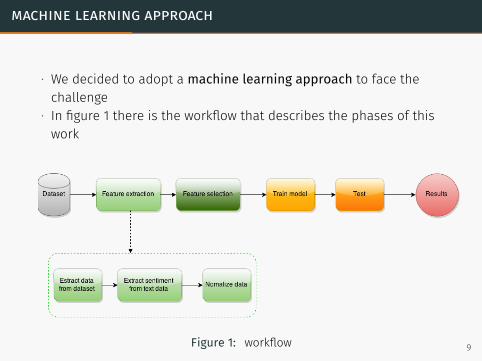
∙ We decided to adopt a machine learning approach to face thechallenge
∙ In figure 1 there is the workflow that describes the phases of thiswork
Figure 1: workflow 9

dataset and features description
∙ The dataset contains 5671 textual requests for pizza∙ Each sample of the dataset contains several informations:∙ about the text of the content and the title of the request∙ about the post of the request (number of comments, number of likes,etc..)
∙ about user who did the request (age, publication date, etc..)∙ a field that says if the request has been satisfying (pizza bought) or not(So we have been using supervised learning algorithms)
∙ The dataset was in json format. We have been using Python toextract information.
10
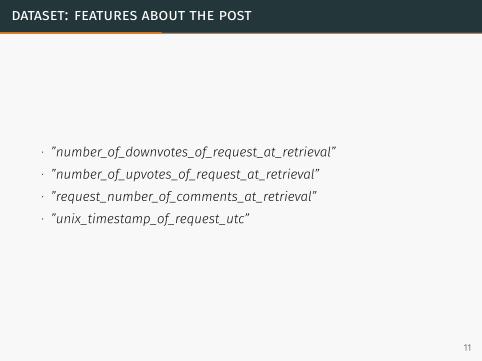
dataset: features about the post
∙ ”number_of_downvotes_of_request_at_retrieval”∙ ”number_of_upvotes_of_request_at_retrieval”∙ ”request_number_of_comments_at_retrieval”∙ ”unix_timestamp_of_request_utc”
11
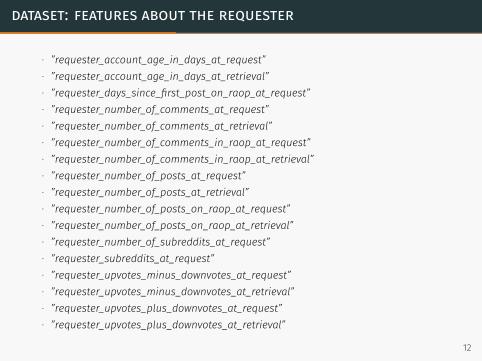
dataset: features about the requester
∙ ”requester_account_age_in_days_at_request”∙ ”requester_account_age_in_days_at_retrieval”∙ ”requester_days_since_first_post_on_raop_at_request”∙ ”requester_number_of_comments_at_request”∙ ”requester_number_of_comments_at_retrieval”∙ ”requester_number_of_comments_in_raop_at_request”∙ ”requester_number_of_comments_in_raop_at_retrieval”∙ ”requester_number_of_posts_at_request”∙ ”requester_number_of_posts_at_retrieval”∙ ”requester_number_of_posts_on_raop_at_request”∙ ”requester_number_of_posts_on_raop_at_retrieval”∙ ”requester_number_of_subreddits_at_request”∙ ”requester_subreddits_at_request”∙ ”requester_upvotes_minus_downvotes_at_request”∙ ”requester_upvotes_minus_downvotes_at_retrieval”∙ ”requester_upvotes_plus_downvotes_at_request”∙ ”requester_upvotes_plus_downvotes_at_retrieval”
12
extracting information from title and text of requests
Texual features
∙ For each request the most important fields are textual: title andrequest
∙ The features in the previous slides were almost all in numericformat
∙ They can be used for computation, after an easy properpreprocessing phase
∙ Different story for textual features..
Goal
Convert the textual features in numeric features, that containssentiment information, suitable to be given in input to a machinelearning algorithm
13
dataset 2d visualization
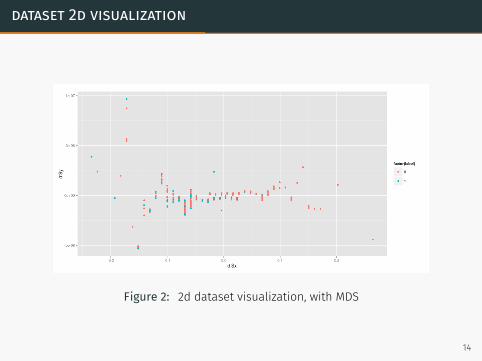
Figure 2: 2d dataset visualization, with MDS
14
dataset 3d visualization
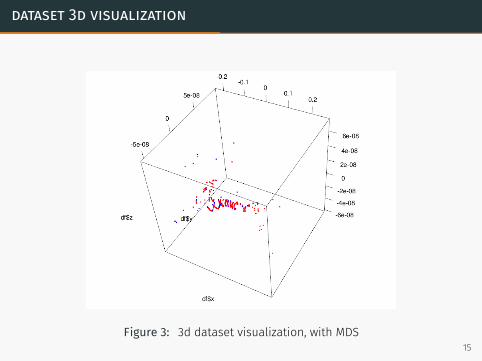
Figure 3: 3d dataset visualization, with MDS15
sentiment extraction from text
Textual features
∙ Text of the request∙ Title of the request
To convert the text to computable features, we have been calculatingtwo measures:
∙ Sentiment compression: it is concerning the sentiment of the text
∙ Success frequency rate: it is concerning the rate of success of thetext
16
sentiment compression: ntlk polarity
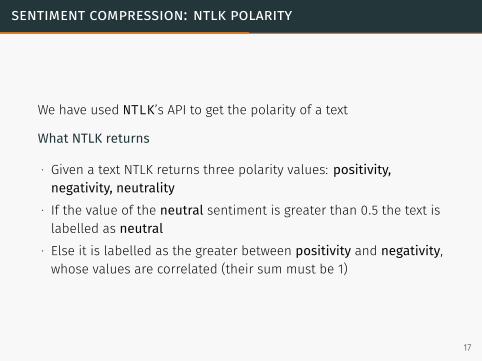
We have used NTLK’s API to get the polarity of a text
What NTLK returns
∙ Given a text NTLK returns three polarity values: positivity,negativity, neutrality
∙ If the value of the neutral sentiment is greater than 0.5 the text islabelled as neutral
∙ Else it is labelled as the greater between positivity and negativity,whose values are correlated (their sum must be 1)
17

sentiment compression: sclabel
∙ We have been compressing the three values taken by NTLK in aunique value
∙ Let pPos and pNeu be the NTLK values associated (respectively) tothe positive and negative sentiment
SClabel = pPos · sign(0.5− pNeu) (1)
∙ where sign function is so defined:
sign(x) ={−1 if x ≤ 0,1 if x > 0.
∙ A unique value keeps the information about the positivity and thepolarity
18
sentiment compression: an example
A SClabel of -0.7 means that:
∙ it is neutral: because the sign is negative∙ its positivity is 0.7 (so the negativity is 0.3)
19
success frequency rate
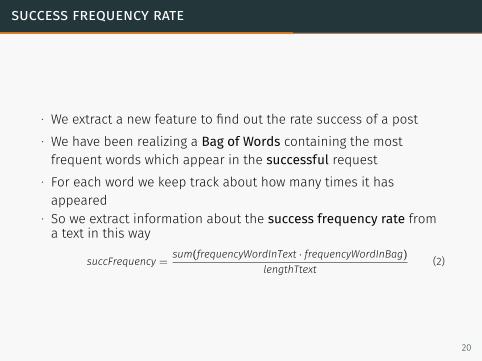
∙ We extract a new feature to find out the rate success of a post∙ We have been realizing a Bag of Words containing the mostfrequent words which appear in the successful request
∙ For each word we keep track about how many times it hasappeared
∙ So we extract information about the success frequency rate froma text in this way
succFrequency =sum(frequencyWordInText · frequencyWordInBag)
lengthTtext(2)
20
success frequency rate: an example
Given the text home sweet home, the success frequency rate is socalculated:
succFrequency =(2 ∗ frequencyWordInBag(home) + 1 ∗ frequencyWordInBag(sweet)
3
21
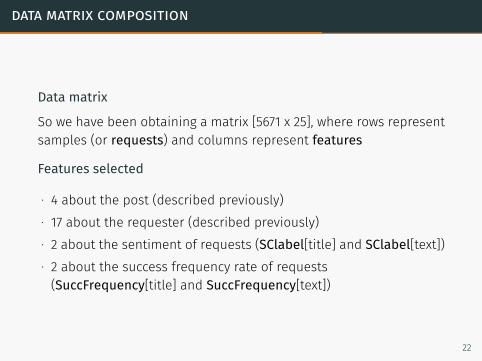
data matrix composition
Data matrix
So we have been obtaining a matrix [5671 x 25], where rows representsamples (or requests) and columns represent features
Features selected
∙ 4 about the post (described previously)∙ 17 about the requester (described previously)∙ 2 about the sentiment of requests (SClabel[title] and SClabel[text])∙ 2 about the success frequency rate of requests(SuccFrequency[title] and SuccFrequency[text])
22

preprocessing
Normalization
For standardizing the range the features values we have been usingthe following formula:
Xnew =X− µ
σ(3)
where X is a column of the data matrix, µ is the mean and σ is thestandard deviation
Outliers
∙ We consider as outliers values which differ 5· standard deviationfrom the mean
∙ We have been removing those values
23
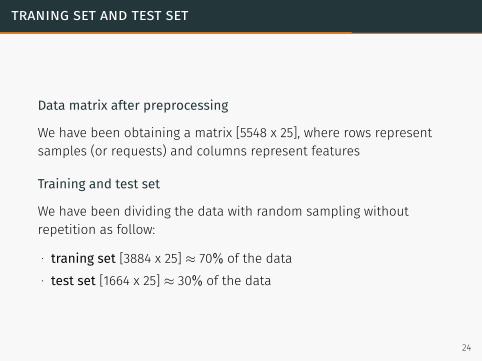
traning set and test set
Data matrix after preprocessing
We have been obtaining a matrix [5548 x 25], where rows representsamples (or requests) and columns represent features
Training and test set
We have been dividing the data with random sampling withoutrepetition as follow:
∙ traning set [3884 x 25] ≈ 70% of the data∙ test set [1664 x 25] ≈ 30% of the data
24
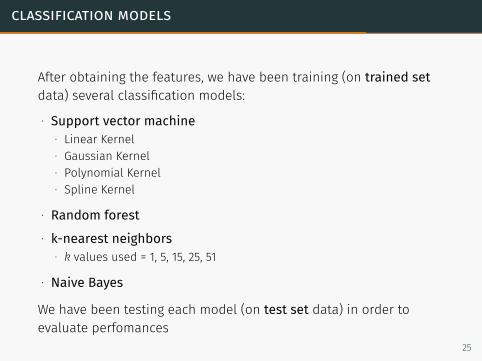
classification models
After obtaining the features, we have been training (on trained setdata) several classification models:
∙ Support vector machine∙ Linear Kernel∙ Gaussian Kernel∙ Polynomial Kernel∙ Spline Kernel
∙ Random forest
∙ k-nearest neighbors∙ k values used = 1, 5, 15, 25, 51
∙ Naive Bayes
We have been testing each model (on test set data) in order toevaluate perfomances
25
results
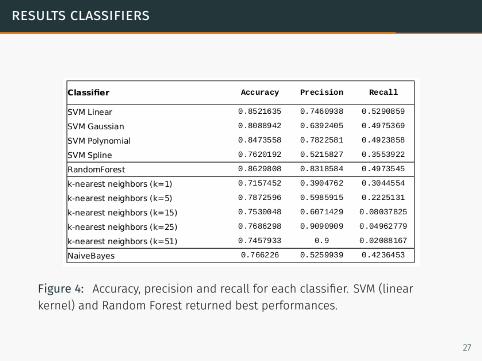
results classifiers
Figure 4: Accuracy, precision and recall for each classifier. SVM (linearkernel) and Random Forest returned best performances.
27

accuracy
Figure 5: Accuracy of classifiers. Best performances were obtained fromRandom Forest and SVM (linear kernel)
28

precision
Figure 6: Precision of classifiers. Best performances were obtained fromRandom Forest and SVM (linear kernel)
29
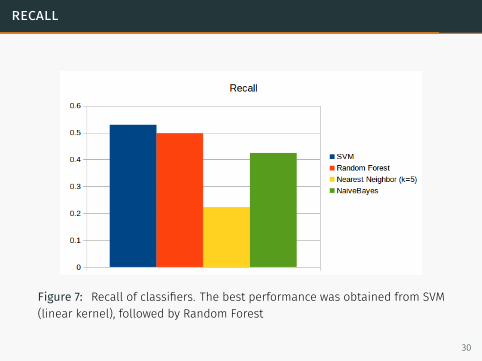
recall
Figure 7: Recall of classifiers. The best performance was obtained from SVM(linear kernel), followed by Random Forest
30

conclusions and future works
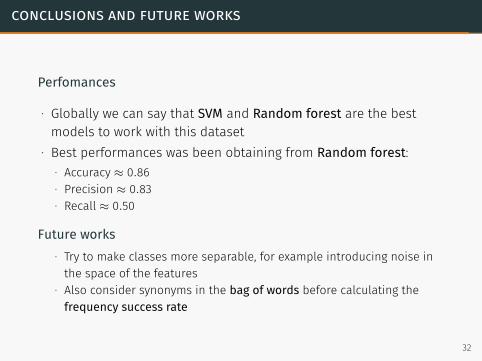
conclusions and future works
Perfomances
∙ Globally we can say that SVM and Random forest are the bestmodels to work with this dataset
∙ Best performances was been obtaining from Random forest:∙ Accuracy ≈ 0.86∙ Precision ≈ 0.83∙ Recall ≈ 0.50
Future works∙ Try to make classes more separable, for example introducing noise inthe space of the features
∙ Also consider synonyms in the bag of words before calculating thefrequency success rate
32

Thank you for your attention!
33


![Assessing Potential Altruistic [Non-Directed] Living Organ Donors](https://static.fdocuments.in/doc/165x107/546278deaf7959b92a8b5fb6/assessing-potential-altruistic-non-directed-living-organ-donors.jpg)