Predicting the AQHI without aid of observations: results from the northern New Brunswick study...
24
Predicting the AQHI without aid of observations: results from the northern New Brunswick study National Air Quality Conference Durham, NC Daniel Jubainville Environment Canada Meteorological Service of Canada Feb 11 th , 2014
-
Upload
ethelbert-bryan -
Category
Documents
-
view
214 -
download
0
Transcript of Predicting the AQHI without aid of observations: results from the northern New Brunswick study...
Predicting the AQHI without aid of observations: results from the northern New Brunswick study
National Air Quality Conference
Durham, NC
Daniel Jubainville
Environment Canada
Meteorological Service of Canada
Feb 11th, 2014
Page 2 – April 19, 2023
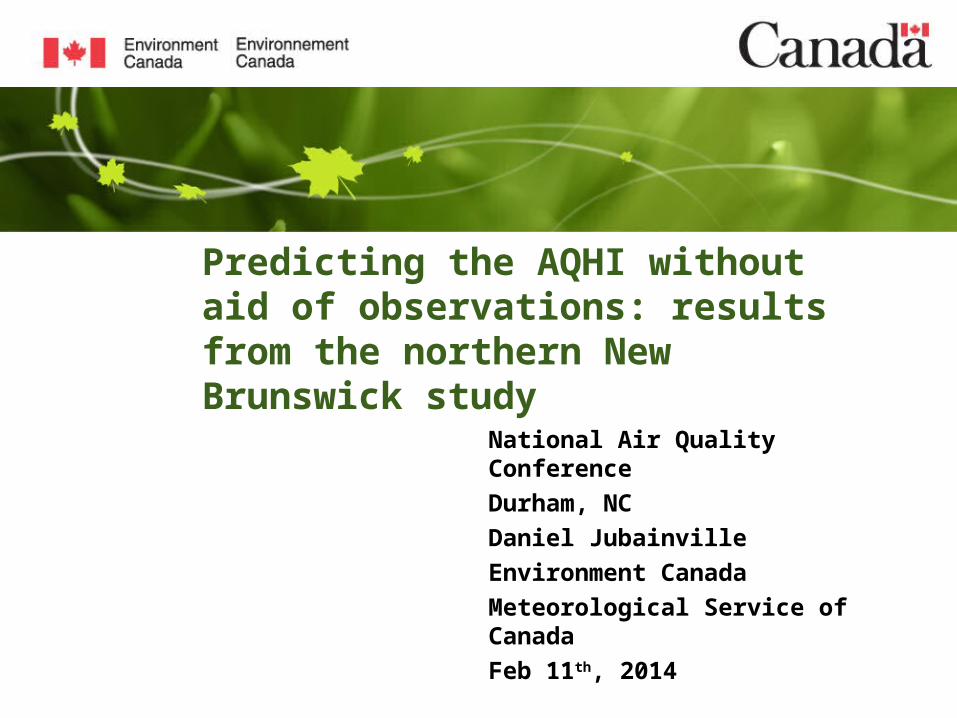
Objectives of this study
• Goal is to expand AQHI forecast program to rural areas without air quality monitoring data
• Evaluate model performance for AQHI forecasting in rural areas
• Determine forecaster skill in the absence of observed data
• Observation data was collected starting in September 2012 and is expected to continue until June 2014
Page 3 – April 19, 2023
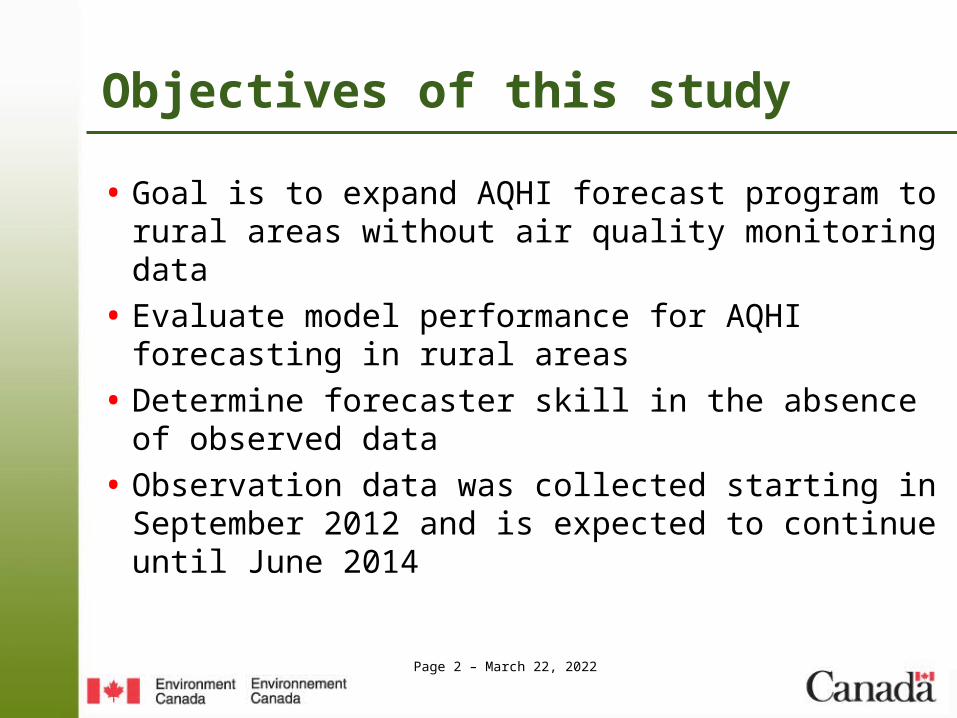
Companion Studies• Spatial AQHI Study – Dalhousie
University, using passive and active sampling. (Interim Report available)
• PM2.5 and O3 had high temporal and spatial correlation
• NO2 had poor correlation across the network
• St Valentin, QC – Rural AQHI site
Campbellton
Miramichi
BathurstEdmundston
Grand Falls St Valentin
Montreal
Page 4 – April 19, 2023
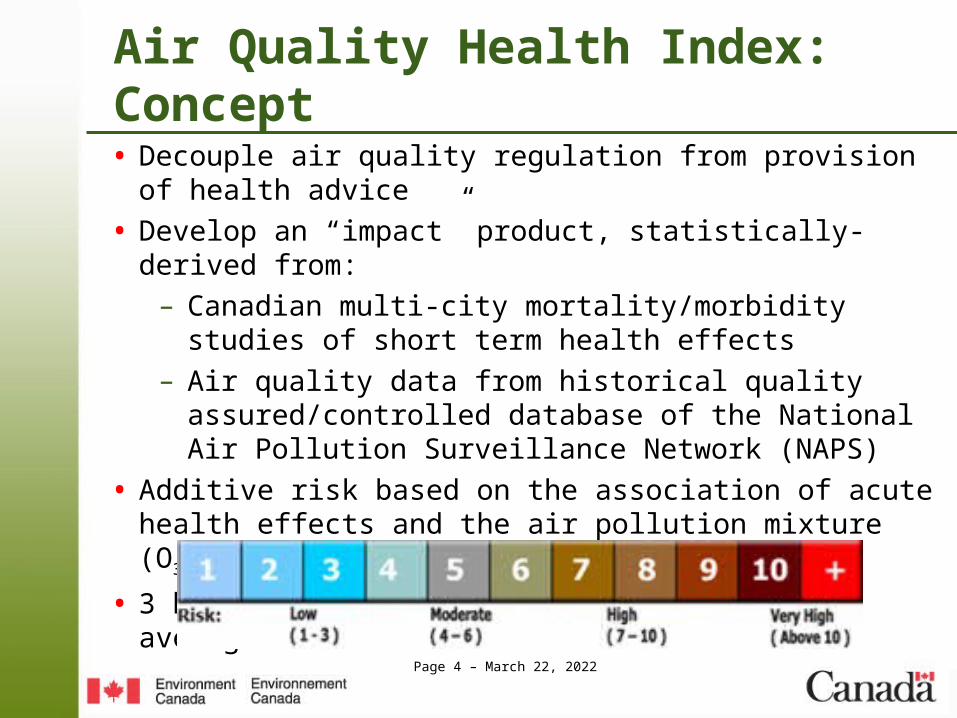
Air Quality Health Index: Concept
• Decouple air quality regulation from provision of health advice
• Develop an “impact” product, statistically-derived from:
– Canadian multi-city mortality/morbidity studies of short term health effects
– Air quality data from historical quality assured/controlled database of the National Air Pollution Surveillance Network (NAPS)
• Additive risk based on the association of acute health effects and the air pollution mixture (O3, PM and NO2)
• 3 hour rolling pollutant concentrations averages
Page 5 – April 19, 2023
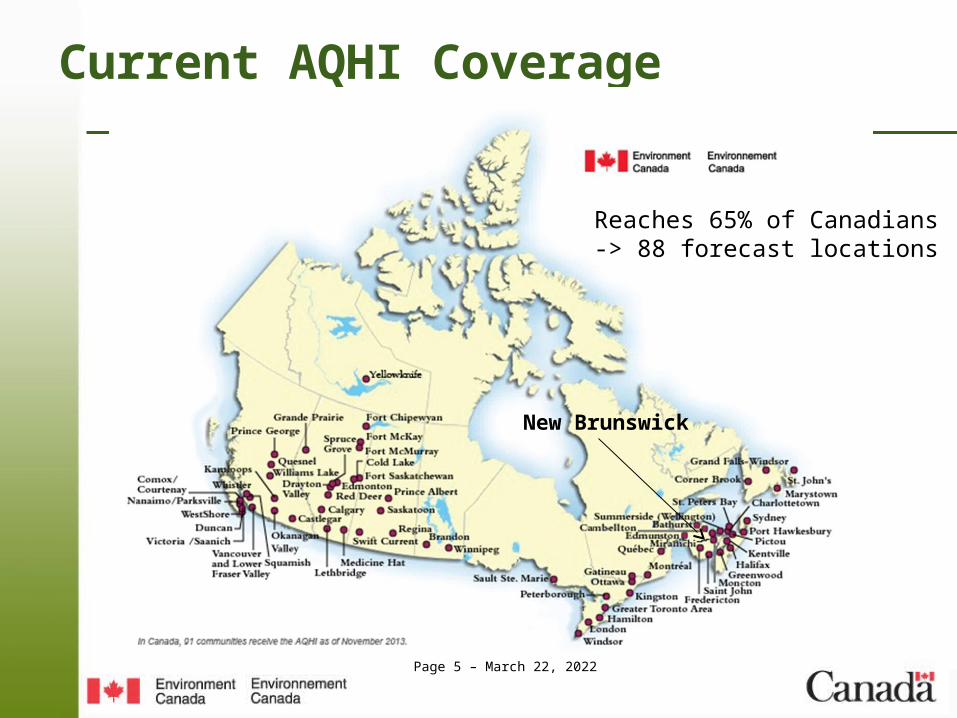
Current AQHI Coverage
Reaches 65% of Canadians-> 88 forecast locations
New Brunswick
Page 6 – April 19, 2023
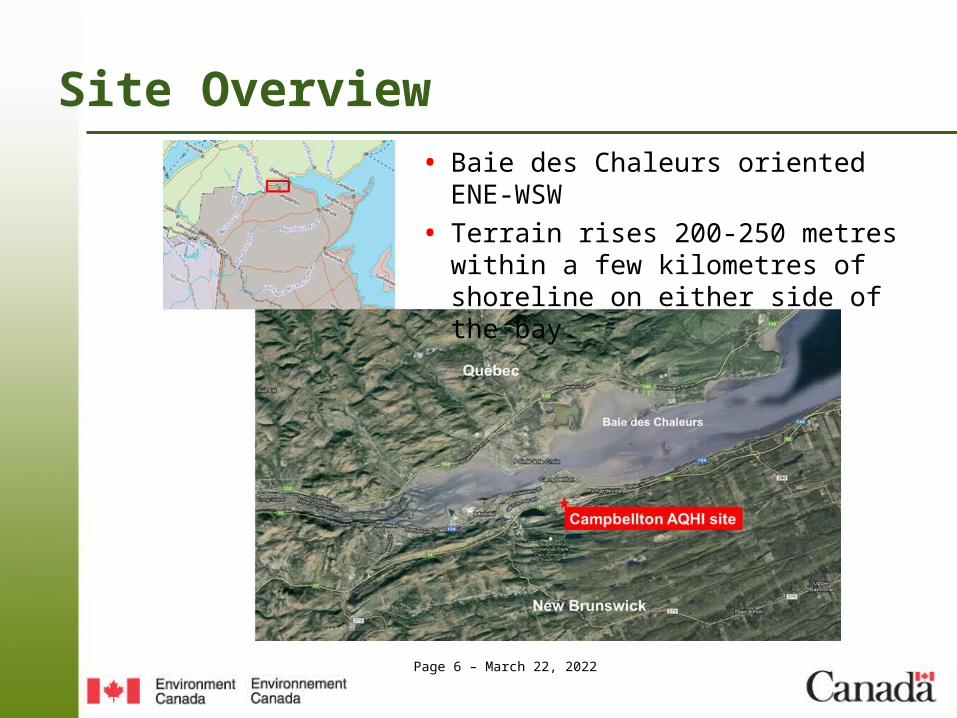
Site Overview• Baie des Chaleurs oriented ENE-WSW
• Terrain rises 200-250 metres within a few kilometres of shoreline on either side of the bay.

Page 7 – April 19, 2023
Instrumentation
Pollutant Instrument Method Units Flow Rate Range Start DateSampling Interval
Detection Limit Calibration
NO API T200Chemilumines
enceppbv 0.5 l/min 0-500 ppbv Sep 14 2012 1 min 0.4 ppbv API T700
NO2 API T200Chemilumines
enceppbv 0.5 l/min 0-500 ppbv Sep 14 2012 1 min 0.4 ppbv API T700
NOx API T200Chemilumines
enceppbv 0.5 l/min 0-500 ppbv Sep 14 2012 1 min 0.4 ppbv API T700
O3 Thermo 49i Photometry ppbv 0.8 l/min 0-200 ppbv Sep 14 2012 1min 1.0 ppbv API T700
PM2.5
Thermo SHARP 5030i
Nephelometry and Beta detection
μg m-3 16.0 l/min 0-10000 g /m3 Sep 14 2012 1 min
± 2.0 μg/m3 <80 μg/m3 (1 hr.)
± 5 μg/m3 >80 μg/m3 (24 hr)
Foils for Beta
Delta Cal flow
CO API T300U IR Absorption ppbv 1.8 l/min 0-5000 ppbv Jan 04 2013 1 min <20 ppbv API T700
MeteorologyDavis
VantagePro 2
tempRH
MSL pressure,
wind spd / dirprecipitation
solar radiation
oC%mb
km h-1
mm
Sep 14 2012 5 min
Page 8 – April 19, 2023
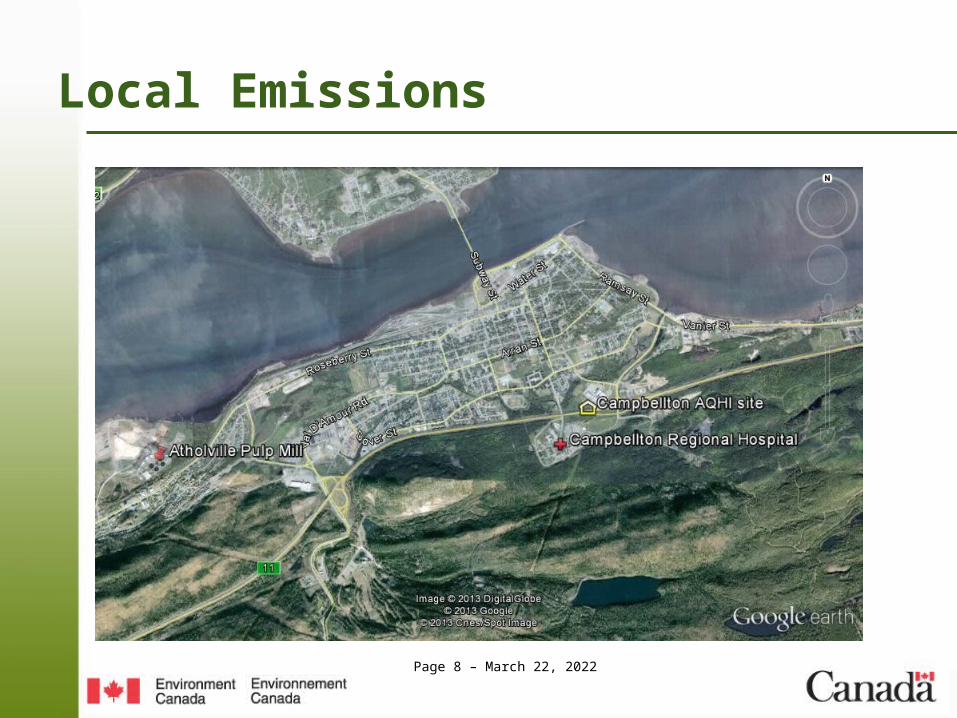
Local Emissions

Page 9 – April 19, 2023
Local Meteorology
• Topography strongly influences local meteorological conditions
• Air quality and weather data collected from September 14th, 2012 to December 31st, 2013
• Most common wind directions along river valley

Page 10 – April 19, 2023
Wind Stats, Seasonal14 Sep 2012 to 31 Dec 2013
5-Minute Average Wind Direction

Page 11 – April 19, 2023
Performance of GEM-MACH - NO2

Page 12 – April 19, 2023
Performance of GEM-MACH – O3

Page 13 – April 19, 2023
Performance of GEM-MACH - PM2.5

Page 14 – April 19, 2023
GEM-MACH Air Quality Model - AQHI• Model percent correct within +/-1 AQHI = 98
• Positive bias September-October mostly due to over-prediction of O3
• Negative bias in colder months due to under-prediction of PM2.5 and NO2, and to a lesser extent O3
•The negative bias is due to under-represented local emissions and the limited resolution of the boundary layer i.e. thermal inversions develop overnight during periods of light winds -> pollutants build up
•Bias in O3 due to seasonal variation not captured by model

Page 15 – April 19, 2023
Seasonal Performance
(=, +/-1): 99%
(=, +/-1): 98% (=, +/-1): 95%
(=, +/-1): 98%
Page 16 – April 19, 2023
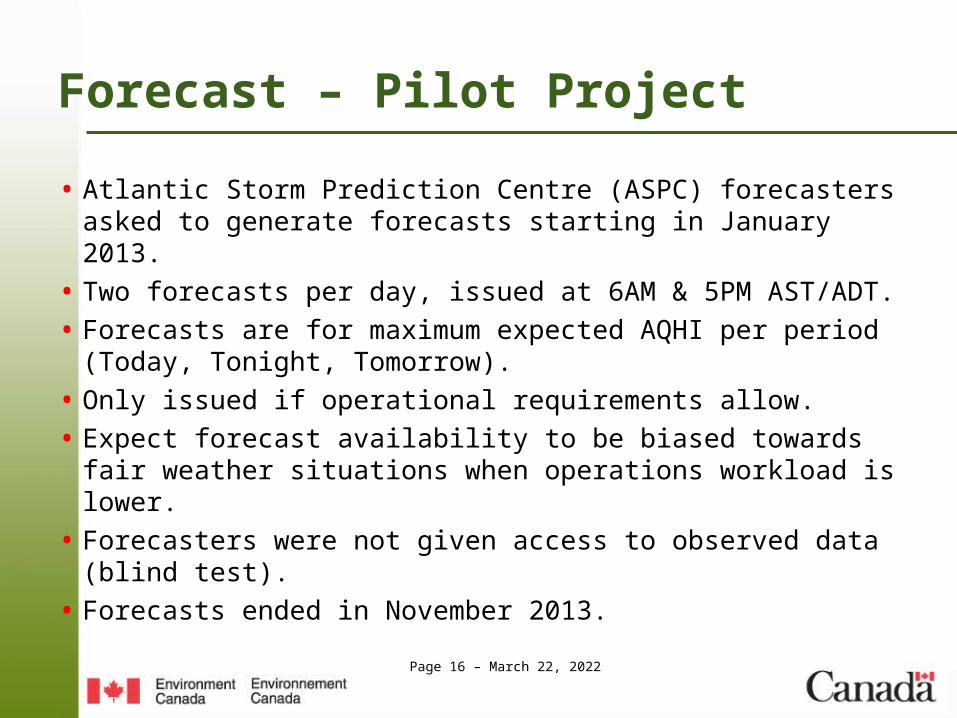
Forecast – Pilot Project
• Atlantic Storm Prediction Centre (ASPC) forecasters asked to generate forecasts starting in January 2013.
• Two forecasts per day, issued at 6AM & 5PM AST/ADT.
• Forecasts are for maximum expected AQHI per period (Today, Tonight, Tomorrow).
• Only issued if operational requirements allow.
• Expect forecast availability to be biased towards fair weather situations when operations workload is lower.
• Forecasters were not given access to observed data (blind test).
• Forecasts ended in November 2013.

Page 17 – April 19, 2023
Forecasts issued 6:00 AM AST/ADTToday (January 17th – November 4th, 2013)
Tdy (AM fcst)
Obs
1 2 3 4 5 6
1 1 0 0 0 0 0 1
Fcst 2 1 59 26 0 0 1 87
3 2 8 23 2 0 0 35
4 0 0 0 0 0 0 0
5 0 0 0 0 0 0 0
6 0 0 0 0 0 0 0
4 67 49 2 0 1 123
Percent Correct 67.5
Percent Correct +/- 1 97.6
Tdy (AM fcst)
Obs
1 2 3 4 5 6
1 13 50 6 0 0 0 69
Mdl 2 16 101 79 4 0 2 202
3 0 3 8 2 0 0 13
4 0 0 1 0 0 0 1
5 0 0 0 0 0 0 0
6 0 0 0 0 0 0 0
29 154 94 6 0 2 285
Percent Correct 42.8
Percent Correct +/- 1 95.8
Forecast Model

Page 18 – April 19, 2023
Forecasts issued 6:00 AM AST/ADTTonight (January 17th – November 4th, 2013)
Forecast ModelTngt (AM fcst)
Obs
1 2 3 4 5 6
1 1 0 0 0 0 0 1
Fcst 2 8 55 33 0 0 0 96
3 1 6 16 4 0 0 27
4 0 0 0 0 0 0 0
5 0 0 0 0 0 0 0
6 0 0 0 0 0 0 0
10 61 49 4 0 0 124
Percent Correct 58.1
Percent Correct +/- 1 99.2
Tngt (AM fcst)
Obs
1 2 3 4 5 6
1 21 42 5 0 0 1 69
Mdl 2 24 92 82 5 0 0 203
3 1 1 5 3 0 0 10
4 0 0 0 0 0 0 0
5 0 0 1 0 0 0 1
6 0 0 0 0 0 0 0
46 135 93 8 0 1 283
Percent Correct 41.7
Percent Correct +/- 1 95.4
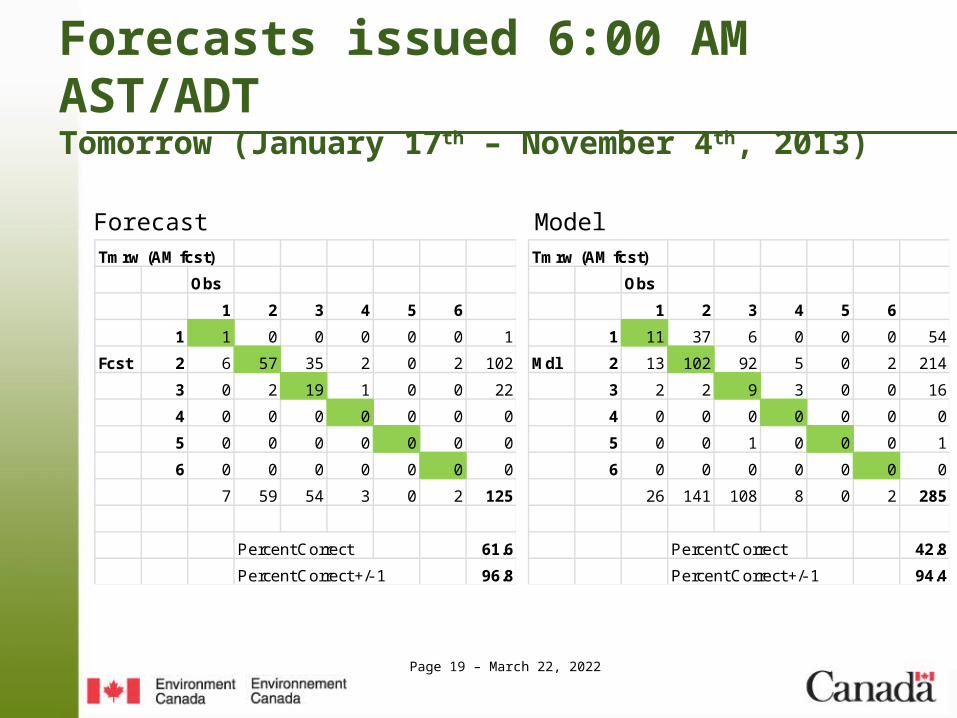
Page 19 – April 19, 2023
Forecasts issued 6:00 AM AST/ADTTomorrow (January 17th – November 4th, 2013)
Forecast ModelTmrw (AM fcst)
Obs
1 2 3 4 5 6
1 1 0 0 0 0 0 1
Fcst 2 6 57 35 2 0 2 102
3 0 2 19 1 0 0 22
4 0 0 0 0 0 0 0
5 0 0 0 0 0 0 0
6 0 0 0 0 0 0 0
7 59 54 3 0 2 125
Percent Correct 61.6
Percent Correct +/- 1 96.8
Tmrw (AM fcst)
Obs
1 2 3 4 5 6
1 11 37 6 0 0 0 54
Mdl 2 13 102 92 5 0 2 214
3 2 2 9 3 0 0 16
4 0 0 0 0 0 0 0
5 0 0 1 0 0 0 1
6 0 0 0 0 0 0 0
26 141 108 8 0 2 285
Percent Correct 42.8
Percent Correct +/- 1 94.4

Page 20 – April 19, 2023
Forecasts issued 5:00 PM AST/ADTTonight (January 17th – November 4th, 2013)
Forecast ModelTngt (PM fcst)
Obs
1 2 3 4 5 6
1 0 0 0 0 0 0 0
Fcst 2 3 40 9 0 0 0 52
3 0 0 12 1 0 0 13
4 0 0 0 0 0 0 0
5 0 0 0 0 0 0 0
6 0 0 0 0 0 0 0
3 40 21 1 0 0 65
Percent Correct 80.0
Percent Correct +/- 1 100.0
Tngt (PM fcst)
Obs
1 2 3 4 5 6
1 17 43 5 0 0 1 66
Mdl 2 21 97 83 5 0 0 206
3 2 1 5 3 0 0 11
4 0 0 0 0 0 0 0
5 0 0 1 0 0 0 1
6 0 0 0 0 0 0 0
40 141 94 8 0 1 284
Percent Correct 41.9
Percent Correct +/- 1 95.1
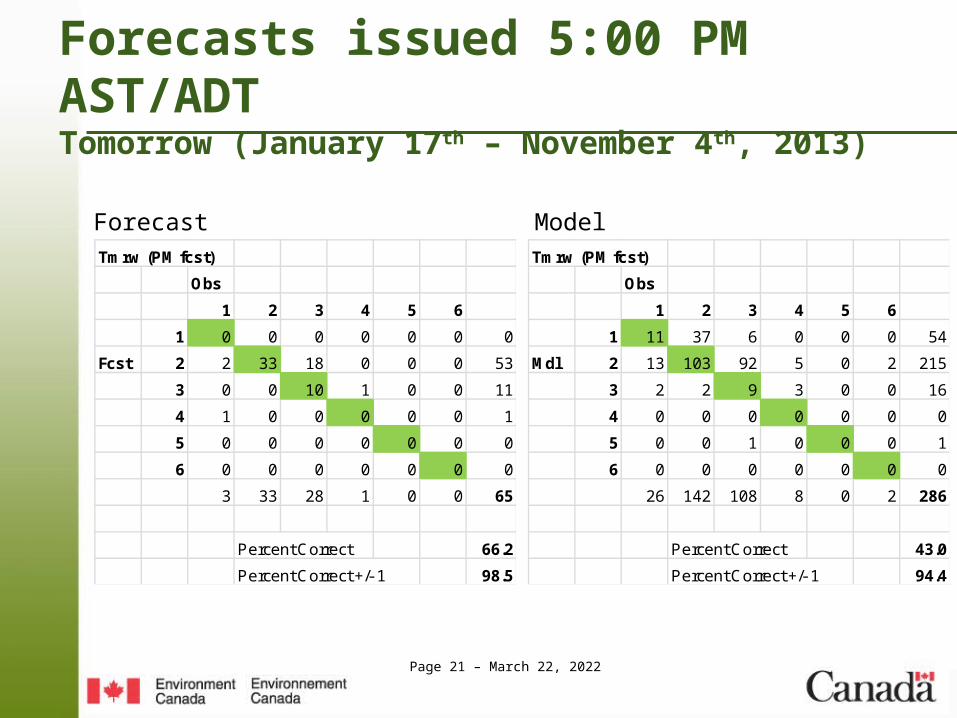
Page 21 – April 19, 2023
Forecasts issued 5:00 PM AST/ADTTomorrow (January 17th – November 4th, 2013)
Forecast ModelTmrw (PM fcst)
Obs
1 2 3 4 5 6
1 0 0 0 0 0 0 0
Fcst 2 2 33 18 0 0 0 53
3 0 0 10 1 0 0 11
4 1 0 0 0 0 0 1
5 0 0 0 0 0 0 0
6 0 0 0 0 0 0 0
3 33 28 1 0 0 65
Percent Correct 66.2
Percent Correct +/- 1 98.5
Tmrw (PM fcst)
Obs
1 2 3 4 5 6
1 11 37 6 0 0 0 54
Mdl 2 13 103 92 5 0 2 215
3 2 2 9 3 0 0 16
4 0 0 0 0 0 0 0
5 0 0 1 0 0 0 1
6 0 0 0 0 0 0 0
26 142 108 8 0 2 286
Percent Correct 43.0
Percent Correct +/- 1 94.4
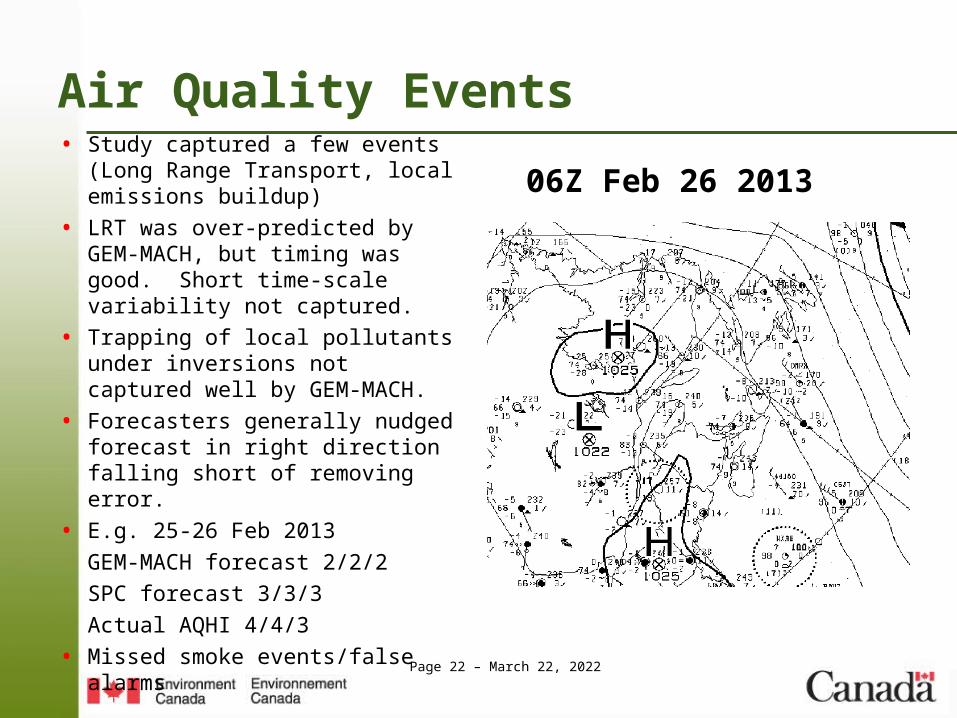
Page 22 – April 19, 2023
Air Quality Events• Study captured a few events (Long
Range Transport, local emissions buildup)
• LRT was over-predicted by GEM-MACH, but timing was good. Short time-scale variability not captured.
• Trapping of local pollutants under inversions not captured well by GEM-MACH.
• Forecasters generally nudged forecast in right direction falling short of removing error.
• E.g. 25-26 Feb 2013
GEM-MACH forecast 2/2/2
SPC forecast 3/3/3
Actual AQHI 4/4/3
• Missed smoke events/false alarms
06Z Feb 26 2013

Page 23 – April 19, 2023
Summary
• Campbellton site is representative of a semi-rural centre with the measured AQHI generally in the Low Risk category
• GEM-MACH showed skill predicting the maximum AQHI to within ± 1 of observed AQHI ~95% of the time
• GEM-MACH positive AQHI bias (due to O3) in the fall became a negative bias in the winter and early spring (due to NO2, PM2.5 and to a lesser degree O3).
• Cold season biases are due to under-represented local emissions, stronger inversions and inhibited mixing not fully parameterized in the model boundary layer.
• ASPC forecasters generally added value to the GEM-MACH forecast predicting to within ± 1 observed AQHI ~98% of the time
• ASPC forecasters generally added value by compensating for model’s cold season bias
• ASPC forecasters and model both struggle with extreme events related to forest fire smoke
Page 24 – April 19, 2023
AcknowledgementsCo-authors:
Environment Canada – David Waugh, Alan Wilson, Steve Beauchamp, Doug Steeves
Dalhousie University – Mark Gibson, Gavin King, James Kuchta
Partners:
Environment Canada – Craig Stroud, David Anselmo
Collège Communautaire du Nouveau-Brunswick Campbellton Campus – Réjean Savoie
New Brunswick Environment & Local Government – Darrell Welles, Eric Blanchard
Health Canada – Kamila Tomcik, Christina Daly