Predicting Thalasso Tourist Delight: A Hybrid SEM ...
15
Research Article Predicting Thalasso Tourist Delight: A Hybrid SEM—Artificial Intelligence Analysis Agustín J. Sánchez-Medina , 1 Ylenia I. Naranjo-Barrera , 2 Jesús B. Alonso , 3 and Julio Francisco Rufo Torres 3 1 Instituto Universitario de Ciencias y Tecnologías Cibernéticas (IUCTC), University of Las Palmas de Gran Canaria, Despacho C-2.21, Ed. de Económicas y Empresariales, Campus de Tafira, 35017 Las Palmas de Gran Canaria, Spain 2 Instituto Universitario de Ciencias y Tecnologías Cibernéticas (IUCTC), University of Las Palmas de Gran Canaria, Campus de Tafira, 35017 Las Palmas de Gran Canaria, Spain 3 Instituto para el Desarrollo Tecnológico y la Innovación en Comunicaciones (IDeTIC), University of Las Palmas de Gran Canaria, Campus de Tafira, 35017 Las Palmas de Gran Canaria, Spain Correspondence should be addressed to Agustín J. Sánchez-Medina; [email protected] and Ylenia I. Naranjo-Barrera; [email protected] Received 27 May 2018; Revised 12 August 2018; Accepted 29 August 2018; Published 16 October 2018 Academic Editor: Jorge Arenas-Gaitán Copyright © 2018 Agustín J. Sánchez-Medina et al. This is an open access article distributed under the Creative Commons Attribution License, which permits unrestricted use, distribution, and reproduction in any medium, provided the original work is properly cited. This study focuses on the influence of the quality of services received by thalassotherapy customers on their global satisfaction and the relationship between this and the word of mouth. This study uses a hybrid SEM—classification tree analysis. The empirical findings reveal a significant relationship between the quality of each offered service and global satisfaction. This study contributes to identify tourist’s satisfaction or delight on received thalasso services through a proposed methodology. The main contribution of this work consists of the proposal of a methodology to identify objectively through the opinion of tourists if they were satisfied or had reached delight. This work demonstrates, confirming what has been found in previous literature, that global satisfaction is related to the different experiences provided by the service. Thus, all hypotheses are accepted, supporting the hypotheses that relate the pool, the staff, the treatments, and the environment to satisfaction. In addition, the hypotheses that link satisfaction with the word of mouth are also supported. This theoretical implication has important practical implications for managers of the type of facilities such as those studied in this paper, since it shows that it is not enough to do well in one of the services provided if the environment or the interaction with the staff is not right. 1. Introduction The concept of well-being has its origin in the work of Halbert Dunn in 1959, in which he discusses a particular state that incorporates a general sense of well-being that is formed by the body, mind, spirit, and surrounding environ- ment [1, 2]. Since old times, health has been known as a motivation to travel. We can mention examples like the Roman terms, the Turkish baths, the Japanese onsens, or nowadays the Alpine healing resorts [3]. However, in recent years, health tourism has reinvented itself and grown in pop- ularity, becoming a tourist phenomenon worldwide with an upward trend that seems to be maintained [4]. Scholars like Goodarzi et al. [5] believe that this trend is due to the growing awareness of the importance of health in the middle and upper middle classes. According to Dimitrovski and Todoroviic [6], defini- tions of health and wellness tourisms are inconsistent and vary significantly, which means that the concept can be understood in different ways. Moreover, this inconsistency is even found in the term itself, and according to the authors, “health tourism,”“thermal tourism,” and “wellness tourism” are used interchangeably. Other authors like Mueller and Kaufmann [2] establish different categories for this type of tourism, dividing it into illness spa/convalescence tourism and prevention tourism, Hindawi Complexity Volume 2018, Article ID 4329396, 14 pages https://doi.org/10.1155/2018/4329396
Transcript of Predicting Thalasso Tourist Delight: A Hybrid SEM ...

Research ArticlePredicting Thalasso Tourist Delight: A Hybrid SEM—ArtificialIntelligence Analysis
Agustín J. Sánchez-Medina ,1 Ylenia I. Naranjo-Barrera ,2 Jesús B. Alonso ,3
and Julio Francisco Rufo Torres 3
1Instituto Universitario de Ciencias y Tecnologías Cibernéticas (IUCTC), University of Las Palmas de Gran Canaria,Despacho C-2.21, Ed. de Económicas y Empresariales, Campus de Tafira, 35017 Las Palmas de Gran Canaria, Spain2Instituto Universitario de Ciencias y Tecnologías Cibernéticas (IUCTC), University of Las Palmas de Gran Canaria,Campus de Tafira, 35017 Las Palmas de Gran Canaria, Spain3Instituto para el Desarrollo Tecnológico y la Innovación en Comunicaciones (IDeTIC), University of Las Palmas de Gran Canaria,Campus de Tafira, 35017 Las Palmas de Gran Canaria, Spain
Correspondence should be addressed to Agustín J. Sánchez-Medina; [email protected] Ylenia I. Naranjo-Barrera; [email protected]
Received 27 May 2018; Revised 12 August 2018; Accepted 29 August 2018; Published 16 October 2018
Academic Editor: Jorge Arenas-Gaitán
Copyright © 2018 Agustín J. Sánchez-Medina et al. This is an open access article distributed under the Creative CommonsAttribution License, which permits unrestricted use, distribution, and reproduction in any medium, provided the original workis properly cited.
This study focuses on the influence of the quality of services received by thalassotherapy customers on their global satisfaction andthe relationship between this and the word of mouth. This study uses a hybrid SEM—classification tree analysis. The empiricalfindings reveal a significant relationship between the quality of each offered service and global satisfaction. This studycontributes to identify tourist’s satisfaction or delight on received thalasso services through a proposed methodology. The maincontribution of this work consists of the proposal of a methodology to identify objectively through the opinion of tourists if theywere satisfied or had reached delight. This work demonstrates, confirming what has been found in previous literature, thatglobal satisfaction is related to the different experiences provided by the service. Thus, all hypotheses are accepted, supportingthe hypotheses that relate the pool, the staff, the treatments, and the environment to satisfaction. In addition, the hypothesesthat link satisfaction with the word of mouth are also supported. This theoretical implication has important practicalimplications for managers of the type of facilities such as those studied in this paper, since it shows that it is not enough to dowell in one of the services provided if the environment or the interaction with the staff is not right.
1. Introduction
The concept of well-being has its origin in the work ofHalbert Dunn in 1959, in which he discusses a particularstate that incorporates a general sense of well-being that isformed by the body, mind, spirit, and surrounding environ-ment [1, 2]. Since old times, health has been known as amotivation to travel. We can mention examples like theRoman terms, the Turkish baths, the Japanese onsens, ornowadays the Alpine healing resorts [3]. However, in recentyears, health tourism has reinvented itself and grown in pop-ularity, becoming a tourist phenomenon worldwide with anupward trend that seems to be maintained [4]. Scholars like
Goodarzi et al. [5] believe that this trend is due to the growingawareness of the importance of health in the middle andupper middle classes.
According to Dimitrovski and Todoroviic [6], defini-tions of health and wellness tourisms are inconsistent andvary significantly, which means that the concept can beunderstood in different ways. Moreover, this inconsistencyis even found in the term itself, and according to the authors,“health tourism,” “thermal tourism,” and “wellness tourism”are used interchangeably.
Other authors like Mueller and Kaufmann [2] establishdifferent categories for this type of tourism, dividing it intoillness spa/convalescence tourism and prevention tourism,
HindawiComplexityVolume 2018, Article ID 4329396, 14 pageshttps://doi.org/10.1155/2018/4329396

the latter being divided into specific illness prevention andwellness tourism. However, on many occasions, wellnesscenters offer all these services together, and thus, making dis-tinctions between them is not easy.
Therefore, health and wellness tourisms include all therelationships and phenomena that result from a trip with astay of at least one night, and in which the main motivationis to preserve or promote health and well-being [2, 5, 7].
Bennett et al. [8] believe that any type of tourism aimed atreducing stress can be considered as a type of health or well-ness tourism. If we consider Wray et al. [9], we must notethat they emphasize that this traditional way of contemplat-ing health tourism has recently expanded itself to includeother types such as yoga, spiritual pilgrimages, or holistictourism. In this sense, [10] defines it as “the trip of at leastone night in a facility that is specifically designed for physical,psychological, spiritual, and/or social welfare enhancement.”
This research focuses on the study of tourist’s satisfactionand delights in a particular wellness service: thalassotherapy.Etymologically, thalassotherapy comes from the Greek terms“thalassa” and “terapia,” these mean sea and therapy [11].According to the Spanish Society of Thalassotherapy, this isa method of therapy that has been used since ancient timesfor therapeutic purposes. The most important aspects arethe properties that have the chemical elements of sea water,seaweed, mud, and other elements extracted from the seafor health and physical appearance.
Ortiz [11] defines thalassotherapy as “a treatment tech-nique that combines seawater baths (hydrotherapy), marineclimate (atherapy), and solar radiation (heliotherapy) bring-ing benefits to healthy and sick individuals.” Since theGreek-Roman period, there is knowledge of these types oftreatments. During the Middle Ages, their use decay, butfrom the eighteenth century onwards, they recover theirinterest. We find the first traces of thalassotherapy in thetourism sector in the 19th century with the development oflarge health villas [12].
On one hand, consumer satisfaction is a matter of interestfor academic research [13]. The study of the satisfaction oftourists has gained great relevance and topicality in the lastyears. In this sense, according to Google Scholar, of the 841researches that have been published with the topic “touristsatisfaction” in the title, 90% of them have been put forth inthe last decade (data obtained the first week of July 2016).If we carry out the same operation in Web of Science, theresults are quite similar. It is important to highlight the factthat of the total of 151 investigations that appear in thesearch, 92% have been written in the last ten years. Scholarslike Choi and Chu [13] confirmed that research on customersatisfaction in the service industry had increased significantlyin recent years. On the other hand, if we focus on wellnessand tourism, the results obtained show that their study haslately grown. However, the number of documents is consid-erably lower, 151 researches in Google Scholar (88% pub-lished in the last decade) and 32 studies in Web of Science(96% published in the last decade).
The importance of this research is based on the differenttopics we mention below. It is framed in tourism, an eco-nomic sector that has developed a great importance in the
last decades. It is focused on a specific touristic service, thewellness area. This field has not been studied in depth. Stud-ies about thalassotherapy centers do not abound, so the liter-ature about it is limited.
Therefore, this document has as main purpose to deter-mine how the services offered in thalassotherapy, its person-nel, and its facilities influence the satisfaction of the clientand how the satisfaction is related to the word of mouth(wom) recommendation. Another important aspect of thiswork is how to predict the delight through artificial intelli-gence starting from the variables that influenced satisfaction.It was assumed that there was happiness when people gavethe highest score to each item on the overall satisfactionscale, and in addition, they also did it on all of the wordof mouth scale.
The results obtained in this study have helped to developan objective methodology which identifies and evaluatestourist’s conditions after receiving thalassotherapy treat-ments. This way, we have a tool to know if they have felt sat-isfaction or if they have reached delight. This last status isrelated by scholars with the highest rate of repetition andwith the word of mouth.
The present essay is divided in four chapters. In the firstchapter, we make a presentation of the state of the art andof the hypothesis of this research. In the second chapter,the development of the methodology applied during theessay is dealt with. In the third chapter, obtained results areshown, and a short discussion is presented. Finally, in the lastchapter, the main conclusions of the research are offered.
2. Theoretical Background
In large service industries, customer satisfaction is seen as akey element [14, 15]. Thus, customer satisfaction or the lackof it could serve as a control mechanism for companies toidentify which attributes should improve to achieve this sat-isfaction [15]. Rajaguru and Hassanli [16] affirm that thequality of the service is considered an important predictorof success in the tourism industry. In addition, it must beconsidered that, in order to have good results, continuouscustomer feedback must be made on this variable [17, 18].
Although quality of service and satisfaction are relatedconcepts [16, 19, 20], they are different. Thus, Parasuramanet al. [21] define the quality of services as a judgment relatedto the superiority of the service. Ryan [22] asserts that qualityin the tourism industry is the features and characteristics ofservices and products that meet the needs of tourists, whetherthey are declared or implied. Finally, Prayag [23] adds thatthe quality of the service is an enduring construct thatencompasses quality performance in all activities carriedout by management and employees.
Satisfaction can be defined as the general assessment thatthe client makes of the service once it has been consumed[15], being a consequence of the quality of the service [24].On the other hand, Anderson et al. [25] assert that satisfac-tion is the result of the general evaluation that derives fromthe total experience of consumption with a good or service.Cong [26] and Ramamoorthy et al. [27] affirm that this con-cept is related to the difference between the expectations that
2 Complexity

were held before the consumption of the service and the per-ceived performance once it was consumed. Thus, in the tour-ism sector, if the expectations are exceeded, the tourist will besatisfied [24]. In addition, it must be taken into account thatthe relationships between companies and customers havechanged and they must strive to achieve customer satisfac-tion. To do so, companies must compete in order to providehigher quality services that lead them to achieve the touristsatisfaction [27].
Satisfaction is a very important aspect in the tourismarea [28], and it is also a matter of interest for scholars[13, 29]. Thus, in a changing and dynamic environment,providing quality services to their customers becomes animportant tool for suppliers to maintain the competitiveadvantage [30]. In this way, increasing satisfaction allowsto improve the retention and, with that, to increase theprofits, to generate a word of mouth, and to expend lessin marketing [31]. Thus, it has been related, among otherpositive aspects, with the fidelity and intention to repeat ofthe tourist [32–35], with the word of mouth [30, 36, 37]or with paying premium prices [33, 38].
For Ifie et al. [39], one of the most important sources ofnew customers for companies is the recommendations ofcurrent customers. This form of promotion is interesting,for companies, because of the low cost it has. In this way,wom is an effective way to promote products and services[40, 41]. Thus, marketing professionals have not been obliv-ious to this issue and the implications it has on the results ofthe company [42]. For Sivadas and Jindal [15], the wom canbe defined as the transmission of experiences from person toperson that does not originate commercially with respect to abrand or service, being perceived as more credible thanadvertising; for its part, Saleem et al. [43] state that thewom refers to communications between clients, talking abouttheir experiences and evaluating a service.
Determining what causes a positive wom is of greatinterest and has been analyzed from different perspectives[39, 44]. In the tourism industry, due to its fragmentedstructure, it is of special interest since the acquisition ofnew clients depends on the references of existing satisfiedconsumers, generated in the form of a positive wom [15].According to Ifie et al. [39] or Sivadas and Jindal [15], someof these antecedents of the wom have been issues such as thecharacteristics of the product and the organization, the rela-tions with the client, the brand image, or the quality of theservice which is the most analyzed in the literature [15].
3. Research Hypothesis
Satisfaction can be defined as the positive reaction of cus-tomers to a specific experience with a product or service[45]. Other authors go further by asserting that it is the reac-tion to a set of experiences and not just a single one [33, 35].As expressed by McDougall and Levesque [31], customersatisfaction has to do with a global evaluation of the serviceprovider. Besides, Hu et al. [30] consider it as the affectivereaction that occurs as a result of one or several servicesreceived, which would cover the two previous points of view.In this sense, the overall satisfaction of the tourist in the
thalassotherapy centers can come from the satisfaction withthe main activities: water treatments in the swimming pools,the personal treatments (body or facial treatments), the envi-ronment, and the interaction with the staff. For this reason,the following four hypotheses are formulated:
H1: Satisfaction with swimming pool treatments is posi-tively related to overall satisfaction with the thalasso-therapy center
H2: Satisfaction with body treatments is positivelyrelated to overall satisfaction with the thalassother-apy center
H3: Satisfaction with the thalassotherapy environment ispositively related to overall satisfaction with the tha-lassotherapy center
H4: Satisfaction with thalassotherapy staff is positivelyrelated to overall satisfaction with the thalassother-apy center
According to Saleem et al. [43], the intentions of wom listseveral factors, among which is the quality of service as one ofthe most important [39]. In this way, in the tourism industry,there is a link between customer satisfaction and their ten-dency to share their experiences with positive recommenda-tions [15, 16, 34, 35, 46–50]. So, according to Lai andHitchcock [51], the relationship between quality of serviceand the wom is well confirmed in previous studies. In thesame line, Meng and Han [24] assert that wom is a directresult of satisfaction and that this relationship is well sup-ported in the literature. First of all, we propose that the satis-fied customers can contribute positively to a positive word ofmouth (wom) promotion.
Therefore, the fifth hypothesis of this work is formulated.
H5: Overall satisfaction with the thalassotherapy centeris positively related to a favourable word of mouth(wom)
According to Liu and Keh [29], in the last decades, theinterest in the emotional states of the consumers hasincreased. Among these emotional states, delight stands out[29, 52, 53]. It is important to note that delight and satisfac-tion are not the same [54, 55]. Thus, mere customer satisfac-tion is not enough to achieve their delight [56]. FollowingFinn [57], satisfaction and delight do not have exactly thesame effects on behavioral intentions, and he suggests thatexisting research on satisfaction cannot be applied in full todelight. Thus, it can be considered that there are three levelsalong the continuum of satisfaction: the area of no satisfac-tion, mere satisfaction, and delight [29]. There must behigh satisfaction and an emotional response for delight toexist [58]. Liu and Keh [29] believe that delight is definedby managers in a pragmatic way as what goes beyond satis-faction. However, academics define it as a pleasant surprise.Following this argumentation, Chandler [59] states that itoccurs when the customer experiences an unexpected levelof value or satisfaction. Likewise, Berman [60] considers thatdelight requires an extraordinary service or performance of
3Complexity
the product. Arnold et al. [61] and Rust and Oliver [62] arguethat it is a positive emotional state resulting from the pos-itive improvement of the consumer’s expectations and theexistence of a degree of surprise. Delight can be defined as apositive effect with a high level of activation in which thereis a combination of satisfaction with excitement and pleasure[63, 64]. Thus, delight is generated by a combination of pos-itive disconfirmation and surprise to some previous expecta-tions [55]. It means that it happens when the expectations arepositively exceeded with a degree of surprise, so consumersdo not expect the product or service to be so good [65].
As believed by Liu and Keh [29] and Berman [60], mov-ing consumers from the satisfaction zone to the delight areais very positive for the company in terms of getting betterresults in customer retention and sales, word of mouth, andmarket share. In addition, it increases the value of the brandand the ability to resist the entry of new bidders [60].
To sum up, it should be noted that the tourism sectorhas not been excluded from research on delights, as has beenstudied, for example, in hotels [66], restaurants [67], ortheme parks [55, 68]. In the second part of this paper, aproposal is to study the importance of satisfaction with theenvironment of the establishment, the interaction with thestaff, and the main offered activities. Thus, a methodologywill be provided that, through classification trees, allows toidentify and evaluate objectively the importance that theaforementioned variables have to achieve.
4. Methodology
In the elaboration of the present research, both primary andsecondary sources of information were used. Secondary oneswere used to elaborate the theoretical framework and formu-late the hypotheses. The primaries, to validate the hypothesesmentioned above.
4.1. Sample. The sample used to carry out this study was tour-ists using a well-known Thalasso Hotel located in the southof Gran Canaria, one of the main tourist areas of the CanaryIslands, Spain. This 4-star hotel has one of the largest thalasso-therapy centers in Europe. It has an area of approximately7000m2 focused on health with sea water. The thalassotherapycenter offers health and wellness treatments, including mas-sage techniques, body treatments (peeling and wrapping),facials, wellness cures, and hydrotherapy [69].
Questionnaires were used to collect information from theThalasso visitors. Tourists were informed of the purpose ofthis work. Data was collected as tourists had just finishedtheir treatment. Surveys were conducted in June 2016.
In total and after eliminating several of them becausethey were poorly completed, 246 valid questionnaires wereobtained. The description of the main characteristics ofthis sample is reflected in Table 1. Thus, the majority ofthe respondents, more than 75%, were Spanish, British, orGerman nationalities which are the main visitors of the hotel.As for sex, approximately 60% were men, and the remaining40% were women. Finally, it should be mentioned that themajority of respondents were less than 50 years old.
4.2. Measurements. In the present study, the method used toobtain the necessary information to cover the objectives wasthe survey, in which the basic observation instrument is thequestionnaire [70]. Except for age, sex, nationality, level ofeducation, and place of residence, all items in this study arescored on a 7-point Likert scale ranging from (1) “stronglydisagree” to (7) “totally agree.” The survey questions werewritten in Spanish, English, and German.
Besides, the scales to evaluate the services offered by theThalasso, i.e., the hydrotherapy circuit, the individual treat-ments (body or face), and the general environment, in addi-tion to the satisfaction with the staff and global satisfactionwere elaborated based on the proposal by Huang et al. [71].To this, we have to add that the word of mouth scale waselaborated based on the work of Riquelme et al. [72].
4.3. Data Analysis. Data analysis has been divided into twoparts. The first part has been used to test the hypotheses thatrelated the quality of the services with global satisfaction. Forthis purpose, structural equations based on covariance wereused. This is done using the lavaan R package [73]. Oncethe proposed model was validated, a methodology was
Table 1: Demographic profile of the respondents.
Variables Frequency Percentage
Age
≤30 78 31.7%
31–40 67 27.2%
41–50 30 12.2%
51–60 56 22.8%
≥61 15 6.1%
Gender
Male 149 60.6%
Female 97 39.4%
Nationality
German 35 14.2%
Argentinian 4 1.6%
Austrian 2 0.8%
Brazilian 4 1.6%
British 48 19.5%
Czech 4 1.6%
Spanish 104 42.3%
French 15 6.1%
Hungarian 2 0.8%
Irish 5 2.0%
Mexican 2 0.8%
Portuguese 2 0.8%
Russian 7 2.8%
Swedish 4 1.6%
Swiss 4 1.6%
Indian 2 0.8%
Polish 2 0.8%
Total 246
4 Complexity

developed to objectively identify and evaluate whether theclients were satisfied or had reached delight (second part).To do this, we used as input data the opinion of the touristsabout the different services, the environment of the facilities,and the interaction with the staff. It should be mentioned thatthere was delight when people gave the highest score to eachitem on the overall satisfaction scale and, in addition, theyalso did it on all of the word of mouth scale. All this wasimplemented with the assembly of classification trees, specif-ically using the techniques of bagging and boosting. For thispurpose, adabag software was used [74].
5. Results
5.1. Contrast of Hypotheses. As it can be seen in Table 2, thereis no occurrence of multicollinearity [75, 76] because all thecorrelation coefficients are below 0.8 and also the largest var-iance inflation factor (VIF) is 3.366 (<10). As recommendedby Hair et al. [77], Leong et al. [78], and Wang et al. [79], atwo-step technique was used to examine the causal relation-ship between the constructs. First, an exploratory factorialanalysis, which was useful for filtering and defining thedimensional character of the scale [80], was used. The secondstage was a confirmatory factor analysis to evaluate thevalidity of constructs [81, 82].
To evaluate the convergent validity, the estimated load ofeach indicator in its construct was examined. For such valid-ity, the load must be high, and the values of t statisticallymust be significant [83]. In the planned model, the above isconfirmed with an acceptable convergent validity. Thus, theAFC results indicate that the relationship between each itemand its respective construct is statistically significant withloads that exceed 0.790 (all p value ≤ 0.001). With theseresults, the existence of convergent validity is assumed (seeTable 3). It is also necessary to determine the convergentvalidity of the constructs. According to Hair et al. [84] and
Roldán and Sánchez-Franco [85], this validity must be evalu-ated by analyzing Cronbach’s alpha, the composite reliabilityindex by Fornell and Larcker [86], and the average extractedvariance (AVE). The reference point, for the first two cases, is0.7 and for the third case is 0.5 [84, 85]. In the model we con-sidered and as shown in Table 2, all these criteria are wellmet. Thus, the minimum Cronbach’s alpha value obtainedis 0.868, the composite reliability is 0.871, and the AVE,0.693. Therefore, it can be concluded that the reflective con-structs are consistent.
To obtain the discriminant validity, the square root of theAVE (located on the diagonal of the matrix in Table 2) iscompared to the correlations between the constructs (theelements located outside the diagonal) [85, 87]. On average,it can be observed that each construct is stronger related toits own means than to the other constructs. Also, the chi-square difference test [88] is also achieved, and the resultshows that all constructs are different. In addition, it was usedon the evaluation of the heterotrait–monotrait ratio (HTMT)[89]. This criterion is more demanding than the previous cri-teria. This measure establishes the ratio of heterotrait–mono-trait correlations, with discriminant validity confirmed whenthe values are less than 0.90 [90]. The highest value obtainedin our sample is 0.778. Consequently, there are no discrimi-nant validity problems even though the correlations betweenthe constructs are high.
5.2. Test of Hypotheses. The structural model was verifiedwith some measures of goodness. To adjust the measurementmodel, robust maximum likelihood estimators were used[91, 92]. As it can be seen in Table 4, all of them exceededthe recommended thresholds (CFI = 0.940, TLI= 0.929,RMSEA=0.056, and SRMR=0.044). Hence, the structuralmodel fits with the collected data.
In the path analysis, the significance of a path is deter-mined based on its p value. The results implied that 77.5%
Table 2: Reliability, convergent validity, and discriminant validity: correlation coefficients and chi-square difference test.
Cronbach’salpha
Compositereliability
AVE ConstructBody
treatmentHumanresources
Pooltreatment
Environment Satisfaction wom
0.915 0.916 0.785 Treatment 0.886
0.868 0.871 0.693 Staff0.222∗∗∗
(9.831∗∗)#0.220#
0.833
0.944 0.944 0.809 Pool0.698∗∗∗
(153.53∗∗∗)#0.702#
0.259∗∗∗
(13.913∗∗∗)#0.268#
0.900
0.950 0.950 0.825 Environment0.615∗∗∗
(99.324∗∗∗)#0.614#
0.352∗∗∗
(26.953∗∗∗)#0.338#
0.749∗∗∗
(174.52∗∗∗)#0.750#
0.908
0.955 0.954 0.874 Satisfaction0.760∗∗∗
(166.61∗∗∗)#0.756#
0.396∗∗∗
(31.651∗∗∗)#0.376#
0.762∗∗∗
(173.62∗∗∗)#0.754#
0.793∗∗∗
(204.76∗∗∗)#0.778#
0.935
0.963 0.963 0.897 wom0.601∗∗∗
(126.75∗∗∗)#0.668#
0.313∗∗∗
(43.728∗∗∗)#0.434#
0.602∗∗∗
(158.66∗∗∗)#0.722#
0.627∗∗∗
(137.08∗∗∗)#0.671#
0.791∗∗∗
(194.38∗∗∗)#0.774#
0.947
Note: n = 246; ∗∗∗p ≤ 0 001; ∗∗p ≤ 0 01; square root of AVE (in bold) is shown on the diagonal; off-diagonal elements are the correlation coefficients; values inbrackets show the chi-square difference statistics with df = 1; values in # show the ratio of heterotrait–monotrait correlations.
5Complexity

Table 3: Confirmatory analyses.
Construct/indicator Standardized loading Z value p value
Body treatments
The Thalasso has an adequate number of body care treatments 0.906
The Thalasso offers a wide variety of body care treatments 0.890 23.324 ≤0.001I am satisfied with the body care treatments provided by the Thalasso 0.858 21.036 ≤0.001Pool treatments
The “Get in Shape” pool treatments are adequate 0.911
I am satisfied with the “Get in Shape” pool treatments 0.914 23.949 ≤0.001The pool programmes are satisfactory 0.911 20.579 ≤0.001I am satisfied with the guidance that I was given for the “Get in Shape” pool services 0.866 16.329 ≤0.001Human resources
The staff gives an adequate service to the clients 0.866
The staff gives personal attention to the clients 0.836 13.514 ≤0.001The staff is polite to the clients 0.790 8.764 ≤0.001Environment
I think the Thalasso has a comfortable atmosphere 0.863
I am satisfied with the cleanness of the facilities of the Thalasso 0.887 23.028 ≤0.001I am satisfied with the decoration, conditions, and style of the Thalasso 0.955 24.839 ≤0.001I am satisfied with the security conditions of the Thalasso 0.925 26.676 ≤0.001Satisfaction
The Thalasso has met my expectations 0.930
I am willing to return to the Thalasso 0.936 41.619 ≤0.001In general, I am satisfied with the service given at the Thalasso 0.940 24.767 ≤0.001Word of mouth
I would be willing to recommend the Thalasso to someone who sought my advice 0.944
I would be willing to encourage friends and family to use Thalasso 0.960 29.624 ≤0.001I would have no problem in saying positive things about the Thalasso 0.936 25.543 ≤0.001
Table 4: Measures of the model fit.
Number of observations: 246
Estimator Maximum likelihood Robust
Minimum function test statistic 301.741 279.968
Degrees of freedom 159 159
p value (chi-square) ≤0.001 ≤0.001Scaling correction factor or the Satorra-Bentler correction 1.081
Model test baseline model
Minimum function test statistic 5648.416 2212.795
Degrees of freedom 190 190
p value ≤0.001 ≤0.001Maximum likelihood Robust
User model versus baseline model
Comparative fit index (CFI)a 0.974 0.940
Tucker-Lewis index (TLI)b 0.969 0.929
RMSEAc 0.061 0.056
SRMRd 0.044 0.044aRecommended value ≥ 0.90 [77]. bRecommended value ≥ 0.90 [77]. cRecommended value ≤ 0.08 [78]. dRecommended value ≤ 0.1 [78].
6 Complexity
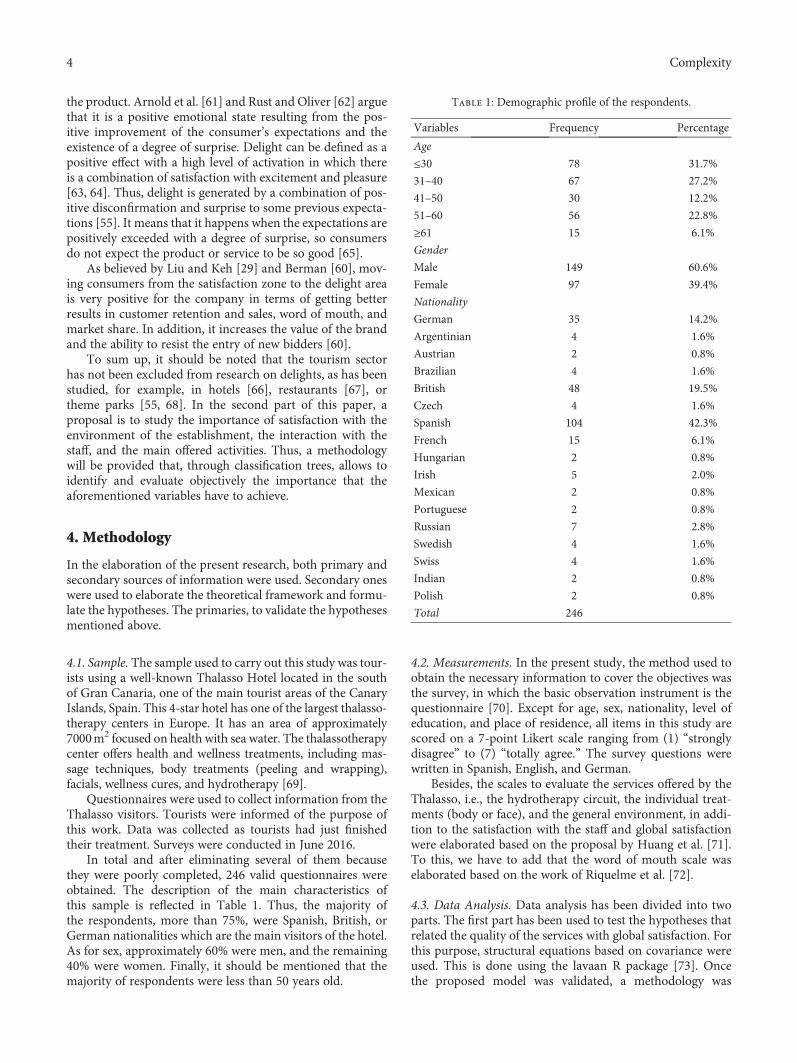
of the variance in satisfaction is explained by the model var-iables while satisfaction is able to explain 62.5% of the vari-ance in wom.
As shown in Table 5, the findings further reveal that pooltreatments (β = 0 186∗∗), humanresources (β = 0 132∗), bodytreatments (β = 0 366∗∗∗), and environment (β = 0 383∗∗∗)have significant and positive impacts on satisfaction whilesatisfaction (β = 0 791∗∗∗) positively impacted on wom.Therefore, all hypotheses were supported (see Figure 1 andTable 5).
5.3. Proposal of a Model to Establish the Importance of theDeterminants of Delight in the Services of Thalassotherapy.Based on the previous results, it was decided to include asinput variables of the delight classifier the four variables thatwere significant in the previous model, that is to say, the envi-ronment, the service of body treatments, the service of theswimming pool, and the interaction with the staff.
To analyze the data, an artificial intelligence method wasused, classification trees were assembled with boosting andbagging [93–96]. Bagging and boosting [74] can generate adiverse set of classifiers through the manipulation of trainingdata with a learning algorithm [97]. The bagging methodproduces multiple versions of a predictor so that an aggregatepredictor can be obtained. These multiple versions are gener-ated by making bootstrap replicates of the learning set [98].
Table 5: Results of path analysis.
Hypothesis Path Estimate Std. error Z value p value Remarks
H1 Pool→satisfaction 0.186∗∗ 0.071 2.624 0.009 Supported
H2 Staff→satisfaction 0.132∗ 0.078 2.448 0.014 Supported
H3 Treatment→satisfaction 0.366∗∗∗ 0.067 5.739 ≤0.001 Supported
H4 Environment→satisfaction 0.383∗∗∗ 0.075 5.093 ≤0.001 Supported
H5 Satisfaction→wom 0.791∗∗∗ 0.086 13.745 ≤0.001 Supported
Significance level: ∗∗∗p ≤ 0 001; ∗∗p ≤ 0 01; ∗p ≤ 0 05; ns not significant
Pool Staff Treatment Environment
0.186⁎⁎ 0.132⁎ 0.366⁎⁎⁎ 0.388⁎⁎⁎
SatisfactionR2 = 0.775
0.791⁎⁎⁎
Wom R2 = 0.625
⁎⁎⁎p < 0,001; ⁎⁎p < 0,01; ⁎p < 0,01; ns not significant
Figure 1: Structural model.
Error - 70% train
BaggingBoosting
1.0
0.8
0.6
0.4
0.2
0.0
Erro
r
0.0 0.2 0.4 0.6 0.8 1.0Threshold
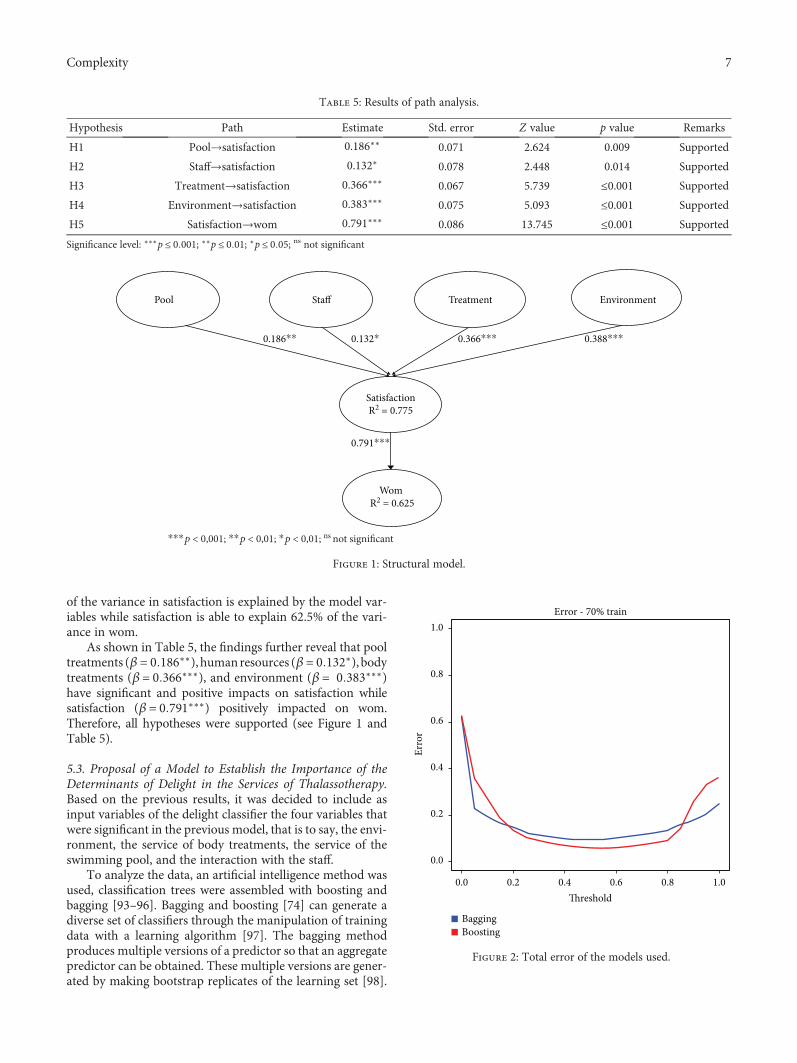
Figure 2: Total error of the models used.
7Complexity
Thus, starting from a training set with m cases, other sets arecreated (with replacements) [97]. A series of classifiers can beobtained with the boosting technique. The training set foreach member of the series is chosen according to the perfor-mance of the previous classifier. Thus, the cases are extractedwith replacement with probability proportional to theirweights [97].
Classification and regression trees are, compared to otherlearning techniques, one of the most intuitive and transpar-ent classification algorithms [99], representing a powerfulalternative to the more traditional statistical models [98].According to Homaie-Shandizi et al. [100], they were pre-sented during the ‘60s by Morgan and Sonquist [101], and
two decades later, Breiman et al. [102] develop the firstexhaustive and modern algorithm. In the tree structure, theleaves represent the classifications and the branches theconjunctions of characteristics that lead to the mentionedcategories [98, 103]. Its purpose is to perform a recursive par-tition of the training data into homogeneous subsets so thateach new partition will minimize the number of members[104]. The technique of the decision trees is attractive for alot of business applications [99] since a minimum of param-eters and no domain knowledge is required. They have theadvantage, too, of being able to detect nonlinear relationshipsand to show a good performance when there is qualitativeinformation [98].
Table 6: Total error of the models used.
Threshold 0.000 0.050 0.100 0.150 0.200 0.250 0.300 0.350 0.400 0.450
Bagging 0.627 0.228 0.191 0.166 0.148 0.122 0.113 0.105 0.099 0.093
Boosting 0.627 0.356 0.270 0.182 0.131 0.106 0.088 0.076 0.069 0.063
Threshold 0.500 0.550 0.600 0.650 0.700 0.750 0.800 0.850 0.900 0.950
Bagging 0.093 0.094 0.101 0.106 0.114 0.122 0.132 0.160 0.176 0.201
Boosting 0.060 0.060 0.062 0.065 0.071 0.079 0.092 0.144 0.260 0.329
BaggingBoosting
Erro
r
1.0
1.0
0.8
0.8
0.6
0.6
0.4
0.4
0.2
0.20.0
0.0Threshold
False positives-70% train
(a)
BaggingBoosting
Erro
r
1.0
0.8
0.6
0.4
0.2
0.01.00.80.60.40.20.0
Threshold
False negatives-70% train
(b)
1.0
0.8
0.6
0.4
0.2
0.0
BaggingBoosting
1.00.80.60.40.20.0Threshold
Sensitivity - 70% train
Sens
itivi
ty
(c)
1.0
0.8
0.6
0.4
0.2
0.0
BaggingBoosting
1.00.80.60.40.20.0Threshold
Specificity - 70% train
Spec
ifici
ty
(d)
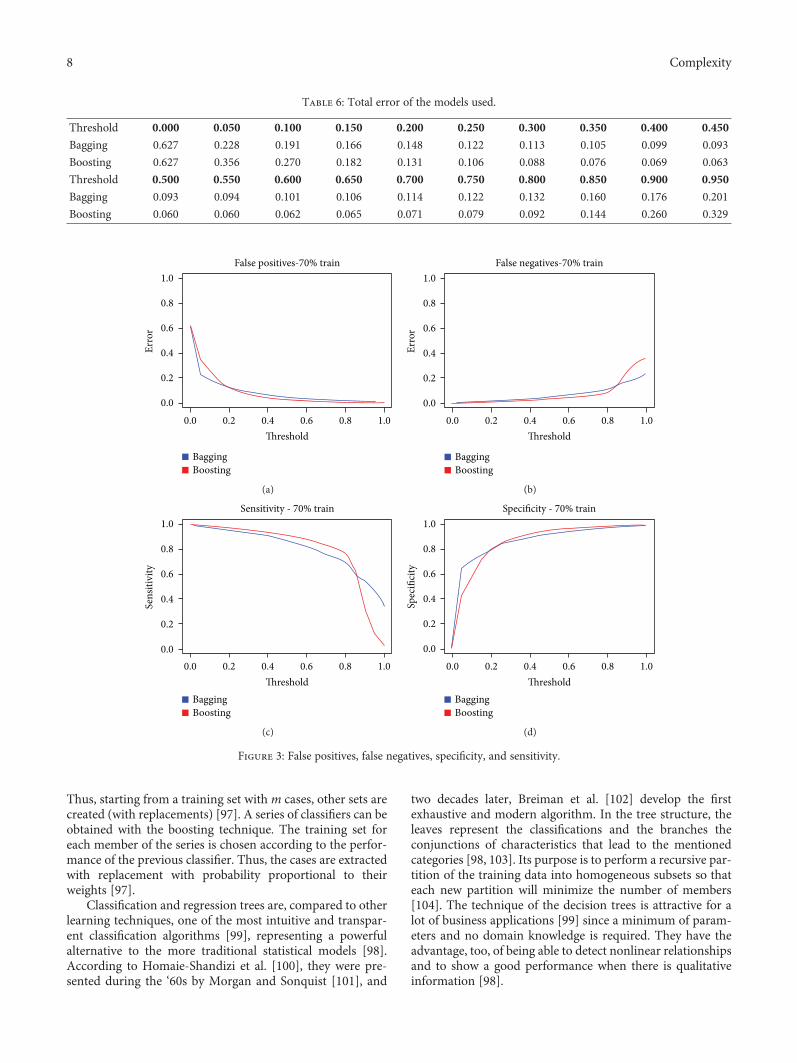
Figure 3: False positives, false negatives, specificity, and sensitivity.
8 Complexity
As already mentioned in Methodology, the adabag pack-age of R, which allows the use of bagging and boosting for theassembly of classification trees, was used. For its application,70% of the sample for training and the remaining 30% fortesting was established. It is worth mentioning that differentthresholds for classification were implemented. Thus, valuesranging from 0 to 1 were used for this threshold with incre-ments of 0.05. In all, 1000 iterations were performed. In eachone of them, which elements of the database would be in thetraining group and which were in the test group were chosenin a random way. For each of these training and test groups,bagging and boosting were applied, obtaining the results thatwill be shown below. Once all the results were available, theaverage value and the standard deviation obtained with theaforementioned 1000 iterations were calculated, for eachlevel of threshold. The t value was also calculated to compareit with a two-tailed Student’s t with 998 degrees of freedom.
The results obtained from applying the cited methodswill be presented below. The “rough data” produced by aclassification system are the counts of the correct and incor-rect classifications of each class. A matrix of confusion, whichis a contingency table form that shows the differencesbetween the actual and predicted classes for a set of labeledexamples [105], is used to analyze the obtained information.Referring to the total error obtained, it can be observed thatthe smaller errors, which are around 9% with bagging and6% with boosting, occur in both methods with thresholdsclose to 0.5 (see Figure 2). Table 6 show that the minimumerror is obtained using bagging. Errors occurring with thefirst method are always lower when the threshold is less than0.20 or higher than 0.85, that is, in extreme cases.
In addition, Figure 3 shows that for the false positives,that is, cases classified as “delight” that in reality were not“delight,” both methods behave similarly. As for specificity,it is worth mentioning that for very low thresholds, the bag-ging behaves better, occurring otherwise when it exceeds theheat of 0.1. As far as sensitivity is concerned, boosting for allthresholds below 0.85 behaves better. Moreover, an analysisis presented of sensitivity, “the proportion of true positivescorrectly identified by the test,” and specificity, “the propor-tion of true negatives correctly identified by the test” [106].(Sensitivity = true positive/(true positive + false negative);specificity = true negative/(true negative + false positive)). Inrelation to sensitivity, boosting always behaves slightly betterexcept when the thresholds are very high; in that case, thebagging provides a better performance. For thresholds higherthan 0.15, boosting presents a better specificity.
In order to show the performance of both methods, theROC curves obtained for both are presented below. Thesecurves are a good way to visualize the performance of theclassifiers [105]. Figure 4 shows that the area under the curvewhen using boosting is greater than when using bagging.
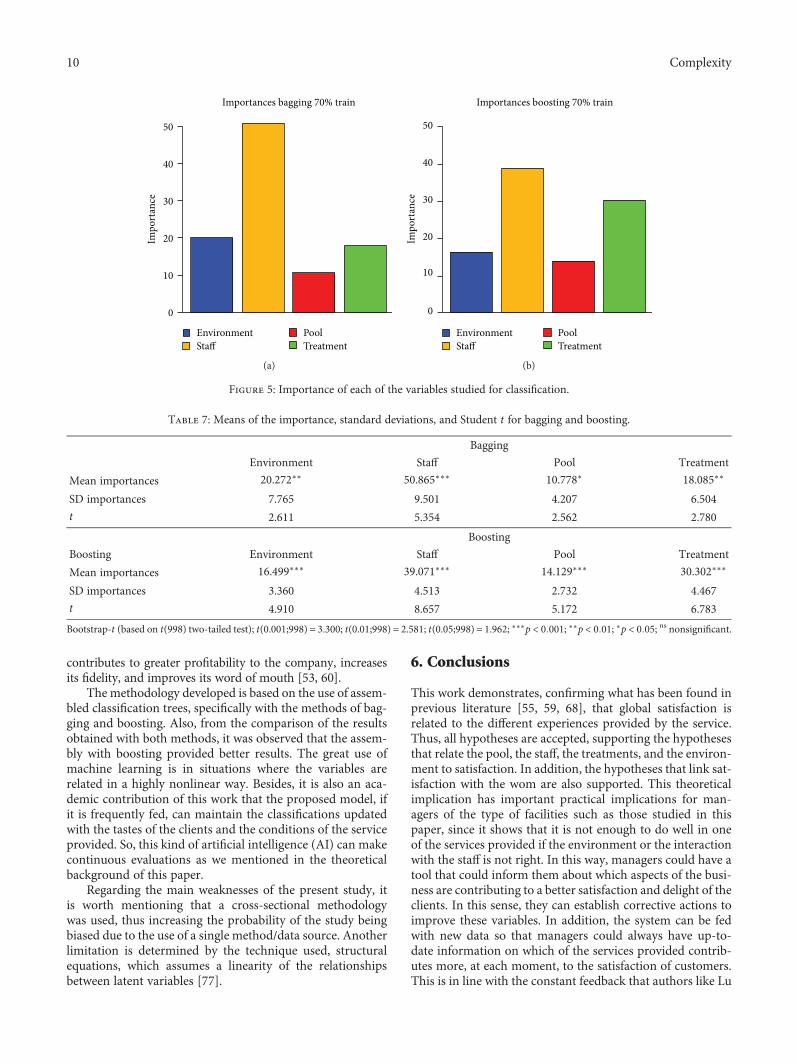
Regarding the importance given by bagging and boostingto the variables used to classify the companies in the catego-ries “delight” and “nondelight” (see Figure 5), the bootstrap-ping technique (1000 subsamples) was used to generate theStudent t statistics and the standard errors. Thus, the statisti-cal significance of the mean values for importance wasobtained. In both methods, it considered as the least
important variable the pool treatments and as the mostimportant the staff. However, there is a slight difference inthe situation of those in the second and third positions. Thus,in the boosting, the second in relevance is that of treatmentfollowed by environment, whereas in the bagging, these posi-tions are interchanged (see Table 7).
5.4. Discussion. According to the results, the presentedhypotheses are confirmed. The overall satisfaction of thetourist in the thalassotherapy centers comes from the satis-faction with the main activities: water treatments in theswimming pools, the personal treatments (body or facialtreatments), the environment, and the interaction with thestaff. The results tell us, as well, that the satisfied customerscan contribute positively to the word of mouth promotion.This theoretical implication has important practical implica-tions for managers of facilities, such as those studied in thiswork, since it shows that it is not enough to do well in oneof the services provided if the environment or the interactionwith the staff is not right. In this case, all the thalasso facilitiesand the staff interaction must be taken into account by man-agers to increase the tourist delight. Today’s business is char-acterized by tough competition; consequently, the delivery ofa quality service becomes a fundamental element to attractand retain customers [27].
It is a contribution of the present work the proposal of amethodology to identify and evaluate objectively and throughthe opinion about the different services offered by thalasso-therapy if the tourists’ status was of satisfaction or had arrivedat delight. This is a matter of great importance if we take intoaccount that, as it has been indicated throughout this work,when a customer moves from satisfaction to delight, he
BaggingBoosting
ROC curves
Specificity1.0 0.8 0.6 0.4 0.2 0.0
0.0
0.2
0.4
0.6
0.8
1.0
Sens
itivi
ty
Figure 4: ROC curves.
9Complexity
contributes to greater profitability to the company, increasesits fidelity, and improves its word of mouth [53, 60].
The methodology developed is based on the use of assem-bled classification trees, specifically with the methods of bag-ging and boosting. Also, from the comparison of the resultsobtained with both methods, it was observed that the assem-bly with boosting provided better results. The great use ofmachine learning is in situations where the variables arerelated in a highly nonlinear way. Besides, it is also an aca-demic contribution of this work that the proposed model, ifit is frequently fed, can maintain the classifications updatedwith the tastes of the clients and the conditions of the serviceprovided. So, this kind of artificial intelligence (AI) can makecontinuous evaluations as we mentioned in the theoreticalbackground of this paper.
Regarding the main weaknesses of the present study, itis worth mentioning that a cross-sectional methodologywas used, thus increasing the probability of the study beingbiased due to the use of a single method/data source. Anotherlimitation is determined by the technique used, structuralequations, which assumes a linearity of the relationshipsbetween latent variables [77].
6. Conclusions
This work demonstrates, confirming what has been found inprevious literature [55, 59, 68], that global satisfaction isrelated to the different experiences provided by the service.Thus, all hypotheses are accepted, supporting the hypothesesthat relate the pool, the staff, the treatments, and the environ-ment to satisfaction. In addition, the hypotheses that link sat-isfaction with the wom are also supported. This theoreticalimplication has important practical implications for man-agers of the type of facilities such as those studied in thispaper, since it shows that it is not enough to do well in oneof the services provided if the environment or the interactionwith the staff is not right. In this way, managers could have atool that could inform them about which aspects of the busi-ness are contributing to a better satisfaction and delight of theclients. In this sense, they can establish corrective actions toimprove these variables. In addition, the system can be fedwith new data so that managers could always have up-to-date information on which of the services provided contrib-utes more, at each moment, to the satisfaction of customers.This is in line with the constant feedback that authors like Lu
Impo
rtan
ce
50
40
30
20
10
0
EnvironmentStaff
PoolTreatment
Importances bagging 70% train
(a)
Impo
rtan
ce
50
40
30
20
10
0
EnvironmentStaff
PoolTreatment
Importances boosting 70% train
(b)
Figure 5: Importance of each of the variables studied for classification.
Table 7: Means of the importance, standard deviations, and Student t for bagging and boosting.
Bagging
Environment Staff Pool Treatment
Mean importances 20.272∗∗ 50.865∗∗∗ 10.778∗ 18.085∗∗
SD importances 7.765 9.501 4.207 6.504
t 2.611 5.354 2.562 2.780
Boosting
Boosting Environment Staff Pool Treatment
Mean importances 16.499∗∗∗ 39.071∗∗∗ 14.129∗∗∗ 30.302∗∗∗
SD importances 3.360 4.513 2.732 4.467
t 4.910 8.657 5.172 6.783
Bootstrap-t (based on t(998) two-tailed test); t(0.001;998) = 3.300; t(0.01;998) = 2.581; t(0.05;998) = 1.962; ∗∗∗p < 0 001; ∗∗p < 0 01; ∗p < 0 05; ns nonsignificant.
10 Complexity

et al. [17] andMohsin and Lockyer [18] consider necessary inbusiness nowadays. This issue is relevant because in this typeof business, the pleasures of customers can change quickly forvarious issues such as the emergence of new treatments bothin the cabin and in the pool or the appearance of new com-petitors with modern facilities. The conditions in which theservice is provided may change, due to deterioration of thefacilities, personnel changes or behavior, etc. All this is ofgreat importance since the service companies have becomeincreasingly clear that they must focus on the client sideand that the quality of the service is a differentiator on theroad to success [27]. In this way, Sivadas and Jindal [15] statethat those responsible for marketing in the tourism sectormust understand better the factors that drive the intentionof wom if they wish to develop effective marketing strategies.Moreover, this is even more important taking into accountthat the growth of the power of wom comes from the increas-ing use of social networks [107].
Finally, as far as possible future lines of research areconcerned, it has been considered that it would be interest-ing to go deeper into the search for a shorter scale to mea-sure satisfaction with the different services provided by thehotel, as well as to study if there are cultural differencesbetween the various nationalities in order to reach delightfor the service received.
Data Availability
The data used to support the findings of this study areincluded within the article.
Conflicts of Interest
The authors declare that they have no conflicts of interest.
References
[1] K. H. Chen, F. H. Chang, and F. Y. Liu, “Wellness tour-ism among seniors in Taiwan: previous experience, serviceencounter expectations, organizational characteristics,employee characteristics, and customer satisfaction,” Sus-tainability, vol. 7, no. 8, pp. 10576–10601, 2015.
[2] H. Mueller and E. L. Kaufmann, “Wellness tourism: marketanalysis of a special health tourism segment and implicationsfor the hotel industry,” Journal of Vacation Marketing, vol. 7,no. 1, pp. 5–17, 2001.
[3] L. Puczkó and M. Bachvarov, “Spa, bath, thermae: what’sbehind the labels?,” Tourism Recreation Research, vol. 31,no. 1, pp. 83–91, 2006.
[4] E. Alén, P. De Carlos, and T. Domínguez, “An analysis of dif-ferentiation strategies for Galician thermal centres,” CurrentIssues in Tourism, vol. 17, no. 6, pp. 499–517, 2014.
[5] M. Goodarzi, N. Haghtalab, and E. Shamshiry, “Wellnesstourism in Sareyn, Iran: resources, planning and develop-ment,” Current Issues in Tourism, vol. 19, no. 11, pp. 1071–1076, 2016.
[6] D. Dimitrovski and A. Todorović, “Clustering wellness tour-ists in spa environment,” Tourism Management Perspectives,vol. 16, pp. 259–265, 2015.
[7] P. Erfurt-Cooper and M. Cooper, Health and Wellness Tour-ism, Channel View Publications, Bristol, 2009.
[8] M. Bennett, B. King, and L. Milner, “The health resort sec-tor in Australia: a positioning study,” Journal of VacationMarketing, vol. 10, no. 2, pp. 122–137, 2004.
[9] M. Wray, J. Laing, and C. Voigt, “Byron Bay: an alternatehealth and wellness destination,” Journal of Hospitality andTourism Management, vol. 17, no. 1, pp. 158–166, 2010.
[10] N. A. Valentine, “Wellness tourism: using tourists’ prefer-ences to evaluate the wellness tourism market in Jamaica,”Review of Social Sciences, vol. 1, no. 3, 2016.
[11] M. R. Ortiz, “Orígenes y fundamentos de la talasoterapia,”Revista de La Facultad de Ciencias, vol. 2, p. 12, 2004,http://www.uax.es/publicacion/origenes-y-fundamentos-de-la-talasoterapia.pdf.
[12] Abalnearios, “Abalnearios,” 2016, July 2016, http://www.abalnearios.com/talasoterapia/.
[13] T. Y. Choi and R. Chu, “Determinants of hotel guests’ satis-faction and repeat patronage in the Hong Kong hotel indus-try,” International Journal of Hospitality Management,vol. 20, no. 3, pp. 277–297, 2001.
[14] Z. Zhang, M. Jiang, and X. Li, “Refining the relationshipbetween attribute performance and customer satisfaction inthe Chinese hospitality industry,” Total Quality Managementand Business Excellence, vol. 24, no. 11-12, pp. 1364–1375,2013.
[15] E. Sivadas and R. P. Jindal, “Alternative measures of satisfac-tion and word of mouth,” Journal of Services Marketing,vol. 31, no. 2, pp. 119–130, 2017.
[16] R. Rajaguru and N. Hassanli, “The role of trip purpose andhotel star rating on guests’ satisfaction and WOM,” Interna-tional Journal of Contemporary Hospitality Management,vol. 30, no. 5, pp. 2268–2286, 2018.
[17] C. Lu, C. Berchoux, M. W. Marek, and B. Chen, “Servicequality and customer satisfaction: qualitative research impli-cations for luxury hotels,” International Journal of Culture,Tourism, and Hospitality Research, vol. 9, no. 2, pp. 168–182, 2015.
[18] A. Mohsin and T. Lockyer, “Customer perceptions of servicequality in luxury hotels in New Delhi, India: an exploratorystudy,” International Journal of Contemporary HospitalityManagement, vol. 22, no. 2, pp. 160–173, 2010.
[19] E. N. Torres, “Deconstructing service quality and customersatisfaction: challenges and directions for future research,”Journal of Hospitality Marketing and Management, vol. 23,no. 6, pp. 652–677, 2014.
[20] R. Hallak, G. Assaker, and R. El-Haddad, “Re-examining therelationships among perceived quality, value, satisfaction,and destination loyalty: a higher-order structural model,”Journal of Vacation Marketing, vol. 24, no. 2, pp. 118–135,2018.
[21] A. Parasuraman, V. Zeithaml, and L. Berry, “SERVQUAL—amultiple-item scale for measuring consumer perceptions ofservice quality,” Journal of Retailing, vol. 64, no. 1, pp. 12–37, 1988.
[22] C. Ryan, “Seeking quality in Pacific tourism,” in Tourism inthe Pacific: Issues and Cases, C. M. Hall and S. J. Page, Eds.,pp. 146–160, International Thomson Business Press, London,England, 1996.
[23] G. Prayag, “Tourists’ evaluations of destination image,satisfaction, and future behavioral intentions—the case of
11Complexity

Mauritius,” Journal of Travel & Tourism Marketing, vol. 26,no. 8, pp. 836–853, 2009.
[24] B. Meng and H. Han, “Working-holiday tourism attributesand satisfaction in forming word-of-mouth and revisit inten-tions: impact of quantity and quality of intergroup contact,”Journal of Destination Marketing & Management, vol. 9,pp. 347–357, 2018.
[25] E. W. Anderson, C. Fornell, and D. R. Lehmann, “Customersatisfaction, market share, and profitability: findings fromSweden,” Journal of Marketing, vol. 58, no. 3, p. 53, 1994.
[26] L. C. Cong, “A formative model of the relationship betweendestination quality, tourist satisfaction and intentional loy-alty: an empirical test in Vietnam,” Journal of Hospitalityand Tourism Management, vol. 26, pp. 50–62, 2016.
[27] R. Ramamoorthy, A. Gunasekaran, M. Roy, B. K. Rai, andS. A. Senthilkumar, “Service quality and its impact on cus-tomers’ behavioural intentions and satisfaction: an empiricalstudy of the Indian life insurance sector,” Total Quality Man-agement & Business Excellence, vol. 29, no. 7-8, pp. 834–847,2016.
[28] E. F. Mathis, H. L. Kim, M. Uysal, J. M. Sirgy, and N. K.Prebensen, “The effect of co-creation experience on outcomevariable,” Annals of Tourism Research, vol. 57, pp. 62–75,2016.
[29] M. W. Liu and H. T. Keh, “Consumer delight and outrage:scale development and validation,” Journal of Service Theoryand Practice, vol. 25, no. 6, pp. 680–699, 2015.
[30] H.-H. S. Hu, J. Kandampully, and T. D. Juwaheer, “Relation-ships and impacts of service quality, perceived value, cus-tomer satisfaction, and image: an empirical study,” TheService Industries Journal, vol. 29, no. 2, pp. 111–125, 2009.
[31] G. H. G. McDougall and T. Levesque, “Customer satisfactionwith services: putting perceived value into the equation,”Journal of Services Marketing, vol. 14, no. 5, pp. 392–410,2000.
[32] J. Alegre and J. Garau, “Tourist satisfaction and dissatisfac-tion,” Annals of Tourism Research, vol. 37, no. 1, pp. 52–73,2010.
[33] F. Ali, “Service quality as a determinant of customer satisfac-tion and resulting behavioural intentions: a SEM approachtowards Malaysian resort hotels,” Tourism, vol. 63, no. 1,pp. 37–52, 2015.
[34] Y. Kim and J. Lee, “Relationship between corporate imageand customer loyalty in mobile communications service mar-kets,” Africa Journal of Business Management, vol. 4, no. 18,pp. 4035–4041, 2010.
[35] K. Ryu, H.-R. Lee, and W. G. Kim, “The influence of thequality of the physical environment, food, and service onrestaurant image, customer perceived value, customer satis-faction, and behavioral intentions,” International Journal ofContemporary Hospitality Management, vol. 24, no. 2,pp. 200–223, 2012.
[36] I. R. del Bosque and H. San Martín, “Tourist satisfaction acognitive-affective model,” Annals of Tourism Research,vol. 35, no. 2, pp. 551–573, 2008.
[37] Y. Yoon and M. Uysal, “An examination of the effects ofmotivation and satisfaction on destination loyalty: a struc-tural model,” Tourism Management, vol. 26, no. 1, pp. 45–56, 2005.
[38] R. A. Ganiyu, I. I. Uche, and A. O. Elizabeth, “Is customersatisfaction an indicator of customer loyalty?,” Australian
Journal of Business and Management Research, vol. 2,no. 7, pp. 14–20, 2012.
[39] K. Ifie, A. C. Simintiras, Y. Dwivedi, and V. Mavridou, “Howservice quality and outcome confidence drive pre-outcomeword-of-mouth,” Journal of Retailing and Consumer Services,vol. 44, pp. 214–221, 2018.
[40] M. Hultman, D. Skarmeas, P. Oghazi, and H. M. Beheshti,“Achieving tourist loyalty through destination personality,satisfaction, and identification,” Journal of Business Research,vol. 68, no. 11, pp. 2227–2231, 2015.
[41] Y. Wardi, A. Abror, and O. Trinanda, “Halal tourism: ante-cedent of tourist’s satisfaction and word of mouth (WOM),”Asia Pacific Journal of Tourism Research, vol. 23, no. 5,pp. 463–472, 2018.
[42] A. Marchand, T. Hennig-Thurau, and C. Wiertz, “Not alldigital word of mouth is created equal: understanding therespective impact of consumer reviews and microblogs onnew product success,” International Journal of Research inMarketing, vol. 34, no. 2, pp. 336–354, 2017.
[43] M. A. Saleem, A. Yaseen, and A. Wasaya, “Drivers ofcustomer loyalty and word of mouth intentions: moderatingrole of interactional justice,” Journal of Hospitality Marketingand Management, vol. 27, no. 8, pp. 877–904, 2018.
[44] A. M. Baker, N. Donthu, and V. Kumar, “Investigating howword-of-mouth conversations about brands influence pur-chase and retransmission intentions,” Journal of MarketingResearch, vol. 53, no. 2, pp. 225–239, 2016.
[45] R. Oliver, “Measurement and evaluation of satisfaction pro-cesses in retail settings,” Journal of Retailing, vol. 57, no. 3,pp. 25–48, 1981.
[46] A. Pizam, V. Shapoval, and T. Ellis, “Customer satisfactionand its measurement in hospitality enterprises: a revisit andupdate,” International Journal of Contemporary HospitalityManagement, vol. 28, no. 1, pp. 2–35, 2017.
[47] S. R. Swanson and M. K. Hsu, “The effect of recovery locusattributions and service failure severity on word-of-mouthand repurchase behaviors in the hospitality industry,” Journalof Hospitality & Tourism Research, vol. 35, no. 4, pp. 511–529, 2011.
[48] G. Tripathi, “Customer satisfaction and word of mouthintentions: testing the mediating effect of customer loyalty,”Journal of Services Research, vol. 17, no. 2, pp. 1–16, 2018.
[49] M. Amin, Z. Yahya, W. F. A. Ismayatim, S. Z. Nasharuddin,and E. Kassim, “Service quality dimension and customer sat-isfaction: an empirical study in the Malaysian hotel industry,”Services Marketing Quarterly, vol. 34, no. 2, pp. 115–125,2013.
[50] G. Dominici and R. Guzzo, “Customer satisfaction in thehotel industry: a case study from Sicily,” InternationalJournal of Marketing Studies, vol. 2, no. 2, pp. 3–12, 2010.
[51] I. K. W. Lai and M. Hitchcock, “Local reactions to masstourism and community tourism development in Macau,”Journal of Sustainable Tourism, vol. 25, no. 4, pp. 451–470, 2016.
[52] E. N. Torres, X. Fu, and X. Lehto, “Are there gender differ-ences in what drives customer delight?,” Tourism Review,vol. 69, no. 4, pp. 297–309, 2014.
[53] E. N. Torres and S. Kline, “From customer satisfaction to cus-tomer delight: creating a new standard of service for the hotelindustry,” International Journal of Contemporary HospitalityManagement, vol. 25, no. 5, pp. 642–659, 2013.
12 Complexity
[54] J. C. Crotts and V. P. Magnini, “Is Surprise Essential?,”Annals of Tourism Research, vol. 38, no. 2, pp. 719–722, 2011.
[55] J. Ma, J. Gao, N. Scott, and P. Ding, “Customer delight fromtheme park experiences,” Annals of Tourism Research,vol. 42, pp. 359–381, 2013.
[56] S. M. C. Loureiro, F. J. Miranda, and M. Breazeale, “Whoneeds delight?,” Journal of Service Management, vol. 25,no. 1, pp. 101–124, 2014.
[57] A. Finn, “Customer delight: distinct construct or zone of non-linear response to customer satisfaction?,” Journal of ServiceResearch, vol. 15, no. 1, pp. 99–110, 2012.
[58] J. Füller and K. Matzler, “Customer delight and marketsegmentation: an application of the three-factor theory ofcustomer satisfaction on life style groups,” Tourism Manage-ment, vol. 29, no. 1, pp. 116–126, 2008.
[59] C. H. Chandler, “Quality: beyond customer satisfaction,”Quality Progress, vol. 22, no. 30–32, 1989.
[60] B. Berman, “How to delight your customers,” CaliforniaManagement Review, vol. 48, no. 1, pp. 129–151, 2005.
[61] M. J. Arnold, K. E. Reynolds, N. Ponder, and J. E. Lueg,“Customer delight in a retail context: investigating delightfuland terrible shopping experiences,” Journal of BusinessResearch, vol. 58, no. 8, pp. 1132–1145, 2005.
[62] R. T. Rust and R. L. Oliver, “Should we delight the customer?,”Journal of the Academy of Marketing Science, vol. 28, no. 1,pp. 86–94, 2000.
[63] M. W. Alexander, “Customer delight: a review,” Academy ofMarketing Studies Journal, vol. 50, no. 5, pp. 535–545, 2010.
[64] S. Denning, “The essential metric of customer capitalism iscustomer outcomes,” Strategy & Leadership, vol. 39, no. 4,pp. 12–18, 2011.
[65] R. Oliver and W. S. DeSarbo, “Processing of the satisfac-tion response in consumption: a suggested framework andresearch propositions,” Journal of Consumer Satisfaction,Dissatisfaction and Complaining Behavior, vol. 2, no. 1,pp. 1–16, 1989.
[66] E. N. Torres and S. Kline, “From satisfaction to delight:a model for the hotel industry,” International Journal of Con-temporary Hospitality Management, vol. 18, no. 4, pp. 290–301, 2006.
[67] J. L. H. Bowden and T. S. Dagger, “To delight or not todelight? An investigation of loyalty formation in the restau-rant industry,” Journal of Hospitality Marketing & Manage-ment, vol. 20, no. 5, pp. 501–524, 2011.
[68] F. Ali, W. G. Kim, J. Li, and H.-M. Jeon, “Make it delightful:customers’ experience, satisfaction and loyalty in Malaysiantheme parks,” Journal of Destination Marketing & Manage-ment, vol. 7, pp. 1–11, 2018.
[69] Gloria Thalasso & Hotels, Thalasso Gloria—San Agustín,2016, July 2016, http://www.gloriapalaceth.com/hoteles/gloria-palace-san-agustin-thalasso-hotel/thalasso/.
[70] R. Sierra Bravo, Técnicas de investigación social. Teoría yejercicios, Paraninfo, Madrid, 1991.
[71] HuangSongshan (Sam), A. Afsharifar, and R. van der Veen,“Examining the moderating role of prior knowledge in therelationship between destination experiences and tourist sat-isfaction,” Journal of Vacation Marketing, vol. 22, no. 4,pp. 320–334, 2016.
[72] I. P. Riquelme, S. Román, and D. Iacobucci, “Consumers’ per-ceptions of online and offline retailer deception: a moderated
mediation analysis,” Journal of Interactive Marketing, vol. 35,pp. 16–26, 2016.
[73] Y. Rosseel, “Lavaan: an R package for structural equationmodeling,” Journal of Statistical Software, vol. 48, no. 2,pp. 1–36, 2012.
[74] E. Alfaro, M. Gamez, and N. García, “Adabag: an R packagefor classification with boosting and bagging,” Journal of Sta-tistical Software, vol. 54, no. 2, pp. 1–35, 2013.
[75] L. Y. Leong, T. S. Hew, V. H. Lee, and K. B. Ooi, “An SEM-artificial-neural-network analysis of the relationshipsbetween SERVPERF, customer satisfaction and loyaltyamong low-cost and full-service airline,” Expert Systems withApplications, vol. 42, no. 19, pp. 6620–6634, 2015.
[76] A.-C. Teo, G. W.-H. Tan, K.-B. Ooi, T.-S. Hew, andK.-T. Yew, “The effects of convenience and speed in m-pay-ment,” Industrial Management & Data Systems, vol. 115,no. 2, pp. 311–331, 2015.
[77] J. F. Hair, W. Black, and B. Balbin, Multivariate Data Analy-sis: A Global Perspective, Prentice Hall, Upper Saddle River,NJ, USA, 7th ed. edition, 2010.
[78] L. Y. Leong, T. S. Hew, G. W. H. Tan, and K. B. Ooi,“Predicting the determinants of the NFC-enabled mobilecredit card acceptance: a neural networks approach,” ExpertSystems with Applications, vol. 40, no. 14, pp. 5604–5620,2013.
[79] C.-J. Wang, H.-T. Tsai, and M.-T. Tsai, “Linking transforma-tional leadership and employee creativity in the hospitalityindustry: the influences of creative role identity, creativeself-efficacy, and job complexity,” Tourism Management,vol. 40, pp. 79–89, 2014.
[80] M. K. Cabrera-Suárez, M. D. L. C. Déniz-Déniz, and J. D.Martín-Santana, “The setting of non-financial goals in thefamily firm: the influence of family climate and identifica-tion,” Journal of Family Business Strategy, vol. 5, no. 3,pp. 289–299, 2014.
[81] F. T. S. Chan and A. Y. L. Chong, “A SEM-neural networkapproach for understanding determinants of interorganiza-tional system standard adoption and performances,”DecisionSupport Systems, vol. 54, no. 1, pp. 621–630, 2012.
[82] K. K. F. So, C. King, B. A. Sparks, and Y. Wang, “The roleof customer engagement in building consumer loyalty totourism brands,” Journal of Travel Research, vol. 55, no. 1,pp. 64–78, 2015.
[83] J. C. Anderson and D. W. Gerbing, “Structural equationmodeling in practice: a review and recommended two-stepapproach,” Psychological Bulletin, vol. 103, no. 3, pp. 411–423, 1988.
[84] J. F. Hair, G. T. Hult, C. M. Ringle, and M. Sarstedt, A Primeron Partial Least Squares Structural Equation Modeling (PLS-SEM), SAGE, Thousand Oaks CA, USA, 2014.
[85] J. L. Roldán and M. J. Sánchez-Franco, “Variance-basedstructural equation modeling: guidelines for using partialleast squares in information systems research,” in ResearchMethodologies, Innovations and Philosophies in SoftwareSystems Engineering and Information Systems, M. Mora,A. Steenkamp, L. Johnston, and J. Gamon, Eds., pp. 193–221, Information Science Reference, Hershey, PA, USA,2012.
[86] C. Fornell and D. F. Larcker, “Evaluating structural equationmodels with unobservable variables and measurement error,”Journal of Marketing Research, vol. 18, no. 1, pp. 39–50, 1981.
13Complexity

[87] W. W. Chin, “Issues and opinion on structural equationmodeling,” MIS Quarterly, vol. 22, no. 1, pp. 7–16, 1998.
[88] P. Bertea and A. Zait, “Methods for testing discriminantvalidity,” Management & Marketing Journal, vol. 9, no. 2,pp. 217–224, 2011.
[89] J. Henseler, C. M. Ringle, and M. Sarstedt, “A new crite-rion for assessing discriminant validity in variance-basedstructural equation modeling,” Journal of the Academy ofMarketing Science, vol. 43, no. 1, pp. 115–135, 2015.
[90] J. F. Hair, G. T. M. Hult, C. Ringle, and M. Sarstedt, APrimer on Partial Least Squares Structural EquationModeling (PLS-SEM), SAGE Publications, Thousand Oaks,CA, USA, 2016.
[91] A. Satorra, “Power of χ2 goodness-of-fit test in structuralequation models: the case of non-normal data,” in NewDevelopments of Psychometrics, H. Yanai, A. Okada, K. Shige-masu, Y. Kano, and J. Meulman, Eds., pp. 57–68, Springer,Tokyo, 2003.
[92] A. Satorra and P. M. Bentler, “A scaled difference chi-squaretest statistic for moment structure analysis,” Psychometrika,vol. 66, no. 4, pp. 507–514, 2001.
[93] E. Bauer and R. Kohavi, “An empirical comparison of votingclassification algorithms: bagging, boosting, and variants,”Machine Learning, vol. 36, no. 1/2, pp. 105–139, 1999.
[94] T. G. Dietterich, “Ensemble methods in machine learning,” inMultiple Classifier Systems, pp. 1–15, Springer, Berlin, Heidel-berg, 2000.
[95] M. Galar, A. Fernandez, E. Barrenechea, H. Bustince, andF. Herrera, “A review on ensembles for the class imbalanceproblem: bagging-, boosting-, and hybrid-based approaches,”IEEE Transactions on Systems, Man, and Cybernetics, Part C(Applications and Reviews), vol. 42, no. 4, pp. 463–484, 2012.
[96] S. B. Kotsiantis, “Supervised machine learning: a review ofclassification techniques,” Informatica, vol. 31, pp. 249–268,2007.
[97] T. G. Dietterich, “An experimental comparison of threemethods for constructing ensembles of decision trees,”Machine Learning, vol. 40, no. 2, pp. 139–157, 2000.
[98] M. Chrzanowska, E. Alfaro, and D.Witkowska, “The individ-ual borrowers recognition: single and ensemble trees,” ExpertSystems with Applications, vol. 36, no. 3, pp. 6409–6414, 2009.
[99] M. A. King, A. S. Abrahams, and C. T. Ragsdale, “Ensemblelearning methods for pay-per-click campaign management,”Expert Systems with Applications, vol. 42, no. 10, pp. 4818–4829, 2015.
[100] A.-H. Homaie-Shandizi, V. P. Nia, M. Gamache, andB. Agard, “Flight deck crew reserve: from data to forecasting,”Engineering Applications of Artificial Intelligence, vol. 50,pp. 106–114, 2016.
[101] J. N. Morgan and J. A. Sonquist, “Problems in the analysis ofsurvey data, and a proposal,” Journal of the American Statis-tical Association, vol. 58, no. 302, pp. 415–434, 1963.
[102] L. Breiman, J. Friedman, R. Olshen, and C. Stone, Classifica-tion and Regression Trees, Wadsworth & Brooks, WadsworthInternational Group, Monterey, CA, USA, 1984.
[103] C. F. Tsai and Y. J. Chiou, “Earnings management prediction:a pilot study of combining neural networks and decisiontrees,” Expert Systems with Applications, vol. 36, no. 3,pp. 7183–7191, 2009.
[104] G. Shmueli, N. Patel, and P. Bruce, Data Mining for BusinessIntelligence: Concepts, Techniques, and Applications in
Microsoft Office Excel with XLMiner, Wiley, Hoboken, N.J,USA, 2010.
[105] A. P. Bradley, “The use of the area under the ROC curvein the evaluation of machine learning algorithms,” PatternRecognition, vol. 30, no. 7, pp. 1145–1159, 1997.
[106] D. G. Altman and J. M. Bland, “Statistics notes: diagnostictests 1: sensitivity and specificity,” BMJ, vol. 308, no. 6943,article 1552, 1994.
[107] S. Gopinath, P. K. Chintagunta, and S. Venkataraman,“Blogs, advertising, and local-market movie box office perfor-mance,”Management Science, vol. 59, no. 12, pp. 2635–2654,2013.
14 Complexity

Hindawiwww.hindawi.com Volume 2018
MathematicsJournal of
Hindawiwww.hindawi.com Volume 2018
Mathematical Problems in Engineering
Applied MathematicsJournal of
Hindawiwww.hindawi.com Volume 2018
Probability and StatisticsHindawiwww.hindawi.com Volume 2018
Journal of
Hindawiwww.hindawi.com Volume 2018
Mathematical PhysicsAdvances in
Complex AnalysisJournal of
Hindawiwww.hindawi.com Volume 2018
OptimizationJournal of
Hindawiwww.hindawi.com Volume 2018
Hindawiwww.hindawi.com Volume 2018
Engineering Mathematics
International Journal of
Hindawiwww.hindawi.com Volume 2018
Operations ResearchAdvances in
Journal of
Hindawiwww.hindawi.com Volume 2018
Function SpacesAbstract and Applied AnalysisHindawiwww.hindawi.com Volume 2018
International Journal of Mathematics and Mathematical Sciences
Hindawiwww.hindawi.com Volume 2018
Hindawi Publishing Corporation http://www.hindawi.com Volume 2013Hindawiwww.hindawi.com
The Scientific World Journal
Volume 2018
Hindawiwww.hindawi.com Volume 2018Volume 2018
Numerical AnalysisNumerical AnalysisNumerical AnalysisNumerical AnalysisNumerical AnalysisNumerical AnalysisNumerical AnalysisNumerical AnalysisNumerical AnalysisNumerical AnalysisNumerical AnalysisNumerical AnalysisAdvances inAdvances in Discrete Dynamics in
Nature and SocietyHindawiwww.hindawi.com Volume 2018
Hindawiwww.hindawi.com
Di�erential EquationsInternational Journal of
Volume 2018
Hindawiwww.hindawi.com Volume 2018
Decision SciencesAdvances in
Hindawiwww.hindawi.com Volume 2018
AnalysisInternational Journal of
Hindawiwww.hindawi.com Volume 2018
Stochastic AnalysisInternational Journal of
Submit your manuscripts atwww.hindawi.com


![WELLNESS THALASSO LAS SIRENAS [promo 2012]](https://static.fdocuments.in/doc/165x107/568c4db11a28ab4916a4f000/wellness-thalasso-las-sirenas-promo-2012.jpg)