
Predicting Software Defectiveness through Network Analysisceur-ws.org/Vol-1820/paper-04.pdf ·...
12
Predicting Software Defectiveness through Network Analysis ⇤ Matteo Orr´ u [email protected] + Cristina Monni [email protected] ⇤ Michele Marchesi [email protected] ⇤ Giulio Concas [email protected] ⇤ Roberto Tonelli [email protected] ⇤ Department of Electrical and Electronic Engineering (DIEE) University of Cagliari Piazza D’Armi, 09123 Cagliari (Italy) + Faculty of Informatics University of Lugano Via Giuseppe Buffi, 13 Lugano, Switzerland 6900 Abstract We used a complex network approach to study the evolution of a large software system, Eclipse, with the aim of statistically charac- terizing software defectiveness along the time. We studied the software networks associated to several releases of the system, focusing our attention specifically on their community structure, modularity and clustering coeffi- cient. We found that the maximum average defect density is related, directly or indirectly, to two di↵erent metrics: the number of de- tected communities inside a software network and the clustering coefficient. These two rela- tionships both follow a power-law distribution which leads to a linear correlation between clustering coefficient and number of communi- ties. These results can be useful to make pre- dictions about the evolution of software sys- tems, especially with respect to their defec- tiveness. Copyright c 2015 by the paper’s authors. Copying permitted for private and academic purposes. This volume is published and copyrighted by its editors. In: A.H. Bagge, T. Mens (eds.): Postproceedings of SATToSE 2015 Seminar on Advanced Techniques and Tools for Software Evolution, University of Mons, Belgium, 6-8 July 2015, published at http://ceur-ws.org 1 Introduction Modern software systems are large and complex prod- ucts, built according to a modular structure, where modules (like classes in object oriented systems) are connected with each other to enable software reuse, en- capsulation, information hiding, maintainability and so on. Software modularization is acknowledged as a good programming practice [Par72, BC99, SM96] and a certain emphasis is put on the prescription that design software with low coupling and high cohesion would increase its quality [CK94]. In this work we present a study on the relationships between the qual- ity of software systems and their modular structure. To perform this study we used an approach based on the concept of complex networks. Due to the fact that software systems are inher- ently complex, the best model to represent them is by retrieving their associated networks [Mye03, ˇ SB11, WKD07, ˇ S ˇ ZBB15, ZN08]. In other words, in a soft- ware network, nodes can be associated to software modules (e.g. classes) and edges can be associated to connections between software modules (e.g. inher- itance, collaboration relationships). We investigated the software modular structure - and its impact on software defectiveness - by studying specific network properties: community structure, modularity and clus- tering coefficient. A community inside a network is a subnetwork formed by nodes that are densely connected if com- pared to nodes outside the community [GN01]. Mod-
Transcript of Predicting Software Defectiveness through Network Analysisceur-ws.org/Vol-1820/paper-04.pdf ·...
Predicting Software Defectiveness through Network
Analysis
⇤Matteo [email protected]
+Cristina [email protected]
⇤Michele [email protected]
⇤Giulio [email protected]
⇤Roberto [email protected]
⇤Department of Electrical and Electronic Engineering (DIEE)University of Cagliari
Piazza D’Armi, 09123 Cagliari (Italy)
+ Faculty of InformaticsUniversity of LuganoVia Giuseppe Bu�, 13
Lugano, Switzerland 6900
Abstract
We used a complex network approach tostudy the evolution of a large software system,Eclipse, with the aim of statistically charac-terizing software defectiveness along the time.We studied the software networks associatedto several releases of the system, focusingour attention specifically on their communitystructure, modularity and clustering coe�-cient. We found that the maximum averagedefect density is related, directly or indirectly,to two di↵erent metrics: the number of de-tected communities inside a software networkand the clustering coe�cient. These two rela-tionships both follow a power-law distributionwhich leads to a linear correlation betweenclustering coe�cient and number of communi-ties. These results can be useful to make pre-dictions about the evolution of software sys-tems, especially with respect to their defec-tiveness.
Copyright
c� 2015 by the paper’s authors. Copying permitted
for private and academic purposes. This volume is published
and copyrighted by its editors.
In: A.H. Bagge, T. Mens (eds.): Postproceedings of SATToSE2015 Seminar on Advanced Techniques and Tools for SoftwareEvolution, University of Mons, Belgium, 6-8 July 2015,published at http://ceur-ws.org
1 Introduction
Modern software systems are large and complex prod-ucts, built according to a modular structure, wheremodules (like classes in object oriented systems) areconnected with each other to enable software reuse, en-capsulation, information hiding, maintainability andso on. Software modularization is acknowledged asa good programming practice [Par72, BC99, SM96]and a certain emphasis is put on the prescription thatdesign software with low coupling and high cohesionwould increase its quality [CK94]. In this work wepresent a study on the relationships between the qual-ity of software systems and their modular structure.To perform this study we used an approach based onthe concept of complex networks.
Due to the fact that software systems are inher-ently complex, the best model to represent them isby retrieving their associated networks [Mye03, SB11,WKD07, SZBB15, ZN08]. In other words, in a soft-ware network, nodes can be associated to softwaremodules (e.g. classes) and edges can be associatedto connections between software modules (e.g. inher-itance, collaboration relationships). We investigatedthe software modular structure - and its impact onsoftware defectiveness - by studying specific networkproperties: community structure, modularity and clus-tering coe�cient.
A community inside a network is a subnetworkformed by nodes that are densely connected if com-pared to nodes outside the community [GN01]. Mod-

ularity is a function that measures how marked is acommunity structure, namely the way the nodes arearranged in communities [NG04]. The clustering coef-ficient is a measure of connectedness among the nodesof a network [New03].
We studied several releases of a large software sys-tem, Eclipse, performing a longitudinal analysis of therelationship between community structure, clusteringcoe�cient and software defectiveness. Our aim is tofigure out if the studied metrics can be used to bet-ter understand the evolution of software defectivenessalong the time and to predict the defectiveness of fu-ture releases. The results shown in this paper are partof a more extensive research on di↵erent Java projects,which is currently under consolidation. The aim of theauthors is to show eventually that the results presentedin this work are valid also for other extensively usedJava projects.
This paper is organized as follows. In Section 2we review some recent literature on software networkanalysis, community structure and defect prediction.In Section 3 we introduce some background conceptstaken from the research on complex networks, whereasin Section 4 we thoroughly report the adopted metricsand the methodology. In Section 5 we present some ofour results and discuss them in Section 6. In Section 7we illustrate the threats to validity and in Section 8 wedraw some conclusions and outline the future work.
2 Related Work
Being software systems often large and complex, one ofthe best candidates to represent them is the complexnetwork [FMS01], [Mye03], [TCM+11]. Many softwarenetworks, like class diagrams [RS02, VS03], collabo-ration graph [Mye03], package dependencies networks[CL04], have already been shown to present the typi-cal properties of complex networks [BAJ00], such asfractal and self-similar features [TMT12], scale free[CS05], and small world properties, and consequentlypower law distributions for the node degree, for thebugs [CMM+11] and for refactored classes [MTM+12].
Modelling a software system as a complex networkhas been shown to have many applications to the studyof failures and defects. For example, Wen [WKD07] re-ported that scale-free software networks could be morerobust if compared to random failures. Other meth-ods have been applied to understand the relationshipbetween number of defects and LOC [Zha09], while inOstrand et al. a negative binomial regression modelis used to show that the majority of bugs is containedonly in a fraction of the files (20%) [OWB05].
So far many other methods have been tried for bugprediction [DLR10, HBB+12], especially using depen-dency graphs [NAH10, ZN08], but only recently many
researchers focused their attention on the communitystructure as defined in social network analysis, namelythe division in subgroups of nodes among which thereis a high density of connections if compared to nodesthat are outside the community [NG04]. Being moreconnected, elements belonging to the same communitymight represent functional units or software modules,leading to practical applications of the community de-tection in the software engineering field. Communitydetection is usually performed with methods like hier-archical clustering and partitional clustering [For10].
Newman et al. proposed some algorithms for com-munity detection [NG04, New04, CNM04], which arenow extensively used in the literature, along with thedefinition modularity, a quality function which mea-sures the strength of a network partition in communi-ties [NG04]. In this work we use one of the algorithmsproposed by Newman et al. to understand if such di-vision can be related to software modularity as definedin software engineering and, eventually, if the commu-nity metrics may be useful to predict bugs in futurereleases. The issue of community structure and its ap-plication to software engineering has been recently ad-dressed in a similar fashion by Subelj and Bajek. Theauthors applied some community detection algorithmsto several Java systems to show that their evident com-munity structure does not correspond to the packagestructure devised by the designer [SB11].
In this work we consider the concept of modular-ity used in software engineering, that is often asso-ciated to high values of cohesion and low values ofcoupling metrics [MMCG99, MM07, ASTC11]. Inthe literature there are previous attempts to use soft-ware network theory to characterize a modularityfunction and relate it to good programming prac-tice [MMCG99, MM07, ASTC11]. We show that amodularity function based on pure network topologycan be used to assess the goodness of a division in clus-ters, and it is related to the software engineering con-cept of the separation of components. Our work usesa methodology based on community structure, whichis very lightweight from the computational point ofview. We are also introducing for the first time someconcepts from social network analysis that allowed usto draw the same conclusions of the authors of theaforementioned papers, but getting also informationon the predictability of software defectiveness.
3 Modularity and Community
Structure
The concept of community derives from social net-works. Nodes belonging to the same community aredensely connected among each other, while they arepoorly connected with nodes which are not in the same

community. Inside a network, a community structureis the specific way in which the nodes are arranged incommunities [For10]. Since there can be more than onecommunity structure, we need a quantitative measureto evaluate the best division. The first and most usedmeasure is the modularity [NG04]. Although thereare some caveats to take into account while using it[GMC10, FB07], modularity is considered the stan-dard measure for the quality of a community struc-ture.
The original definition is based on the fact that arandom graph does not possess a community structure,hence providing a null model for comparison with thecommunity structure of real networks [NG04]. Con-sider a complex network of n nodes and m edges. Inorder to represent it we can use the following defini-tions:
• Adjacency matrix:
Avw =
⇢1 if v and w are joined0 otherwise,
(1)
where v and w are two nodes belonging to com-munities cv and cw;
• Number of edges:
m =1
2
X
vw
Avw, (2)
• Node degree, namely the number of its connectededges:
kv =X
w
Avw. (3)
If we postulate that nodes are grouped in communi-ties, then we can compute the fraction among within-community edges and across-communities edges. Inorder to have a significant community structure thisfraction has to be large. Given two communities cv
and cw, the latter fraction can be written as follows:P
vw Avw �(cv, cw)Pvw Avw
=1
2m
X
vw
Avw �(cv, cw), (4)
where �(cv, cw) is the Kronecker �. In order to obtaina reliable measure we need to compare the previousvalues to a null model. The most used null model is agraph with the same community structure but randomconnections among its nodes. The expected value ofthe fraction of edges attached to nodes in communityv and to nodes in community w, in the random casewould be given by:
1
2m
X
vw
kvkw
2m�(cv, cw). (5)
Subtracting (5) to (4), we get the modularity asdefined in Newman [New06]:
Q =1
2m
X
vw
⇣Avw � kvkw
2m
⌘�(cv, cw). (6)
A good community structure corresponds to valuesof Q as close as possible to 1. However, in real net-works, modularity values that reveal a good commu-nity structure fall in a range from 0.3 to 0.7 [NG04].Lower values are associated to a weak communitystructure, whereas strong community structures, al-though rare in practice, may have modularity valueshigher than 0.7 and approaching 1.
4 Experimental Setting
In this work we analyze the structure and evolutionof Eclipse IDE, a popular software system written inJava, using its associated software network. We firstretrieved the network associated to each software sys-tem - specifically to each subproject in which the majorsystem is structured, by parsing their source code re-trieved from their corresponding Source Control Man-ager (SCM), looking for relationships like collabora-tion, inheritance, etc. This way we obtained the net-works at class level where nodes are classes and edgesare the mentioned relationship among classes (i.e in-heritance, collaboration, etc.). Afterwards we anno-tated each class with the corresponding number ofbugs retrieved using the procedure described in thefollowing paragraph.
4.1 Retrieving Defectiveness Data
We considered the number of defects (bugs) as themain indicator of software quality. We collected dataabout the bugs of a software system by mining its as-sociated Bug Tracking Systems (BTS). Bugzilla is theBTS adopted by Eclipse, where defects are tagged witha unique ID number. An entry in BTS is called withthe common term ’Issue’, and there is usually no infor-mation about classes associated to defects. Usually allthe changes performed on the source code are reportedon the SCM. To obtain a correct mapping between Is-sue(s) and the related Java classes, we analyzed theSCM log messages, to identify commits associated tomaintenance operations where Issues are fixed.
We analyzed the text of commit messages, look-ing for Issue-IDs. Every positive integer number (in-cluding dates, release numbers, copyright updates, etc)might be a potential Issue-ID in the BTS. In order toavoid wrong mappings between a file and the corre-sponding Issue, we filtered out any number which didnot refer to bug fixes. This operation was performedby associating Issue-IDs to files belonging to the same
release, and analyzing the commit logs to performthe mapping between Issues and classes. We associ-ated to each release the Issues that are Bugs and thatwere classified as “closed” in BTS. In fact, very rarelyBugs which are labeled as “closed” are re-opened, thisway being permanently associated with a release. Themaintenance operations in Bugzilla are associated tofiles, called Compilation Units (CUs), which may con-tain one or more classes. Thus, in cases in which a filecontained more than one class, we decided to assignall the defects to the biggest class of those Compila-tion Units. At the end of this process we obtained anetwork where to each node is associated the numberof bugs of the corresponding class.
4.2 Metrics Analyzed
We computed the following metrics:
• System Size: the number of classes of the softwaresystem.
• Average Bug Number (ABN): or bug density,namely the number of defects found in a systemdivided by the number of classes.
• Modularity : a measure of the strength of the ob-tained community structure, as defined in Section3.
• Number of Communities (NOC): the number ofdisjoint communities in which the network is par-titioned.
• Clustering Coe�cient (CC): the average proba-bility that if vertex i is connected to vertex j andvertex j to vertex k, then the vertex i will alsobe connected to vertex k. It can be defined asfollows:
Ci =3⇥ number of triangles in the network
number of connected triples of nodes,
(7)
where a triangle is a set of three nodes all con-nected with each other, and a triple centeredaround node i is a set composed by two nodesconnected to node i and the node i itself.The clustering coe�cient for the whole graph isthe average of the Ci’s:
C =1
n
nX
i=1
Ci, (8)
where n is the number of nodes in the network[New03].
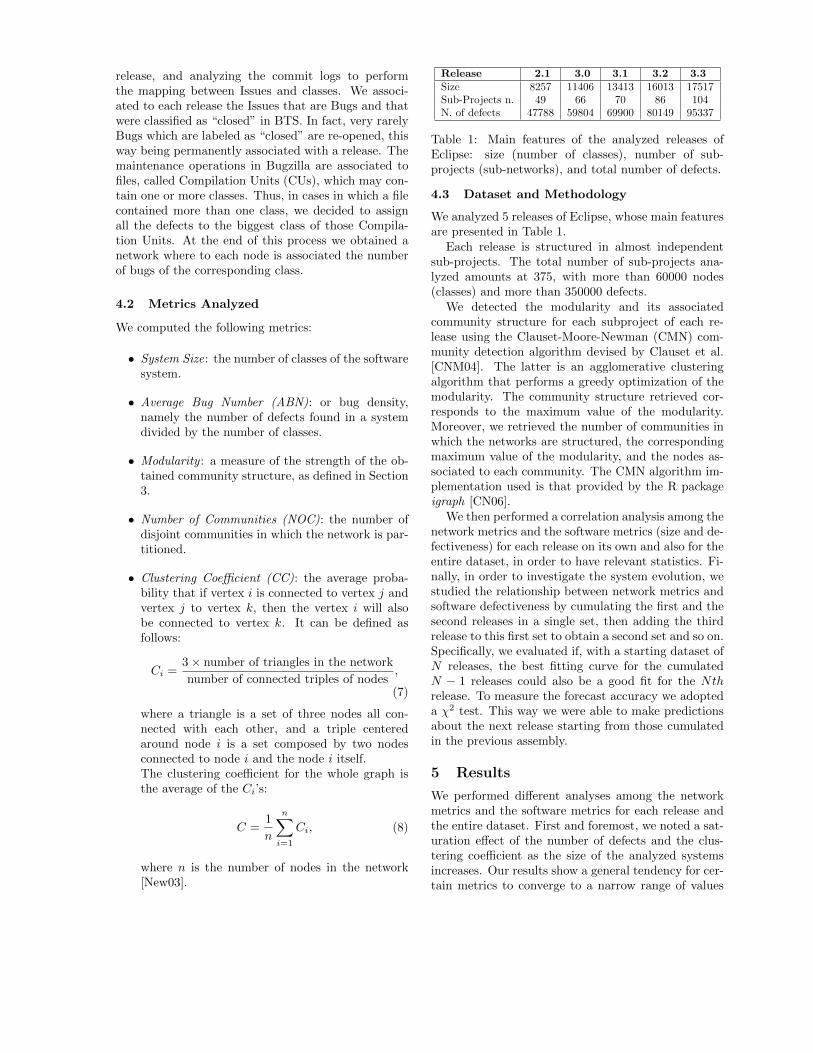
Release 2.1 3.0 3.1 3.2 3.3
Size 8257 11406 13413 16013 17517Sub-Projects n. 49 66 70 86 104N. of defects 47788 59804 69900 80149 95337
Table 1: Main features of the analyzed releases ofEclipse: size (number of classes), number of sub-projects (sub-networks), and total number of defects.
4.3 Dataset and Methodology
We analyzed 5 releases of Eclipse, whose main featuresare presented in Table 1.
Each release is structured in almost independentsub-projects. The total number of sub-projects ana-lyzed amounts at 375, with more than 60000 nodes(classes) and more than 350000 defects.
We detected the modularity and its associatedcommunity structure for each subproject of each re-lease using the Clauset-Moore-Newman (CMN) com-munity detection algorithm devised by Clauset et al.[CNM04]. The latter is an agglomerative clusteringalgorithm that performs a greedy optimization of themodularity. The community structure retrieved cor-responds to the maximum value of the modularity.Moreover, we retrieved the number of communities inwhich the networks are structured, the correspondingmaximum value of the modularity, and the nodes as-sociated to each community. The CMN algorithm im-plementation used is that provided by the R packageigraph [CN06].
We then performed a correlation analysis among thenetwork metrics and the software metrics (size and de-fectiveness) for each release on its own and also for theentire dataset, in order to have relevant statistics. Fi-nally, in order to investigate the system evolution, westudied the relationship between network metrics andsoftware defectiveness by cumulating the first and thesecond releases in a single set, then adding the thirdrelease to this first set to obtain a second set and so on.Specifically, we evaluated if, with a starting dataset ofN releases, the best fitting curve for the cumulatedN � 1 releases could also be a good fit for the Nth
release. To measure the forecast accuracy we adopteda �
2 test. This way we were able to make predictionsabout the next release starting from those cumulatedin the previous assembly.
5 Results
We performed di↵erent analyses among the networkmetrics and the software metrics for each release andthe entire dataset. First and foremost, we noted a sat-uration e↵ect of the number of defects and the clus-tering coe�cient as the size of the analyzed systemsincreases. Our results show a general tendency for cer-tain metrics to converge to a narrow range of values

0 500 1000 1500 2000 2500 30000
0.2
0.4
0.6
0.8
Eclipse
mo
du
larity
n. classes
Figure 1: Scatterplot of the modularity vs system’ssize (n. of classes) for all subprojects
0 1000 2000 30000
5
10
15
20
25
defe
ct d
ensi
ty
n. classes
Figure 2: Scatterplot of the defect density (or ABN)vs system’s size (n. of classes) for all subprojects.
when the number of classes increases.Figures 1, 2 and 3 show the relationship between
systems’ size (number of classes) and, respectively,modularity, average bug number (ABN) and clusteringcoe�cient (CC).
All the metrics display more or less the same behav-ior. For relatively small systems, where the number ofclasses is roughly below 100, the metrics assume val-ues in a wide range. Specifically, the defect density (orABN) ranges from 0 up to 25, the clustering coe�cientand the modularity, whose maximum value may be 1,range from 0 to 0.6-0.7. For system’s size between 100and 500 roughly, the variation ranges become smaller:the ABN lays between 2 and 12, the clustering coef-ficient lays between 0.05 and 0.2, and the modularitybetween 0.3 and 0.6. Finally, for fairly large systems,where the number of classes is above 500 or more, themetrics stabilize, showing small oscillations and even-tually converging asymptotically to precise values.
0 1000 2000 30000
0.2
0.4
0.6
0.8
clust
ering c
oeffic
ient
n. classes
Figure 3: Scatterplot of the clustering coe�cient vssystem’s size (n. of classes) for all subprojects.
Figure 4: Scatterplots reporting the number of com-munities vs the sizes of the subprojects (n. of classes)
Another interesting result is the monotonic increaseof the NOC metric with system’s size, reported in Fig-ure 4. After a first nonlinear behavior the curve isaligned along a straight line. Additionally, our resultsshow a significant correlation between NOC and bothABN and CC. Figure 5 displays a non-linear decay ofthe maximum values of ABN and CC versus NOC. Itis worth to point out that for other network metrics,such as the mean degree or the average path length,there is not a similar trend.
In particular, Figures 5a and 5b show respectivelythe distributions of the maximum values of ABN andCC with respect to NOC for all the sub-projects foreach release. Each point corresponds to the maximumvalue of the corresponding metrics computed on allthe projects with the same number of communities.

5 15 255
10
15
20
25
n. com
av
bu
g n
.
(a) Average Bug Number vs. Numberof Communities
5 15 25
0.1
0.3
0.5
n. comm
ma
x c
c
(b) Clustering Coe�cient vs. Numberof Communities
Figure 5: Scatterplots of the relationships between the studied metrics.Releases ↵ r �
2dof
2.1 - 3-0 -0.436 -0.920 0.065 162.1 - 3.1 -0.393 -0.934 0.059 172.1 - 3.2 -0.4302 -0.911 0.056 202.1 - 3.3 -0.404 -0.921 0.052 21
Table 2: Fit data for the power law between maximumABN vs NOC: exponent ↵, correlation coe�cient (r),�
2 and number of degrees of freedom (dof).
Releases ↵ r �
2dof
2.1 - 3-0 -1.010 -0.654 0.075 162.1 - 3.1 - 0.917 -0.667 0.057 172.1 - 3.2 -0.977 -0.715 0.087 202.1 - 3.3 -0.986 -0.712 0.119 21
Table 3: Fit data for the power law between maximumCC vs NOC: exponent ↵, correlation coe�cient (r), �2
and number of degrees of freedom (dof).
As these Figures illustrate, these values seem to followa power-law like trend.
The distributions of the maximum values, when an-alyzed using a log-log scale, are well fitted by a straightline, suggesting two power-law-like relationships forthe maximum values of both ABN and CC versus thenumber of communities, provided that the systemshave the same number of communities. We applieda power-law best fitting algorithm in order to checkthis hypothesis, finding acceptable best fittings for themaximum values of CC and for the maximum values ofABN versus the number of communities. The powerlaw parameters are reported in Tables 2 - 3. Table4 shows the best fitting results, reporting the degreesof freedom and the normalized �
2 for the relationshipbetween these two metrics.
Eclipse max ABN vs NOC max CC vs NOCdof 13 13
�
2 / dof 0.361 1.005
Table 4: Fit data for the power laws between the max-imum average defect density (max ABN) versus thenumber of communities and maximum clustering co-e�cient (max CC) versus the number of communities:correlation coe�cient (r), normalized �
2 and numberof degrees of freedom (dof).
6 Discussion
We analyzed a large software system, Eclipse, usingcomplex network theory with the aim of achieving abetter understanding of software properties by meanof the associated software network. The application ofthe CMN algorithm confirms that the analyzed soft-ware networks present a meaningful community struc-ture [SZBB15, CMOT13]. Furthermore, the resultsshow the existence of meaningful relationships betweensoftware quality, represented by the average bug num-ber (ABN), and community metrics, in particular thenumber of communities (NOC) and clustering coe�-cient (CC).
The presence of a strong community structure ina software system reflects a strong organization ofclasses in groups where the number of dependen-cies among classes belonging to the same community(inter-dependencies) is higher with respect to the num-ber of dependences among classes belonging to di↵er-ent communities (external-dependencies).
From a software engineering perspective this goalmight be achieved by adopting good programmingpractices, where class responsabilities are well defined,classes are strongly interconnected in groups, and cou-

pling among groups is kept low. Within this perspec-tive the network modularity can be seen as a proxy forsoftware modularity.
Figure 1 shows that, with the exception of sub-projects with less than 500 classes, the modularity doesnot increase along with the size, converging to valuesthat range from 0.6 to 0.7. As reported in Section 3,these values indicate that the community structure issignificant and well defined. At the same time Figure4 shows that there is a linear relationship between thenumber of communities and the number of classes.
Such relationship is not trivial: the modularity andthe number of communities are theoretically indepen-dent by the size [GMC10] and, in general, the numberof communities does not increase with network’s size.Moreover, by and large, there may be large networksdivided in a small number of communities, dependingon the network’s topology. As a consequence our find-ings suggest that, in the examined case, it is possibleto partition the software networks into a set of commu-nities, where the number of communities is correlatedwith system’s size.
Figures 2 and 3 report, respectively, the relation-ship of ABN and CC with the number of communities.Both metrics have a similar trend, with values converg-ing to a range between 4 and 12 for ABN and between0.2 and 0.6 for CC. This means that when the system’ssizes increases the number of defects stabilizes and thesame happens to the clustering coe�cient. We alreadymentioned the significant increment of the number ofcommunities with system’s size. Since the incrementof NOC is not trivial, this led us to assume that theremight be a relationship among the topology of softwarenetworks, that determines the number of communities,and the other metrics.
Figures 5a and 5b show the distributions of themaximum values of CC and ABN for the projects withthe same number of communities. As previously men-tioned, this relationship seems to follow a power-lawtrend. The power law relating the NOC and the max-imum values of ABN indicates that the communitymetrics, specifically the number of communities, canbe exploited in order to evaluate the evolution of thedefectiveness of a software system. In other words,once the relationship between NOC and the maximumvalues for ABN is known, one can evaluate approxi-mately the maximum ABN in a future release of thesame system, by computing the number of communi-ties for that release.
This way, we might assume that systems with thesame number of communities should have a number ofdefects per class lower than a given value. The sameargument applies to the clustering coe�cient of sys-tems having the same number of communities. Therelationship between CC and NOC is again a power
Releases r �
2dof
2.1 - 3-0 0.565 0.633 162.1 - 3.1 0.576 0.651 172.1 - 3.2 0.677 0.523 202.1 - 3.3 0.687 0.547 21
Table 5: Fit data for the maximum ABN vs maximumCC: correlation coe�cient (r), normalized Chi squared(�2 ), and number of degrees of freedom (dof).
law. This implies that if the NOC of an initial release(or of a set of releases) is known, one can in princi-ple predict that in the following releases the clusteringcoe�cient will not be greater than a certain value.
Figures 6 and 7 show, in a log-log scatterplot, thebest fitting lines for the data discussed above. Eachcolor corresponds to one set of releases cumulated ac-cording to the chronological order. The Figures con-firm that the power-law like relationship appears inevery cumulated release and is a regular and stablebehavior throughout software evolution.
The power law parameters for the mentioned met-rics and for each cumulated releases (see Section 4)are reported in Tables 2 and 3. As we can see they donot change significantly from one cumulated release toanother. This suggests the existence of a progressivelymore stable behavior during software evolution, wherethe fitting with a power law becomes more accurateand tends to a fixed value as new releases are added inthe cumulated dataset. These results might help de-velopers to estimate the expected maximum ABN forsoftware systems with a known community partition.
The two power laws indirectly connect the maxi-mum values of ABN with the maximum values of CCin systems having the same number of communities.Such relationship can be made explicit reporting di-rectly the scatter plot of the two metrics where eachmetric is computed for the same number of commu-nities. Such plots are reported in Figure 6 for all thecumulated releases, and show that the two metrics arelinearly correlated. Table 5 reports the correlation co-e�cient as well as the degrees of freedom and the �2 forsuch data for all cumulated releases. It shows that thecorrelation coe�cient increases and the �2 decreases asnew releases are added in the cumulated data, indicat-ing a more stable relationship among the two metricsas the system evolves.
These results can be explained by noting that thelarger the clustering coe�cient, the higher is the num-ber of classes linked to each other and the higher theprobability of di↵usion of defects among them. Thetopology of a software network is characterized byhubs, and the clustering coe�cient in the area of thegraph around any hub is higher by definition. If onehub is a↵ected by one or more defects, it is more likely

0.5 1 1.5 2 2.5 3 3.5 4
1.4
1.6
1.8
2
2.2
2.4
2.6
2.8
3
log(n.comm)
log
(ma
x a
vg b
ug
n.)
releases 2.1 − 3.0
releases 2.1 − 3.1
releases 2.1 − 3.2
releases 2.1 − 3.3
Figure 6: Cumulated log-log plots and best fitting lines of maximum ABN vs number of communities
0.5 1 1.5 2 2.5 3 3.5 4−4
−3.5
−3
−2.5
−2
−1.5
−1
−0.5
0
log(n.comm)
log
(ma
x cc
)
releases 2.1 − 3.0
releases 2.1 − 3.1
releases 2.1 − 3.2
releases 2.1 − 3.3
Figure 7: Cumulated log-log plots and best fitting lines of maximum CC vs number of communities

0 0.1 0.2 0.3 0.4 0.5 0.6 0.7
6
8
10
12
14
16
18
max cc
max
defe
ct d
ensi
ty
releases 2.1 − 3.0
releases 2.1 − 3.1
releases 2.1 − 3.2
releases 2.1 − 3.3
Figure 8: Cumulated plots and fitting lines for the maximum ABN vs maximum CC.
that these defects will spread among the classes con-nected to the hub, increasing the defect density in thearea around it. This would explain the correlationamong defect density and clustering coe�cient.
7 Threats to Validity
This work su↵ers from some threats to validity, thatare reported in the following according to the usualdistinction in internal, external and construct threatsto validity.
Internal Validity We conclude that the relation-ship among software defectiveness and communitymetrics can indicate that a high level of networkmodularity is related to low defectiveness, thussuggesting good programming practices. How-ever, the relationships we found could be due toother phenomena, or deserve to be further investi-gated. What we propose here is just one possibleformal explanation of our results.
External Validity We only consider one Java sys-tem, Eclipse, and analyzed its evolution. Our re-sults should be validated on other systems andmade more general. We are currently extendingthe analysis to many releases of NetBeans.
Construct Validity The rules reported in Section 5might be faulty in some cases, not being able tocorrectly map defects to CUs [AMADP07]. There
might be a bias caused by the lack of informationon SCM [AMADP07], and there could be a chanceof wrong assignments to happen for some classes.However, we considered the defect density as arelevant metric and studied its statistical distri-bution, which could be severely biased only in thecase of systematic errors, which is not our case.Moreover, we consider only undirected edges inthe class dependency graph, without making anydistinction among the di↵erent relationships (i.e.inheritance, collaboration, etc.) that take placeamong classes. Consequently, our results could berefined considering the mentioned di↵erences be-tween the relationships and taking into accountdirected as well as weighted edges.
8 Conclusions
In this work we presented a longitudinal analysis onthe evolution of a large software system with a fo-cus on software defectiveness. We used a complexnetwork approach to study the structure of the sys-tem and its modularity by computing the communitystructure of the associated network. After having re-trieved the number of defects and associated them tothe software network classes, we performed a topolog-ical analysis of the system defectiveness. We found apower law relationship between the maximum values ofthe clustering coe�cient, the average bug number and
the division in communities of the software network.This led to a linear relationship between the maximumvalues of the clustering coe�cient and of the averagebug number. We showed that such relationship canin principle be used as a predictor for the maximumvalue of the average bug number in future releases.
References
[AMADP07] K. Ayari, P. Meshkinfam, G. Antoniol,and M. Di Penta. Threats on buildingmodels from cvs and bugzilla reposito-ries: the mozilla case study. In Proceed-ings of the 2007 conference of the cen-ter for advanced studies on Collaborativeresearch, CASCON ’07, pages 215–228,New York, NY, USA, 2007. ACM.
[ASTC11] Mahir Arzoky, Stephen Swift, AllanTucker, and James Cain. Munch: An ef-ficient modularisation strategy to assessthe degree of refactoring on sequentialsource code checkings. In ICST Work-shops, pages 422–429. IEEE ComputerSociety, 2011.
[BAJ00] A. Barabasi, R. Albert, and H. Jeong.Scale-free characteristics of random net-works: the topology of the world wideweb. Physica A: Statistical Mechanicsand its Applications, 281:69–77, 2000.
[BC99] Carliss Y. Baldwin and Kim B. Clark.Design Rules: The Power of ModularityVolume 1. MIT Press, Cambridge, MA,USA, 1999.
[CK94] S. Chidamber and C. Kemerer. Ametrics suite for object-oriented design.IEEE Trans. Software Eng., 20(6):476–493, June 1994.
[CL04] D. Challet and A. Lombardoni.Bug propagation and debugging inasymmetric software structures. pre,70(4):046109, October 2004.
[CMM+11] G. Concas, M. Marchesi, A. Murgia,R. Tonelli, and I. Turnu. On the dis-tribution of bugs in the eclipse system.IEEE Trans. Software Eng., 37(6):872–877, 2011.
[CMOT13] Giulio Concas, Cristina Monni, MatteoOrru, and Roberto Tonelli. A studyof the community structure of a com-plex software network. In Proceedings ofthe 2013 ICSE Workshop on EmergingTrends in Software Metrics, WETSoM
’13, pages 14 – 20, New York, NY, USA,2013. ACM.
[CN06] Gabor Csardi and Tamas Nepusz. Theigraph software package for complex net-work research. InterJournal, ComplexSystems:1695, 2006.
[CNM04] Aaron Clauset, M. E. J. Newman, , andCristopher Moore. Finding communitystructure in very large networks. Physi-cal Review E, pages 1– 6, 2004.
[CS05] Hernn A. Makse Chaoming Song,Shlomo Havlin. Self-similarity of com-plex networks. Nature, 433(4):392–395,January 2005.
[DLR10] Marco D’Ambros, Michele Lanza, andRomain Robbes. An extensive com-parison of bug prediction approaches.In Mining Software Repositories (MSR),2010 7th IEEE Working Conference on,pages 31–41. IEEE, 2010.
[FB07] S. Fortunato and M. Barthelemy. Res-olution limit in community detection.Proceedings of the National Academy ofSciences, 104(1):36, 2007.
[FMS01] Sergio Focardi, Michele Marchesi, andGiancarlo Succi. A stochastic model ofsoftware maintenance and its implica-tions on extreme programming processes,pages 191–206. Addison-Wesley Long-man Publishing Co., Inc., Boston, MA,USA, 2001.
[For10] Santo Fortunato. Community detectionin graphs. Physics Reports, 486(3-5):75– 174, 2010.
[GMC10] B.H. Good, Y.A. De Montjoye, andA. Clauset. Performance of modular-ity maximization in practical contexts.Physical Review E, 81(4):046106, 2010.
[GN01] M Girvan and M. E. J. Newman. Com-munity structure in social and biologicalnetworks. Proc. Natl. Acad. Sci. U. S.A., 99(cond-mat/0112110):8271–8276. 8p, Dec 2001.
[HBB+12] Tracy Hall, Sarah Beecham, DavidBowes, David Gray, and Steve Counsell.A systematic literature review on faultprediction performance in software en-gineering. Software Engineering, IEEETransactions on, 38(6):1276–1304, 2012.

[MM07] Brian S. Mitchell and Spiros Man-coridis. On the evaluation of the bunchsearch-based software modularization al-gorithm. Soft Comput., 12(1):77–93, Au-gust 2007.
[MMCG99] Spiros Mancoridis, Brian S. Mitchell,Yih-Farn Chen, and Emden R. Gansner.Bunch: A clustering tool for the recov-ery and maintenance of software systemstructures. In ICSM, pages 50–. IEEEComputer Society, 1999.
[MTM+12] A. Murgia, R. Tonelli, M. Marchesi,G. Concas, S. Counsell, J. McFall, andS. Swift. Refactoring and its relation-ship with fan-in and fan-out: An em-pirical study. In Proceedings of Soft-ware Maintenance and Reengineering(CSMR), 2012 16th European Confer-ence on, CSMR ’12, pages 63–72, 2012.
[Mye03] Christopher R. Myers. Software systemsas complex networks: Structure, func-tion, and evolvability of software col-laboration graphs. Physical Review E,68(4):046116, Oct 2003.
[NAH10] Thanh HD Nguyen, Bram Adams, andAhmed E Hassan. Studying the impactof dependency network measures on soft-ware quality. In Software Maintenance(ICSM), 2010 IEEE International Con-ference on, pages 1–10. IEEE, 2010.
[New03] M. E. J. Newman. The structure andfunction of complex networks. SIAM re-view, 45(2):167–256, 2003.
[New04] M. E. J. Newman. Fast algorithm fordetecting community structure in net-works. Physical Review E, 69:066133,Jun 2004.
[New06] M. E. J. Newman. Modularity and com-munity structure in networks. TechnicalReport physics/0602124, Feb 2006.
[NG04] M. E. J. Newman and M. Girvan. Find-ing and evaluating community struc-ture in networks. Physical Review E,69(026113), 2004.
[OWB05] Thomas J Ostrand, Elaine J Weyuker,and Robert M Bell. Predicting the lo-cation and number of faults in largesoftware systems. Software Engineer-ing, IEEE Transactions on, 31(4):340–355, 2005.
[Par72] D. L. Parnas. On the criteria to be usedin decomposing systems into modules.Commun. ACM, 15(12):1053–1058, De-cember 1972.
[RS02] Valverde S. Cancho R. and V. Sole. Scalefree networks from optimal design. Eu-rophysics Letters, 60, 2002.
[SB11] L. Subelj and M. Bajec. Communitystructure of complex software systems:Analysis and applications. Physica A:Statistical Mechanics and its Applica-tions, 390:2968–2975, August 2011.
[SM96] Ron Sanchez and Joseph T. Mahoney.Modularity, flexibility, and knowledgemanagement in product and organiza-tion design. Strategic Management Jour-nal, 17:pp. 63–76, 1996.
[SZBB15] L. Subelj, S. Zitnik, N. Blagus, andM. Bajec. Node mixing and groupstructure of complex software networks.ArXiv e-prints, February 2015.
[TCM+11] I. Turnu, G. Concas, M. Marchesi,S. Pinna, and R. Tonelli. A modi-fied Yule process to model the evolutionof some object-oriented system proper-ties. Information Sciences, 181(4):883–902, February 2011.
[TMT12] I. Turnu, M. Marchesi, and R. Tonelli.Entropy of the degree distribution andobject-oriented software quality. In Pro-ceedings of the 2012 3rd InternationalWorkshop on Emerging Trends in Soft-ware Metrics (WETSoM), pages 77–82,June 2012.
[VS03] Sergi Valverde and Ricard V. Sole. Hi-erarchical small worlds in software ar-chitecture. arXiv:cond-mat/0307278v2,2003.
[WKD07] Lian Wen, Diana Kirk, and R. Ge-o↵ Dromey. Software systems as com-plex networks. In Du Zhang, YingxuWang, and Witold Kinsner, editors,IEEE ICCI, pages 106–115. IEEE, 2007.
[Zha09] Hongyu Zhang. An investigation of therelationships between lines of code anddefects. In Software Maintenance, 2009.ICSM 2009. IEEE International Confer-ence on, pages 274–283. IEEE, 2009.

[ZN08] Thomas Zimmermann and NachiappanNagappan. Predicting defects using net-work analysis on dependency graphs.In Proceedings of the 30th Interna-
tional Conference on Software Engineer-ing, ICSE ’08, pages 531–540, New York,NY, USA, 2008. ACM.