Predicting Severe Hail in the WFO LWX County Warning Area Toward Increased Accuracy in Hail Size...
16
Predicting Severe Hail in the WFO LWX County Warning Area Toward Increased Accuracy in Hail Size Forecasts Matthew R. Kramar WFO Baltimore/Washington Jeffrey Waters The Pennsylvania State University
-
Upload
melvin-audley -
Category
Documents
-
view
219 -
download
5
Transcript of Predicting Severe Hail in the WFO LWX County Warning Area Toward Increased Accuracy in Hail Size...

Predicting Severe Hail in the WFO LWX County Warning Area
Toward Increased Accuracy in Hail Size Forecasts
Matthew R. Kramar WFO Baltimore/Washington
Jeffrey Waters The Pennsylvania State University

History• Studies correlating freezing level and height of 50 dBZ echo core in
relation to hail size have been pursued for Northern Plains (Donavon and Jungbluth 2007 [DJ07]) and Southern Plains/West Texas (Porter et al. 2005) following the method described in DJ07
• 50 dBZ core used as proxy for updraft strength
• DJ07 suggested numerically that use of freezing level instead of wet bulb zero height provided better relationship
• Also showed relationship adequately modeled linearly for hail ≤ 2.00 inch diameter.

History
• Porter et al. found good correlation for Southern Plains/West Texas, different (shallower) regression line equation
• Regional variations in topography, moisture depth, shear and EML influence contribute to differences in slope of regression equations, but technique should work

Motivation
• Scheduled 1 January 2010 change to 1.00” criterion for severe hail in Eastern Region– Quantify relationship for LWX forecast area– Help forecasters with transition after many years of smaller
change threshold
• Several offices in ER guilty of SVR-ly underestimating hail size in SVR products– Provide starting point for including hail size estimates in
warnings and statements
* AT 426 PM EDT... NATIONAL WEATHER SERVICE DOPPLER RADAR INDICATED ASEVERE THUNDERSTORM CAPABLE OF PRODUCING PENNY SIZE HAIL... AND DAMAGING WINDS IN EXCESS OF 60 MPH. 0.5 deg 0.9 deg
1.3 deg
40000 ft 50000 ft
60000 ft
HAIL TO THE SIZE OF PENNIES AND WIND GUSTS TO 60 MPH CAN BE EXPECTED IN THE WARNED AREA. STAY INDOORS AND AWAY FROM WINDOWS UNTIL THE STORM HAS PASSED.
Methodology
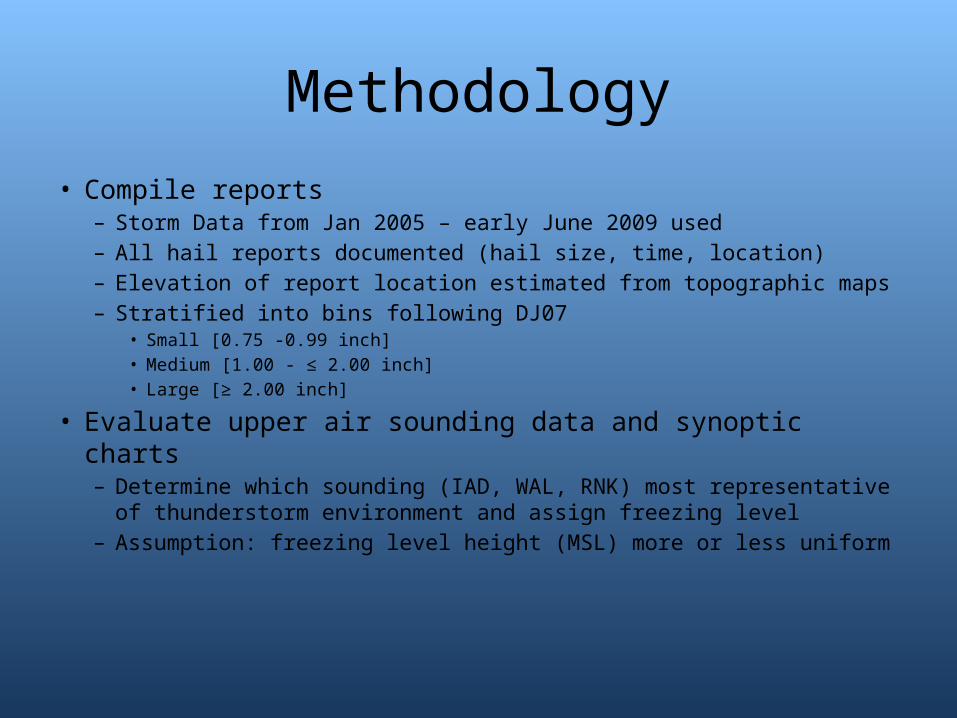
• Compile reports– Storm Data from Jan 2005 – early June 2009 used– All hail reports documented (hail size, time, location)– Elevation of report location estimated from topographic maps– Stratified into bins following DJ07
• Small [0.75 -0.99 inch]• Medium [1.00 - ≤ 2.00 inch]• Large [≥ 2.00 inch]
• Evaluate upper air sounding data and synoptic charts– Determine which sounding (IAD, WAL, RNK) most representative
of thunderstorm environment and assign freezing level– Assumption: freezing level height (MSL) more or less uniform

Methodology
• Evaluate radar– Level II data obtained for KDOX, KLWX, KAKQ, KFCX– 50 dBZ core height recorded subject to:
• Sustained for two volume scans• Within 4 volume scans (~15-16 min) of report time• VCP 11/12 and their derivatives• Notes on storm structure were made (i.e. WER, rotation, etc.)
– Reasons to reject a report:• Time/location errors that could not be resolved with confidence• VCP 21/221 with inadequate ability to evaluate core height• Report not largest within 10 mi/15 min of hail report• Radar data not available• Subjective assessment that reported hail likely smaller than maximum
expected hail size in storm
www.srh.noaa.gov/radar/radinfo/vcp21.htmlwww.srh.noaa.gov/radar/radinfo/vcp21.html www.srh.noaa.gov/radar/radinfo/vcp12.htmlwww.srh.noaa.gov/radar/radinfo/vcp12.htmlVCP21 VCP11
Methodology
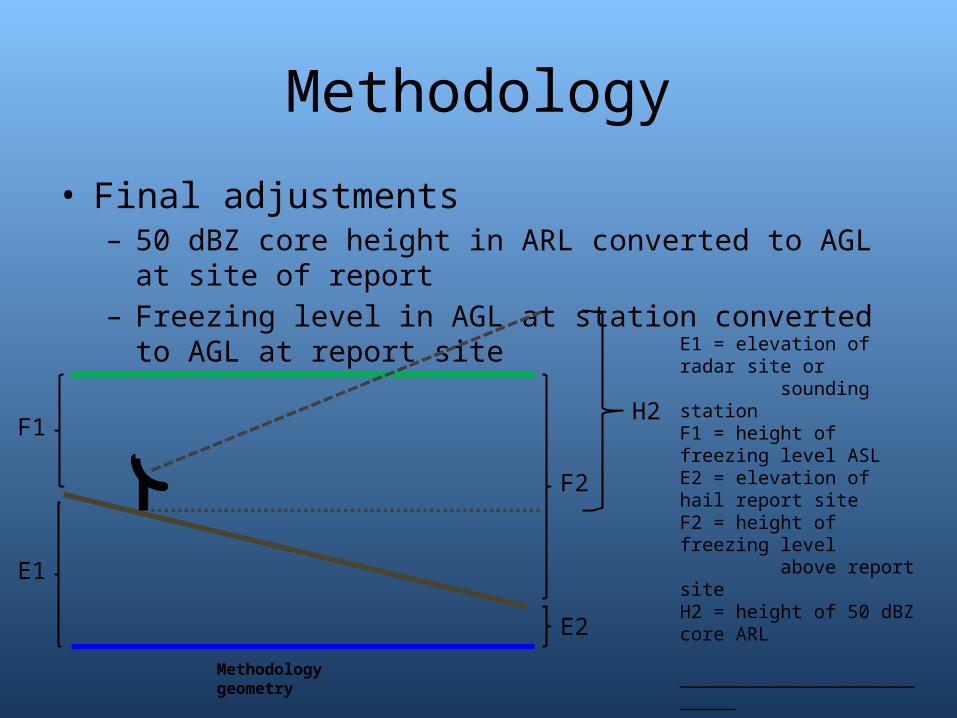
• Final adjustments– 50 dBZ core height in ARL converted to AGL at site of report– Freezing level in AGL at station converted to AGL at report site
F2
F1
E1
E2
E1 = elevation of radar site or sounding stationF1 = height of freezing level ASLE2 = elevation of hail report siteF2 = height of freezing level above report siteH2 = height of 50 dBZ core ARL
__________________________
• F2 = F1 + E1sounding – E2
• 50 dBZ AGL = H2 + E1radar– E2
H2
Methodology geometry

Methodology
• 50 dBZ adjusted core heights in AGL plotted against adjusted freezing level in AGL
• Least squares linear regression applied to scatter plot
• Linear quantile regression also applied to data

Results ─ 1.00 inch only All heights in AGL
y = 2.6249x - 697.57R2 = 0.9011
0
5000
10000
15000
20000
25000
30000
35000
40000
45000
5000 7000 9000 11000 13000 15000 17000
Adjusted Freezing Level (ft)
Adj
uste
d Co
re H
eigh
t (fT
)
Adjusted Core Height (ft)
Q0.05 Line
Q0.10 Line
Q0.20 Line
Linear (Adjusted Core Height (ft))

Results ─ All 1.00-1.99 inch All heights in AGL
y = 2.4184x + 2451.5R2 = 0.8845
0
5000
10000
15000
20000
25000
30000
35000
40000
45000
5000 7000 9000 11000 13000 15000 17000
Adjusted Freezing Level (ft)
Adj
uste
d Co
re H
eigh
t (fT
)
Adjusted Core Height (ft)
Q0.05 Line
Q0.10 Line
Q0.20 Line
Linear (Adjusted Core Height (ft))

Results ─ 1.50-1.99 inch All heights in AGL
y = 2.214x + 6139.2R2 = 0.9504
0.0
5000.0
10000.0
15000.0
20000.0
25000.0
30000.0
35000.0
40000.0
45000.0
5000.0 7000.0 9000.0 11000.0 13000.0 15000.0 17000.0
Adjusted Freezing Level (ft)
Adj
uste
d Co
re H
eigh
t (fT
)
1.50-1.99 inch heights
Q0.05 Line
Q0.10 Line
Q0.20 Line
Linear (1.50-1.99 inch heights)

Results (heights in AGL)
y = 2.4184x + 2451.5R2 = 0.8845
0
5000
10000
15000
20000
25000
30000
35000
40000
45000
5000 7000 9000 11000 13000 15000 17000
Adjusted Freezing Level (ft)
Adj
uste
d Co
re H
eigh
t (fT
)
Adjusted Core Height (ft)
Q0.05 Line
Q0.10 Line
Q0.20 Line
Linear (Adjusted Core Height (ft))
DJ07 slope: ~ 3.3
Porter et al. slope: ~3.0
Slope here: ~2.42 2.62
Southern Plains typically has EML, so Porter et al. slope makes sense
Mid-Atlantic characterized by typically moister column; slope SHOULD be STEEPER!
Why isn’t it?
!?!?!
WHOAAAAAA NELLIE!!!
Results (heights in AGL)
0
5000
10000
15000
20000
25000
30000
35000
40000
45000
5000 7000 9000 11000 13000 15000 17000
Adjusted Freezing Level (ft)
Adj
uste
d Co
re H
eigh
t (fT
)
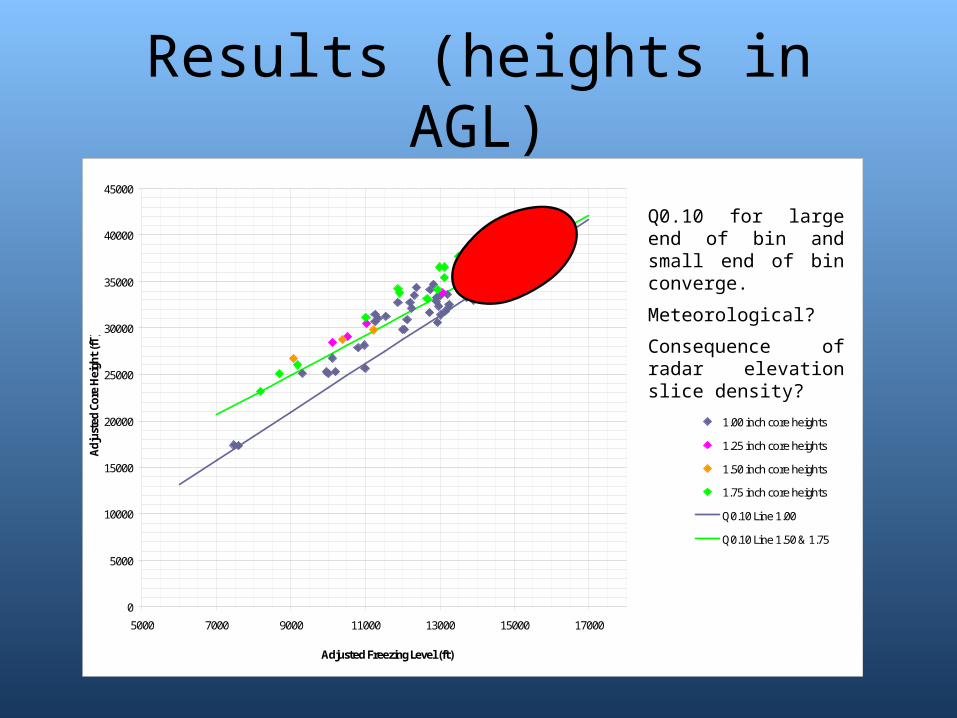
1.00 inch core heights
1.25 inch core heights
1.50 inch core heights
1.75 inch core heights
Q0.10 Line 1.00
Q0.10 Line 1.50 & 1.75
Q0.10 for large end of bin and small end of bin converge.
Meteorological?
Consequence of radar elevation slice density?
Results
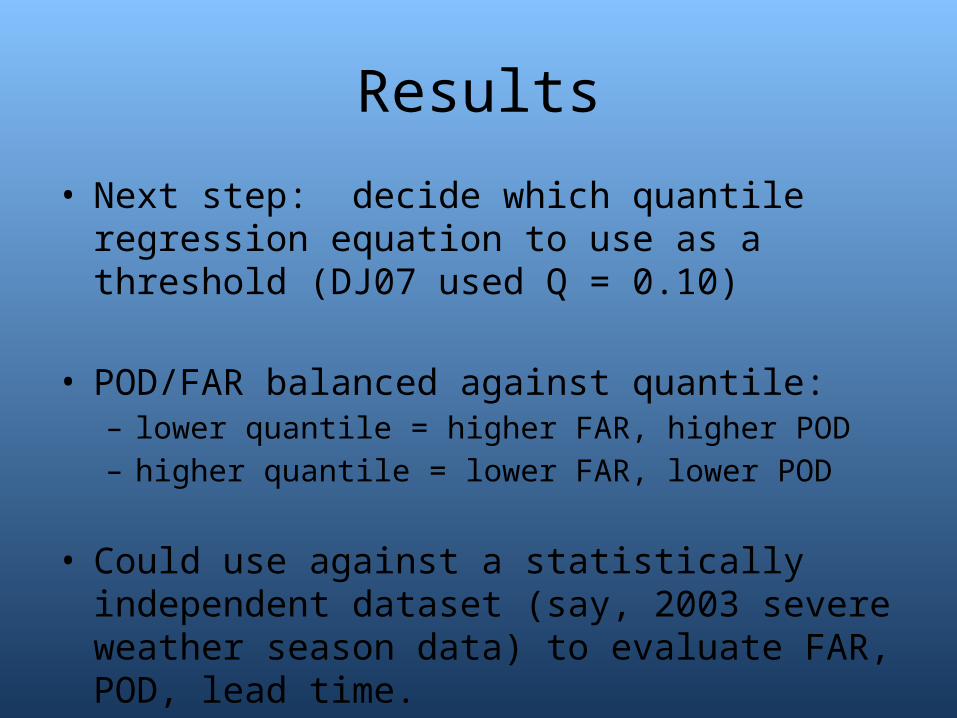
• Next step: decide which quantile regression equation to use as a threshold (DJ07 used Q = 0.10)
• POD/FAR balanced against quantile: – lower quantile = higher FAR, higher POD– higher quantile = lower FAR, lower POD
• Could use against a statistically independent dataset (say, 2003 severe weather season data) to evaluate FAR, POD, lead time.

Results
• Goal this winter is to develop D2D toggle between All-Tilts reflectivity and expected core height
• Updated hourly based on RUC or LAPS freezing level
• End result will be a sampled value at every point in the radar domain: Expected Core Height for 1.00” hail
• When 50 dBZ core height at or above ECH for two scans, hail ≥ 1.00 inch expected
References• Changnon, S.A., 1970: Hailstreaks. J. Atmos. Sci., 27, 109-125.
• Donavon, R.A. and K.A. Jungbluth, 2007: Evaluation of a technique for radar identification of large hail across the Upper Midwest and Central Plains of the United States. Wea. Forecasting, 22, 244-254.
• Porter, D.L., M.R. Kramar and S.D. Landolt, 2005: Predicting severe hail for the Southern High Plains and West Texas. Preprints, 32nd Conference on Radar Meteorology, Albuquerque, NM. Amer. Meteor. Soc.