Shields orchard a hawkesbury harvest success story by jonathan shields
Bureau of Reclamation report Page 1 of 28
PREDICTING MODES AND MAGNITUDE OF RIVER CHANNEL
MIGRATION AND CHUTE CUTOFF BASED ON BEND
GEOMETRY, SACRAMENTO RIVER, CALIFORNIA, USA.
Eric W. Larsen
Research Scientist
University of California
Landscape Architecture Program
Davis, California
Technical Report
For
United States Department of the Interior
Bureau of Reclamation
Technical Service Center, Denver, CO
2007
Corresponding Author – Eric Larsen
University of California
Department of Environmental Design
Landscape Architecture Program
One Shields Avenue
Davis, California
Phone: (530) 752-8336
E-mail: [email protected]
Bureau of Reclamation report Page 2 of 28
ABSTRACT
Channel centerlines were mapped on a 160 km meandering alluvial reach of the central Sacramento
River, California (from Red Bluff to Colusa) from historic topographic maps (1904) and aerial
photographs (in 6 time periods between1937 and 1997). Centerlines were broken into individual
segments (one bend of a two-bend meander sequence) and analyzed in a GIS for sinuosity, wave-
length, radius of curvature and bend entrance angle. The mean meander shape was observed with
average river sinuosity of 1.38 (related to a down valley axis), and the following average values for
sinuous bends: half wavelength 1185 m (4.7 channel widths), radius of curvature 699 m (2.8
widths), and bend entrance angle 73 degrees.
Temporal changes in channel centerlines and bend geometry were tracked over the 93-year time
interval. By intersecting sequential channel centerlines, modes and magnitudes of lateral channel
change over time were measured. Bend movement was classified as progressive migration, chute
cutoff and “partial cutoff”. An average of 94% of channel length moved via progressive migration
at a rate of 4.7 0.5 m y-1
, 5% of the total channel length moved laterally via chute cutoff at a rate
of 22.1 3.3 m y-1
versus and the remaining 1% of channel length migrated via partial cutoff at an a
rate of 13.0 2.8 m y-1
.
The river channel length, beginning and ending in the same valley location, remained relatively
constant from 1904 to 1997. This suggests that river length lost due to cut-off has been
approximately made up for by progressive migration over the study period, but that the formation
of high sinuosity bends susceptible to future cut-off may be on the decline.
The data show that geometric parameters can serve as a predictive indicator for modes (progressive
migration, chute cutoff and partial cutoff) of channel change. Bends that experienced chute cutoff
displayed an average sinuosity of 1.97 0.1, an average radius of curvature of 2.1 0.2 channel
widths, and an average entrance angle of 111 7 degrees, as opposed to average values for bends
migrating progressively of 1.31 0.01, 2.8 0.1, and 66 1 degrees (respectively). This suggests
that the likelihood of a bend being prone to progressive migration versus chute cutoff on the
Sacramento River may be estimated based on centerline geometry alone for a range of channel
slopes typical of the meandering portion of the Sacramento River.
Bureau of Reclamation report Page 3 of 28
INTRODUCTION
River channel meander migration and cutoff processes drive the planform morphology and
habitat attributes of floodplain rivers. Measuring and planning for channel change are some
of the most important challenges for managing a meandering river corridor (Golet et al.
2006). These dynamic processes benefit ecosystem health. At the same time, conflict
between natural river meander dynamics and infrastructure protection has led to the
placement of channel riprap and groins to limit channel dynamics. Whether the goal is to
promote channel dynamics for ecosystem health or to enhance channel stability, knowledge
of the natural dynamics of river channel migration is critical. Studying long-term large-
scale dynamics on a river over the scale of a century provides an important opportunity to
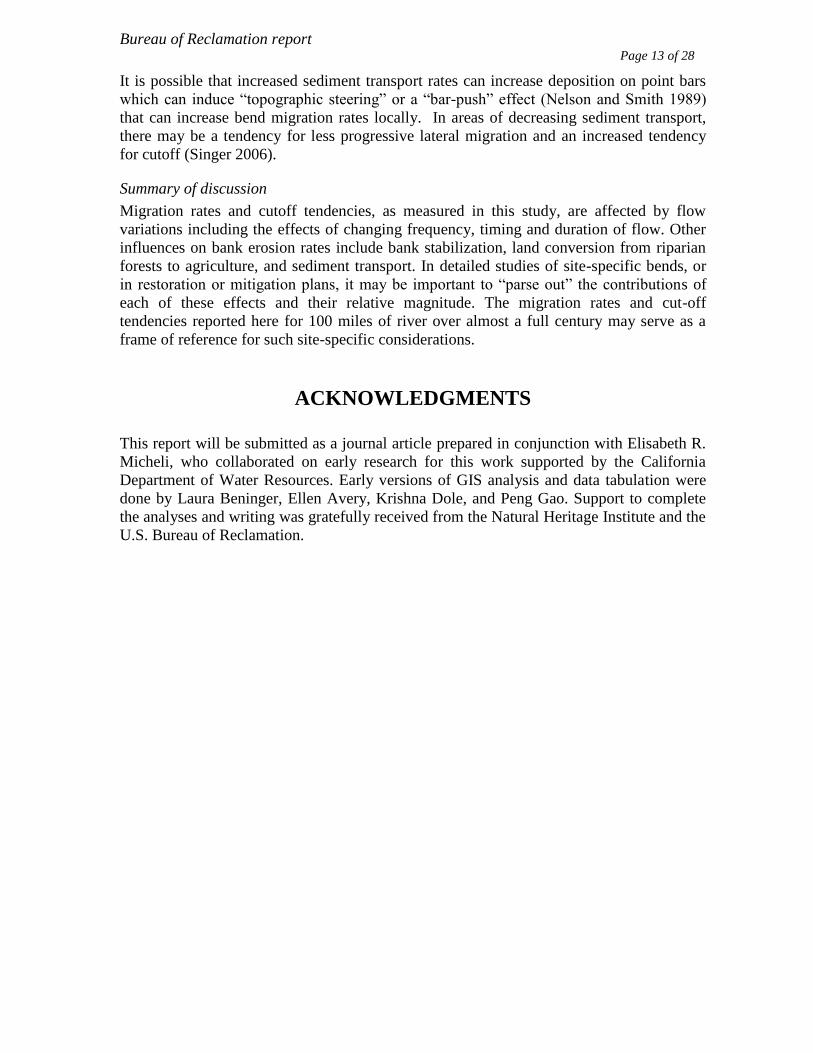
quantify fundamental processes. In this study, maps of roughly 100 years of detailed river
channel locations of the Upper Sacramento River (Figure 1) were used to analyze river
channel changes. Documenting historical patterns provides a better understanding of the
forces driving river channel migration.
Centerline morphology, migration, and cutoff
Sequential measurements of river bend planform geometry provide a way to quantify the
morphology of a river and to study the changes in channel planform shape over time (e.g.
Hickin and Nanson 1984, Hooke 1984, Gurnell 1997). Channel curvature is assumed to be
related to the spatial distribution and the magnitude of channel migration (Hooke and
Harvey 1983, Johannesson and Parker 1989, Furbish 1991, Larsen 1995). Empirically
testing relationships between the patterns of the meandering channel and the channel
geometry (Howard and Hemberger 1991)is key to predicting patterns of channel movement
based on shape. Research efforts have linked the shape of river meander bends with the
movement of bends. Hooke examined the shapes of meander bends and related subsequent
movement with characteristic shapes. A recent model for predicting rates of meander
migration was based on bend shape (Lagasse et al. 2004). More complex physically-based
models use the planform shape in predicting the hydrodynamics (velocity patterns) that are
directly related to bank erosion (Ikeda et al. 1981, Darby and Thorne 1996b, Langendoen et
al. 2001, Darby et al. 2002). Large scale pattern changes on alluvial (self-formed)
meandering rivers help inform both qualitative geomorphic theories and physically-based
models that tend to “scale-up” from micro-scale processes (i.e. sediment transport.) Broad
large-scale studies can help to identify thresholds for migration processes (i.e. distinguish
between geometries that will evolve by cutoff versus by other processes), but it is likely
that these relationships will need to be studies in individual case studies to identify the
range of natural variation.
Channels move progressively and by cutoff processes. Both modes of channel change have
been shown to be important in ecosystem health; both processes also pose challenges to
planning, particularly with respect to land use and infrastructure placement. Three categories
are used here to describe modes of channel migration observed on the Sacramento River:
progressive migration, chute cutoff, and partial cutoff.
Progressive Migration
Progressive migration is lateral change that occurs via a continual but gradual process of
bank erosion. Migration proceeds via erosion of the outside (concave in planform) bank
Bureau of Reclamation report Page 4 of 28
and deposition of eroded material on bars located on the inside (convex in planform) bank
(Lewin 1977, Ikeda et al. 1981, Knighton 1998). Under equilibrium conditions, rates of
bank erosion and bar deposition are assumed equal. However in non-equilibrium cases
where bar aggradation is accelerated, erosion may also be accelerated on the opposite bank,
a hypothesis sometimes termed "bar push" (Personal communication Dietrich 2001). The
mechanism of bank retreat when fine-grained floodplain deposits are underlain by a coarser
gravel-cobble layer, as is common in this case, is usually the undermining of floodplain
materials due to the concentration of shear forces causing erosion at the bank toe (Darby
and Thorne 1996a, Micheli 2002). Forces acting at the bank toe may be expected to
increase with flow depth up to an effective maximum at bankfull.
The rate of progressive migration is generally assumed to increase with centerline
curvature up to some threshold (Hickin 1983). Numerical models of progressive migration
estimate that the maximum rate of bank erosion will coincide with the location of the peak
differential between mean and near-bank velocities, generally lagging somewhat behind the
location of peak channel curvature in the latter half of a meander bend (Ikeda et al. 1981,
Furbish 1991). Over time, progressive migration may increase the sinuosity and/or cause
the downstream translation of a meander bend, but empirical observations show this is not
always the case on the Sacramento River, since in some cases (perhaps due to influences
that are outside the channel) progressive migration has been observed to actually straighten
the channel over time (Micheli 2000).
Chute and Partial Cutoffs
The majority of observed cutoffs on the Sacramento River occur via chute cutoff, a channel
avulsion that occurs when overbank flows are sufficient to concentrate shear stresses to a
degree capable of carving a new channel across the floodplain (Hooke 1984, 1995, Micheli
and Larsen In prep.). This study examines the hypothesis that chute cutoffs form where the
centerline has reached a threshold geometry (in terms of radius of curvature, sinuosity, and
entrance angle). A related hypothesis not discussed here is that cutoff occurs only when
extended periods of overbank flow provide sufficient stream power to excavate a channel
across the floodplain.
The partial cutoff category describes episodes of channel avulsion that affect only a portion
of a meander bend (Fares and Herbertson 1990).
Analysis of Centerline Geometry
One hypothesis about the relationship between progressive migration and cut-off is that
progressive processes generally adds sinuosity to meander bends while cut-off processes
reduce sinuosity and reset the cycle of bend generation. Thus, maintaining a constant
centerline sinuosity over time may imply an approximate balance between rates of lateral
migration due to progressive migration versus cut-off. However, other field studies of
rivers in the western US have indicated that disturbances that decrease the effective
cohesion of floodplain and bank materials can serve to accelerate bank migration rate in a
manner that effectively straightens the channel centerline and resulting in longer, less
sinuous bends, as observed on Nevada’s Lower Truckee River (Micheli 2000). The
geometry of meander bends of the whole river were examined in order to track any
potential changes over time and to test for correlations between bend geometry related to
modes and magnitudes of channel change. Here, 93 years of bend shape data are used to
Bureau of Reclamation report Page 5 of 28
distinguish between geometries (sinuosity, wave-length, curvature, and entrance angle) that
will evolve by progressive migration versus by cutoff processes.
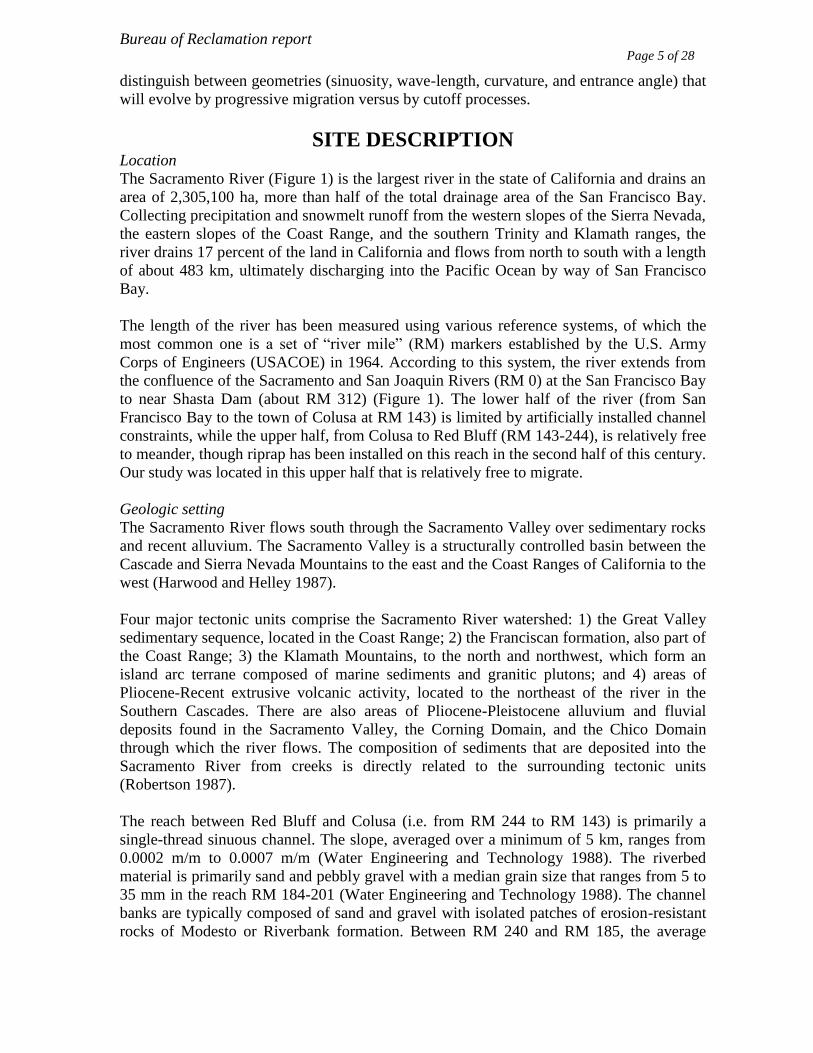
SITE DESCRIPTION Location
The Sacramento River (Figure 1) is the largest river in the state of California and drains an
area of 2,305,100 ha, more than half of the total drainage area of the San Francisco Bay.
Collecting precipitation and snowmelt runoff from the western slopes of the Sierra Nevada,
the eastern slopes of the Coast Range, and the southern Trinity and Klamath ranges, the
river drains 17 percent of the land in California and flows from north to south with a length
of about 483 km, ultimately discharging into the Pacific Ocean by way of San Francisco
Bay.
The length of the river has been measured using various reference systems, of which the
most common one is a set of “river mile” (RM) markers established by the U.S. Army
Corps of Engineers (USACOE) in 1964. According to this system, the river extends from
the confluence of the Sacramento and San Joaquin Rivers (RM 0) at the San Francisco Bay
to near Shasta Dam (about RM 312) (Figure 1). The lower half of the river (from San
Francisco Bay to the town of Colusa at RM 143) is limited by artificially installed channel
constraints, while the upper half, from Colusa to Red Bluff (RM 143-244), is relatively free
to meander, though riprap has been installed on this reach in the second half of this century.
Our study was located in this upper half that is relatively free to migrate.
Geologic setting
The Sacramento River flows south through the Sacramento Valley over sedimentary rocks
and recent alluvium. The Sacramento Valley is a structurally controlled basin between the
Cascade and Sierra Nevada Mountains to the east and the Coast Ranges of California to the
west (Harwood and Helley 1987).
Four major tectonic units comprise the Sacramento River watershed: 1) the Great Valley
sedimentary sequence, located in the Coast Range; 2) the Franciscan formation, also part of
the Coast Range; 3) the Klamath Mountains, to the north and northwest, which form an
island arc terrane composed of marine sediments and granitic plutons; and 4) areas of
Pliocene-Recent extrusive volcanic activity, located to the northeast of the river in the
Southern Cascades. There are also areas of Pliocene-Pleistocene alluvium and fluvial
deposits found in the Sacramento Valley, the Corning Domain, and the Chico Domain
through which the river flows. The composition of sediments that are deposited into the
Sacramento River from creeks is directly related to the surrounding tectonic units
(Robertson 1987).
The reach between Red Bluff and Colusa (i.e. from RM 244 to RM 143) is primarily a
single-thread sinuous channel. The slope, averaged over a minimum of 5 km, ranges from
0.0002 m/m to 0.0007 m/m (Water Engineering and Technology 1988). The riverbed
material is primarily sand and pebbly gravel with a median grain size that ranges from 5 to
35 mm in the reach RM 184-201 (Water Engineering and Technology 1988). The channel
banks are typically composed of sand and gravel with isolated patches of erosion-resistant
rocks of Modesto or Riverbank formation. Between RM 240 and RM 185, the average
Bureau of Reclamation report Page 6 of 28
bank height from thalweg to top of the bank varies from 2 to 8 m with the mean of 4 m
(CDWR 1994).
The Pliocene-Pleistocene deposits comprising the banks and floodplain of the Sacramento
River are variable in terms of bank “erodibility.” Erodibility refers to the relative resistance
of bank materials to lateral migration and can be expressed as a coefficient for use in
numeric meander models (Johannesson and Parker 1989, Larsen 1995, Micheli et al. 2004).
Channel banks are typically composed of sand and gravel with isolated patches of erosion-
resistant bedrock of the Modesto or Riverbank formations, terrace deposits typically
consisting of 1-3 m of dark gray to red fine sand and silt overlying 1.5-2 m of poorly sorted
gravel (CDWR 1994). The Modesto formation is younger than the Riverbank formation
and is usually less than 2.5 m thick and composed of gravel, sand, silt, and clay (CDWR
1994). Where Riverbank and Modesto are exposed, reduced rates of bank erosion and
channel migration have been observed (Fischer 1994, Larsen and Greco 2002).
METHODS
Quantifying River Geometry over Time Using GIS techniques
Observing changes in channel centerline data over time is a tested method of quantifying
transitions in river geometry and measuring the lateral movement of a river channel over
time (e.g.Brice 1977, MacDonald et al. 1991, Gurnell et al. 1994, Brewer and Lewin 1998,
Dietrich et al. 1999, Larsen et al. 2002, Micheli et al. 2004). Performing these analyses
using Geographic Information System (GIS) tools allows for automating measurements
promptly, archiving results efficiently, and specifying a repeatable protocol.
Digitizing channel centerlines
Channel centerlines used in this study were derived from historic channel bank locations
(banklines) (Greco and Alford 2003a, b). Using georeferenced aerial photos, planform
maps showing channel locations were digitized into a geographic information system (GIS)
database. A detailed description of the channel mapping process can be found in Greco and
Plant (2003) and Greco et al. (2003). Channel bank lines were mapped on clear acetate
layered over the aerial photographs. The banklines were then scanned, vectorized, and
projected into real-world coordinates using ArcGIS software (ESRI 2003) with control
points derived from USGS orthophoto quadrangles. From these geo-referenced line files,
lateral-change polygons were generated by intersecting the centerline for each pair of
sequential time steps.
The bankline data spanning from 1904 to 1997 were obtained from two types of map
sources, USGS topographic maps (1:68,500) for 1904 banklines and aerial photography
scaled primarily at a scale of 1:10,000 or larger for the remaining years. Where possible,
similar discharge magnitudes were used for plotting banklines from which channel
centerlines were determined. In doing so, the apparent changes of bank locations due to
flow variation instead of channel migration were minimized. (For example, a river at flood
stage will appear wider and less sinuous than when it is contained within low-flow channel
banks). Most air photo surveys were taken during discharges ranging between 57 cms
(2000 cfs) and 85 cms (3000 cfs), which were significantly lower than the estimated
“bankfull” discharge 2265 cms (i.e. 80,000 cfs). Since low-flow centerlines tend to track
Bureau of Reclamation report Page 7 of 28
channel thalwegs, these centerlines tend to reflect the location of the high velocity core at
higher flows which corresponds with the magnitude of shear stresses occurring on the
banks.
Channel centerlines were subsequently digitized on-screen in ArcView by estimating the
location of the line midway between banklines. Because our objective was a single strand
centerline, occasional reaches split by bars or islands were mapped as a single channel. In
these locations, mid-channel bars were ignored if their widths were less than the average
channel width at a straight reach, and if the bar appeared that it would be inundated at
flows approximating bankfull. If mid-channel bar widths were wider than the average
channel width, the widest strand of the split channel was assumed to be dominant and the
centerline was mapped down the center of that strand.
Analyzing geometric properties of centerlines
A suite of geometric attributes were measured on each of the channel centerlines in our
study. A mathematical algorithm was used to calculate curvature values every 0.25 channel
widths (approximately every 60 meters) along centerlines for each year (e.g. Johannesson
and Parker 1989). An ArcView script was used to analyze the curvature for identifying
inflection points (where curvature changes sign). Initially, the entire length of a centerline
was broken into “segments” strictly defined as a section between two mathematically
identified inflection points. Second, small segments (less than 2 channel widths) were
manually merged with their neighbors to form channel segments were greater than 2
channel widths. In this way, the entire river length was composed of the sum of the
segments.
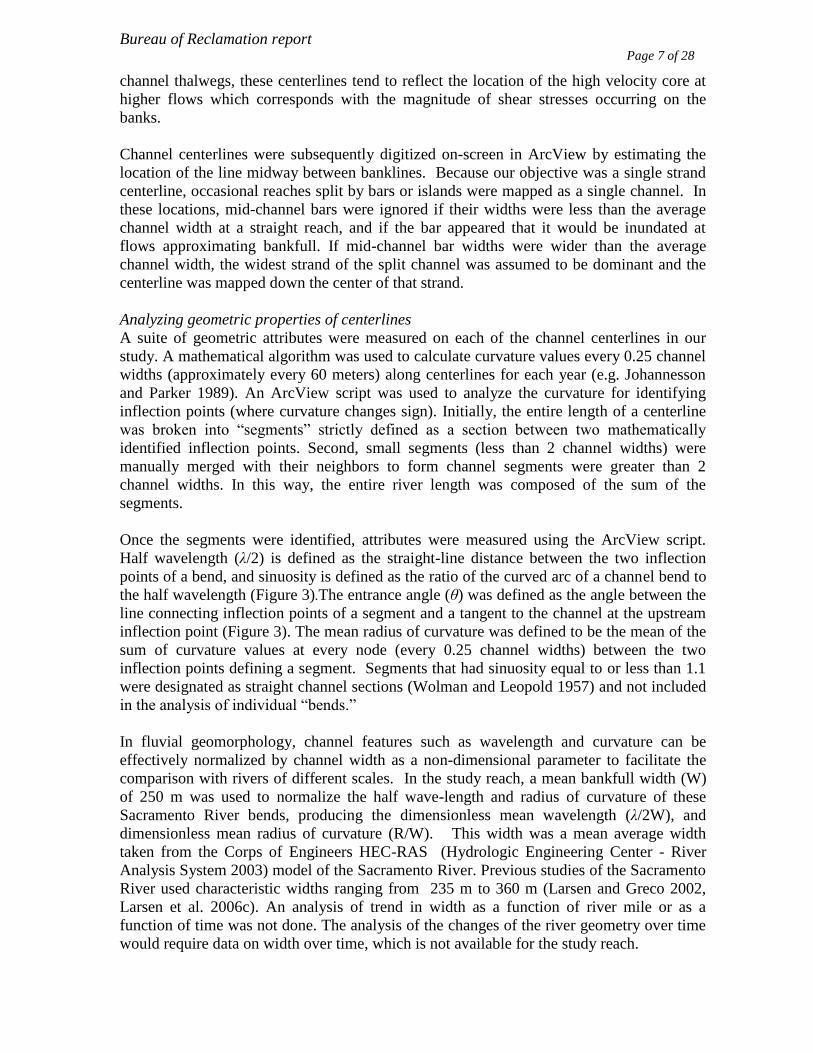
Once the segments were identified, attributes were measured using the ArcView script.
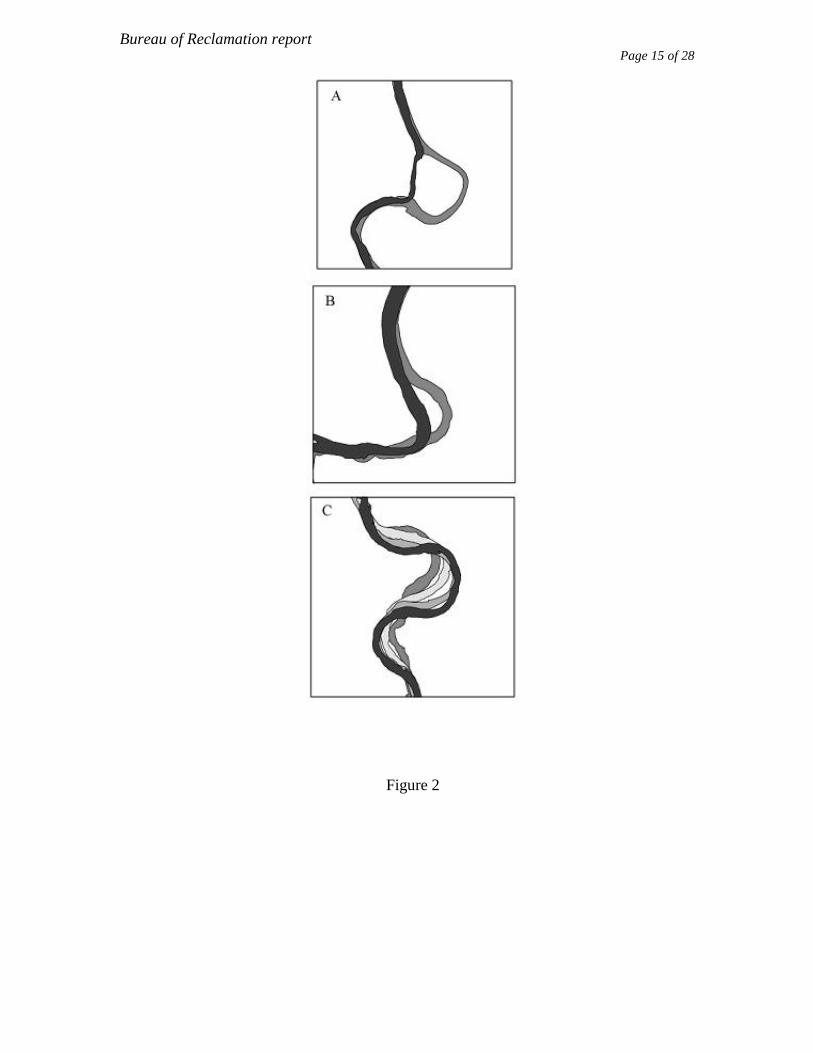
Half wavelength (λ/2) is defined as the straight-line distance between the two inflection
points of a bend, and sinuosity is defined as the ratio of the curved arc of a channel bend to
the half wavelength (Figure 3).The entrance angle (θ) was defined as the angle between the
line connecting inflection points of a segment and a tangent to the channel at the upstream
inflection point (Figure 3). The mean radius of curvature was defined to be the mean of the
sum of curvature values at every node (every 0.25 channel widths) between the two
inflection points defining a segment. Segments that had sinuosity equal to or less than 1.1
were designated as straight channel sections (Wolman and Leopold 1957) and not included
in the analysis of individual “bends.”
In fluvial geomorphology, channel features such as wavelength and curvature can be
effectively normalized by channel width as a non-dimensional parameter to facilitate the
comparison with rivers of different scales. In the study reach, a mean bankfull width (W)
of 250 m was used to normalize the half wave-length and radius of curvature of these
Sacramento River bends, producing the dimensionless mean wavelength (λ/2W), and
dimensionless mean radius of curvature (R/W). This width was a mean average width
taken from the Corps of Engineers HEC-RAS (Hydrologic Engineering Center - River
Analysis System 2003) model of the Sacramento River. Previous studies of the Sacramento
River used characteristic widths ranging from 235 m to 360 m (Larsen and Greco 2002,
Larsen et al. 2006c). An analysis of trend in width as a function of river mile or as a
function of time was not done. The analysis of the changes of the river geometry over time
would require data on width over time, which is not available for the study reach.
Bureau of Reclamation report Page 8 of 28
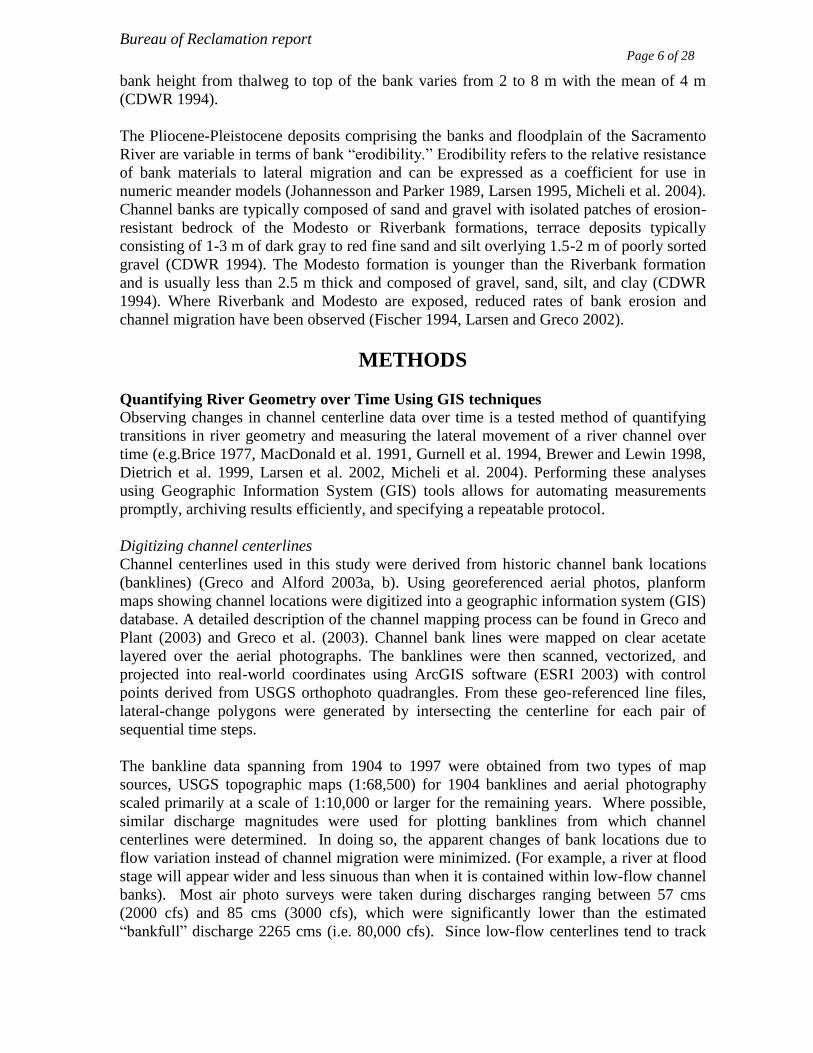
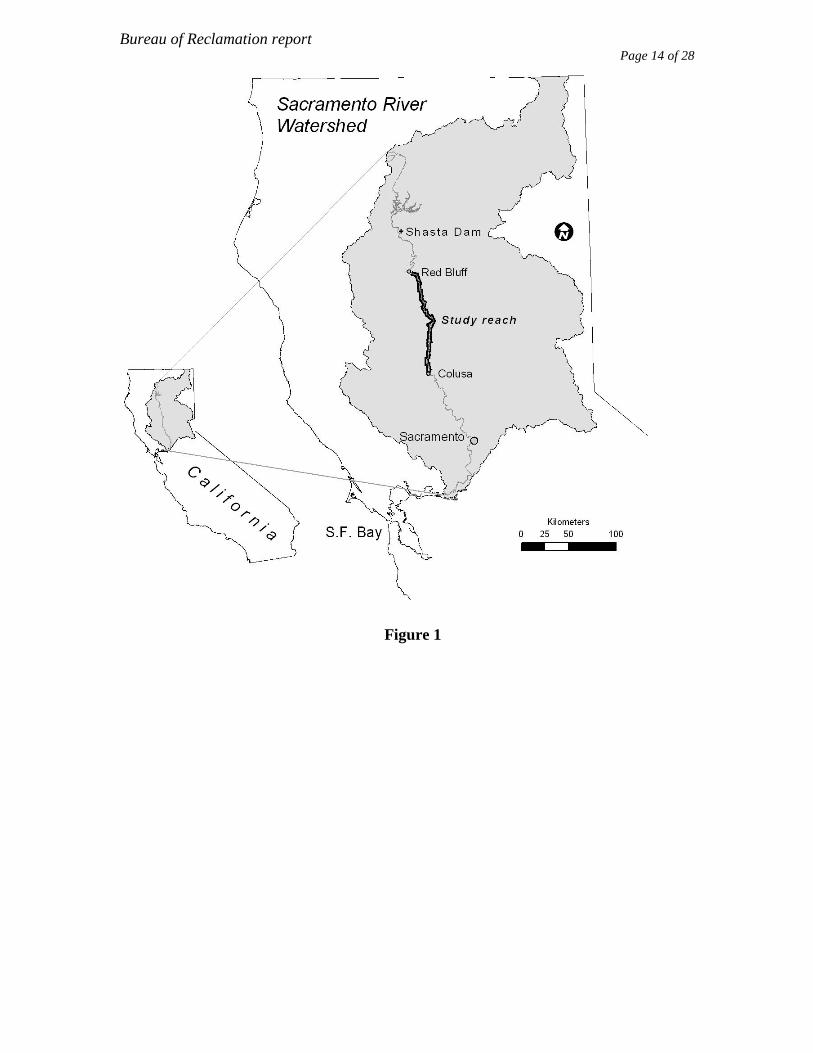
Parameters were measured for all segments, and separated into categories. Chute and
partial cutoffs were identified from channel planforms (Figure 2) (Micheli and Larsen In
prep.) In addition, bends that did not experience cutoff but had similar sinuosity to the ones
that experienced cutoff (sinuosity > 1.85) were classified into a separate class (table 3).
For a comparison of channel length and sinuosity in different years, a “clipped” channel
length was established (Table 1). This was done because channel centerlines in each of the
7 years for the complete study did not begin and end at exactly the same location. The
modified channel lengths were measured from “clipped segments” that began and ended at
the same locations (when projected onto the valley axis that is described below). For this
length, the associated clipped valley length was 104 km. The clipped length was used for
comparisons of channel length and sinuosity between years.
The sinuosity of the whole channel reach was calculated in two ways, bend-by-bend, and
by valley length, both of which used “clipped lengths”. For the sinuosity measured “bend-
by bend” the sum of the arc length along the channel was divided by the sum of the straight
line lengths between inflection points. The sinuosity was also measured as the quotient of
the arc length of the channel divided by the valley length. Because the valley length was
less sinuous (therefore shorter) than the sum of the straight lines between inflection points,
the sinuosity measured using the valley length is greater than the bend-by-bend derived
sinuosity.
Linking bend geometry to subsequent channel movement: progressive migration versus
chute cut-off
Superimposing a temporal sequence of centerlines derived from channel planform maps is
a common approach to detecting patterns of lateral channel change, including progressive
migration and river channel cutoffs (e.g. Brice 1977, MacDonald et al. 1991, Gurnell et al.
1994, Gurnell 1997, Brewer and Lewin 1998, Dietrich et al. 1999, Larsen et al. 2002,
Larsen et al. 2004, Micheli et al. 2004). Chute cutoff, partial cutoff, and progressive
migration are described in Micheli and Larsen (In prep.)
The “lateral change polygons” were categorized, based on an inspection of the aerial
photography used to map channel centerlines, as one of four categories: progressive
migration, channel cutoff (both chute and partial), and stable “high sinuosity” bends. The
geometric attributes of bends in each of these categories were tabulated and graphed for
each time period (Figure 5.)
Lateral change polygons were created by intersecting sequential channel centerlines and
used to calculate rates of lateral channel change based on the methodology of Larsen et al.
(2002) and Micheli et al. (2004). Lateral migration was measured by mapping sequential
channel centerlines in an ArcInfo software environment and by quantifying the change in
location of a channel centerline over time using a unit called the ‘eroded-area polygon’. An
eroded-area polygon is created by intersecting two channel centerlines mapped at two
different points in time (Larsen et al. 2002, Micheli et al. 2004). This approach is similar to
that applied by MacDonald et al. (1991) to a set of Minnesota streams. ArcInfo calculates
the area and perimeter of the eroded polygon, from which the ‘average distance migrated
perpendicular to the channel centerline’ was calculated. The lateral migration distance is
Bureau of Reclamation report Page 9 of 28
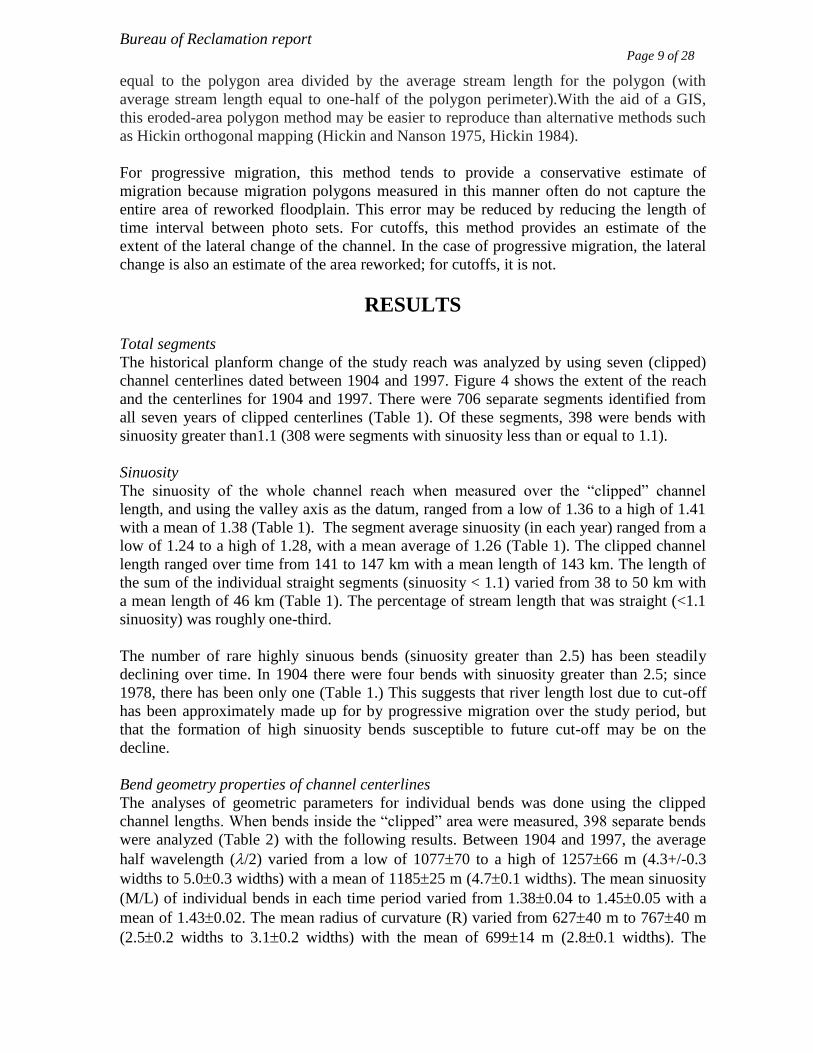
equal to the polygon area divided by the average stream length for the polygon (with
average stream length equal to one-half of the polygon perimeter).With the aid of a GIS,
this eroded-area polygon method may be easier to reproduce than alternative methods such
as Hickin orthogonal mapping (Hickin and Nanson 1975, Hickin 1984).
For progressive migration, this method tends to provide a conservative estimate of
migration because migration polygons measured in this manner often do not capture the
entire area of reworked floodplain. This error may be reduced by reducing the length of
time interval between photo sets. For cutoffs, this method provides an estimate of the
extent of the lateral change of the channel. In the case of progressive migration, the lateral
change is also an estimate of the area reworked; for cutoffs, it is not.
RESULTS
Total segments
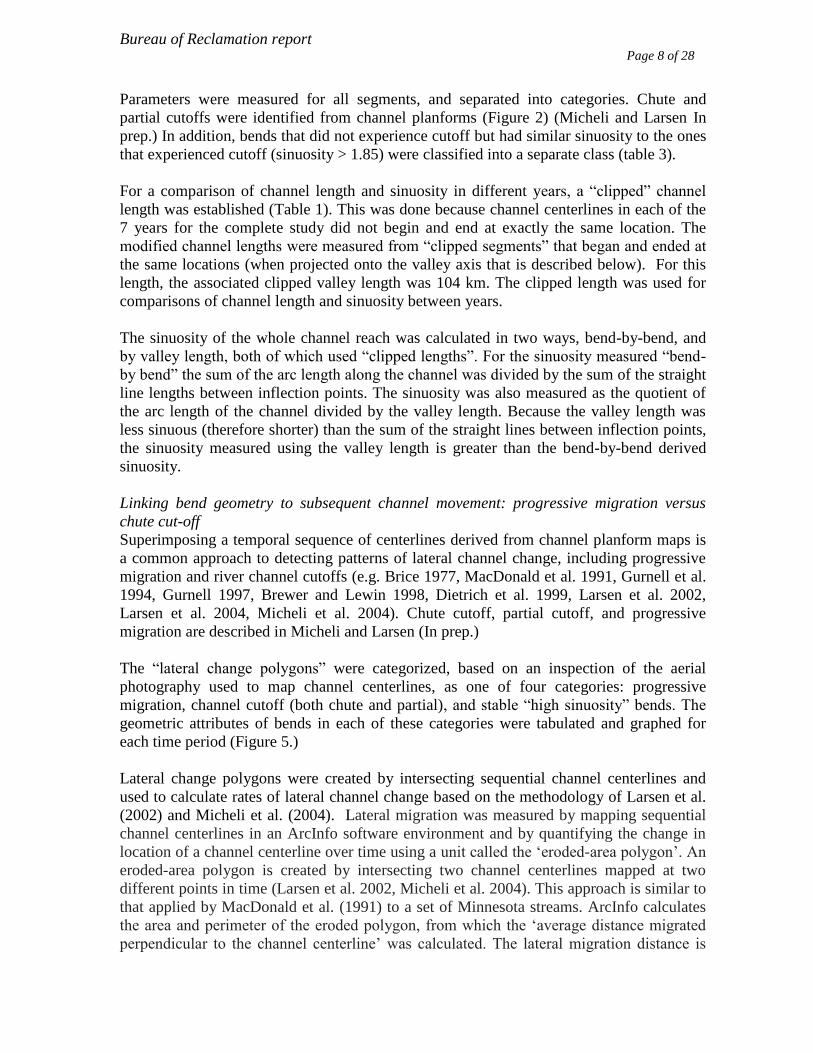
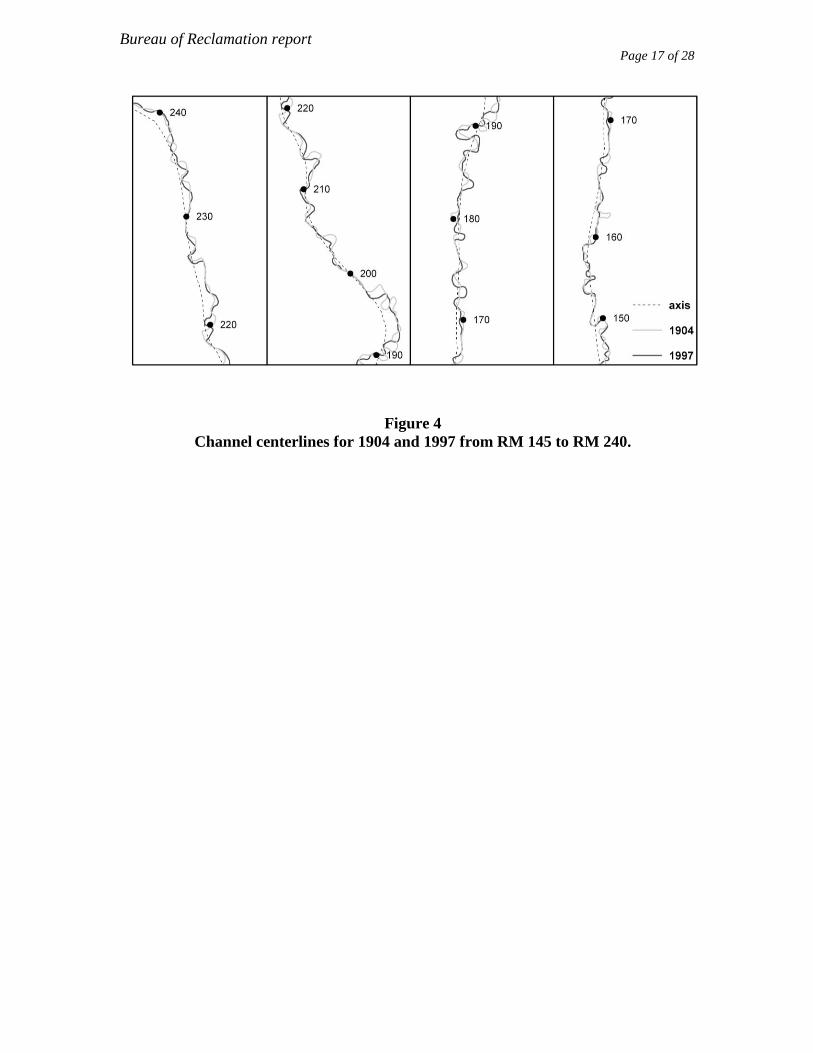
The historical planform change of the study reach was analyzed by using seven (clipped)
channel centerlines dated between 1904 and 1997. Figure 4 shows the extent of the reach
and the centerlines for 1904 and 1997. There were 706 separate segments identified from
all seven years of clipped centerlines (Table 1). Of these segments, 398 were bends with
sinuosity greater than1.1 (308 were segments with sinuosity less than or equal to 1.1).
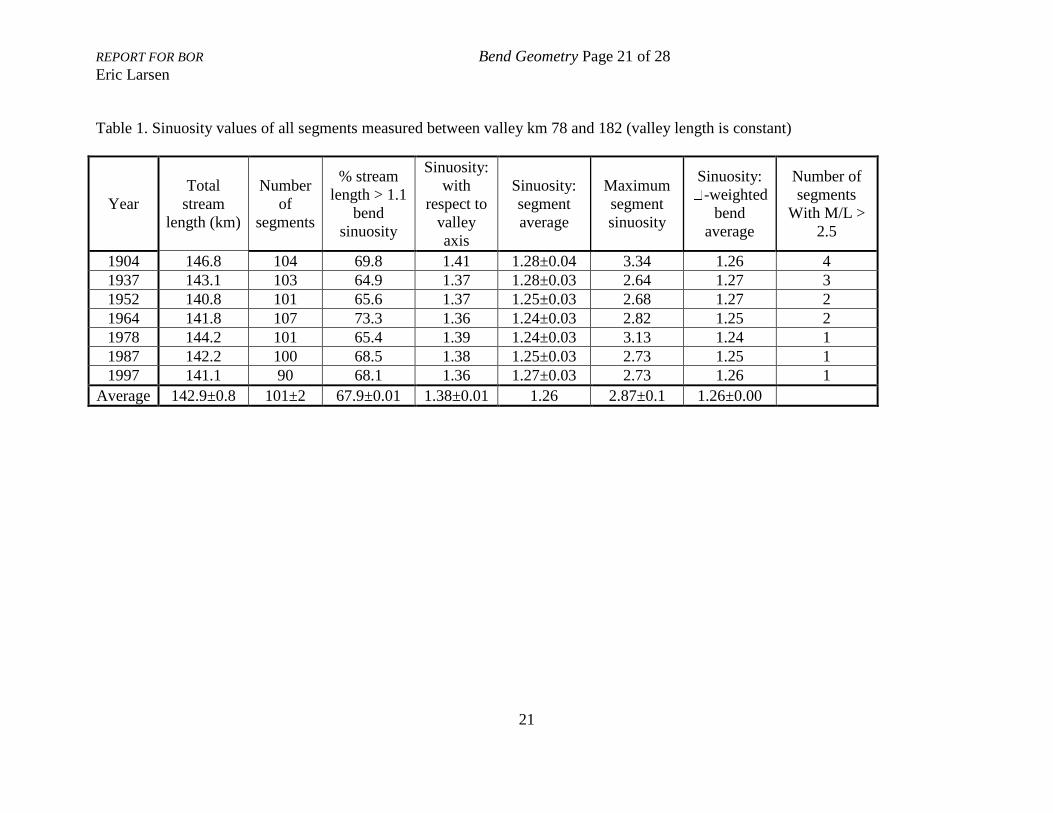
Sinuosity
The sinuosity of the whole channel reach when measured over the “clipped” channel
length, and using the valley axis as the datum, ranged from a low of 1.36 to a high of 1.41
with a mean of 1.38 (Table 1). The segment average sinuosity (in each year) ranged from a
low of 1.24 to a high of 1.28, with a mean average of 1.26 (Table 1). The clipped channel
length ranged over time from 141 to 147 km with a mean length of 143 km. The length of
the sum of the individual straight segments (sinuosity < 1.1) varied from 38 to 50 km with
a mean length of 46 km (Table 1). The percentage of stream length that was straight (<1.1
sinuosity) was roughly one-third.
The number of rare highly sinuous bends (sinuosity greater than 2.5) has been steadily
declining over time. In 1904 there were four bends with sinuosity greater than 2.5; since
1978, there has been only one (Table 1.) This suggests that river length lost due to cut-off
has been approximately made up for by progressive migration over the study period, but
that the formation of high sinuosity bends susceptible to future cut-off may be on the
decline.
Bend geometry properties of channel centerlines
The analyses of geometric parameters for individual bends was done using the clipped
channel lengths. When bends inside the “clipped” area were measured, 398 separate bends
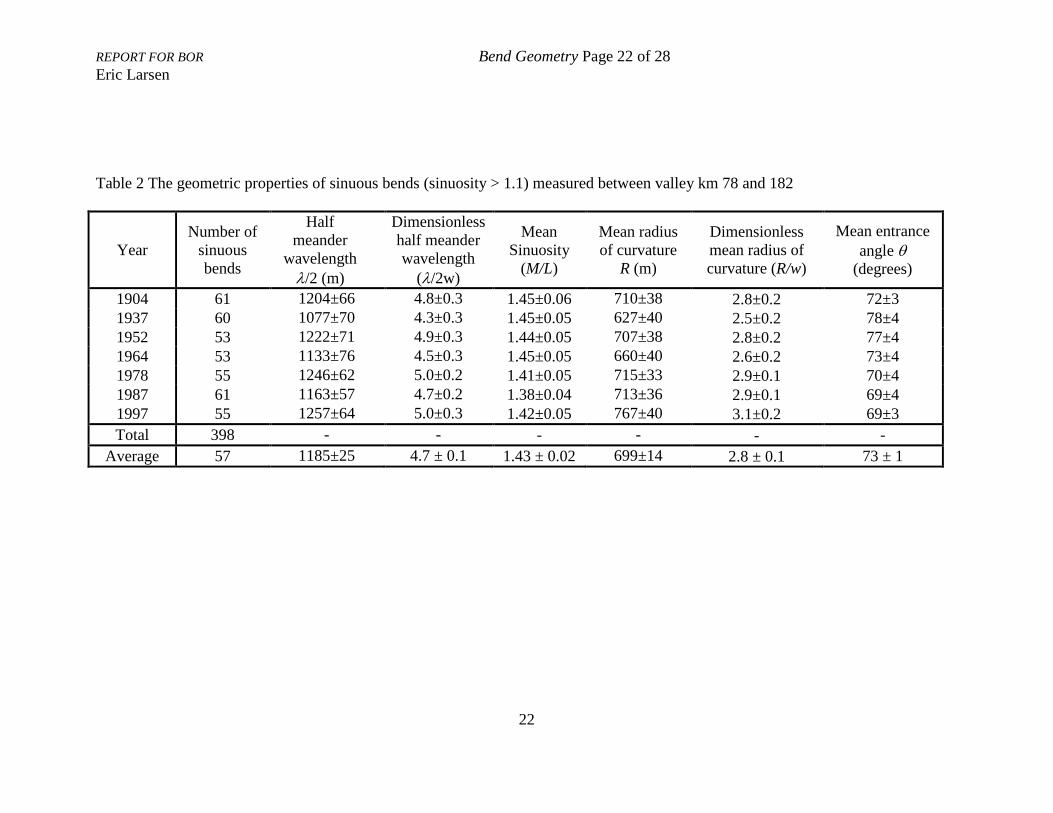
were analyzed (Table 2) with the following results. Between 1904 and 1997, the average
half wavelength (/2) varied from a low of 107770 to a high of 125766 m (4.3+/-0.3
widths to 5.00.3 widths) with a mean of 118525 m (4.70.1 widths). The mean sinuosity
(M/L) of individual bends in each time period varied from 1.380.04 to 1.450.05 with a
mean of 1.430.02. The mean radius of curvature (R) varied from 62740 m to 76740 m
(2.50.2 widths to 3.10.2 widths) with the mean of 69914 m (2.80.1 widths). The
Bureau of Reclamation report Page 10 of 28
entrance angle θ varied from 693 degrees to 784 degrees with a mean of 731 degrees
(Table 2). The average bend sinuosity remained essentially constant during the entire
period and the other three geometric attributes varied only slightly over time (figure 5). In
general, the average geometric properties of all sinuous bends did not change significantly
for roughly 100 years.
Geometric attributes of cutoff versus progressively migrating bends
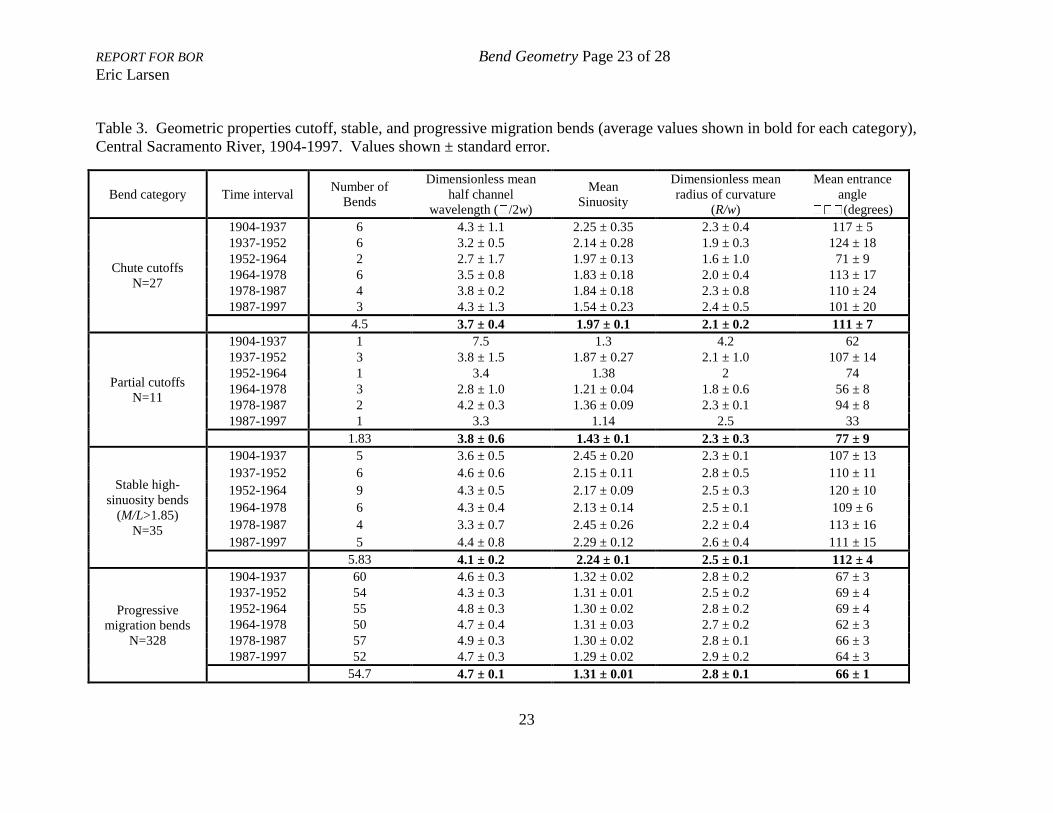
Geometric attributes of delineated meander bends provide a basis for correlating channel
centerline geometry to subsequent modes of channel change (Table 3). Bends that
experienced chute cutoff displayed an average sinuosity of 1.97 0.1, an average radius of
curvature of 2.1 0.2 channel widths, an average half-wavelength of 3.7 0.4 channel
widths, and an average entrance angle of 111 7 degrees, as opposed to average values for
bends migrating progressively of 1.31 0.01, 2.8 0.1, 4.7 0.1 and 66 1 degrees
(respectively). The typical geometry of bends that migrated via chute cutoff is found to be
distinctively different from bends that migrated progressively in terms of sinuosity (50%
higher), radius of curvature (29% smaller), wavelength (21% shorter), and entrance angle
(68% higher). The average sinuosity of chute cutoff bends was also 40% higher than the
average bend sinuosity (1.43 0.10) of partial cutoffs. A comparison of partial cutoffs and
progressive migration bends reveals no significant difference in half wavelength, but
differences of 9% lower sinuosity, 18% higher radius of curvature, and 17% lower entrance
angles for progressive migration bends (Table 3). Thus, average bend geometries show
clear distinctions between chute cutoff and progressive migration bends, with partial
cutoffs occurring at intermediate values that are still distinctive from progressive migration
in terms of sinuosity, radius of curvature, and entrance angle.
Comparing the average planform geometry of cutoff bends with high-sinuosity bends
(sinuosity > 1.85 channel widths) that remained stable (i.e. no cutoff) over each time
interval provides a starting point for evaluating the usefulness of centerline data for
predicting the likelihood of potential cutoff (Table 3). Stable bends in excess of 1.85
sinuosity displayed an average sinuosity (2.2 0.1) just slightly higher than that of chute
cutoffs, so a sinuosity threshold alone is not a good indicator of cutoff likelihood. Stable
sinuous bends also displayed similar values for wavelength compared to both chute and
partial cutoffs. The average mean entrance angle for chute cutoffs and stable sinuous bends
were essentially equal (111 7 and 112 4 degrees, respectively), and significantly higher
than that measured for partial cutoff bends (77 9 degrees). However, the dimensionless
mean radius of curvature (R/w) for chute cutoffs (2.1 0.2) was consistently lower than
that measured for stable sinuous bends (2.5 0.1).
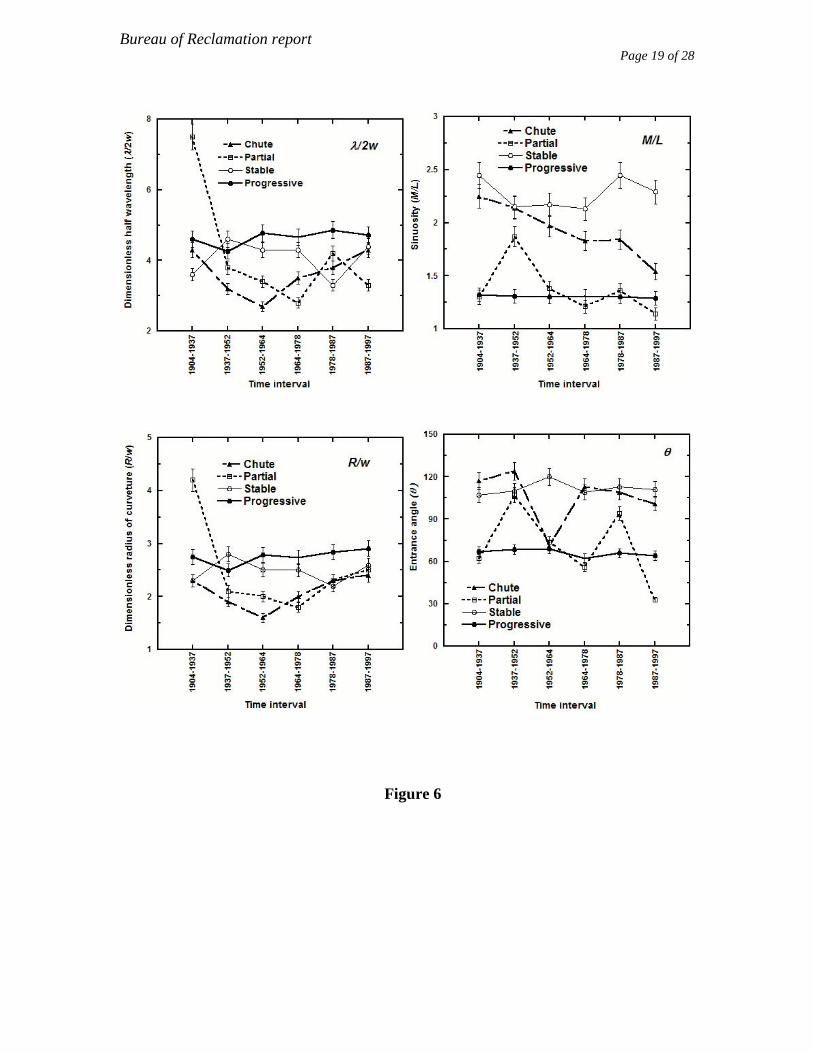
Figure 6 shows how average bend geometries for cutoffs versus progressive migration and
stable sinuous bends varied over time by plotting average values for each time interval
(Table 3). Except for an anomalously high dimensionless mean half wavelength (/2w) for
a single partial cutoff in the first time period (1904-1937), cutoffs display consistently
shorter wavelengths than progressive migration bends, with stable high sinuosity bends
generally intermediate between cutoffs and progressive bends. A similar trend is evident
for dimensionless radius of curvature. Entrance angles are consistently higher for stable
sinuous bends that progressive migration bends, with chute cutoff values wavering between
these two data sets in the range of 71 to 124 degrees. The data show a dip in average half
Bureau of Reclamation report Page 11 of 28
wavelength, radius of curvature, and entrance angle for the two time intervals between
1952 and 1978 for both types of cutoffs, coinciding with periods of greatest cutoff activity.
One observation is a trend towards increasing radius of curvature and wavelength for both
chute cutoffs and progressive migration bends since the mid 1960s.
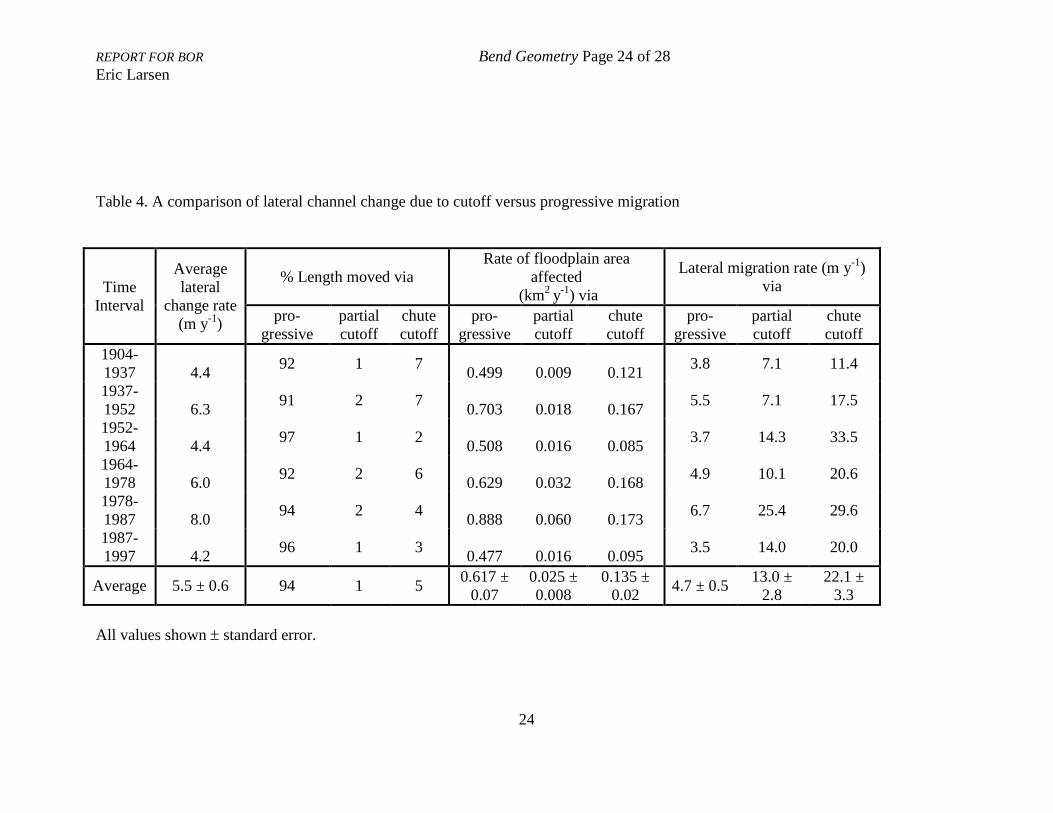
A comparison of extent and rate of lateral channel change via cutoff versus progressive
migration
The majority of lateral channel change on the Sacramento River has occurred via
progressive migration rather than channel cutoff. While an average of 94% of the total
stream length migrated via progressive migration, 5% migrated via chute cutoff and only
1% migrated via partial cutoff (Table 4). However, the rate of floodplain area reworked by
progressive migration (0.617 0.07 km2
y-1
) was only 4.4 times greater than the rate of
floodplain area cutoff (0.14 0.02 km2
y-1
). The greater ratio of floodplain affected by
cutoff is because per unit stream length migrated, cutoff results in much larger increments
of lateral change than progressive migration, with chute cutoffs creating on average 22.1
3.3 m y-1
lateral change versus average progressive migration rates of 4.7 0.5 m y-1
over
the same period (Table 4). However, trends in progressive migration drive average
migration rates for the whole river, with an average lateral migration rate of 5.5 0.6 m y-1
for progressive migration and cutoff combined.
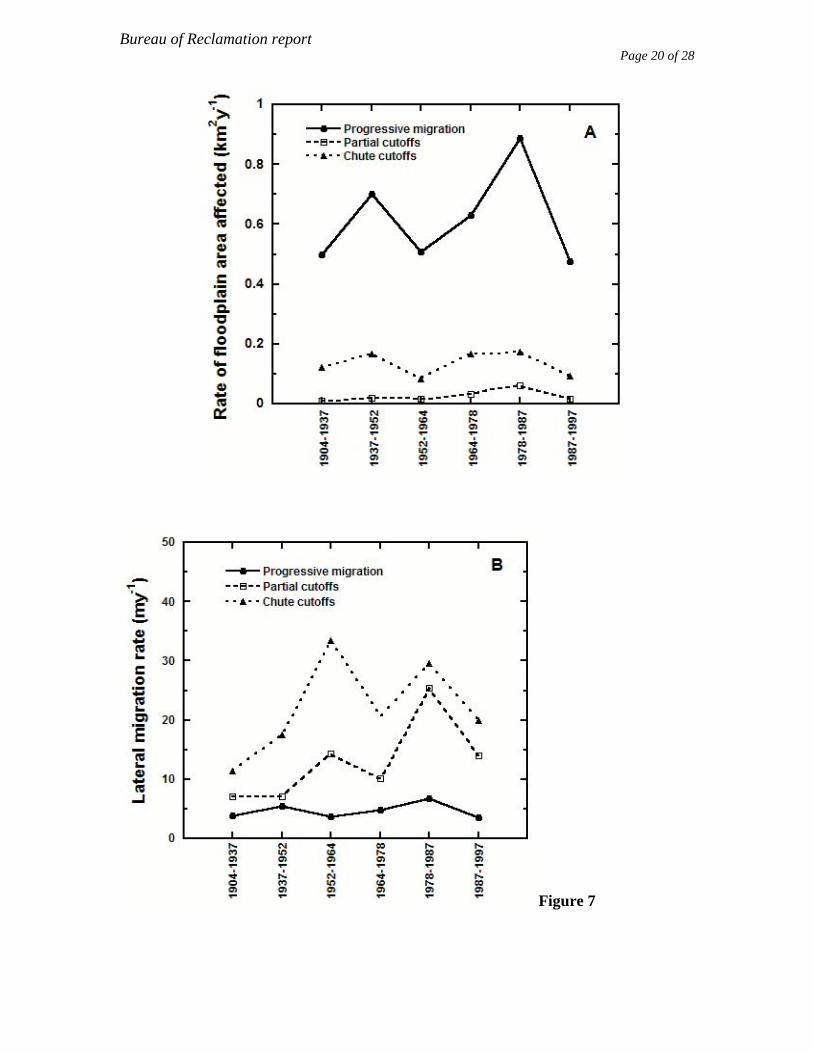
Temporal trends in rates of progressive migration versus cutoff are displayed in Figure 7.
In general, trends towards increased or decreased migration rates between successive time-
steps via progressive migration and cutoff are synchronized. However, the average lateral
migration rate per unit stream length is not well correlated, since two time-steps (1952 to
1964 and 1964 to 1978) showed inverse trends for progressive migration versus cutoff
(with cutoff rates increasing in the earlier time step while progressive migration rates
declined, and vice versa for the latter). Figure 7B shows a trend towards increasing rates of
lateral migration attributable to cutoff over this time period. Thus, while the linear extent
of river experiencing cutoff decreased over the study period, the average rate of lateral
change per cutoff event has increased.
DISCUSSION
Water diversion, flow regulation, and flow thresholds: impact on migration rates
Water diversion and flow regulation of the Sacramento River channel over time has
influenced channel migration rates and the area of floodplain reworked. Water diversions
reduce the amount of stream power acting on the channel banks, while flow regulations
redistribute large fluctuating winter flows to constant low flows during the summer and fall
months. This water is held behind the dam and let out during the dry months. These
summer flows tend not to cause significant migration (Buer 2005). For this reason, one can
consider there to be a “threshold” of flow magnitude below which there is effectively no
migration. It is difficult to separate the effect of water diversion and flow regulation;
however, it is clear that flow regulation has had a significant impact on migration rates
through the annual redistribution of flows. As a greater percentage of flows are below the
threshold for migration, migration rates may be reduced.
Bureau of Reclamation report Page 12 of 28
The contributing factors to channel migration patterns are complex. Where flow regulation
and channel constraints reduce migration rates, some management actions like vegetation
clearing increase it. Isolating the effect on channel migration by type of impact and amount
would allow a fuller understanding of migration processes that would benefit
environmental assessment and potential restoration/mitigation strategies. In particular, it
would be important to identify the locations of channel constraints, and to study the historic
migration patterns of individual bends, including the information on whether or not the
channel was restrained, and when this occurred.
Removing channel restraint versus changing flow patterns: implications for magnitude of
channel migration
Changing flow patterns (volume, peak, duration, and timing) affects the pattern of meander
migration. A previous study linked the cumulative excess streampower with the magnitude
of bank migration (Larsen et al. 2006b). Using the results of that study, a variable flow
model was used to predict the potential effects of water diverted from the Sacramento
River by the potential installation of a new reservoir (Larsen et al. 2006a). The study results
showed that the potential flow management scenarios resulted in a 1-8 % reduction in land
reworked. The magnitude of change in migration rates with diversion scenarios directly
reflected the magnitude of changes in stream power.
Although a 1-8% impact is significant, especially considering it would be due to a single
water reclamation project, it is considerably less than the impacts of bank protection
projects (e.g., rip-rap and groins) on river meander migration patterns. Larsen et al (2006c)
found that replacing current bank protection projects on one reach of the Sacramento River
with setback levees 300-700 m from the river channel could result in a 370-550% increase
in land reworked. Knowing how changes in flow and changes in bank restraint effect
channel migration rates allows for effective assessment of environmental impacts and
benefits related to management scenarios. For example, land managers would be able to
assess how many kilometers of rip-rap would need to be removed at given locations to
offset the impact of water management scenarios. Meander migration simulations, used to
model the effects of changing flows and channel restraints, are effective in considering
mitigation strategies for any actions that impact channel migration.
The effects of land conversion and sediment transport on meander migration rates
Research related to the effect of land conversion on migration rate has shown that the
central reach of the Sacramento River tends to migrate more quickly through agricultural
land than through riparian forest (Micheli et al. 2004). Removal of riparian forest
vegetation appears to accelerate migration rates and increase bank erodibility by 80 to
150%. The overall erodibility of the floodplain tends to correlate with the mean migration
rate in the same floodplain. Although bank migration is related to the magnitude of the
near-bank velocity, variations in calculated near-bank velocity are generally much less than
measured migration rates. Thus, although one needs to consider near-bank velocity
variations when considering the relationship between bank erodibility and migration rate,
calculation of mean migration rates alone may reflect differences in floodplain erodibility
when measured over a suitable length.
It is unclear how variations in sediment transport due to mining, dam installation, and other
channel alterations may have influenced historical rates and patterns of meander migration.
Bureau of Reclamation report Page 13 of 28
It is possible that increased sediment transport rates can increase deposition on point bars
which can induce “topographic steering” or a “bar-push” effect (Nelson and Smith 1989)
that can increase bend migration rates locally. In areas of decreasing sediment transport,
there may be a tendency for less progressive lateral migration and an increased tendency
for cutoff (Singer 2006).
Summary of discussion
Migration rates and cutoff tendencies, as measured in this study, are affected by flow
variations including the effects of changing frequency, timing and duration of flow. Other
influences on bank erosion rates include bank stabilization, land conversion from riparian
forests to agriculture, and sediment transport. In detailed studies of site-specific bends, or
in restoration or mitigation plans, it may be important to “parse out” the contributions of
each of these effects and their relative magnitude. The migration rates and cut-off
tendencies reported here for 100 miles of river over almost a full century may serve as a
frame of reference for such site-specific considerations.
ACKNOWLEDGMENTS
This report will be submitted as a journal article prepared in conjunction with Elisabeth R.
Micheli, who collaborated on early research for this work supported by the California
Department of Water Resources. Early versions of GIS analysis and data tabulation were
done by Laura Beninger, Ellen Avery, Krishna Dole, and Peng Gao. Support to complete
the analyses and writing was gratefully received from the Natural Heritage Institute and the
U.S. Bureau of Reclamation.
Bureau of Reclamation report Page 14 of 28
Figure 1
Bureau of Reclamation report Page 15 of 28
Figure 2
Bureau of Reclamation report Page 16 of 28
Figure 3
Definition of terms for a single bend. L is the “half wavelength.”
w
R
Sinuosity L
M
2
L
Bureau of Reclamation report Page 17 of 28
Figure 4
Channel centerlines for 1904 and 1997 from RM 145 to RM 240.

Bureau of Reclamation report Page 18 of 28
Figure 5
Bureau of Reclamation report Page 19 of 28
Figure 6
Bureau of Reclamation report Page 20 of 28
Figure 7
REPORT FOR BOR Bend Geometry Page 21 of 28
Eric Larsen
21
Table 1. Sinuosity values of all segments measured between valley km 78 and 182 (valley length is constant)
Year
Total
stream
length (km)
Number
of
segments
% stream
length > 1.1
bend
sinuosity
Sinuosity:
with
respect to
valley
axis
Sinuosity:
segment
average
Maximum
segment
sinuosity
Sinuosity:
-weighted
bend
average
Number of
segments
With M/L >
2.5
1904 146.8 104 69.8 1.41 1.28±0.04 3.34 1.26 4
1937 143.1 103 64.9 1.37 1.28±0.03 2.64 1.27 3
1952 140.8 101 65.6 1.37 1.25±0.03 2.68 1.27 2
1964 141.8 107 73.3 1.36 1.24±0.03 2.82 1.25 2
1978 144.2 101 65.4 1.39 1.24±0.03 3.13 1.24 1
1987 142.2 100 68.5 1.38 1.25±0.03 2.73 1.25 1
1997 141.1 90 68.1 1.36 1.27±0.03 2.73 1.26 1
Average 142.9±0.8 101±2 67.9±0.01 1.38±0.01 1.26 2.87±0.1 1.26±0.00
REPORT FOR BOR Bend Geometry Page 22 of 28
Eric Larsen
22
Table 2 The geometric properties of sinuous bends (sinuosity > 1.1) measured between valley km 78 and 182
Year
Number of
sinuous
bends
Half
meander
wavelength
/2 (m)
Dimensionless
half meander
wavelength
(/2w)
Mean
Sinuosity
(M/L)
Mean radius
of curvature
R (m)
Dimensionless
mean radius of
curvature (R/w)
Mean entrance
angle
(degrees)
1904 61 1204±66 4.8±0.3 1.45±0.06 710±38 2.8±0.2 72±3
1937 60 1077±70 4.3±0.3 1.45±0.05 627±40 2.5±0.2 78±4
1952 53 1222±71 4.9±0.3 1.44±0.05 707±38 2.8±0.2 77±4
1964 53 1133±76 4.5±0.3 1.45±0.05 660±40 2.6±0.2 73±4
1978 55 1246±62 5.0±0.2 1.41±0.05 715±33 2.9±0.1 70±4
1987 61 1163±57 4.7±0.2 1.38±0.04 713±36 2.9±0.1 69±4
1997 55 1257±64 5.0±0.3 1.42±0.05 767±40 3.1±0.2 69±3
Total 398 - - - - - -
Average 57 1185±25 4.7 ± 0.1 1.43 ± 0.02 699±14 2.8 ± 0.1 73 ± 1
REPORT FOR BOR Bend Geometry Page 23 of 28
Eric Larsen
23
Table 3. Geometric properties cutoff, stable, and progressive migration bends (average values shown in bold for each category),
Central Sacramento River, 1904-1997. Values shown ± standard error.
Bend category Time interval Number of
Bends
Dimensionless mean
half channel
wavelength ( /2w)
Mean
Sinuosity
Dimensionless mean
radius of curvature
(R/w)
Mean entrance
angle
(degrees)
Chute cutoffs
N=27
1904-1937 6 4.3 ± 1.1 2.25 ± 0.35 2.3 ± 0.4 117 ± 5
1937-1952 6 3.2 ± 0.5 2.14 ± 0.28 1.9 ± 0.3 124 ± 18
1952-1964 2 2.7 ± 1.7 1.97 ± 0.13 1.6 ± 1.0 71 ± 9
1964-1978 6 3.5 ± 0.8 1.83 ± 0.18 2.0 ± 0.4 113 ± 17
1978-1987 4 3.8 ± 0.2 1.84 ± 0.18 2.3 ± 0.8 110 ± 24
1987-1997 3 4.3 ± 1.3 1.54 ± 0.23 2.4 ± 0.5 101 ± 20
4.5 3.7 ± 0.4 1.97 ± 0.1 2.1 ± 0.2 111 ± 7
Partial cutoffs
N=11
1904-1937 1 7.5 1.3 4.2 62
1937-1952 3 3.8 ± 1.5 1.87 ± 0.27 2.1 ± 1.0 107 ± 14
1952-1964 1 3.4 1.38 2 74
1964-1978 3 2.8 ± 1.0 1.21 ± 0.04 1.8 ± 0.6 56 ± 8
1978-1987 2 4.2 ± 0.3 1.36 ± 0.09 2.3 ± 0.1 94 ± 8
1987-1997 1 3.3 1.14 2.5 33
1.83 3.8 ± 0.6 1.43 ± 0.1 2.3 ± 0.3 77 ± 9
Stable high-
sinuosity bends
(M/L>1.85)
N=35
1904-1937 5 3.6 ± 0.5 2.45 ± 0.20 2.3 ± 0.1 107 ± 13
1937-1952 6 4.6 ± 0.6 2.15 ± 0.11 2.8 ± 0.5 110 ± 11
1952-1964 9 4.3 ± 0.5 2.17 ± 0.09 2.5 ± 0.3 120 ± 10
1964-1978 6 4.3 ± 0.4 2.13 ± 0.14 2.5 ± 0.1 109 ± 6
1978-1987 4 3.3 ± 0.7 2.45 ± 0.26 2.2 ± 0.4 113 ± 16
1987-1997 5 4.4 ± 0.8 2.29 ± 0.12 2.6 ± 0.4 111 ± 15
5.83 4.1 ± 0.2 2.24 ± 0.1 2.5 ± 0.1 112 ± 4
Progressive
migration bends
N=328
1904-1937 60 4.6 ± 0.3 1.32 ± 0.02 2.8 ± 0.2 67 ± 3
1937-1952 54 4.3 ± 0.3 1.31 ± 0.01 2.5 ± 0.2 69 ± 4
1952-1964 55 4.8 ± 0.3 1.30 ± 0.02 2.8 ± 0.2 69 ± 4
1964-1978 50 4.7 ± 0.4 1.31 ± 0.03 2.7 ± 0.2 62 ± 3
1978-1987 57 4.9 ± 0.3 1.30 ± 0.02 2.8 ± 0.1 66 ± 3
1987-1997 52 4.7 ± 0.3 1.29 ± 0.02 2.9 ± 0.2 64 ± 3
54.7 4.7 ± 0.1 1.31 ± 0.01 2.8 ± 0.1 66 ± 1
REPORT FOR BOR Bend Geometry Page 24 of 28
Eric Larsen
24
Table 4. A comparison of lateral channel change due to cutoff versus progressive migration
Time
Interval
Average
lateral
change rate
(m y-1
)
% Length moved via
Rate of floodplain area
affected
(km2
y-1
) via
Lateral migration rate (m y-1
)
via
pro-
gressive
partial
cutoff
chute
cutoff
pro-
gressive
partial
cutoff
chute
cutoff
pro-
gressive
partial
cutoff
chute
cutoff
1904-
1937 4.4 92 1 7
0.499 0.009 0.121 3.8 7.1 11.4
1937-
1952 6.3 91 2 7
0.703 0.018 0.167 5.5 7.1 17.5
1952-
1964 4.4 97 1 2
0.508 0.016 0.085 3.7 14.3 33.5
1964-
1978 6.0 92 2 6
0.629 0.032 0.168 4.9 10.1 20.6
1978-
1987 8.0 94 2 4
0.888 0.060 0.173 6.7 25.4 29.6
1987-
1997 4.2 96 1 3
0.477 0.016 0.095 3.5 14.0 20.0
Average 5.5 ± 0.6 94 1 5 0.617 ±
0.07
0.025 ±
0.008
0.135 ±
0.02 4.7 ± 0.5
13.0 ±
2.8
22.1 ±
3.3
All values shown standard error.
REPORT FOR BOR Bend Geometry Page 25 of 28
Eric Larsen
25
REFERENCES
Brewer, P. A., and J. Lewin, 1998. Planform Cyclicity in an Unstable Reach: Complex
Fluvial Response to Environmental Change. Earth Surface Processes and
Landforms:989-1008.
Brice, J. C., 1977. Lateral Migration of the Middle Sacramento River, California. USGS
Water-resources investigations 77-43:1-51.
Buer, K. 2005. Personal Communication.
CDWR, 1994. Sacramento River Bank Erosion Investigation Memorandum Progress
Report. State of California, The Resources Agency, Department of Water
Resources, Northern District.
Darby, S. E., A. M. Alabyan, R. Moscow, and M. J. V. d. Wiel, 2002. Numerical
Simulation of Bank Erosion and Channel Migration in Meandering Rivers.
WATER RESOURCES RESEARCH, 38.
Darby, S. E., and C. R. Thorne, 1996a. Development and Testing of Riverbank-Stability
Analysis. Journal of Hydraulic Engineering 122.
Darby, S. E., and C. R. Thorne, 1996b. Numerical Simulation of Widening and Bed
Deformation of Straight Sand-Bed Rivers - I. Model Development. Journal of
Hydraulic Engineering:184-193.
Dietrich, W. E. 2001. Personal Communication.
Dietrich, W. E., G. Day, and G. Parker, 1999. The Fly River, Papua New Guinea:
Inferences About River Dynamics, Floodplain Sedimentation and Fate of Sediment.
Pages 345-376 In A. J. M. A.Gupta, editor. Varieties of Fluvial Form.
ESRI. 2003. Arcgis 8.3. In. Environmental Systems Research Institute, Redlands, CA.
Fares, Y. R., and J. G. Herbertson, 1990. Partial Cut-Off of Meanders Loops; a Comparison
of Mathematical and Physical Model Results. Pages 289-297. In W. R. White,
editor. International Conference on River Flood Hydraulics: Chichester, United
Kingdom. John Wiley & Sons.
Fischer, K. J., 1994. Fluvial Geomorphology and Flood Control Strategies: Sacramento
River, California. Pages 115-139 In S. A. Schumm, Winkley,B.R., editor. The
Variability of Large Alluvial Rivers. ASCE Press American Society of Civil
Engineers, New York.
Furbish, D. J., 1991. Spatial Autoregressive Structure in Meander Evolution. Geological
Society of America Bulletin 103:1576-1589.
Golet, G., M. Roberts, E. Larsen, R. Luster, R. Unger, G. Werner, and G. White, 2006.
Assessing Societal Impacts When Planning Restoration of Large Alluvial Rivers: A
Case Study of the Sacramento River Project, California. Environmental
Management DOI 10.1007/s00267-004-0167-x, URL
http://dx.doi.org/10.1007/s00267-004-0167-x.
Greco, S. E., and C. A. Alford, 2003a. Historical Channel Mapping from Maps of the
Sacramento River, Colusa to Red Bluff, California: 1870 to 1920. Landscape
Analysis and Systems Research Laboratory, Department of Environmental Design,
University of California, Davis, California.
Greco, S. E., and C. A. Alford, 2003b. Historical Channel Mapping from Maps of the
Sacramento River, Colusa to Red Bluff, California: 1937 to 1997. Landscape
REPORT FOR BOR Bend Geometry Page 26 of 28
Eric Larsen
26
Analysis and Systems Research Laboratory, Department of Environmental Design,
University of California, Davis, California.
Greco, S. E., and R. E. Plant, 2003. Temporal Mapping of Riparian Landscape Change on
the Sacramento River, Miles 196-218, California, USA. Landscape Research
28:405-426.
Greco, S. E., J. L. Tuil, and A. Wheaton, 2003. A Historical Aerial Photography Collection
of the Sacramento River from Colusa to Red Bluff: 1937-1998. Technical Report
Prepared for the California Department of Water Resources, Northern District, Red
Bluff, California. Landscape Analysis and Systems Research Laboratory,
Department of Environmental Design, University of California, Davis, California.
Gurnell, A. M., 1997. Channel Change on the River Dee Meanders, 1946-1992, from the
Analysis of Air Photographs. Regulated Rivers: Research & Management 13:13-26.
Gurnell, A. M., S. R. Downward, and R. Jones, 1994. Channel Planform Change on the
River Dee Meanders, 1876-1992. Regulated Rivers: Research & Management
9:187-204.
Harwood, D. S., and E. J. Helley, 1987. Late Cenozoic Tectonism of the Sacramento
Valley, California Prof. Paper 1359. U.S. Geological Survey.
Hickin, E. J., 1983. River Channel Changes: Retrospect and Prospect. Pages 61-83 In J. D.
Collinson and J. Lewin, (Editors). Modern and Ancient Fluvial Systems. Basil
Blackwell, Oxford.
Hickin, E. J., 1984. Vegetation and River Channel Dynamics. Canadian Geographer
28:111-126.
Hickin, E. J., and G. C. Nanson, 1975. The Character of Channel Migration on the Beatton
River, Northeast British Columbia, Canada. Geological Society of America Bulletin
86:487-494.
Hickin, E. J., and G. C. Nanson, 1984. Lateral Migration Rates of River Bends. Journal of
Hydraulic Engineering 110:11:1557-1567.
Hooke, J. M., 1984. Changes in River Meanders: A Review of Techniques and Results of
Analysis. Progress in Physical Geography 8:473-508.
Hooke, J. M., 1995. Processes of Channel Planform Change on Meandering Channels in
the Uk. Pages 87-115 In A. Gurnell and G. Petts, (Editors). Changing River
Channels. John Wiley & Sons Ltd.
Hooke, J. M., and A. M. Harvey, 1983. Meander Changes in Relation to Bend Morphology
and Secondary Flows. Int.Ass.Sediment 6:121-132.
Howard, A. D., and A. T. Hemberger, 1991. Multivariate Characterization of Meandering.
Geomorphology 4:161-186.
Hydrologic Engineering Center - River Analysis System 2003. Hec-Ras Software 3.2.1. In.
U.S. Army Corps of Engineers, Davis, CA.
Ikeda, S., G. Parker, and K. Sawai, 1981. Bend Theory of River Meanders. Part 1. Linear
Development. Journal of Fluid Mechanics 112:363-377.
Johannesson, H., and G. Parker, 1989. Linear Theory of River Meanders. In S. Ikeda and
G. Parker, (Editors). River Meandering. American Geophysical Union, Washington,
D.C.
Knighton, D., 1998. Fluvial Forms & Processes a New Perspective. John Wiley & Sons,
New York.
REPORT FOR BOR Bend Geometry Page 27 of 28
Eric Larsen
27
Lagasse, P. F., L. W. Zevenbergen, W. J. Spitz, and C. R. Thorne, 2004. Methodology for
Predicting Channel Migration. Ayres Associates, Inc., Fort Collins, Colorado.
Langendoen, E., A. Simon, and R. A. Thomas. 2001. Concepts – a Process-Based
Modeling Tool to Evaluate Stream -Corridor Restoration Designs. In D. F. Hayes,
editor. 2001 Wetlands Engineering and River Restoration Conference. American
Society of Civil Engineers, Reston, VA.
Larsen, E. W., 1995. The Mechanics and Modeling of River Meander Migration. PhD
Dissertation. University of California at Berkeley, Berkeley, California.
Larsen, E. W., E. Anderson, E. Avery, and K. Dole, 2002. The Controls on and Evolution
of Channel Morphology of the Sacramento River: A Case Study of River Miles
201-185. Report to the Nature Conservancy. November 1, 2002.
Larsen, E. W., A. K. Fremier, and E. H. Girvetz, 2006a. Modeling the Effects of Flow
Regulation Scenarios on River Channel Migration on the Sacramento River, Ca
USA. Journal of American Water Resources Association 42:1063-1075.
Larsen, E. W., A. K. Fremier, and S. E. Greco, 2006b. Cumulative Effective Stream Power
and Bank Erosion on the Sacramento River, Ca USA. Journal of American Water
Resources Association 42:1077-1097.
Larsen, E. W., E. Girvetz, and A. Fremier, 2004. Assessing the Effects of Alternative
Setback Levee Scenarios Employing a River Meander Migration Model. CALFED
Bay Delta Authority.
Larsen, E. W., E. Girvetz, and A. Fremier, 2006c. Assessing the Effects of Alternative
Setback Levee Scenarios Employing a River Meander Migration Model.
Environmental Management DOI 10.1007/s00267-004-0220-9 URL
http://dx.doi.org/10.1007/s00267-004-0220-9.
Larsen, E. W., and S. E. Greco, 2002. Modeling Channel Management Impacts on River
Migration: A Case Study of Woodson Bridge State Recreation Area, Sacramento
River, California, USA. Environmental Management 30:209-224.
Lewin, J., 1977. Channel Pattern Changes. Pages 167-184 In K. J. Gregory, editor. River
Channel Changes. Wiley, Chichester.
MacDonald, T. E., G. Parker, and D. P. Leuthe, 1991. Inventory and Analysis of Stream
Meander Problems in Minnesota. St. Anthony Falls Hydraulic Laboratory,
University of Minnesota, Minneapolis.
Micheli, E., and E. W. Larsen. In prep. River Channel Cutoff Dynamics, Sacramento River,
California, USA. In Manuscript.
Micheli, E. a. K., J, 2002. Effects of Wet Meadow Riparian Vegetation on Streambank
Erosion: 1. Remote Sensing Measurements of Streambank Migration and
Erodibility. Earth Surface Processes and Landforms 27:627-639.
Micheli, E. R., 2000. Quantifying the Effects of Riparian Vegetation on River Meander
Migration. PhD thesis. University of California, at Berkeley.
Micheli, E. R., J. W. Kirchner, and E. W. Larsen, 2004. Quantifying the Effect of Riparian
Forest Versus Agricultural Vegetation on River Meander Migration Rate, Central
Sacramento River, California, USA. River Research and Applications 20:537-548.
Nelson, J. M., and J. D. Smith, 1989. Evolution and Stability of Erodible Channel Beds.
American Geophysical Union na:321-na.
Robertson, K. G., 1987. Paleochannels and Recent Evolution of the Sacramento River,
California. University of California, Davis.

REPORT FOR BOR Bend Geometry Page 28 of 28
Eric Larsen
28
Singer, M. B. 2006. Personal Communication.
Water Engineering and Technology, I., 1988. Geomorphic Analysis of the Sacramento
River: Draft Report. DACWO5-87-C-0084, U.S. Army Corps of Engineers.
Wolman, M. G., and L. B. Leopold, 1957. River Flood Plains: Some Observations on Their
Formation. USGS PP 282-C:87-107.