
Predicting Material Accounting Misstatements* - University of
66
Predicting Material Accounting Misstatements* PATRICIA M. DECHOW, University of California, Berkeley WEILI GE, University of Washington CHAD R. LARSON, Washington University in St. Louis RICHARD G. SLOAN, University of California, Berkeley 1. Introduction What causes managers to misstate their financial statements? How best can investors, auditors, financial analysts, and regulators detect misstatements? Addressing these questions is of critical importance to the efficient function- ing of capital markets. For an investor it can lead to improved returns, for an auditor it can mean avoiding costly litigation, for an analyst it can mean avoiding a damaged reputation, and for a regulator it can lead to enhanced investor protection and fewer investment debacles. Our research has two objectives. First, we develop a comprehensive database of financial misstate- ments. Our objective is to describe this database and make it broadly available to other researchers to promote research on earnings misstate- ments. 1 Second, we analyze the financial characteristics of misstating firms and develop a model to predict misstatements. The output of this analysis is * Accepted by Michael Welker. We appreciate the comments of the workshop participants at the University of Michigan, the UBCOW Conference at the University of Washington, New York University 2007 Summer Camp, University of California, Irvine and University of Colorado at Boulder, Columbia University, University of Oregon, the Penn State 2008 Conference, University of California, Davis 2008 Conference, American Accounting Association meetings 2007, FARS 2008 meetings, the University of NSW Ball and Brown Conference in Sydney 2008, and the 2009 George Mason University Conference on Corpo- rate Governance and Fraud Prevention. We thank Michael Welker (associate editor) and two anonymous referees for their helpful comments. We thank Ray Ball, Sid Balachandran, Sandra Chamberlain, Ilia Dichev, Bjorn Jorgensen, Bill Kinney, Carol Marquardt, Mort Pincus, and Charles Shi for their comments and Seungmin Chee for research assistance. We would like to thank the Research Advisory Board established by Deloitte & Touche USA LLP, Ernst & Young LLP, KPMG LLP and PricewaterhouseCoopers LLP for the funding for this project. However, the views expressed in this article and its content are ours alone and not those of Deloitte & Touche USA LLP, Ernst & Young LLP, KPMG LLP, or PricewaterhouseCoopers LLP. Special thanks go to Roslyn Hooten for administering the funding relationship. This paper is dedicated to the memory of our colleague, friend, and research team member, Nader Hafzalla, who was a joy to all who knew him. 1. For more information on the data, please e-mail [email protected]. Contemporary Accounting Research Vol. 28 No. 1 (Spring 2011) pp. 17–82 Ó CAAA doi:10.1111/j.1911-3846.2010.01041.x
Transcript of Predicting Material Accounting Misstatements* - University of
Predicting Material Accounting Misstatements*
PATRICIA M. DECHOW, University of California, Berkeley
WEILI GE, University of Washington
CHAD R. LARSON, Washington University in St. Louis
RICHARD G. SLOAN, University of California, Berkeley
1. Introduction
What causes managers to misstate their financial statements? How best can
investors, auditors, financial analysts, and regulators detect misstatements?
Addressing these questions is of critical importance to the efficient function-
ing of capital markets. For an investor it can lead to improved returns, for
an auditor it can mean avoiding costly litigation, for an analyst it can mean
avoiding a damaged reputation, and for a regulator it can lead to enhanced
investor protection and fewer investment debacles. Our research has two
objectives. First, we develop a comprehensive database of financial misstate-
ments. Our objective is to describe this database and make it broadly
available to other researchers to promote research on earnings misstate-
ments.1 Second, we analyze the financial characteristics of misstating firms
and develop a model to predict misstatements. The output of this analysis is
* Accepted by Michael Welker. We appreciate the comments of the workshop participants at
the University of Michigan, the UBCOW Conference at the University of Washington,
New York University 2007 Summer Camp, University of California, Irvine and University
of Colorado at Boulder, Columbia University, University of Oregon, the Penn State 2008
Conference, University of California, Davis 2008 Conference, American Accounting
Association meetings 2007, FARS 2008 meetings, the University of NSW Ball and Brown
Conference in Sydney 2008, and the 2009 George Mason University Conference on Corpo-
rate Governance and Fraud Prevention. We thank Michael Welker (associate editor) and
two anonymous referees for their helpful comments. We thank Ray Ball, Sid Balachandran,
Sandra Chamberlain, Ilia Dichev, Bjorn Jorgensen, Bill Kinney, Carol Marquardt, Mort
Pincus, and Charles Shi for their comments and Seungmin Chee for research assistance. We
would like to thank the Research Advisory Board established by Deloitte & Touche USA
LLP, Ernst & Young LLP, KPMG LLP and PricewaterhouseCoopers LLP for the funding
for this project. However, the views expressed in this article and its content are ours alone
and not those of Deloitte & Touche USA LLP, Ernst & Young LLP, KPMG LLP, or
PricewaterhouseCoopers LLP. Special thanks go to Roslyn Hooten for administering the
funding relationship. This paper is dedicated to the memory of our colleague, friend, and
research team member, Nader Hafzalla, who was a joy to all who knew him.
1. For more information on the data, please e-mail [email protected].
Contemporary Accounting Research Vol. 28 No. 1 (Spring 2011) pp. 17–82 Ó CAAA
doi:10.1111/j.1911-3846.2010.01041.x
a scaled probability (F-score) that can be used as a red flag or signal of the
likelihood of earnings management or misstatement.
We compile our database through a detailed examination of firms that
have been subject to enforcement actions by the U.S. Securities and
Exchange Commission (SEC) for allegedly misstating their financial state-
ments. Since 1982, the SEC has issued Accounting and Auditing Enforcement
Releases (AAERs) during or at the conclusion of an investigation against a
company, an auditor, or an officer for alleged accounting and ⁄or auditing
misconduct. These releases provide varying degrees of detail on the nature
of the misconduct, the individuals and entities involved, and the effect on
the financial statements. We examine the 2,190 AAERs released between
1982 and 2005. Our examination identifies 676 unique firms that have
misstated at least one of their quarterly or annual financial statements.2
Using AAERs as a source to investigate characteristics of firms that
manipulate financial statements has both advantages and disadvantages.
The SEC has a limited budget, so it selects firms for enforcement action
where there is strong evidence of manipulation. Firms selected often have
already admitted a ‘‘mistake’’ by restating earnings or having large write-
offs (e.g., Enron or Xerox); other firms have already been identified by the
press or analysts as having misstated earnings (see Miller 2006); in addition,
insider whistleblowers often reveal problems directly to the SEC. Therefore,
one advantage of the AAER sample is that researchers can have a high
level of confidence that the SEC has identified manipulating firms (the Type
I error rate is low). However, one disadvantage is that many firms that
manipulate earnings are likely to go unidentified, and a second disadvantage
is that there could be selection biases in cases pursued by the SEC. For
example, the SEC may be more likely to pursue cases where stock perfor-
mance declines rapidly after the manipulation is revealed, because the iden-
tifiable losses to investors are greater. Selection biases may limit the
generalizability of our results to other settings. It is worth noting, however,
that problems with selection bias exist for other samples of manipulators
identified by an external source — for example, shareholder litigation firms,
Sarbanes-Oxley Act (SOX) internal control violation firms, or restatement
firms.3 Bias concerns also exist for discretionary accrual measures (Dechow,
Sloan, and Sweeney 1995). Thus selection bias is a general concern when
analyzing the determinants of earnings manipulation and is not unique to
AAER firms.
2. Throughout the paper we use the terms earnings management, manipulation, and mis-
statement interchangeably. Although fraud is often implied by the SEC’s allegations, we
use the term misstatement because firms and managers typically do not admit or deny
guilt with respect to the SEC allegations.
3. Shareholder lawsuit firms are biased toward firms that have had large stock price
declines; SOX internal violation firms are biased toward younger firms with less devel-
oped accounting systems; and restatement firms are biased toward firms that have made
a mistake that is not necessarily intentional.
18 Contemporary Accounting Research
CAR Vol. 28 No. 1 (Spring 2011)
In our tests we focus on variables that can be easily measured from
the financial statements because we want our analysis to be applicable in
most settings facing investors, regulators, or auditors. Our tests focus only on
AAER firm-years that have overstated earnings. We examine (i) accrual qual-
ity, (ii) financial performance, (iii) nonfinancial measures, (iv) off-balance-
sheet activities, and (v) market-based measures for identifying misstatements.
We investigate several measures of accrual quality. We examine working
capital accruals and the broader measure of accruals that incorporates long-
term net operating assets (Richardson, Sloan, Soliman, and Tuna 2005). We
provide an analysis of two specific accruals, changes in receivables and
inventory. These accounts have direct links to revenue recognition and cost
of goods sold, both of which impact gross profit, a key performance metric.
We measure the percentage of ‘‘soft’’ assets on the balance sheet (defined as
the percentage of assets that are neither cash nor property, plant, and
equipment (PP&E). We predict that the more assets on the balance sheet
that are subject to changes in assumptions and forecasts, the greater the
manager’s flexibility to manage short-term earnings (e.g., Barton and Simko
2002; Richardson et al. 2005). We find that all measures of accrual quality
are unusually high in misstating years relative to the broad population of
firms. We also find that the percentage of soft assets is high, which suggests
that manipulating firms have more ability to change and adjust assumptions
to influence short-term earnings.
In time-series tests that focus only on misstating firms, we find that the
reversal of accruals is particularly important for detecting the misstatement.
We find that, in the years prior to the manipulation, all accrual measures are
unusually high and in fact are not significantly different from those of manip-
ulation years. There are two explanations for this finding. First, managers are
likely to utilize the flexibility within generally accepted accounting principles
(GAAP) to report higher accruals and earnings before resorting to the aggres-
sive manipulation identified by the SEC. Therefore, growing accruals in ear-
lier years is consistent with ‘‘within GAAP’’ earnings management. Second,
the positive accruals in earlier years could reflect an overinvestment problem.
Managers in misstating firms could be relaxing credit policies, building up
inventory and fixed asset capacity in anticipation of future growth. When that
growth is not realized, managers then resort to the manipulation identified by
the SEC. The two explanations are not mutually exclusive, because a manager
who is optimistic and overinvesting is also likely to be optimistic in terms of
assumptions and forecasts that relate to asset values and earnings.
We examine various models of discretionary accruals developed in prior
accounting research including the cross-sectional modified Jones model
(Dechow et al. 1995; DeFond and Jiambalvo 1994), the performance-
matched discretionary accruals model (Kothari, Leone, and Wasley 2005),
and a signed version of the earnings quality metric developed by Dechow
and Dichev (2002). Our results indicate that the residuals from the modified
Jones model and the performance-matched Jones model have less power to
Predicting Material Accounting Misstatements 19
CAR Vol. 28 No. 1 (Spring 2011)
identify manipulation than unadjusted accrual measures (i.e., working capi-
tal accruals and the broader measure of accruals) or the signed Dechow
and Dichev model. This suggests that conventional approaches of control-
ling for industry and performance induce considerable estimation error into
the estimation of discretionary accruals.
We examine whether the manipulations occur to hide diminishing firm
performance. We find that returns on assets are generally declining; how-
ever, contrary to our initial expectations, we find that cash sales are increas-
ing during misstatement periods. We failed to anticipate the cash sales
result because we expected firms to boost sales by overstating credit sales.
There are two explanations for the unexpected cash sale result. First, mis-
stating firms tend to be growing their capital bases and increasing the scale
of their business operations. The greater scale of operations should lead to
increases in both cash and credit sales. Second, an inspection of the AAERs
reveals that many firms misstate sales through transaction management —
for example, encouraging sales to customers with return provisions that vio-
late the definition of a sale, selling goods to related parties, or forcing goods
onto customers at the end of the quarter.
We find that one nonfinancial measure, abnormal reductions in the num-
ber of employees, is useful in detecting misstatements. This measure is new
to the literature and is measured as year-over-year percentage change in
employee headcount less year-over-year percentage change in total assets.
This result can be interpreted in two ways. First, reductions in the number
of employees are likely to occur when there is declining demand for a firm’s
product. In addition, cutting employees directly improves short-run earnings
performance by lowering wage expenses. Second, if physical assets and
employees are complements, then a decrease in employees relative to total
assets could signal overstated asset balances.
Our examination of off-balance-sheet information focuses on the exis-
tence and use of operating leases and the expected return assumption on
plan assets for defined benefit pension plans. Operating leases can be used
to front-load earnings and reduce reported debt. We find that the use of
operating leases is unusually high during misstatement firm-years. In addi-
tion, more firms begin leasing in manipulation years (relative to earlier
years). We also find that misstating firms have higher expected returns on
their pension plan assets than other firms. The effect of higher expected
return assumptions is to reduce reported pension expense. The results for
leases and pensions are consistent with misstating firms exhausting ‘‘legal’’
earnings management options before resorting to more aggressive financial
misstatements.
Our final set of variables relates to stock and debt market incentives.
Dechow et al. (1995) suggest that market incentives are an important reason
for engaging in earnings management. Teoh, Welch, and Wong (1998) and
Rangan (1998) provide corroborating evidence that accruals are unusually
high at the time of equity issuances. However, the evidence in Beneish
20 Contemporary Accounting Research
CAR Vol. 28 No. 1 (Spring 2011)
1999b suggests that leverage and stock issuances do not motivate misstate-
ments. Therefore, revisiting this question using our more comprehensive
data is warranted. We find that the comparison group is critical for evaluat-
ing whether raising financing is a motivation for the misstatement. Inconsis-
tent with Beneish, we find that misstating firms are actively raising
financing in misstating years relative to the broad population of firms.
However, consistent with Beneish, we find no significant difference in the
extent of financing when we compare earlier years to manipulation years
for the same AAER firm. These results can be reconciled by the fact that
we find misstating firms are actively raising financing before and during the
manipulation period. Thus, one interpretation of these findings is that man-
agers of misstating firms are concerned with obtaining financing and this
motivates earnings management in earlier years, as well as the more aggres-
sive techniques identified by the SEC in misstating years. Also consistent
with Beneish, we do not find evidence that misstating firms tend to have
higher financial leverage than nonmisstating firms.
We examine the growth expectations embedded in misstating firms’
stock market valuations. We find that the price-earnings and market-to-
book ratios are unusually high for misstatement firms compared to other
firms, suggesting that investors are optimistic about the future growth
opportunities of these firms. We also find that the misstating firms have
unusually strong stock return performance in the years prior to misstate-
ment. This is consistent with managers engaging in aggressive techniques in
misstating years in the hopes of avoiding disappointing investors and losing
their high valuations (Skinner and Sloan 2002).
Our final tests aim at developing a prediction model that can synthesize
the financial statement variables that we examine and provide insights into
which variables are relatively more useful for detecting misstatements. The
model is built in stages based on the ease of obtaining the information and
compares the characteristics of misstating firm-years to other public firms.
Model 1 includes variables that are obtained from the primary financial
statements. These variables include accrual quality and firm performance.
Model 2 adds off-balance-sheet and nonfinancial measures. Model 3 adds
market-related variables. The output of these models is a scaled logistic
probability for each firm-year that we term the F-score.
We show that, while only 20 percent of the public firms have an F-score
greater than 1.4, over 50 percent of misstating firms have F-scores of 1.4 or
higher. We also investigate the time-series pattern of F-scores for misstating
firms. We show that average F-scores for misstating firms increase for up to
three years prior to the misstatement, but decline rapidly to more normal
levels in the years following the misstatement. This is consistent with the
F-score identifying within-GAAP earnings management as well as the more
aggressive techniques identified by the SEC. We discuss interpretation issues
concerning Type I and Type II errors related to the F-score and provide
marginal analysis and sensitivity analysis showing that variation in the
Predicting Material Accounting Misstatements 21
CAR Vol. 28 No. 1 (Spring 2011)
F-score is not driven by one specific variable. We also conduct several
robustness tests that confirm the stability of the variables selected for our
models, our coefficient estimates, and the predictive ability of the F-score
over time.
The remainder of the paper is organized as follows. Section 2 reviews
previous research on this topic. Section 3 describes database construction
and research design. Section 4 presents our analysis of misstatement firms
and develops our misstatement-prediction model. Section 5 concludes.
2. Previous literature
Understanding the types of firms that will misstate financial statements is
an extensive area of research. We briefly discuss some of the key findings
but do not attempt to document all literature examining characteristics of
AAER firms. Dechow, Ge, and Schrand (2010) provide a comprehensive
review of this literature.
Early work by Feroz, Park, and Pastena 1991 examines 224 AAERs
issued between April 1982 and April 1989 covering 188 firms, of which 58
have stock price information. Feroz et al. document that receivables and
inventory are commonly misstated. Two pioneering papers analyzing mis-
stating firms are Beneish 1997 and Beneish 1999a. Beneish (1997) analyzes
363 AAERs covering 49 firms and a further 15 firms whose accounting was
questioned by the news media between 1987 and 1993. The 64 firms are
classified as manipulators. He creates a separate sample of firms using the
modified Jones model to select firms with high accruals that he terms
‘‘aggressive accruers’’. His objective is to distinguish the manipulators from
the aggressive accruers. Beneish (1997) finds that accruals, day’s sales in
receivables, and prior performance are important for explaining the differ-
ences between the two groups. Beneish (1999a) matches the sample of
manipulators to 2,332 COMPUSTAT nonmanipulators by two-digit SIC
industry and year for which the financial statement data used in the model
were available. For seven of the eight financial statement ratios that he ana-
lyzes, he calculates an index, with higher index values indicating a higher
likelihood of an earnings overstatement. Beneish shows that the day’s sales
in receivables index, gross margin index, asset quality index, sales growth
index, and accruals (measured as the change in noncash working capital
plus depreciation) are important. He provides a probit model and analyzes
the probability cutoffs that minimize the expected costs of misstatements.
Our research builds on and is complementary to Beneish (1997, 1999a).
We take a different perspective from Beneish that leads us to make a num-
ber of different choices. However, such differences should not be viewed as
a critique of his approach; rather, they stem from our objectives. One of
our objectives is to develop a measure that can be directly calculated from
the financial statements. Therefore, we do not use indexes for any of our
variables. A second objective is to enable researchers and practitioners to
calculate an F-score for a random firm and to easily assess the probability
22 Contemporary Accounting Research
CAR Vol. 28 No. 1 (Spring 2011)
of misstatement. Therefore, we do not match AAER firms to a control
group by industry or size. Matching by industry and size provides informa-
tion on whether a variable is significantly different relative to a control firm.
However, it is more difficult when matching to determine Type I and Type
II error rates that users will face in an unconditional setting. Models could
be developed for individual industries and size categories. We choose not to
do this because it would add greatly to the complexity of our analysis and
the presentation of our results. A third objective is to evaluate the useful-
ness of financial statement information beyond that contained in the pri-
mary financial statements; therefore we include other information disclosed
in the 10-K either in item 1 (discussion of the business), item 5 (stock price
information), or the footnotes.
Concurrent research provides additional insights into variables that
are useful for detecting misstatements. Ettredge, Sun, Lee, and Anandara-
jan (2006) examine 169 AAER firms matched by firm size, industry, and
whether the firm reported a loss. They find that deferred taxes can be use-
ful for predicting misstatements, along with auditor change, market-to-
book, revenue growth, and whether the firm is an over-the-counter firm.
Brazel, Jones, and Zimbelman (2009) examine whether several nonfinancial
measures (e.g., number of patents, employees, and products) can be used
to predict misstatement in 50 AAER firms. They find that growth rates
between financial and nonfinancial variables are significantly different for
AAER firms. Bayley and Taylor (2007) study 129 AAER firms and a
matched sample based on industry, firm size, and time period. They find
that total accruals are better than various measures of unexpected accruals
in identifying material accounting misstatements. In addition, they find
that various financial statement ratio indices are incrementally useful. They
conclude that future earnings management research should move away
from further refinements of discretionary accrual models and instead con-
sider supplementing accruals with other financial statement ratios. We
agree with Bayley and Taylor and view our work as moving in the direc-
tion that they recommend.
There has also been work using AAER firms to examine the role of cor-
porate governance and incentive compensation in encouraging earnings
manipulation (see, e.g., Dechow, Sloan, and Sweeney 1996; Beasley 1996;
Farber 2005; Skousen and Wright 2006; for a summary, Dechow et al.
2010). We chose not to investigate the role of governance variables and
compensation because these variables are available for only limited samples
or must be hand collected. Therefore, adding these variables would have
limited our analysis to a smaller sample with various biases in terms of data
availability. However, a useful avenue for future research is to analyze the
role of governance, compensation, insider trading, short selling, incentives
to meet and beat analyst forecasts, and so on and to determine the relative
importance of these variables over financial statement information in detect-
ing overstatements of earnings.
Predicting Material Accounting Misstatements 23
CAR Vol. 28 No. 1 (Spring 2011)
3. Data and sample formation
Sample
The objective of our data collection efforts is to construct a comprehensive
sample of material and economically significant accounting misstatements
involving both GAAP violations and the allegation that the misstatement
was made with the intent of misleading investors. Thus we focus our data
collection on the SEC’s series of published AAERs.4
The SEC takes enforcement actions against firms, managers, auditors,
and other parties involved in violations of SEC and federal rules. At the
completion of a significant investigation involving accounting and auditing
issues, the SEC issues an AAER. The SEC identifies firms for review
through anonymous tips and news reports. Another source is the volun-
tary restatement of the financial results by the firm itself, because restate-
ments are viewed as a red flag by the SEC. The SEC also states that it
reviews about one-third of public companies’ financial statements each
year and checks for compliance with GAAP. If SEC officials believe that
reported numbers are inconsistent with GAAP, then the SEC can initiate
informal inquiries and solicit additional information. If the SEC is satis-
fied after such informal inquiries, then it will drop the case. However,
if the SEC believes that one or more parties violated securities laws, then
the SEC can take further steps, including enforcement actions requiring
the firm to change its accounting methods, restate financial statements,
and pay damages.
There are a number of conceivable alternative sources for identifying
accounting misstatements. They are discussed briefly below, along with our
reasons for not pursuing these alternatives.
1. The Government Accountability Office (GAO) Financial Statement
Restatement Database. This database consists of approximately 2,309
restatements between January 1997 and September 2005. This database
was constructed through a Lexis-Nexis text search of press releases and
other media coverage based on variations of the word ‘‘restate’’. There is
some overlap between the AAER firms and the GAO restatement firms
because (a) the SEC often requires firms to restate their financials as part
of a settlement and (b) restatements often trigger SEC investigations.
The GAO database covers a relatively small time period but consists of
a relatively large number of restatements. The reason for the large
4. The AAER series began on May 17, 1982, with the SEC’s issuance of AAER No. 1.
The SEC states in the first AAER that the series would include ‘‘future . . . enforcement
actions involving accountants’’ and ‘‘enable interested persons to easily distinguish
enforcement releases involving accountants from other Commission releases’’ (AAER
No 1). Although the AAERs often directly involve accountants, the AAER series also
includes enforcement actions against nonaccountant employees that result from account-
ing misstatements and manipulations.
24 Contemporary Accounting Research
CAR Vol. 28 No. 1 (Spring 2011)
number of restatements is that the GAO database includes all
restatements relating to accounting irregularities regardless of managerial
intent, materiality, and economic significance. Consequently, it includes a
large number of economically insignificant restatements. In addition,
the results in Plumlee and Yohn 2010 suggest that many restatements
are a consequence of misinterpreting accounting rules rather than
intentional misstatements. Another shortcoming of the GAO database is
that it specifies only the year in which the restatement was identified in
the press and not the reporting periods that were required to be
restated.5
2. Stanford Law Database on Shareholder Lawsuits. Shareholder lawsuits
typically result from material intentional misstatements. However, share-
holder lawsuits can also arise for a number of other reasons that are
unrelated to financial misstatements. Shareholder lawsuits alleging mis-
statements are also very common after a stock has experienced a precipi-
tous price decline, even when there is no clear evidence supporting the
allegation. In contrast, the SEC issues an enforcement action only when
it has established intent or gross negligence on the part of management
in making the misstatement.
Using the SEC’s AAERs as a sample of misstatement firms has
several advantages relative to other potential samples. First, the use of
AAERs as a proxy for manipulation is a straightforward and consistent
methodology. This methodology avoids potential biases induced in samples
based on researchers’ individual classification schemes and can be easily
replicated by other researchers. Second, AAERs are also likely to capture a
group of economically significant manipulations as the SEC has limited
resources and likely pursues the most important cases. Relative to other
methods of identifying a sample of firms with managed earnings, such as
the modified Jones abnormal accruals model, using misstatements identified
in AAERs as an indicator is expected to generate a much lower Type I
error.
Despite the advantages of using AAERs to identify accounting misstate-
ments, there are caveats. We can investigate only those firms identified by
the SEC as having misstated earnings. The inclusion of the misstatements
that are not identified by the SEC in our control sample is likely to reduce
the predictive ability of our model. Therefore, our analyses can be inter-
preted as joint tests of engaging in an accounting misstatement and receiv-
ing an enforcement action from the SEC. If it is assumed that the SEC
selection criteria are highly correlated with our prediction variables, then
another criticism is that identified variables could reflect SEC selection.
However, as noted above, the SEC identifies firms from a variety of sources
5. For example, while Xerox is included in the GAO database in 2002, the restatements in
question relate to Xerox’s financial statements for 1997, 1998, 1999, 2000, and 2001.
Predicting Material Accounting Misstatements 25
CAR Vol. 28 No. 1 (Spring 2011)
and not just from its own internal reviews, and many cases are brought to
its attention because the firm itself either restates or takes a large write-off.
Thus, selection choices are unlikely to be a complete explanation for our
findings. In addition, from a firm’s perspective, being subject to an SEC
enforcement action brings significantly negative capital market conse-
quences (Dechow et al. 1996; Karpoff, Lee, and Martin 2008). Therefore,
avoiding these characteristics could be useful and thus affect firm and
market behavior.
Data sets
We catalog all the AAERs from AAER 1 through AAER 2261 spanning
May 17th, 1982 through June 10th, 2005. We next identify all firms that are
alleged to have violated GAAP by at least one of these AAERs (we describe
this procedure in more detail in the next section). We then create three data
files: the Detail, Annual, and Quarterly files. The Detail file contains all
AAER numbers pertaining to each firm, firm identifiers, a description of
the reason the AAER was issued, and indicator variables categorizing which
balance-sheet and income-statement accounts were identified in the AAER
as being affected by the violation. There is only one observation per firm in
the Detail file. The Annual and Quarterly files are compiled from the Detail
file and are formatted by reporting period so that each quarter or year
affected by the violation is a separate observation. The Appendix lists the
variable names and description for each file in the database.
Data collection
The original AAERs are the starting point for collecting data. Copies of the
AAERs are obtained from the SEC website and the LexisNexis database.
Each AAER is separately examined to identify whether it involves an
alleged GAAP violation. In cases where a GAAP violation is involved, the
reporting periods that were alleged to be misstated are identified.
The data coding was completed in three phases. In the first phase, all
releases were read in order to obtain the company name and period(s) in
which the violation took place. The AAERs are simply listed chronologi-
cally based on the progress of SEC investigations. To facilitate our empiri-
cal analysis, we record misstatements by firm and link them back to their
underlying AAERs in the detail file. Note that multiple AAERs may
pertain to a single set of restatements at a single firm. Panel A of Table 1
indicates that we are unable to locate 30 of the 2,261 AAERs, because they
were either missing or not released by the SEC. A further 41 AAERs relate
to auditors or other parties and do not mention specific company names.
This leaves us with 2,190 AAERs mentioning a company name.
Panel B of Table 1 reports that, in the 2,190 AAERs, the SEC takes
action against 2,614 different parties. Note that one AAER can be issued
against multiple parties. In 49.2 percent (1,077) of the cases the party
was an officer of the company (e.g., chief executive officer (CEO) or chief
26 Contemporary Accounting Research
CAR Vol. 28 No. 1 (Spring 2011)
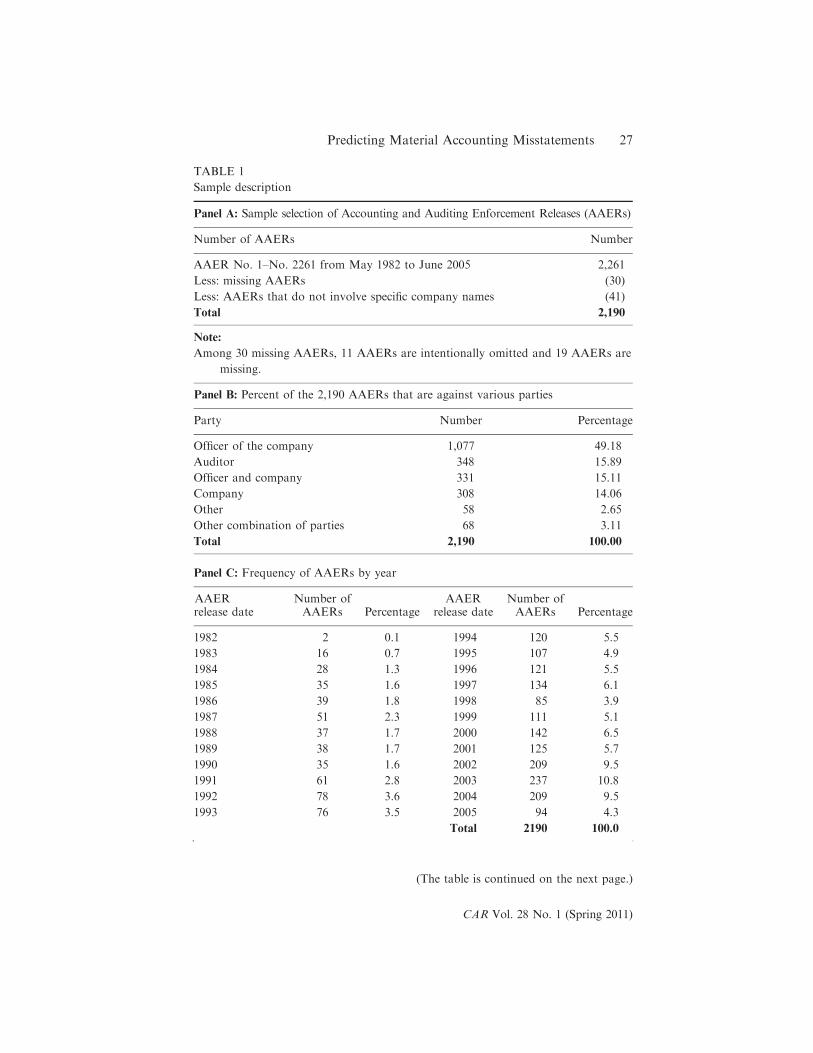
TABLE 1
Sample description
Panel A: Sample selection of Accounting and Auditing Enforcement Releases (AAERs)
Number of AAERs Number
AAER No. 1–No. 2261 from May 1982 to June 2005 2,261
Less: missing AAERs (30)
Less: AAERs that do not involve specific company names (41)
Total 2,190
Note:
Among 30 missing AAERs, 11 AAERs are intentionally omitted and 19 AAERs are
missing.
Panel B: Percent of the 2,190 AAERs that are against various parties
Party Number Percentage
Officer of the company 1,077 49.18
Auditor 348 15.89
Officer and company 331 15.11
Company 308 14.06
Other 58 2.65
Other combination of parties 68 3.11
Total 2,190 100.00
Panel C: Frequency of AAERs by year
AAERrelease date
Number ofAAERs Percentage
AAERrelease date
Number ofAAERs Percentage
1982 2 0.1 1994 120 5.5
1983 16 0.7 1995 107 4.9
1984 28 1.3 1996 121 5.5
1985 35 1.6 1997 134 6.1
1986 39 1.8 1998 85 3.9
1987 51 2.3 1999 111 5.1
1988 37 1.7 2000 142 6.5
1989 38 1.7 2001 125 5.7
1990 35 1.6 2002 209 9.5
1991 61 2.8 2003 237 10.8
1992 78 3.6 2004 209 9.5
1993 76 3.5 2005 94 4.3
Total 2190 100.0
(The table is continued on the next page.)
Predicting Material Accounting Misstatements 27
CAR Vol. 28 No. 1 (Spring 2011)
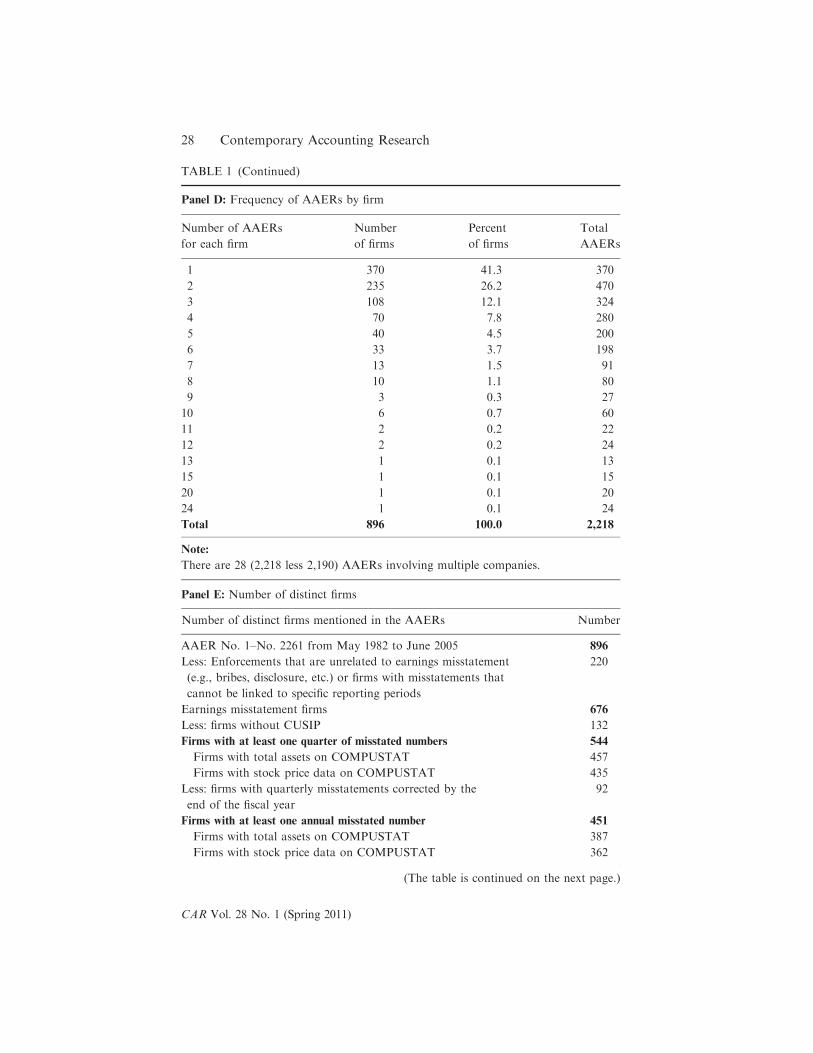
TABLE 1 (Continued)
Panel D: Frequency of AAERs by firm
Number of AAERs
for each firm
Number
of firms
Percent
of firms
Total
AAERs
1 370 41.3 370
2 235 26.2 470
3 108 12.1 324
4 70 7.8 280
5 40 4.5 200
6 33 3.7 198
7 13 1.5 91
8 10 1.1 80
9 3 0.3 27
10 6 0.7 60
11 2 0.2 22
12 2 0.2 24
13 1 0.1 13
15 1 0.1 15
20 1 0.1 20
24 1 0.1 24
Total 896 100.0 2,218
Note:
There are 28 (2,218 less 2,190) AAERs involving multiple companies.
Panel E: Number of distinct firms
Number of distinct firms mentioned in the AAERs Number
AAER No. 1–No. 2261 from May 1982 to June 2005 896
Less: Enforcements that are unrelated to earnings misstatement
(e.g., bribes, disclosure, etc.) or firms with misstatements that
cannot be linked to specific reporting periods
220
Earnings misstatement firms 676
Less: firms without CUSIP 132
Firms with at least one quarter of misstated numbers 544
Firms with total assets on COMPUSTAT 457
Firms with stock price data on COMPUSTAT 435
Less: firms with quarterly misstatements corrected by the
end of the fiscal year
92
Firms with at least one annual misstated number 451
Firms with total assets on COMPUSTAT 387
Firms with stock price data on COMPUSTAT 362
(The table is continued on the next page.)
28 Contemporary Accounting Research
CAR Vol. 28 No. 1 (Spring 2011)
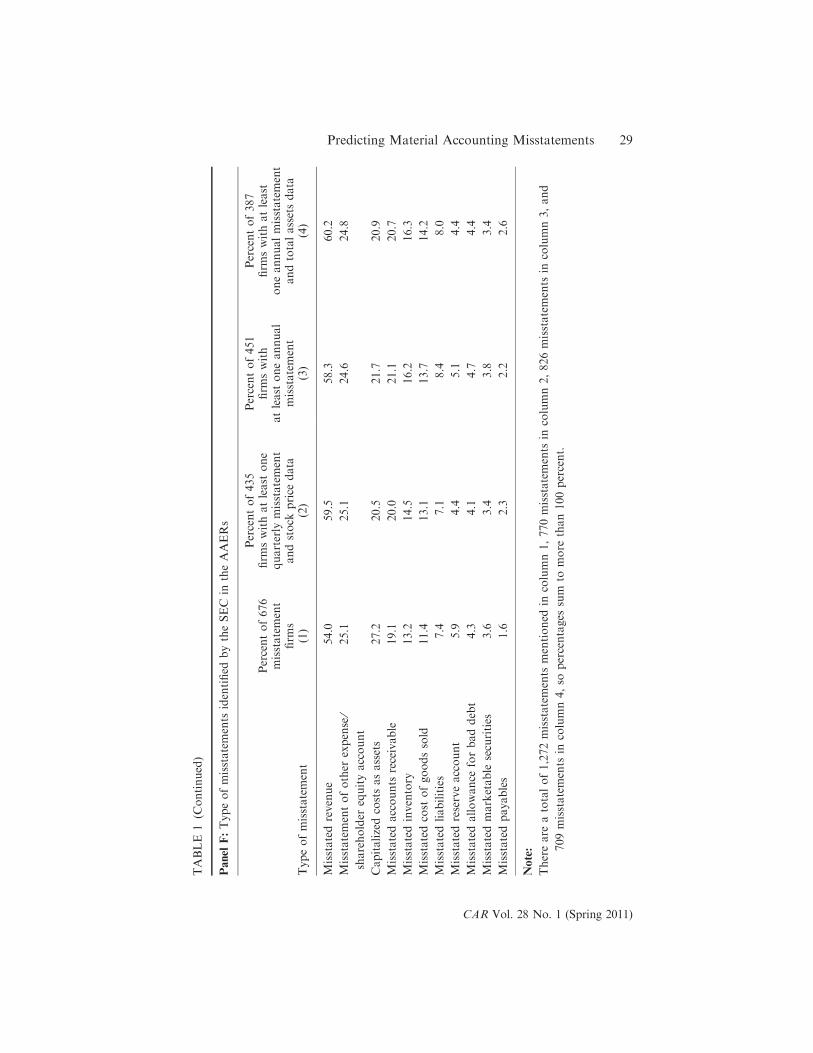
TABLE1
(Continued)
Panel
F:Typeofmisstatements
identified
bytheSEC
intheAAERs
Typeofmisstatement
Percentof676
misstatement
firm
s(1)
Percentof435
firm
swithatleast
one
quarterly
misstatement
andstock
price
data
(2)
Percentof451
firm
swith
atleast
oneannual
misstatement
(3)
Percentof387
firm
swithatleast
oneannualmisstatement
andtotalassetsdata
(4)
Misstatedrevenue
54.0
59.5
58.3
60.2
Misstatementofother
expense⁄
shareholder
equityaccount
25.1
25.1
24.6
24.8
Capitalizedcostsasassets
27.2
20.5
21.7
20.9
Misstatedaccounts
receivable
19.1
20.0
21.1
20.7
Misstatedinventory
13.2
14.5
16.2
16.3
Misstatedcost
ofgoodssold
11.4
13.1
13.7
14.2
Misstatedliabilities
7.4
7.1
8.4
8.0
Misstatedreserveaccount
5.9
4.4
5.1
4.4
Misstatedallowance
forbaddebt
4.3
4.1
4.7
4.4
Misstatedmarketable
securities
3.6
3.4
3.8
3.4
Misstatedpayables
1.6
2.3
2.2
2.6
Note:
Thereare
atotalof1,272misstatements
mentioned
incolumn1,770misstatements
incolumn2,826misstatements
incolumn3,and
709misstatements
incolumn4,so
percentages
sum
tomore
than100percent.
Predicting Material Accounting Misstatements 29
CAR Vol. 28 No. 1 (Spring 2011)
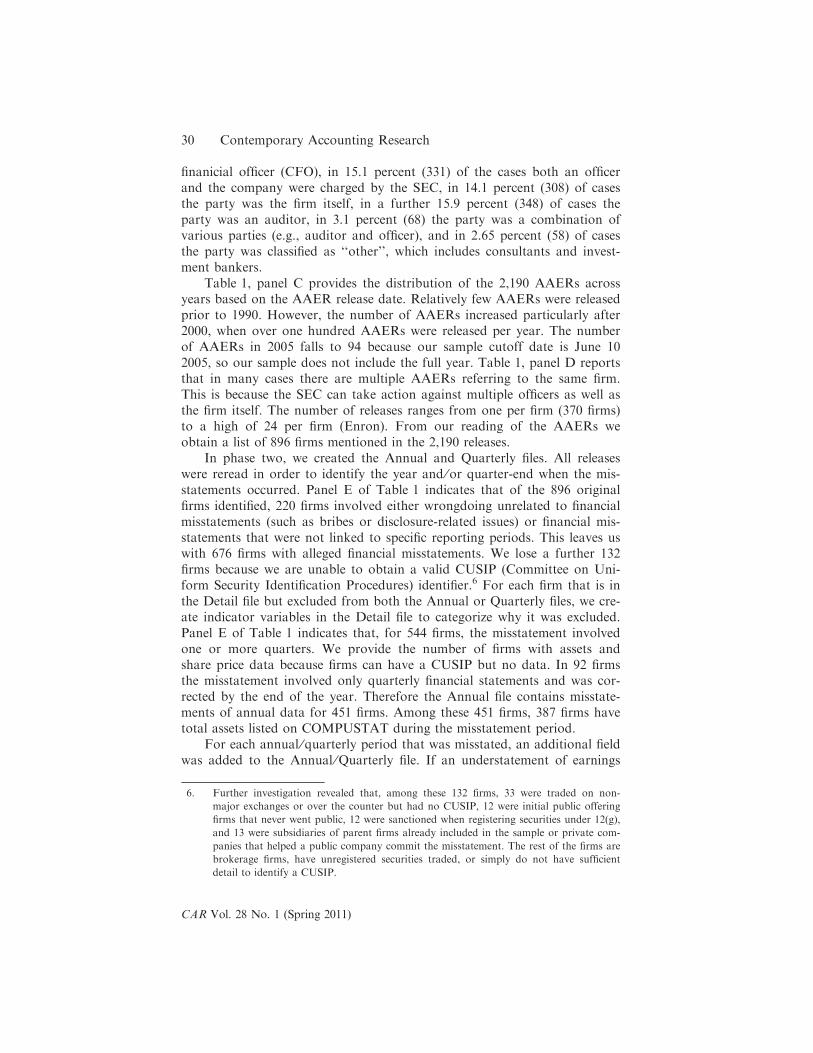
finanicial officer (CFO), in 15.1 percent (331) of the cases both an officer
and the company were charged by the SEC, in 14.1 percent (308) of cases
the party was the firm itself, in a further 15.9 percent (348) of cases the
party was an auditor, in 3.1 percent (68) the party was a combination of
various parties (e.g., auditor and officer), and in 2.65 percent (58) of cases
the party was classified as ‘‘other’’, which includes consultants and invest-
ment bankers.
Table 1, panel C provides the distribution of the 2,190 AAERs across
years based on the AAER release date. Relatively few AAERs were released
prior to 1990. However, the number of AAERs increased particularly after
2000, when over one hundred AAERs were released per year. The number
of AAERs in 2005 falls to 94 because our sample cutoff date is June 10
2005, so our sample does not include the full year. Table 1, panel D reports
that in many cases there are multiple AAERs referring to the same firm.
This is because the SEC can take action against multiple officers as well as
the firm itself. The number of releases ranges from one per firm (370 firms)
to a high of 24 per firm (Enron). From our reading of the AAERs we
obtain a list of 896 firms mentioned in the 2,190 releases.
In phase two, we created the Annual and Quarterly files. All releases
were reread in order to identify the year and ⁄or quarter-end when the mis-
statements occurred. Panel E of Table 1 indicates that of the 896 original
firms identified, 220 firms involved either wrongdoing unrelated to financial
misstatements (such as bribes or disclosure-related issues) or financial mis-
statements that were not linked to specific reporting periods. This leaves us
with 676 firms with alleged financial misstatements. We lose a further 132
firms because we are unable to obtain a valid CUSIP (Committee on Uni-
form Security Identification Procedures) identifier.6 For each firm that is in
the Detail file but excluded from both the Annual or Quarterly files, we cre-
ate indicator variables in the Detail file to categorize why it was excluded.
Panel E of Table 1 indicates that, for 544 firms, the misstatement involved
one or more quarters. We provide the number of firms with assets and
share price data because firms can have a CUSIP but no data. In 92 firms
the misstatement involved only quarterly financial statements and was cor-
rected by the end of the year. Therefore the Annual file contains misstate-
ments of annual data for 451 firms. Among these 451 firms, 387 firms have
total assets listed on COMPUSTAT during the misstatement period.
For each annual ⁄quarterly period that was misstated, an additional field
was added to the Annual ⁄Quarterly file. If an understatement of earnings
6. Further investigation revealed that, among these 132 firms, 33 were traded on non-
major exchanges or over the counter but had no CUSIP, 12 were initial public offering
firms that never went public, 12 were sanctioned when registering securities under 12(g),
and 13 were subsidiaries of parent firms already included in the sample or private com-
panies that helped a public company commit the misstatement. The rest of the firms are
brokerage firms, have unregistered securities traded, or simply do not have sufficient
detail to identify a CUSIP.
30 Contemporary Accounting Research
CAR Vol. 28 No. 1 (Spring 2011)
or revenues occurred during the quarter or year of the violation, we code
the understatement variable 1. Because most AAERs involve the overstate-
ment of earnings or revenues, this flag is helpful in conducting earnings
management and other discretionary accruals tests. In our empirical analy-
ses in Tables 4–9, we delete firm-year observations that understated earn-
ings. We also exclude banks and insurance companies because many
accruals-related variables are not available for these firms. The Annual file
contains 837 firm-year observations with CUSIPs, and the Quarterly file
contains 3,612 firm-quarter observations with CUSIPs.
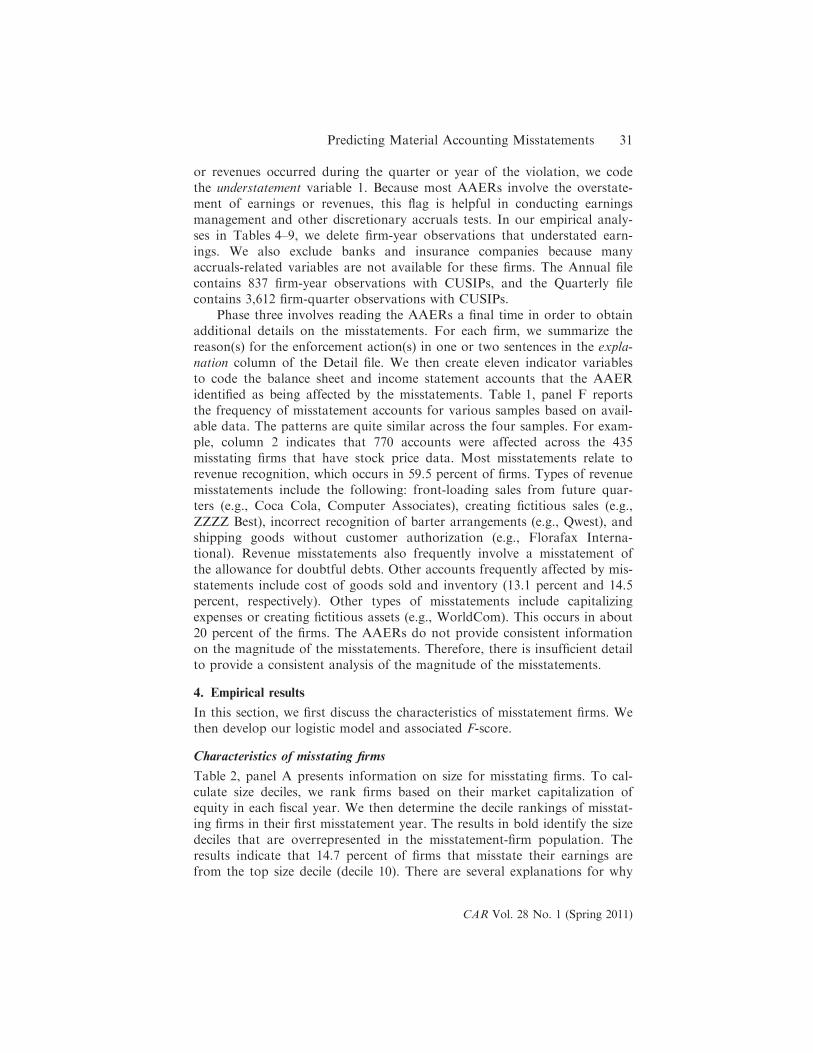
Phase three involves reading the AAERs a final time in order to obtain
additional details on the misstatements. For each firm, we summarize the
reason(s) for the enforcement action(s) in one or two sentences in the expla-
nation column of the Detail file. We then create eleven indicator variables
to code the balance sheet and income statement accounts that the AAER
identified as being affected by the misstatements. Table 1, panel F reports
the frequency of misstatement accounts for various samples based on avail-
able data. The patterns are quite similar across the four samples. For exam-
ple, column 2 indicates that 770 accounts were affected across the 435
misstating firms that have stock price data. Most misstatements relate to
revenue recognition, which occurs in 59.5 percent of firms. Types of revenue
misstatements include the following: front-loading sales from future quar-
ters (e.g., Coca Cola, Computer Associates), creating fictitious sales (e.g.,
ZZZZ Best), incorrect recognition of barter arrangements (e.g., Qwest), and
shipping goods without customer authorization (e.g., Florafax Interna-
tional). Revenue misstatements also frequently involve a misstatement of
the allowance for doubtful debts. Other accounts frequently affected by mis-
statements include cost of goods sold and inventory (13.1 percent and 14.5
percent, respectively). Other types of misstatements include capitalizing
expenses or creating fictitious assets (e.g., WorldCom). This occurs in about
20 percent of the firms. The AAERs do not provide consistent information
on the magnitude of the misstatements. Therefore, there is insufficient detail
to provide a consistent analysis of the magnitude of the misstatements.
4. Empirical results
In this section, we first discuss the characteristics of misstatement firms. We
then develop our logistic model and associated F-score.
Characteristics of misstating firms
Table 2, panel A presents information on size for misstating firms. To cal-
culate size deciles, we rank firms based on their market capitalization of
equity in each fiscal year. We then determine the decile rankings of misstat-
ing firms in their first misstatement year. The results in bold identify the size
deciles that are overrepresented in the misstatement-firm population. The
results indicate that 14.7 percent of firms that misstate their earnings are
from the top size decile (decile 10). There are several explanations for why
Predicting Material Accounting Misstatements 31
CAR Vol. 28 No. 1 (Spring 2011)
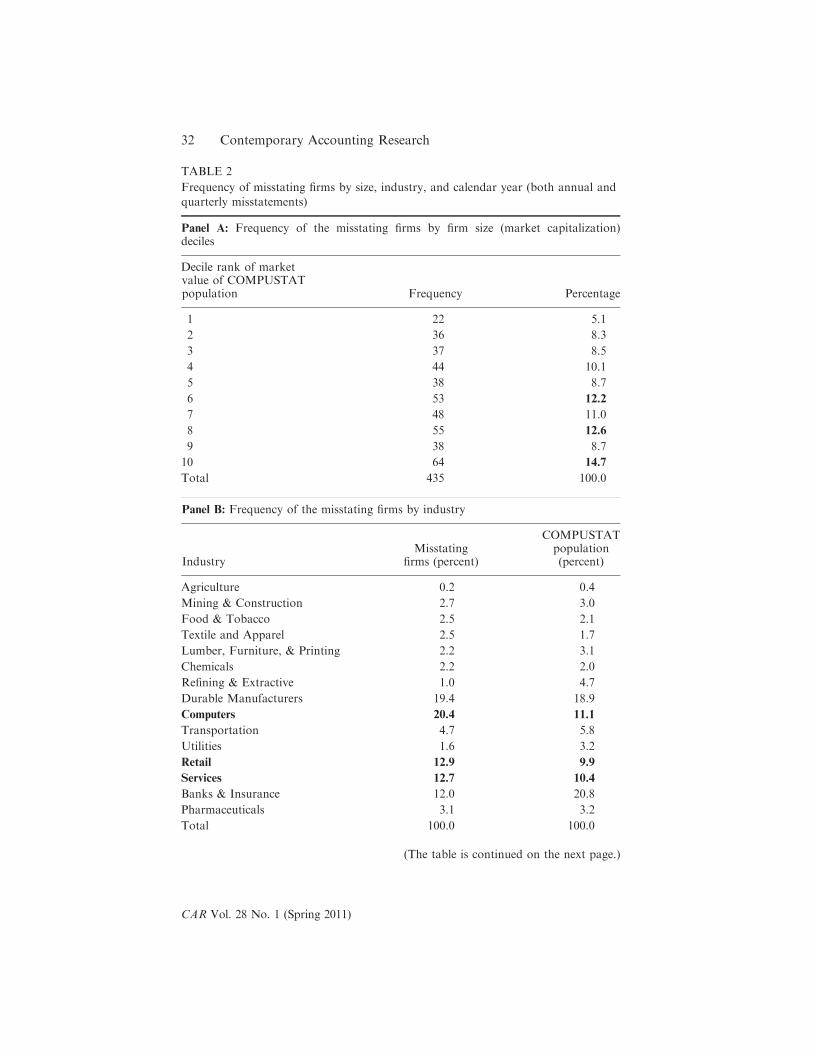
TABLE 2
Frequency of misstating firms by size, industry, and calendar year (both annual and
quarterly misstatements)
Panel A: Frequency of the misstating firms by firm size (market capitalization)deciles
Decile rank of marketvalue of COMPUSTATpopulation Frequency Percentage
1 22 5.1
2 36 8.3
3 37 8.5
4 44 10.1
5 38 8.7
6 53 12.2
7 48 11.0
8 55 12.6
9 38 8.7
10 64 14.7
Total 435 100.0
Panel B: Frequency of the misstating firms by industry
IndustryMisstating
firms (percent)
COMPUSTATpopulation(percent)
Agriculture 0.2 0.4
Mining & Construction 2.7 3.0
Food & Tobacco 2.5 2.1
Textile and Apparel 2.5 1.7
Lumber, Furniture, & Printing 2.2 3.1
Chemicals 2.2 2.0
Refining & Extractive 1.0 4.7
Durable Manufacturers 19.4 18.9
Computers 20.4 11.1
Transportation 4.7 5.8
Utilities 1.6 3.2
Retail 12.9 9.9
Services 12.7 10.4
Banks & Insurance 12.0 20.8
Pharmaceuticals 3.1 3.2
Total 100.0 100.0
(The table is continued on the next page.)
32 Contemporary Accounting Research
CAR Vol. 28 No. 1 (Spring 2011)
larger firms appear to be relatively more likely to misstate their earnings.
First, large firms have greater investor recognition and are under more scru-
tiny by the press and analysts; therefore, when an account appears suspi-
cious there is likely to be more commentary that alerts the SEC to a
potential problem (analyst and press reports are potential triggers for an
TABLE 2 (Continued)
Notes:
There are 435 misstating firms in the annual and quarterly files that have data to
calculate market value and 490 misstating firms that have SIC codes.
Industries are based on the following SIC codes: Agriculture: 0100–0999;
Mining & Construction: 1000–1299, 1400–1999; Food & Tobacco: 2000–2141;
Textiles and Apparel: 2200–2399; Lumber, Furniture, & Printing: 2400–2796;
Chemicals: 2800–2824, 2840–2899; Refining & Extractive: 1300–1399,
2900–2999; Durable Manufacturers: 3000–3569, 3580–3669, 3680–3999;
Computers: 3570–3579, 3670–3679, 7370–7379; Transportation: 4000–4899;
Utilities: 4900–4999; Retail: 5000–5999; Services: 7000–7369, 7380–9999; Banks
& Insurance: 6000–6999; Pharmaceuticals: 2830–2836, 3829–3851.
Panel C: Distribution of misstated firm-years
Year Firm-years Percentage Year Firm-years Percentage
1971 1 0.12 1987 24 2.87
1972 1 0.12 1988 27 3.23
1973 1 0.12 1989 42 5.02
1974 2 0.24 1990 33 3.94
1975 2 0.24 1991 44 5.26
1976 1 0.12 1992 47 5.62
1977 1 0.12 1993 41 4.90
1978 4 0.48 1994 35 4.18
1979 9 1.08 1995 37 4.42
1980 17 2.03 1996 40 4.78
1981 23 2.75 1997 43 5.14
1982 31 3.70 1998 53 6.33
1983 25 2.99 1999 66 7.89
1984 25 2.99 2000 60 7.17
1985 17 2.03 2001 38 4.54
1986 29 3.46 2002 15 1.79
2003 3 0.36
Total 837 100.00
Note:
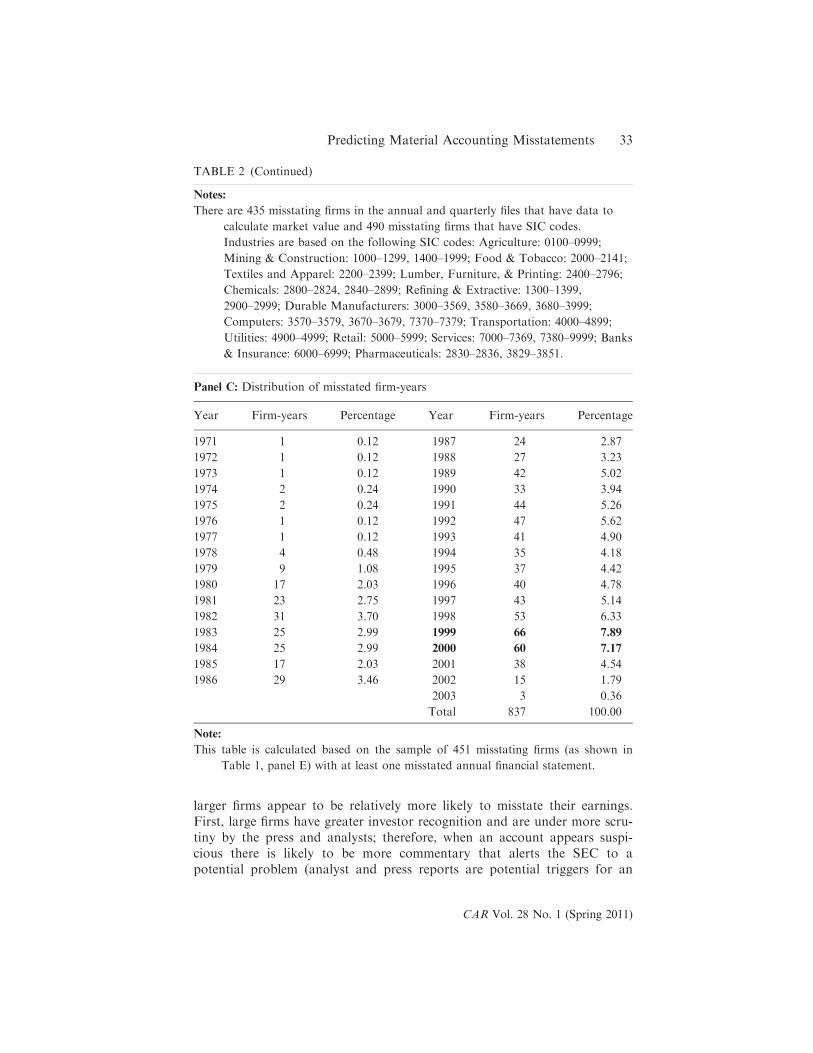
This table is calculated based on the sample of 451 misstating firms (as shown in
Table 1, panel E) with at least one misstated annual financial statement.
Predicting Material Accounting Misstatements 33
CAR Vol. 28 No. 1 (Spring 2011)
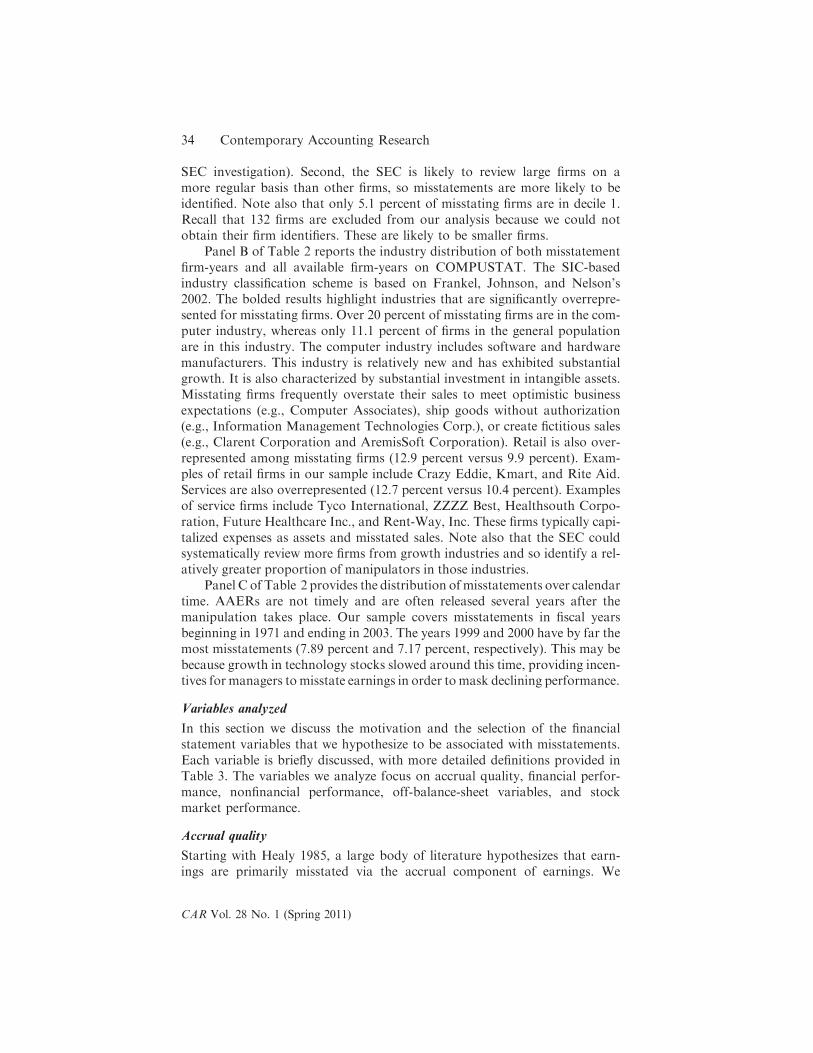
SEC investigation). Second, the SEC is likely to review large firms on a
more regular basis than other firms, so misstatements are more likely to be
identified. Note also that only 5.1 percent of misstating firms are in decile 1.
Recall that 132 firms are excluded from our analysis because we could not
obtain their firm identifiers. These are likely to be smaller firms.
Panel B of Table 2 reports the industry distribution of both misstatement
firm-years and all available firm-years on COMPUSTAT. The SIC-based
industry classification scheme is based on Frankel, Johnson, and Nelson’s
2002. The bolded results highlight industries that are significantly overrepre-
sented for misstating firms. Over 20 percent of misstating firms are in the com-
puter industry, whereas only 11.1 percent of firms in the general population
are in this industry. The computer industry includes software and hardware
manufacturers. This industry is relatively new and has exhibited substantial
growth. It is also characterized by substantial investment in intangible assets.
Misstating firms frequently overstate their sales to meet optimistic business
expectations (e.g., Computer Associates), ship goods without authorization
(e.g., Information Management Technologies Corp.), or create fictitious sales
(e.g., Clarent Corporation and AremisSoft Corporation). Retail is also over-
represented among misstating firms (12.9 percent versus 9.9 percent). Exam-
ples of retail firms in our sample include Crazy Eddie, Kmart, and Rite Aid.
Services are also overrepresented (12.7 percent versus 10.4 percent). Examples
of service firms include Tyco International, ZZZZ Best, Healthsouth Corpo-
ration, Future Healthcare Inc., and Rent-Way, Inc. These firms typically capi-
talized expenses as assets and misstated sales. Note also that the SEC could
systematically review more firms from growth industries and so identify a rel-
atively greater proportion of manipulators in those industries.
Panel C of Table 2 provides the distribution ofmisstatements over calendar
time. AAERs are not timely and are often released several years after the
manipulation takes place. Our sample covers misstatements in fiscal years
beginning in 1971 and ending in 2003. The years 1999 and 2000 have by far the
most misstatements (7.89 percent and 7.17 percent, respectively). This may be
because growth in technology stocks slowed around this time, providing incen-
tives for managers tomisstate earnings in order tomask declining performance.
Variables analyzed
In this section we discuss the motivation and the selection of the financial
statement variables that we hypothesize to be associated with misstatements.
Each variable is briefly discussed, with more detailed definitions provided in
Table 3. The variables we analyze focus on accrual quality, financial perfor-
mance, nonfinancial performance, off-balance-sheet variables, and stock
market performance.
Accrual quality
Starting with Healy 1985, a large body of literature hypothesizes that earn-
ings are primarily misstated via the accrual component of earnings. We
34 Contemporary Accounting Research
CAR Vol. 28 No. 1 (Spring 2011)
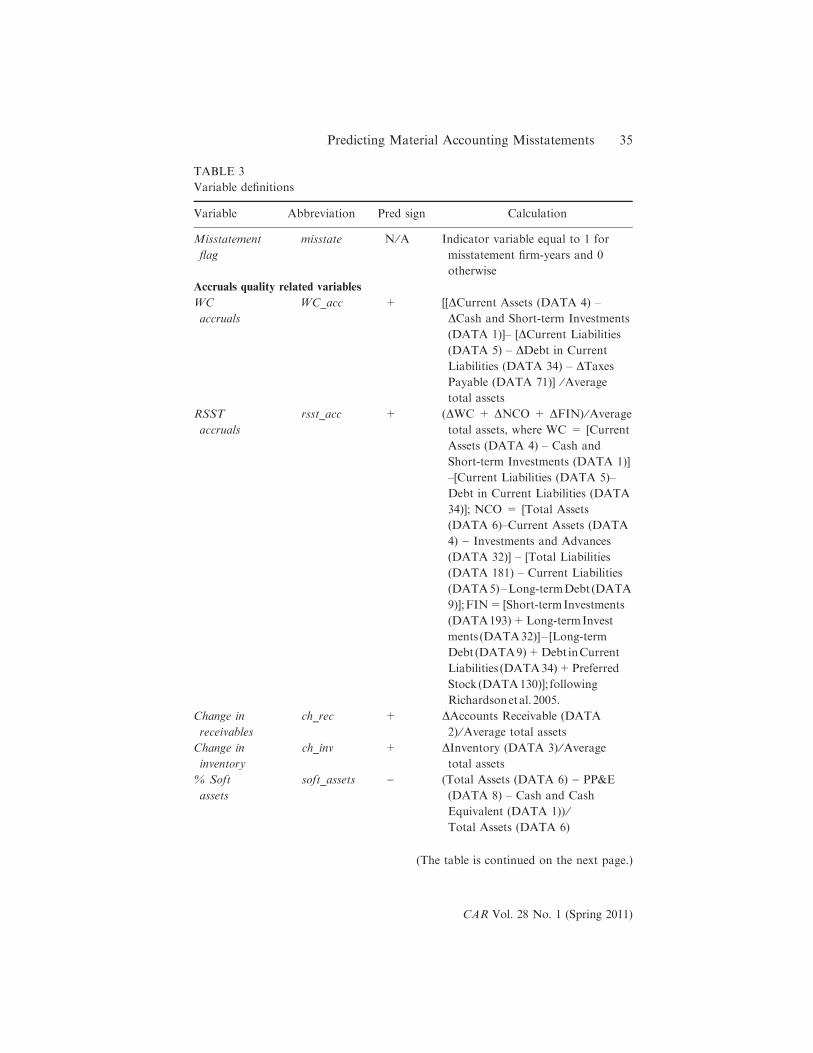
TABLE 3
Variable definitions
Variable Abbreviation Pred sign Calculation
Misstatement
flag
misstate N ⁄A Indicator variable equal to 1 for
misstatement firm-years and 0
otherwise
Accruals quality related variables
WC
accruals
WC_acc + [[DCurrent Assets (DATA 4) –
DCash and Short-term Investments
(DATA 1)]– [DCurrent Liabilities
(DATA 5) – DDebt in Current
Liabilities (DATA 34) – DTaxes
Payable (DATA 71)] ⁄Average
total assets
RSST
accruals
rsst_acc + (DWC + DNCO + DFIN) ⁄Average
total assets, where WC = [Current
Assets (DATA 4) – Cash and
Short-term Investments (DATA 1)]
–[Current Liabilities (DATA 5)–
Debt in Current Liabilities (DATA
34)]; NCO = [Total Assets
(DATA 6)–Current Assets (DATA
4) ) Investments and Advances
(DATA 32)] – [Total Liabilities
(DATA 181) – Current Liabilities
(DATA5)–Long-termDebt (DATA
9)];FIN=[Short-termInvestments
(DATA193)+Long-termInvest
ments (DATA32)]– [Long-term
Debt (DATA9)+Debt inCurrent
Liabilities (DATA34)+Preferred
Stock(DATA130)]; following
Richardsonetal.2005.
Change in
receivables
ch_rec + DAccounts Receivable (DATA
2) ⁄Average total assets
Change in
inventory
ch_inv + DInventory (DATA 3) ⁄Average
total assets
% Soft
assets
soft_assets ) (Total Assets (DATA 6) ) PP&E
(DATA 8) – Cash and Cash
Equivalent (DATA 1)) ⁄
Total Assets (DATA 6)
(The table is continued on the next page.)
Predicting Material Accounting Misstatements 35
CAR Vol. 28 No. 1 (Spring 2011)
(The table is continued on the next page.)
TABLE 3 (Continued)
Variable Abbreviation Pred sign Calculation
Modified
Jones model
discretionary
accruals
da + Themodified Jones model discretionary
accrual is estimated cross-sectionally
each year using all firm-year observations
in the same two-digit SIC code:
WCAccruals= a + b(1 ⁄Beginning
assets)+c(DSales-DRec) ⁄Beginning
assets+ qDPPE ⁄Beginning assets+ e.
The residuals are used as the modified
Jones model discretionary accruals.
Performance-
matched
discretionary
accruals
dadif + The difference between the modified
Jones discretionary accruals for firm i in
year t and the modified Jones discre
tionary accruals for the matched firm in
year t, following Kothari et al. 2005;
each firm-year observation is matched
with another firm from the same two-
digit SIC code and year with the closest
return on assets.
Mean-adjusted
absolute value
of DD
residuals
resid + The following regression is estimated
for each two-digit SIC industry: DWC
= b0+ b1*CFOt-1+ b2*CFOt +
b3*CFOt+1+ e . The mean absolute
value of the residual is calculated for
each industry and is then subtracted
from the absolute value of each firm’s
observed residual.
Studentized
DD
residuals
sresid + The scaled residuals are calculated asei
rffiffiffiffiffiffiffiffi
1ÿhiip where hii is the ii element of
the hat matrix, X(XTX))1XT and
r ¼ffiffiffiffiffiffiffiffiffiffiffiffiffiffiffiffiffiffiffiffi
1nÿm
P
m
jÿ1
�2j
s
where m is the
number of parameters in the model
and n is the number of observations.
SAS can output the scaled residuals
using the following code: proc reg
data= dataset; model Y=X;
output data=temp student=
studentresidual.
36 Contemporary Accounting Research
CAR Vol. 28 No. 1 (Spring 2011)
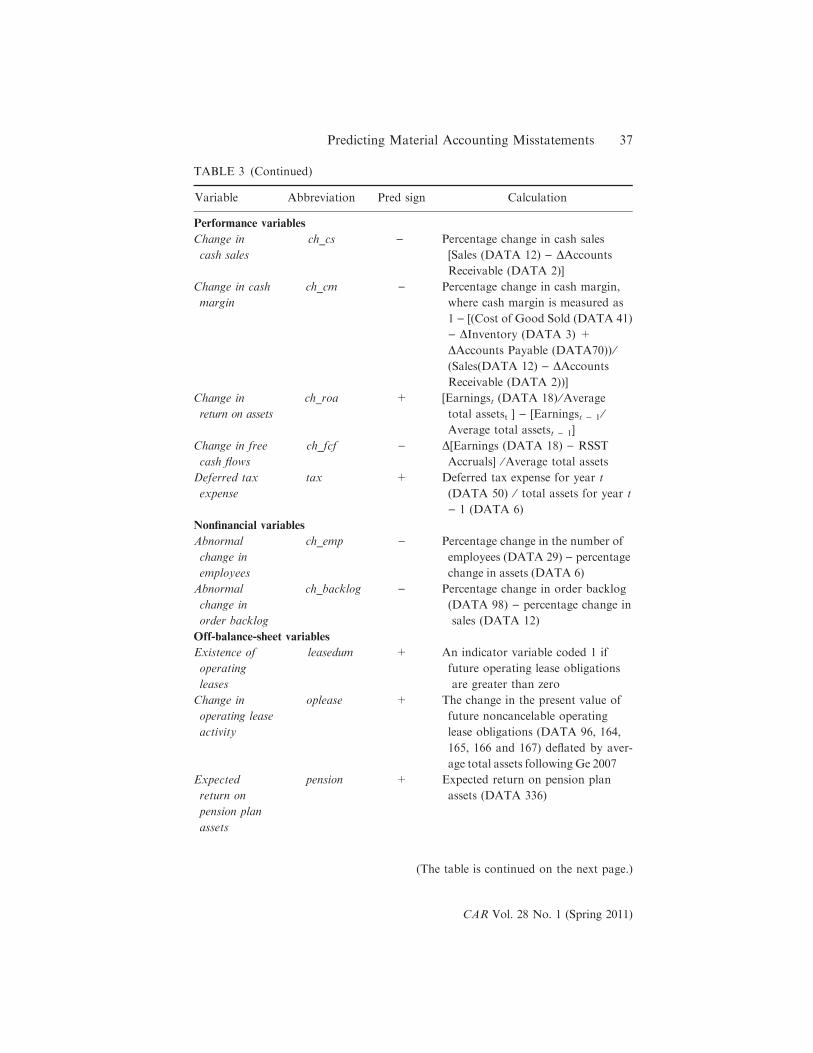
TABLE 3 (Continued)
Variable Abbreviation Pred sign Calculation
Performance variables
Change in
cash sales
ch_cs ) Percentage change in cash sales
[Sales (DATA 12) ) DAccounts
Receivable (DATA 2)]
Change in cash
margin
ch_cm ) Percentage change in cash margin,
where cash margin is measured as
1 ) [(Cost of Good Sold (DATA 41)
) DInventory (DATA 3) +
DAccounts Payable (DATA70)) ⁄
(Sales(DATA 12) ) DAccounts
Receivable (DATA 2))]
Change in
return on assets
ch_roa + [Earningst (DATA 18) ⁄Average
total assetst ] ) [Earningst ) 1 ⁄
Average total assetst ) 1]
Change in free
cash flows
ch_fcf ) D[Earnings (DATA 18) ) RSST
Accruals] ⁄Average total assets
Deferred tax
expense
tax + Deferred tax expense for year t
(DATA 50) ⁄ total assets for year t
) 1 (DATA 6)
Nonfinancial variables
Abnormal
change in
employees
ch_emp ) Percentage change in the number of
employees (DATA 29) ) percentage
change in assets (DATA 6)
Abnormal
change in
order backlog
ch_backlog ) Percentage change in order backlog
(DATA 98) ) percentage change in
sales (DATA 12)
Off-balance-sheet variables
Existence of
operating
leases
leasedum + An indicator variable coded 1 if
future operating lease obligations
are greater than zero
Change in
operating lease
activity
oplease + The change in the present value of
future noncancelable operating
lease obligations (DATA 96, 164,
165, 166 and 167) deflated by aver-
age total assets following Ge 2007
Expected
return on
pension plan
assets
pension + Expected return on pension plan
assets (DATA 336)
(The table is continued on the next page.)
Predicting Material Accounting Misstatements 37
CAR Vol. 28 No. 1 (Spring 2011)
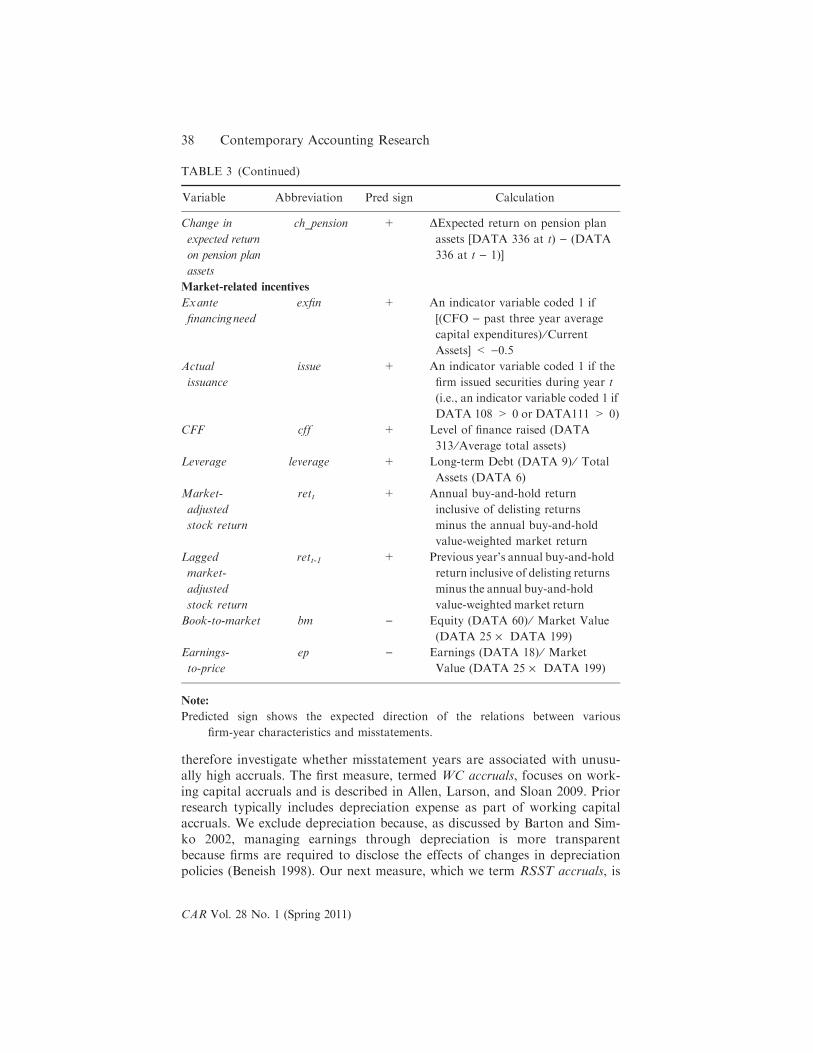
therefore investigate whether misstatement years are associated with unusu-
ally high accruals. The first measure, termed WC accruals, focuses on work-
ing capital accruals and is described in Allen, Larson, and Sloan 2009. Prior
research typically includes depreciation expense as part of working capital
accruals. We exclude depreciation because, as discussed by Barton and Sim-
ko 2002, managing earnings through depreciation is more transparent
because firms are required to disclose the effects of changes in depreciation
policies (Beneish 1998). Our next measure, which we term RSST accruals, is
TABLE 3 (Continued)
Variable Abbreviation Pred sign Calculation
Change in
expected return
on pension plan
assets
ch_pension + DExpected return on pension plan
assets [DATA 336 at t) ) (DATA
336 at t ) 1)]
Market-related incentives
Exante
financingneed
exfin + An indicator variable coded 1 if
[(CFO ) past three year average
capital expenditures) ⁄Current
Assets] < )0.5
Actual
issuance
issue + An indicator variable coded 1 if the
firm issued securities during year t
(i.e., an indicator variable coded 1 if
DATA 108 > 0 or DATA111 > 0)
CFF cff + Level of finance raised (DATA
313 ⁄Average total assets)
Leverage leverage + Long-term Debt (DATA 9) ⁄ Total
Assets (DATA 6)
Market-
adjusted
stock return
rett + Annual buy-and-hold return
inclusive of delisting returns
minus the annual buy-and-hold
value-weighted market return
Lagged
market-
adjusted
stock return
rett-1 + Previous year’s annual buy-and-hold
return inclusive of delisting returns
minus the annual buy-and-hold
value-weighted market return
Book-to-market bm ) Equity (DATA 60) ⁄ Market Value
(DATA 25 · DATA 199)
Earnings-
to-price
ep ) Earnings (DATA 18) ⁄ Market
Value (DATA 25 · DATA 199)
Note:
Predicted sign shows the expected direction of the relations between various
firm-year characteristics and misstatements.
38 Contemporary Accounting Research
CAR Vol. 28 No. 1 (Spring 2011)
from Richardson, Sloan, Soliman, and Tuna 2005. This measure extends
the definition of WC accruals to include changes in long-term operating
assets and long-term operating liabilities. This measure is equal to the
change in noncash net operating assets. We also examine two accrual com-
ponents. The first is change in receivables. Misstatement of this account
improves sales growth, a metric closely followed by investors. The second is
change in inventory. Misstatement of this account improves gross margin,
another metric closely followed by investors.
We also examine % soft assets. This is defined as the percentage of
assets on the balance sheet that are neither cash nor PP&E. Barton and
Simko (2002) provide evidence consistent with firms with greater net operat-
ing assets having more accounting flexibility to report positive earnings sur-
prises. In their Table 5 they decompose net operating assets into working
capital assets, long-term assets, and other assets. Their results suggest that
the level of working capital has a much stronger effect (the coefficient is 9
to 28 times larger) on the odds of reporting a predetermined earnings sur-
prise than on the level of PP&E. We therefore assume that, when firms have
more soft assets on their balance sheet, there is more discretion for manage-
ment to change assumptions to meet short-term earnings goals.7
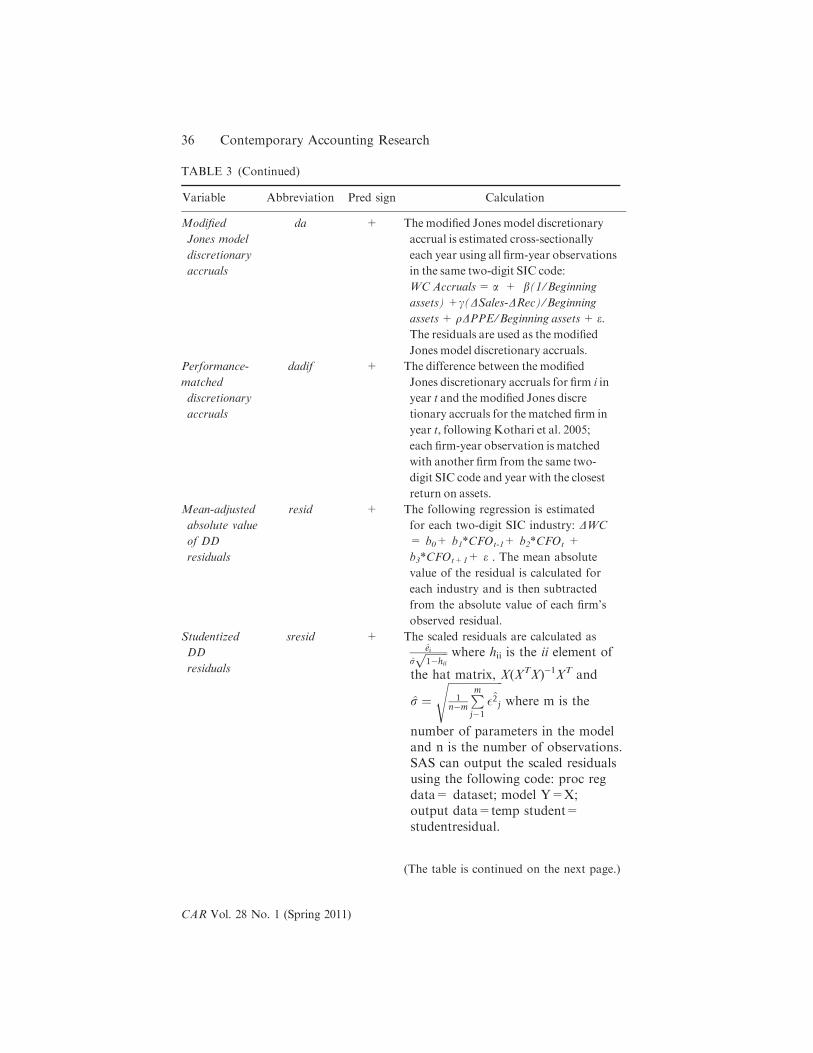
We examine several ‘‘discretionary accrual’’ models commonly used in
the accounting literature. Our comprehensive sample of misstatements pro-
vides a unique opportunity to investigate whether these models enhance the
ability to detect earnings misstatements. First, we employ the cross-sectional
version of the modified Jones model of discretionary accruals (see Dechow
et al. 1995 for the modified Jones model and DeFond and Jiambalvo 1994
for the cross-sectional version). We also investigate the effect of adjusting
discretionary accruals for financial performance as suggested in Kothari
et al. 2005. We term this performance-matched discretionary accruals.
Finally, we employ two variations of the accrual quality measure described
in Dechow and Dichev 2002. The Dechow and Dichev measure is based on
the residuals obtained from industry-level regressions of working capital
accruals on past, present, and future operating cash flows. Our first varia-
tion on this measure takes the absolute value of each residual and subtracts
the average absolute value of the residuals for each industry. We term this
the mean-adjusted absolute value of DD residuals. Our second variation
scales each residual by its standard error from the industry-level regression.
This measure leaves the sign of the residual intact and provides information
on how many standard deviations the residual is above or below the regres-
sion line. We term this variable the studentized DD residuals. We predict a
positive association between all accrual variables and misstatement years.
7. PP&E is subject to discretion in the sense that managers can overcapitalize costs and
delay write-offs. Changes in the level of PP&E that reflect such adjustments and choices
will be reflected in the RSST accrual measure.
Predicting Material Accounting Misstatements 39
CAR Vol. 28 No. 1 (Spring 2011)
Performance
Our next set of variables gauges the firm’s financial performance on various
dimensions and examines whether managers misstate their financial
statements to mask deteriorating performance (Dechow et al. 1996; Beneish
1997, 1999b). The first variable we analyze is change in cash sales. This mea-
sure excludes accruals-based sales, such as credit sales, and we use it to evalu-
ate whether sales that are not subject to accruals management are declining.
We also analyze change in cash margin. Cash margin is equal to cash sales less
cash cost of goods sold. This performance measure abstracts from receivable
and inventory misstatements. We anticipate that, when cash margins decline,
managers are more likely to make up for the decline by boosting accruals.
Change in return on assets is also analyzed because managers appear to prefer
to show positive growth in earnings (Graham, Harvey, and Rajgopal 2005).
Therefore, during misstatement periods managers could be attempting to pro-
vide positive increases in earnings. Change in free cash flows is a more funda-
mental measure than earnings because it abstracts from accruals. We predict
that managers are more likely to misstate when there is a decrease in free cash
flows. We also investigate whether deferred tax expense increases during mis-
statement periods. Larger accounting income relative to taxable income is
reflected in the deferred tax expense and could indicate more misstatement of
book income (Phillips, Pincus, and Ohloft-Rego 2003).
Nonfinancial measures
Economics teaches us that a firm trades off the marginal cost of labor
against the marginal cost of capital to maximize profits. Investments in both
labor and capital should lead to increases in future sales and profitability.
However, unlike capital expenditures, most expenditures on labor must be
expensed as incurred (the primary exception being direct labor that is capi-
talized in inventory). We therefore conjecture that managers attempting to
mask deteriorating financial performance will reduce employee headcount in
order to boost the bottom line. Moreover, if managers are overstating
assets, then the difference between the change in the number of employees
(which is not likely overstated) and the change in assets (which is over-
stated) might be a useful measure of the underlying economic reality. Brazel
et al. (2009) make a similar argument for the use of nonfinancial measures
for detecting misstatements. In their discussion of Del Global Technologies
they state, ‘‘it is improbable that the company would double in profitability
while laying off employees, and it is even less probable that employee lay-
offs would correspond with a significant increase in revenue’’. We measure
abnormal change in employees as the percentage change in the number of
employees less the percentage change in total assets. We predict a negative
association between abnormal change in employees and misstatements.
Greater order backlog is indicative of higher future sales and earnings
(Rajgopal, Shevlin, and Venkatachalam 2003). When a firm exhibits a decline
40 Contemporary Accounting Research
CAR Vol. 28 No. 1 (Spring 2011)
in order backlog, this suggests a slowing demand and lower future sales. We
measure abnormal change in order backlog as the percentage change in order
backlog less percentage change in sales. We predict a negative association
between abnormal change in order backlog and misstatements.
Off-balance-sheet activities
The most prevalent source of off-balance-sheet financing is operating leases.
The accounting for operating leases allows firms to record lower expenses
early on in the life of the lease (because the interest charge implicit in capi-
tal lease accounting is higher earlier in the life of the lease). Therefore, the
use of operating leases (existence of operating leases) and unusual increases
in operating lease activity (change in operating lease activity) could be indic-
ative of managers who are focused on financial statement window-dressing.
We predict that change in operating lease activity is positively associated
with misstatements. Change in operating lease activity is measured as the
change in the present value of future noncancelable operating lease obliga-
tions following Ge 2007.
Another off-balance-sheet activity is the accounting for pension obliga-
tions and related plan assets for defined benefit plans. Firms have consider-
able flexibility on the assumptions that determine pension expense. The
expected return on plan assets is an assumption that is relatively easy for
managers to adjust. Management can increase the expected return on plan
assets and so reduce future reported pension expense. Comprix and Mueller
(2006) provide evidence that such income-increasing adjustments are not fil-
tered out of CEO compensation. Therefore, similar to leases, such adjust-
ments could be indicative of managers who are focused on financial
statement window-dressing. For the subset of firms that have defined benefit
plans, we obtain the expected return on pension plan assets and calculate the
change in expected return on pension plan assets. We predict that, in misstate-
ment years, firms will assume larger expected returns on their plan assets.
Market-related incentives
One incentive for misstating earnings is to maintain a high stock price. We
investigate whether managers who misstate their financial statements are par-
ticularly concerned with a high stock price. We examine two motivations:
First, if the firm needs to raise cash to finance its ongoing operations
and growth plans, then a high stock price will reduce the cost of raising
new equity. We use four empirical constructs to capture a firm’s need to
raise additional capital. First, we use an indicator variable identifying
whether the firm has issued new debt or equity during the misstatement per-
iod (actual issuance). Second, we identify the net amount of new financing
raised, deflated by total assets (CFF). Third, we construct a measure of
ex ante financing need. Some firms may have wished to raise new capital but
did not because they were unable to secure favorable terms; our ex ante
measure of financing need provides a measure of the incentive to raise new
Predicting Material Accounting Misstatements 41
CAR Vol. 28 No. 1 (Spring 2011)
capital. Following Dechow et al. 1996, we report an indicator variable that
equals one if the firm is estimated to have negative free cash flows over the
next two years that exceed its current asset balance. Fourth, we expect that
managers of firms with higher leverage will have incentives to boost finan-
cial performance both to satisfy financial covenants in existing debt con-
tracts and to raise new debt on more favorable terms (leverage).
A second motivation for why managers may be particularly dependent
on a high stock price is that a significant portion of management compensa-
tion is typically tied to stock price performance. This can cause managers to
become overly concerned with maintaining or increasing their firm’s stock
price because it affects their wealth. Such managers can become focused on
managing expectations rather than managing the business. We expect that
managers whose firms have had large run-ups in their stock prices and have
high prices relative to fundamentals are more prone to expectations man-
agement. Managers of such firms are predicted to be more likely to misstate
earnings to hide diminishing performance. We identify firms with optimistic
expectations built into their stock prices using market-adjusted stock return,
earnings-to-price, and book-to-market.
Time-series analysis of misstating firms
In this subsection we analyze misstating firms and compare years that are
identified as misstated by the SEC to all nonmisstatement years. We calcu-
late means at the firm level for misstatement years versus all nonmisstate-
ment years and conduct tests of pairwise differences in means. Therefore,
each firm is directly compared to itself during manipulation years versus
other years. This approach reduces the number of observations used to cal-
culate t-statistics and could lower the power of our tests, but its advantage
is that it accurately weights the observations used to calculate means. In the
next subsection we follow the same approach and compare misstatement
years to years prior to the misstatement. This analysis provides insights into
the predictive nature of the variables analyzed, because hindsight does not
affect the calculations. One issue of concern for the power of our tests is
the proportion of firms that end up restating their financial statements and
filing an amended 10-K (versus taking a write-down and ⁄or reporting the
restated numbers for prior years in future 10-Ks). According to discussions
with Standard & Poor’s, COMPUSTAT will backfill misstated numbers
when a company files an amended 10-K. In order to determine whether fil-
ing amended 10-Ks is common among manipulation firms, we randomly
select nine companies that provide detailed information on misstated num-
bers in 2000 and 2001. We find that only one of the nine firms’ financial
data on COMPUSTAT has been backfilled with restated numbers. In addi-
tion, many of the misstatements are discovered and revealed more than a
year after they occur, and so firms are less likely to file amended financial
statements. Thus backfilling, although a concern for the power of our tests,
does not appear to be highly prevalent in the sample.
42 Contemporary Accounting Research
CAR Vol. 28 No. 1 (Spring 2011)
Comparisons using all available years
Table 4 provides results for our comparisons of misstating years versus
other nonmisstating years. In Tables 4–6, we shade cells that are significant
and have the correct sign. We predict and find that accruals are larger in
misstatement years. The results indicate that WC accruals has a slightly lar-
ger t-statistic than the RRST accruals measure. The reason is likely to be
the greater weighting of receivables in WC accruals. In Table 1 we docu-
ment that almost half of the misstating firms are alleged to have misstated
sales, and change in receivables has the highest t-statistic of all accrual vari-
ables (6.12). % soft assets is also significantly different, suggesting more
reporting flexibility in misstating years.
The next set of accrual variables relates to various models of accruals.
The objective of these models is to provide more powerful measures of
earnings management by controlling for ‘‘nondiscretionary’’ or ‘‘normal’’
accruals that are required under GAAP. However, interestingly, the t-statis-
tic on the modified Jones discretionary accruals is lower than that on either
the WC accruals or RSST accruals, and performance-matched discretionary
accruals is lower still. This suggests that estimating the modified Jones
model at an industry level appears to add greater error to estimates of dis-
cretionary accruals. Performance adjusting appears to add further error.
The next measure is a variant of the Dechow and Dichev 2002 measure of
quality. This measure uses the absolute value of residuals and is therefore
unsigned. However, our sample consists only of income-increasing earnings
manipulations, which are likely to be reversed in future years. Therefore,
the use of the absolute value reduces the power of the test because the
reversal is also likely to have a high absolute value (the t-statistic is 1.44).
Our next measure, signed studentized DD residuals, does not suffer from this
problem. The residuals are almost 10 times larger in manipulation years
than in nonmanipulation years. This measure has a t-statistic of 5.92 and is
second only to receivables in terms of statistical significance.
We next examine measures of financial performance. We predict that
misstatements are made to mask deteriorating financial performance. Our
first measure is change in cash sales. Contrary to our expectations, cash
sales significantly increase (rather than decline) during misstatement years.
A reading of the AAERs helps to explain why. We find that many firms
engage in transactions-based earnings management. That is, they front-load
their sales and engage in unusual transactions at the end of the quarter
(e.g., Coca Cola, Sunbeam, Computer Associates). Cash sales can increase
with this type of misstatement, providing an explanation for the finding.
Management of cash sales could also play a role in the low power of the
modified Jones model. If cash-sale manipulation is positively correlated with
other types of accrual manipulation, then the modified Jones model could
incorrectly classify part of this discretion as nondiscretionary. The other
performance measures, change in cash margin, return on assets, and free cash
Predicting Material Accounting Misstatements 43
CAR Vol. 28 No. 1 (Spring 2011)
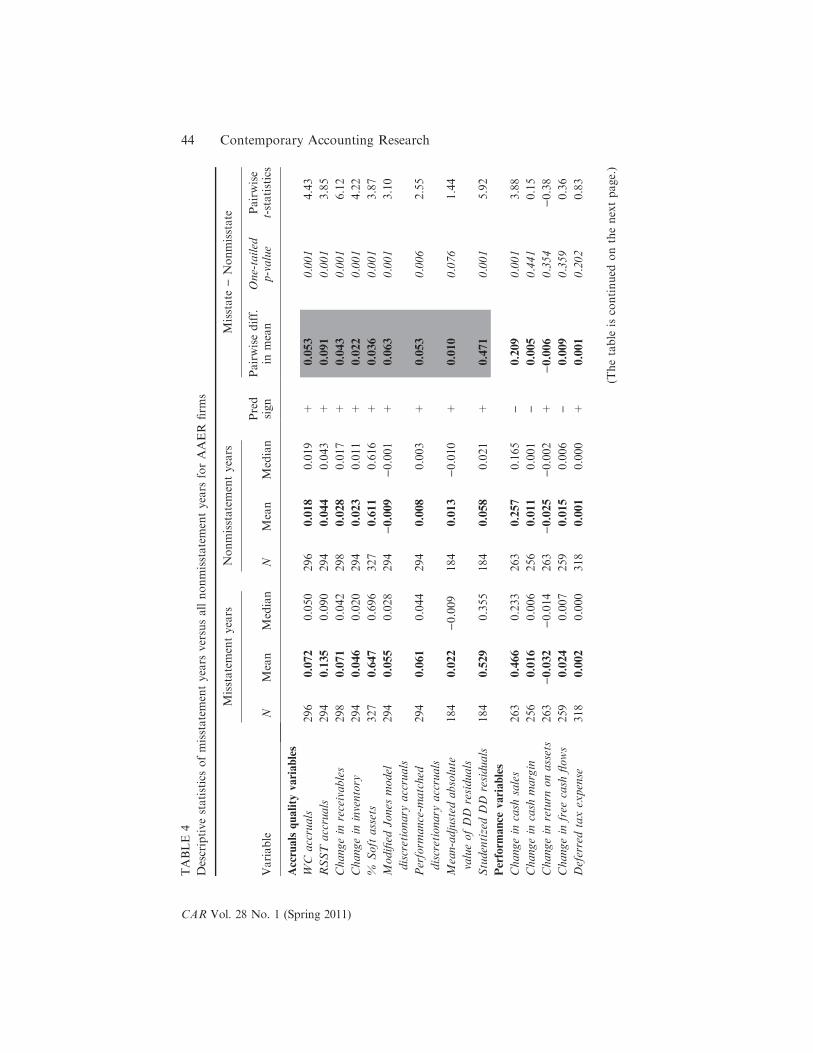
TABLE
4
Descriptivestatisticsofmisstatementyears
versusallnonmisstatementyears
forAAER
firm
s
Variable
Misstatementyears
Nonmisstatementyears
Pred
sign
Misstate)Nonmisstate
NMean
Median
NMean
Median
Pairwisediff.
inmean
One-tailed
p-value
Pairwise
t-statistics
Accrualsquality
variables
WC
accruals
296
0.072
0.050
296
0.018
0.019
+0.053
0.001
4.43
RSST
accruals
294
0.135
0.090
294
0.044
0.043
+0.091
0.001
3.85
Changein
receivables
298
0.071
0.042
298
0.028
0.017
+0.043
0.001
6.12
Changein
inventory
294
0.046
0.020
294
0.023
0.011
+0.022
0.001
4.22
%Softassets
327
0.647
0.696
327
0.611
0.616
+0.036
0.001
3.87
Modified
Jones
model
discretionary
accruals
294
0.055
0.028
294
)0.009
)0.001
+0.063
0.001
3.10
Perform
ance-m
atched
discretionary
accruals
294
0.061
0.044
294
0.008
0.003
+0.053
0.006
2.55
Mean-adjusted
absolute
valueofDD
residuals
184
0.022
)0.009
184
0.013
)0.010
+0.010
0.076
1.44
StudentizedDD
residuals
184
0.529
0.355
184
0.058
0.021
+0.471
0.001
5.92
Perform
ance
variables
Changein
cash
sales
263
0.466
0.233
263
0.257
0.165
)0.209
0.001
3.88
Changein
cash
margin
256
0.016
0.006
256
0.011
0.001
)0.005
0.441
0.15
Changein
return
onassets
263
)0.032
)0.014
263
)0.025
)0.002
+)0.006
0.354
)0.38
Changein
free
cash
flows
259
0.024
0.007
259
0.015
0.006
)0.009
0.359
0.36
Deferredtaxexpense
318
0.002
0.000
318
0.001
0.000
+0.001
0.202
0.83
(Thetable
iscontinued
onthenextpage.)
44 Contemporary Accounting Research
CAR Vol. 28 No. 1 (Spring 2011)
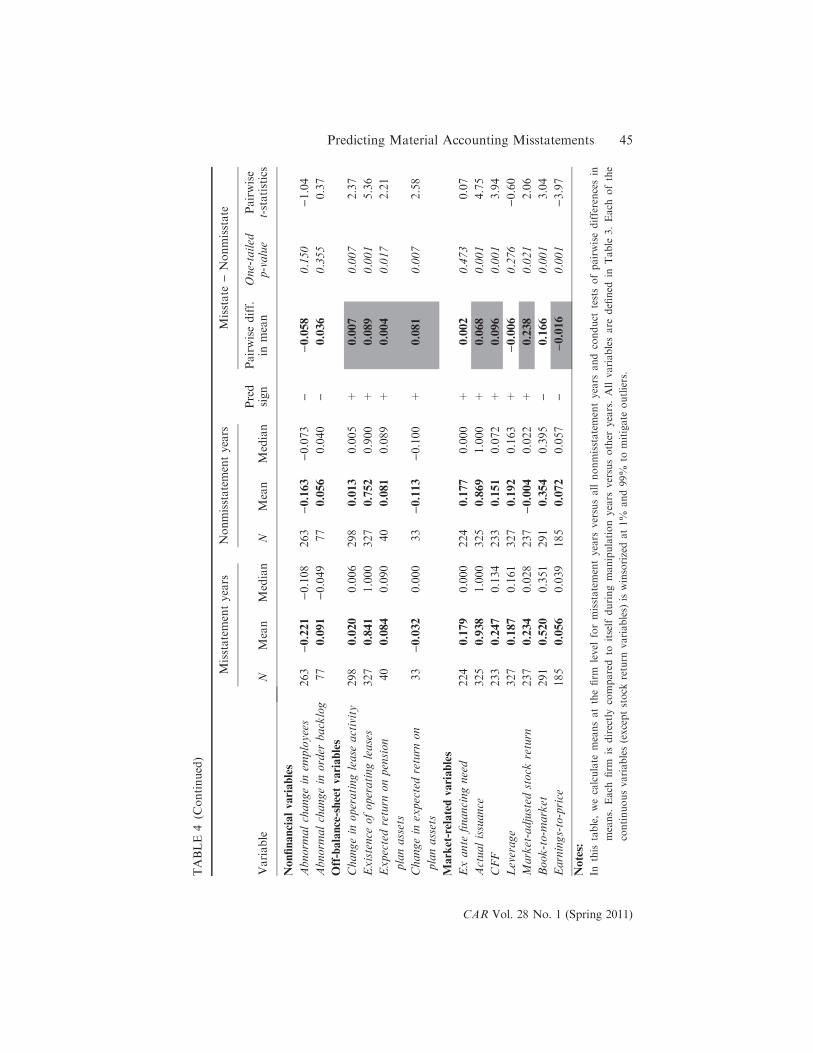
TABLE
4(C
ontinued)
Variable
Misstatementyears
Nonmisstatementyears
Pred
sign
Misstate)Nonmisstate
NMean
Median
NMean
Median
Pairwisediff.
inmean
One-tailed
p-value
Pairwise
t-statistics
Nonfinancialvariables
Abnorm
alchangein
employees
263
)0.221
)0.108
263
)0.163
)0.073
))0.058
0.150
)1.04
Abnorm
alchangein
order
backlog
77
0.091
)0.049
77
0.056
0.040
)0.036
0.355
0.37
Off-balance-sheetvariables
Changein
operatinglease
activity
298
0.020
0.006
298
0.013
0.005
+0.007
0.007
2.37
Existence
ofoperatingleases
327
0.841
1.000
327
0.752
0.900
+0.089
0.001
5.36
Expectedreturn
onpension
planassets
40
0.084
0.090
40
0.081
0.089
+0.004
0.017
2.21
Changein
expectedreturn
on
planassets
33
)0.032
0.000
33
)0.113
)0.100
+0.081
0.007
2.58
Market-relatedvariables
Exante
financingneed
224
0.179
0.000
224
0.177
0.000
+0.002
0.473
0.07
Actualissuance
325
0.938
1.000
325
0.869
1.000
+0.068
0.001
4.75
CFF
233
0.247
0.134
233
0.151
0.072
+0.096
0.001
3.94
Leverage
327
0.187
0.161
327
0.192
0.163
+)0.006
0.276
)0.60
Market-adjusted
stock
return
237
0.234
0.028
237
)0.004
0.022
+0.238
0.021
2.06
Book-to-m
arket
291
0.520
0.351
291
0.354
0.395
)0.166
0.001
3.04
Earnings-to-price
185
0.056
0.039
185
0.072
0.057
))0.016
0.001
)3.97
Notes:
Inthis
table,wecalculate
meansatthefirm
level
formisstatementyears
versusallnonmisstatementyears
andconduct
testsofpairwisedifferencesin
means.
Each
firm
isdirectlycomparedto
itself
duringmanipulationyears
versusother
years.Allvariablesare
defined
inTable
3.Each
ofthe
continuousvariables(exceptstock
return
variables)
iswinsorizedat1%
and99%
tomitigate
outliers.
Predicting Material Accounting Misstatements 45
CAR Vol. 28 No. 1 (Spring 2011)

TABLE
5
Descriptivestatisticsonmisstatementyears
versusfirm
-years
priorto
misstatementyears
forAAER
firm
s
Variable
Misstatementyears
Earlyyears
Pred
sign
Misstate
–Earlyyears
NMean
Median
NMean
Median
Pair-w
ise
diff.in
mean
One-
tailed
p-value
Pair-w
ise
t-statistics
Accrualsquality
variables
WC
accruals
263
0.069
0.047
263
0.068
0.056
+0.001
0.452
0.12
RSST
accruals
261
0.120
0.076
261
0.173
0.100
+)0.053
0.025
)1.97
Changein
receivables
265
0.069
0.040
265
0.073
0.047
+)0.004
0.328
)0.46
Changein
inventory
262
0.043
0.019
262
0.049
0.027
+)0.006
0.168
)0.96
%Soft
assets
299
0.649
0.692
299
0.595
0.605
+0.054
0.001
5.07
Perform
ance
variables
Changein
cash
sales
209
0.410
0.206
209
0.473
0.287
))0.063
0.126
)1.15
Changein
cash
margin
201
0.034
0.007
201
)0.001
0.002
)0.035
0.210
0.81
Changein
return
onassets
210
)0.026
)0.014
210
0.009
)0.001
+)0.034
0.014
)2.23
Changein
free
cash
flows
205
0.020
0.006
205
0.017
0.003
)0.003
0.445
0.14
Deferredtaxexpense
268
0.002
0.000
268
0.004
0.000
+)0.002
0.085
)1.37
Nonfinancialvariables
Abnorm
alchangein
employees
223
)0.128
)0.102
223
)0.330
)0.120
)0.202
0.001
3.32
Abnorm
alchangein
order
backlog
68
0.031
)0.063
68
)0.001
)0.013
)0.032
0.375
0.33
Off-balance-sheetvariables
Changein
operatinglease
activity
266
0.020
0.006
266
0.024
0.009
+)0.004
0.120
)1.18
Existence
ofoperatingleases
299
0.857
1.000
299
0.685
0.833
+0.172
0.001
9.41
(Thetable
iscontinued
onthenextpage.)
46 Contemporary Accounting Research
CAR Vol. 28 No. 1 (Spring 2011)
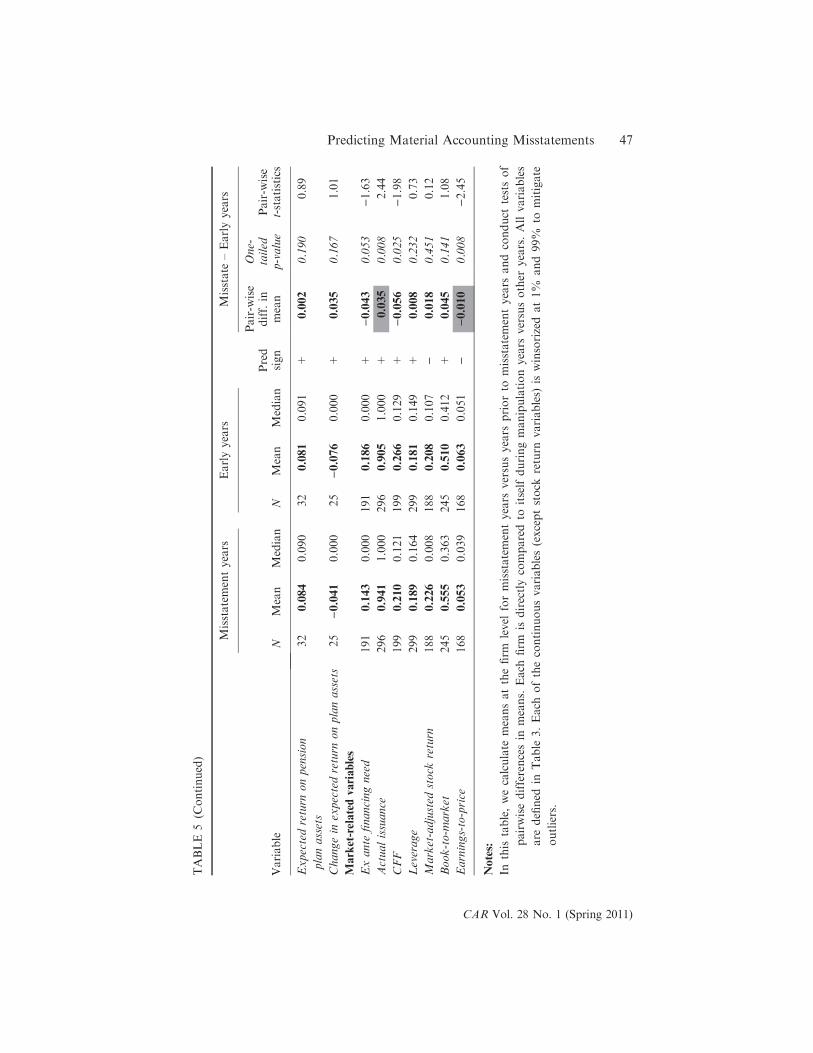
TABLE
5(C
ontinued)
Variable
Misstatementyears
Earlyyears
Pred
sign
Misstate
–Earlyyears
NMean
Median
NMean
Median
Pair-w
ise
diff.in
mean
One-
tailed
p-value
Pair-w
ise
t-statistics
Expectedreturn
onpension
planassets
32
0.084
0.090
32
0.081
0.091
+0.002
0.190
0.89
Changein
expectedreturn
onplanassets
25
)0.041
0.000
25
)0.076
0.000
+0.035
0.167
1.01
Market-relatedvariables
Exante
financingneed
191
0.143
0.000
191
0.186
0.000
+)0.043
0.053
)1.63
Actualissuance
296
0.941
1.000
296
0.905
1.000
+0.035
0.008
2.44
CFF
199
0.210
0.121
199
0.266
0.129
+)0.056
0.025
)1.98
Leverage
299
0.189
0.164
299
0.181
0.149
+0.008
0.232
0.73
Market-adjusted
stock
return
188
0.226
0.008
188
0.208
0.107
)0.018
0.451
0.12
Book-to-m
arket
245
0.555
0.363
245
0.510
0.412
+0.045
0.141
1.08
Earnings-to-price
168
0.053
0.039
168
0.063
0.051
))0.010
0.008
)2.45
Notes:
Inthis
table,wecalculate
meansatthefirm
level
formisstatementyears
versusyears
priorto
misstatementyears
andconduct
testsof
pairwisedifferencesin
means.
Each
firm
isdirectlycomparedto
itselfduringmanipulationyears
versusother
years.Allvariables
are
defined
inTable
3.Each
ofthecontinuousvariables(exceptstock
return
variables)
iswinsorizedat1%
and99%
tomitigate
outliers.
Predicting Material Accounting Misstatements 47
CAR Vol. 28 No. 1 (Spring 2011)
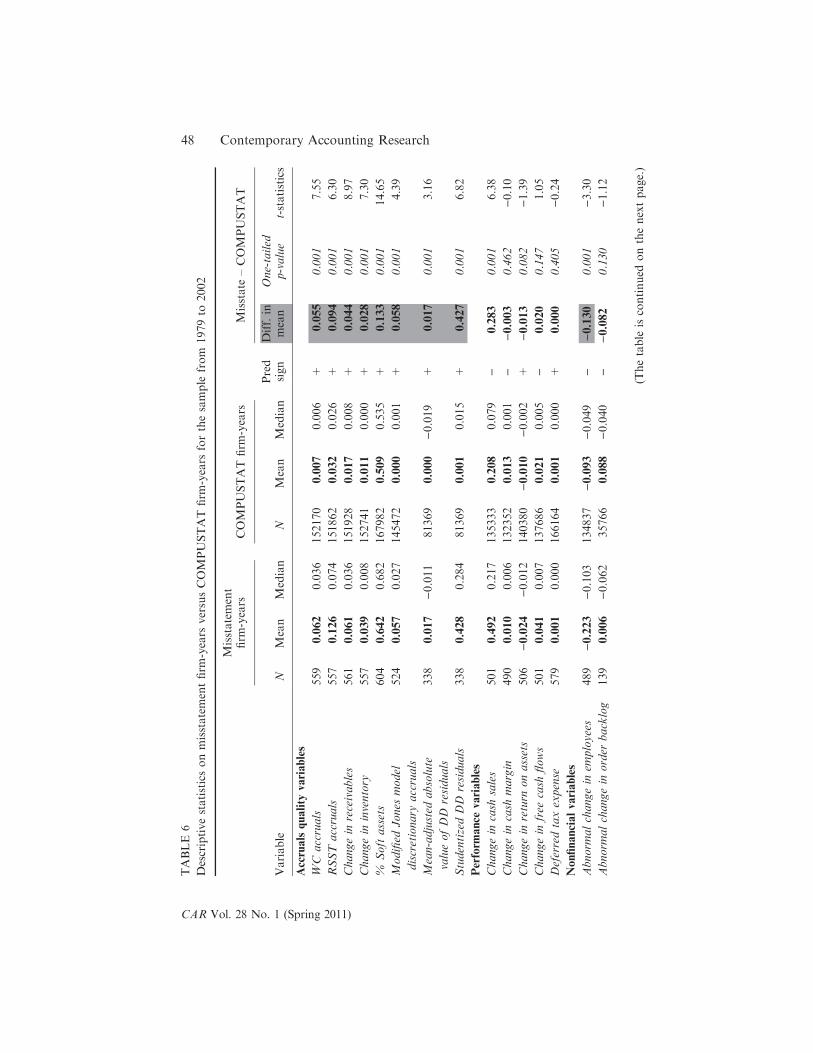
TABLE
6
Descriptivestatisticsonmisstatementfirm
-years
versusCOMPUSTAT
firm
-years
forthesample
from
1979to
2002
Variable
Misstatement
firm
-years
COMPUSTAT
firm
-years
Pred
sign
Misstate
–COMPUSTAT
NMean
Median
NMean
Median
Diff.in
mean
One-tailed
p-value
t-statistics
Accrualsquality
variables
WC
accruals
559
0.062
0.036
152170
0.007
0.006
+0.055
0.001
7.55
RSST
accruals
557
0.126
0.074
151862
0.032
0.026
+0.094
0.001
6.30
Changein
receivables
561
0.061
0.036
151928
0.017
0.008
+0.044
0.001
8.97
Changein
inventory
557
0.039
0.008
152741
0.011
0.000
+0.028
0.001
7.30
%Soft
assets
604
0.642
0.682
167982
0.509
0.535
+0.133
0.001
14.65
Modified
Jones
model
discretionary
accruals
524
0.057
0.027
145472
0.000
0.001
+0.058
0.001
4.39
Mean-adjusted
absolute
valueofDD
residuals
338
0.017
)0.011
81369
0.000
)0.019
+0.017
0.001
3.16
StudentizedDD
residuals
338
0.428
0.284
81369
0.001
0.015
+0.427
0.001
6.82
Perform
ance
variables
Changein
cash
sales
501
0.492
0.217
135333
0.208
0.079
)0.283
0.001
6.38
Changein
cash
margin
490
0.010
0.006
132352
0.013
0.001
))0.003
0.462
)0.10
Changein
return
onassets
506
)0.024
)0.012
140380
)0.010
)0.002
+)0.013
0.082
)1.39
Changein
free
cash
flows
501
0.041
0.007
137686
0.021
0.005
)0.020
0.147
1.05
Deferredtaxexpense
579
0.001
0.000
166164
0.001
0.000
+0.000
0.405
)0.24
Nonfinancialvariables
Abnorm
alchangein
employees
489
)0.223
)0.103
134837
)0.093
)0.049
))0.130
0.001
)3.30
Abnorm
alchangein
order
backlog
139
0.006
)0.062
35766
0.088
)0.040
))0.082
0.130
)1.12
(Thetable
iscontinued
onthenextpage.)
48 Contemporary Accounting Research
CAR Vol. 28 No. 1 (Spring 2011)
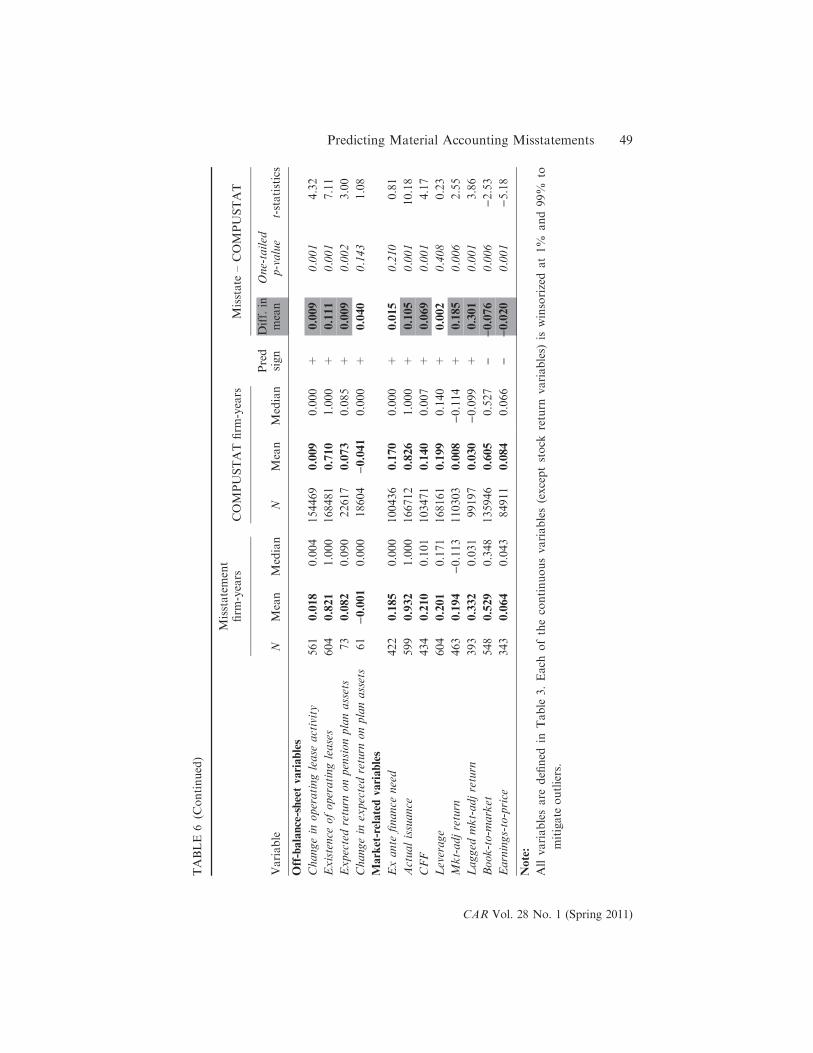
TABLE
6(C
ontinued)
Variable
Misstatement
firm
-years
COMPUSTAT
firm
-years
Pred
sign
Misstate
–COMPUSTAT
NMean
Median
NMean
Median
Diff.in
mean
One-tailed
p-value
t-statistics
Off-balance-sheetvariables
Changein
operatinglease
activity
561
0.018
0.004
154469
0.009
0.000
+0.009
0.001
4.32
Existence
ofoperatingleases
604
0.821
1.000
168481
0.710
1.000
+0.111
0.001
7.11
Expectedreturn
onpensionplanassets
73
0.082
0.090
22617
0.073
0.085
+0.009
0.002
3.00
Changein
expectedreturn
onplanassets
61
)0.001
0.000
18604
)0.041
0.000
+0.040
0.143
1.08
Market-relatedvariables
Exante
finance
need
422
0.185
0.000
100436
0.170
0.000
+0.015
0.210
0.81
Actualissuance
599
0.932
1.000
166712
0.826
1.000
+0.105
0.001
10.18
CFF
434
0.210
0.101
103471
0.140
0.007
+0.069
0.001
4.17
Leverage
604
0.201
0.171
168161
0.199
0.140
+0.002
0.408
0.23
Mkt-adjreturn
463
0.194
)0.113
110303
0.008
)0.114
+0.185
0.006
2.55
Lagged
mkt-adjreturn
393
0.332
0.031
99197
0.030
)0.099
+0.301
0.001
3.86
Book-to-m
arket
548
0.529
0.348
135946
0.605
0.527
))0.076
0.006
)2.53
Earnings-to-price
343
0.064
0.043
84911
0.084
0.066
))0.020
0.001
)5.18
Note:
Allvariablesare
defined
inTable
3.Each
ofthecontinuousvariables(exceptstock
return
variables)
iswinsorizedat1%
and99%
to
mitigate
outliers.
Predicting Material Accounting Misstatements 49
CAR Vol. 28 No. 1 (Spring 2011)
flows, are all statistically insignificant in our time-series tests. Deferred tax
expense is also not significantly different. For a small sample of 27 firms
subject to SEC enforcement actions, Erickson, Hanlon, and Maydew (2004)
show that firms pay substantial taxes on overstated earnings. For example,
misstating cash sales boosts both accounting and tax income. If their find-
ings generalize, then this could explain why deferred taxes are not unusually
high during misstatement years.
We next examine nonfinancial variables, abnormal change in employees
and abnormal change in order backlog. Both variables show insignificant
changes during misstatement years. For our off-balance-sheet variables, we
find an increase in both the magnitude of operating lease commitments and
the percentage of firms that use operating leases during misstatement years.
It appears that misstating firms exploit the financial reporting flexibility
afforded by operating leases. For defined benefit pension plans we have
only a small sample size. We find that both the expected return on pension
plan assets and change in expected return on pension plan assets are signifi-
cantly greater in misstatement years.
The final set of variables relates to market incentives. As predicted, we
find that during misstating years more firms are issuing either debt or equity
(93.8 percent versus 86.9 percent) and cash from financing is significantly
higher (24.7 percent versus 15.1 percent). We argue that incentives to mis-
state are higher during issuing periods. However, the SEC is probably more
likely to perform a review when a firm is raising capital and hence detect
the misstatement. Therefore, it is possible that SEC bias could also explain
this result. Both leverage and ex ante financing need are insignificantly dif-
ferent for misstatement years. Market-adjusted stock return is higher during
misstatement years (23.4 percent versus )0.4 percent). We analyze this find-
ing in more detail in Figure 1, discussed in the next section. Book-to-market
ratios are in the opposite direction from what we predicted while earnings-
to-price ratios are lower in misstating periods, consistent with our prediction
that misstating firms have optimistic future earnings growth expectations
built into their prices.
In summary, the results are generally consistent with our expectations.
Misstating firms have high accruals, show declining performance, are raising
financing, and have high growth expectations embedded in their stock prices.
Comparisons using only years before the misstatement
Using all firm-years, as in Table 4, provides more powerful tests because we
capture information in accrual reversals and declines in performance, as well
as changes in market expectations in the years after the misstatements. In
many settings such information is readily available (e.g., for a researcher or
regulator). However, it is important also to determine the predictive nature of
the variables. Table 5 replicates the analysis in Table 4 but uses only the years
prior to the misstatement as nonmisstatement years. In Table 5 we do not
report the results for accrual models. The modified Jones model pools across
50 Contemporary Accounting Research
CAR Vol. 28 No. 1 (Spring 2011)
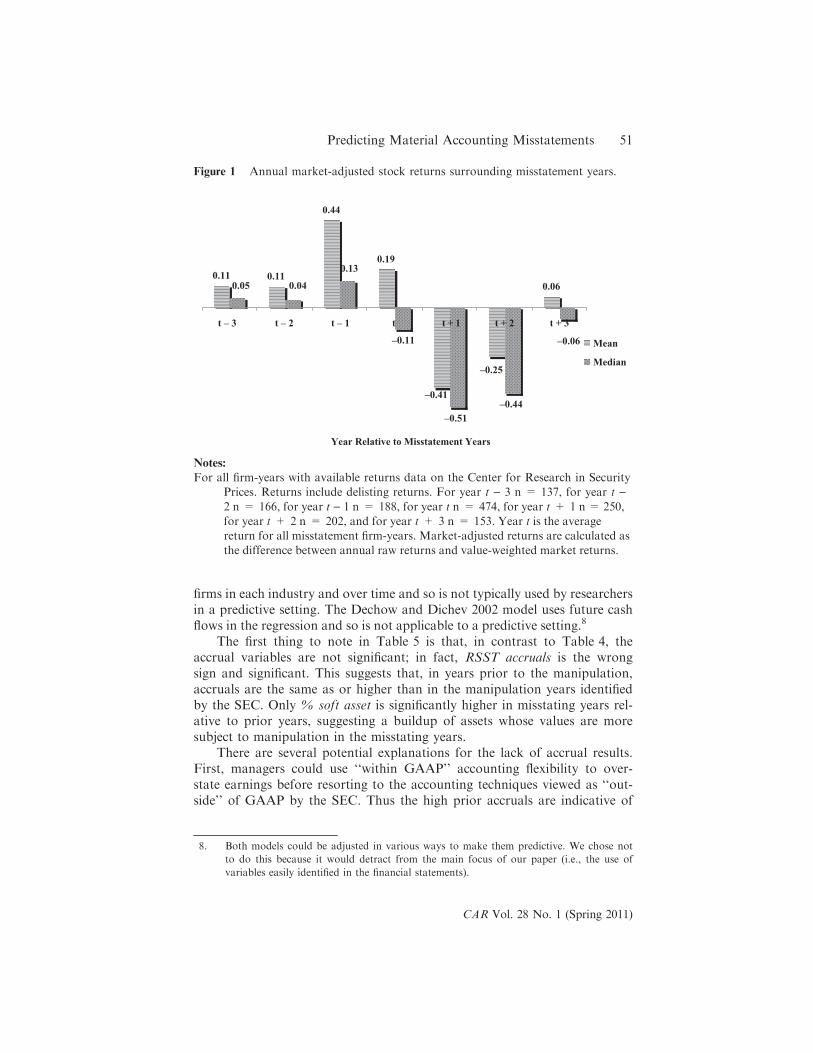
firms in each industry and over time and so is not typically used by researchers
in a predictive setting. The Dechow and Dichev 2002 model uses future cash
flows in the regression and so is not applicable to a predictive setting.8
The first thing to note in Table 5 is that, in contrast to Table 4, the
accrual variables are not significant; in fact, RSST accruals is the wrong
sign and significant. This suggests that, in years prior to the manipulation,
accruals are the same as or higher than in the manipulation years identified
by the SEC. Only % soft asset is significantly higher in misstating years rel-
ative to prior years, suggesting a buildup of assets whose values are more
subject to manipulation in the misstating years.
There are several potential explanations for the lack of accrual results.
First, managers could use ‘‘within GAAP’’ accounting flexibility to over-
state earnings before resorting to the accounting techniques viewed as ‘‘out-
side’’ of GAAP by the SEC. Thus the high prior accruals are indicative of
0.11 0.11
0.44
0.19
0.06
–0.11
–0.51
–0.44–0.41
–0.25
0.05 0.04
0.13
–0.06
t – 3 t – 2 t – 1 t t + 1 t + 2 t + 3
Year Relative to Misstatement Years
Mean
Median
Figure 1 Annual market-adjusted stock returns surrounding misstatement years.
Notes:
For all firm-years with available returns data on the Center for Research in Security
Prices. Returns include delisting returns. For year t ) 3 n = 137, for year t )
2 n = 166, for year t ) 1 n = 188, for year t n = 474, for year t + 1 n = 250,
for year t + 2 n = 202, and for year t + 3 n = 153. Year t is the average
return for all misstatement firm-years. Market-adjusted returns are calculated as
the difference between annual raw returns and value-weighted market returns.
8. Both models could be adjusted in various ways to make them predictive. We chose not
to do this because it would detract from the main focus of our paper (i.e., the use of
variables easily identified in the financial statements).
Predicting Material Accounting Misstatements 51
CAR Vol. 28 No. 1 (Spring 2011)
more estimation error and reliability concerns (e.g., Richardson et al. 2005).
Second, the high prior accruals could reflect manipulation that was too dif-
ficult for the SEC to identify or prove and so was not reported in the
AAER. Third, the high prior accruals could indicate overinvestment by
managers. Many of the AAER firms are raising financing, and both manag-
ers and investors could believe that greater investment will lead to more
growth. Managers could therefore be optimistic about the value of inven-
tory, credit sales, PP&E, and other assets. However, when growth slows,
managers may not wish to reveal the decline in sales or their overinvestment
and so resort to the aggressive accounting techniques identified by the SEC.
Turning to the performance variables, we see that most variables are not
significantly different at conventional levels. The two exceptions are return on
assets, which, as in Table 4, is the wrong sign (i.e., manipulating firms’ return
on assets is lower in misstating years) and deferred tax expense (also the wrong
sign). Turning to the nonfinancial measures, we see that abnormal change in
employees is higher in manipulation years. We predicted that employee
growth would be slower than asset growth (due to the inflation of assets) in
manipulation years. Thus the results are inconsistent with our expectations.
Recall that net operating assets are increasing at a faster rate in earlier years
(RSST accruals is the wrong sign), so the inconsistent results could be due to
the change in assets rather than change in employees. For off-balance-sheet
variables, the proportion of firms with operating leases is higher in manipula-
tion years than in earlier years (0.857 versus 0.685), consistent with firms
switching to off-balance-sheet assets. Operating leases tend to have lower
expenses than capitalizing the lease, early in the asset’s life, so switching to leas-
ing will improve earnings in growing firms. For market-related variables, we
find that the need for financing (ex ante financing need) is higher in earlier
years, while actual issuance is higher in manipulation years. This suggests
that the firm needed to raise capital in earlier years and did so (CFF is also
higher in earlier years) but that more firms actually issued debt or equity
financing in manipulation years. This is consistent with managers manipu-
lating the financial statements to obtain the financing. Market-to-book
ratios and stock price performance are similar in earlier years and manipu-
lation years. However, the earnings-to-price ratio is lower in manipulation
years, consistent with managers being able to maintain investor expectations
during manipulation years even though earnings declined.
Figure 1 provides a graphical timeline of annual market-adjusted stock
returns for misstating firms before and after the misstatement years. For the
firms misstating for multiple years, we take the average of their stock
returns during the misstatement period. The graph reveals that returns are
increasing in the three years leading up to the misstatement. In the misstate-
ment years, on average, the firms are able to maintain positive stock
returns. However, in the first year after the misstatement years, the stock
prices decline and returns are negative. The negative returns likely result from
the revelation of the misstatement (Feroz et al. 1991; Karpoff et al. 2008).
52 Contemporary Accounting Research
CAR Vol. 28 No. 1 (Spring 2011)
Note that the strong positive stock price performance during and prior
to manipulation years, combined with the negative stock price performance
that followed, could be one factor that triggered the SEC investigation.
Taken together, misstating firms appear to be engaging in more off-bal-
ance-sheet financing through leases, with relatively more of their asset bases
being composed of soft assets whose values are more subject to manipula-
tion. Moreover, misstating firms could be concerned about investor expecta-
tions. Their stock price performance is very high (around 20 percent) prior
to and in the year of misstatement, and they are issuing equity and raising
financing. They also appear to be either overinvesting in their assets or
engaging in accrual manipulation prior to and at the time of the misstate-
ment. Misstating firms have high accruals followed by significant declines in
return on assets during misstatement years.
Cross-sectional analysis of misstating firm-years
Our next test reported in Table 6 compares misstating firm-years to all firms
listed on the COMPUSTAT Annual File between 1979 and 2002. We limit
the sample to these years because the first AAER release occurred in 1982,
and very few firms are identified as misstating prior to 1979. The objective
of this test is to identify unusual characteristics of misstating firms relative
to the population. As mentioned earlier, we do this broad comparison
(rather than an industry size match comparison) because when we develop
our F-score model we want a measure that can be easily applied to all firms.
Industry adjustments would add complexity to this objective, although we
acknowledge that industry adjustment could improve the model’s predictive
ability. We provide some insights into this issue later in our robustness
tests, reported in Table 9.
The first set of variables reported in Table 6 relates to accrual quality.
We exclude performance-matched discretionary accruals, because this
adjustment is redundant when using the entire population. The results indi-
cate that all accrual variables are unusual and in the predicted direction in
misstating years, relative to the population. For example, in misstating
years the RSST accrual measure is 12.6 percent of assets, whereas for the
population, this measure is 3.2 percent of assets. Similarly, change in receiv-
ables is 6.1 percent for misstating firms and only 1.7 percent for the popula-
tion. % soft assets is also higher for misstating firms. The studentized DD
measure indicates that misstating firms’ residuals are on average 0.428
deviations from the regression line in the positive direction.
For the performance variables, change in cash sales for misstating firms
is about twice as large as for the population (0.492 versus 0.208). However,
change in return on assets is significantly lower for misstating firms ()0.024
versus )0.010). The results for nonfinancial variables and off-balance-sheet
variables are significant in most cases and all in the predicted direction.
Notably, for firms with pension plans we find that misstating firms assume
significantly higher expected returns on their plan assets (8.20 percent versus
Predicting Material Accounting Misstatements 53
CAR Vol. 28 No. 1 (Spring 2011)
7.30 percent). However, the change in expected return on plan assets is
insignificant.
Finally, for the market-related variables, the results are all in the pre-
dicted direction and significant in all but two variables (ex ante finance need
and leverage are insignificant). We report market-adjusted stock returns in
the misstatement year and the prior year. Compared to the average firm,
misstating firms have significantly greater returns in both years. In addition,
misstating firms have high valuations relative to fundamentals when com-
pared to the COMPUSTAT population. In contrast to Table 4, book-to-
market now loads in the correct direction. Thus both book-to-market and
earnings-to-price are significantly lower for misstating firms (i.e., they have
high valuations relative to fundamentals).
Prediction analysis and development of the F-score
In this section we provide multivariate analysis of variables discussed in
Table 6. Misstatements resulting in SEC Enforcement Actions are rare
events. Our misstatement sample represents less than half of one percent of
the firm-years available on COMPUSTAT. However, misstatements are
extremely costly to auditors (in terms of lawsuits), to investors (in terms of
negative stock returns), to regulators like the FASB and SEC (in terms of
reputation for quality and enforcement of accounting rules), and to capital
markets (in terms of lost investor confidence and reduced liquidity). There-
fore, even though misstatements are rare, a model that can help identify
misstatements can be used as a first-pass screen to identify firms that war-
rant further investigation.
Table 7 provides our logistic models for the determinants of misstate-
ments. Our dependent variable is equal to one for firm-years involving a
misstatement, and zero otherwise. We estimate logistic regressions to deter-
mine whether the variables we examined in univariate tests are jointly signif-
icant in predicting misstatement firm-years. We build three models for
predicting misstatement. Model 1 includes only financial-statement variables
as predictors, Model 2 adds nonfinancial-statement and off-balance-sheet
variables, and Model 3 incorporates market-based measures. We form our
models in this way so we can see the incremental benefit from including
information beyond the financial statements for predicting misstatement.
We use a backward elimination technique to arrive at our prediction
models. The backward elimination technique begins with all of our selected
variables.9 We then use the computational algorithm of Lawless and
9. We exclude from the selection process discretionary accrual measures because we want
variables that can be relatively easily calculated from the financial statements, variables
calculated using the statement of cash flows (CFF and ex ante financing need) because
these variables would restrict our analysis to observations after 1987, variables that are
not significantly different in Table 6, and order backlog and pension variables because
these are available for a limited set of firms.
54 Contemporary Accounting Research
CAR Vol. 28 No. 1 (Spring 2011)
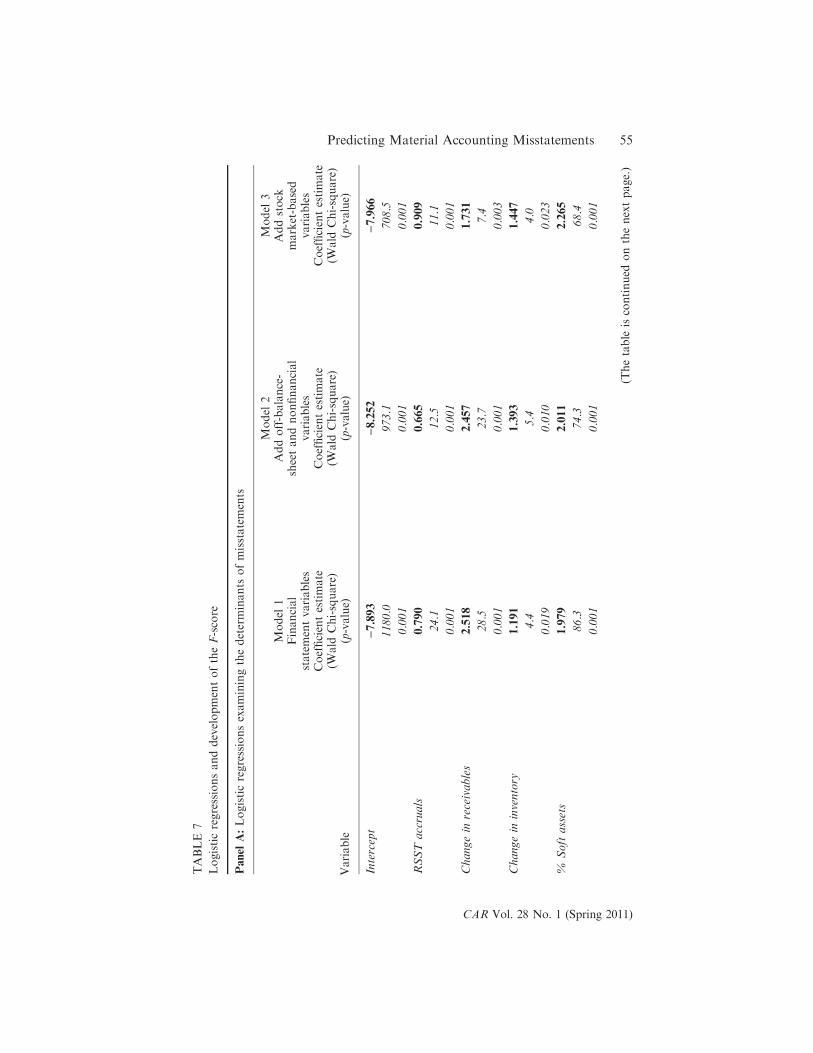
TABLE
7
LogisticregressionsanddevelopmentoftheF-score
Panel
A:Logisticregressionsexaminingthedeterminants
ofmisstatements
Variable
Model
1Financial
statementvariables
Coefficientestimate
(Wald
Chi-square)
(p-value)
Model
2Addoff-balance-
sheetandnonfinancial
variables
Coefficientestimate
(Wald
Chi-square)
(p-value)
Model
3Addstock
market-based
variables
Coefficientestimate
(Wald
Chi-square)
(p-value)
Intercept
)7.893
)8.252
)7.966
1180.0
973.1
708.5
0.001
0.001
0.001
RSST
accruals
0.790
0.665
0.909
24.1
12.5
11.1
0.001
0.001
0.001
Changein
receivables
2.518
2.457
1.731
28.5
23.7
7.4
0.001
0.001
0.003
Changein
inventory
1.191
1.393
1.447
4.4
5.4
4.0
0.019
0.010
0.023
%Softassets
1.979
2.011
2.265
86.3
74.3
68.4
0.001
0.001
0.001
(Thetable
iscontinued
onthenextpage.)
Predicting Material Accounting Misstatements 55
CAR Vol. 28 No. 1 (Spring 2011)
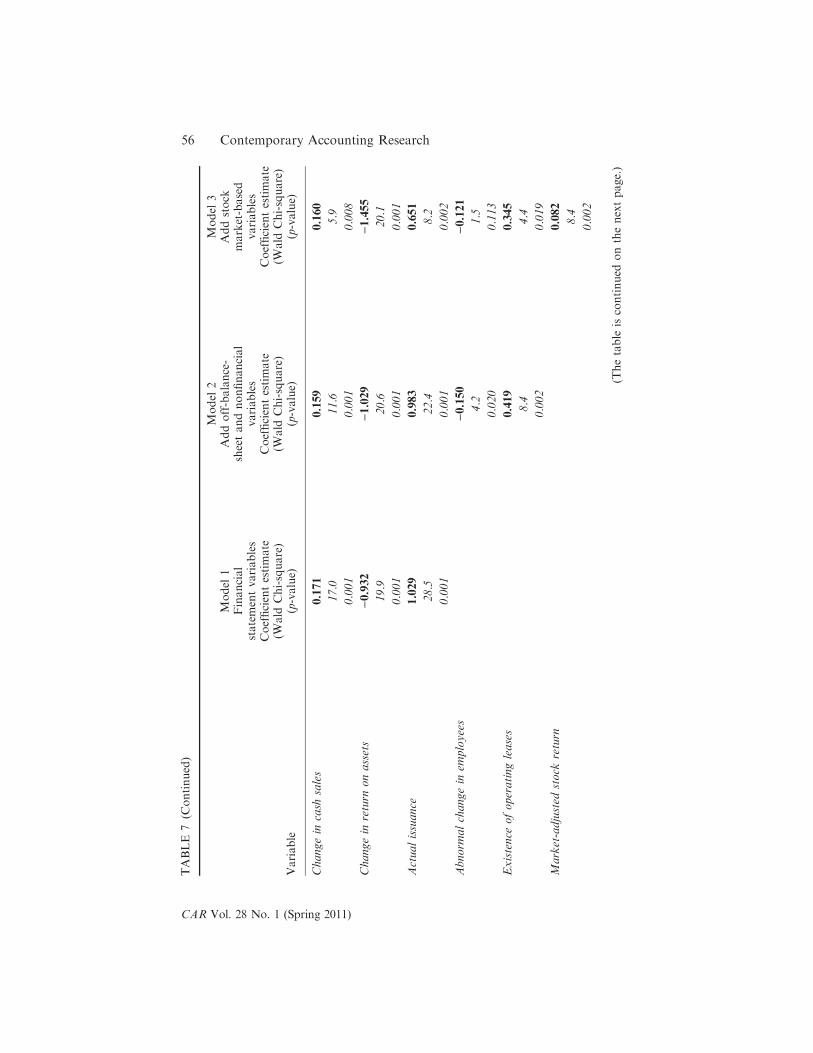
TABLE
7(C
ontinued)
Variable
Model
1Financial
statementvariables
Coefficientestimate
(Wald
Chi-square)
(p-value)
Model
2Addoff-balance-
sheetandnonfinancial
variables
Coefficientestimate
(Wald
Chi-square)
(p-value)
Model
3Addstock
market-based
variables
Coefficientestimate
(Wald
Chi-square)
(p-value)
Changein
cash
sales
0.171
0.159
0.160
17.0
11.6
5.9
0.001
0.001
0.008
Changein
return
onassets
)0.932
)1.029
)1.455
19.9
20.6
20.1
0.001
0.001
0.001
Actualissuance
1.029
0.983
0.651
28.5
22.4
8.2
0.001
0.001
0.002
Abnorm
alchangein
employees
)0.150
)0.121
4.2
1.5
0.020
0.113
Existence
ofoperatingleases
0.419
0.345
8.4
4.4
0.002
0.019
Market-adjusted
stock
return
0.082
8.4
0.002
(Thetable
iscontinued
onthenextpage.)
56 Contemporary Accounting Research
CAR Vol. 28 No. 1 (Spring 2011)
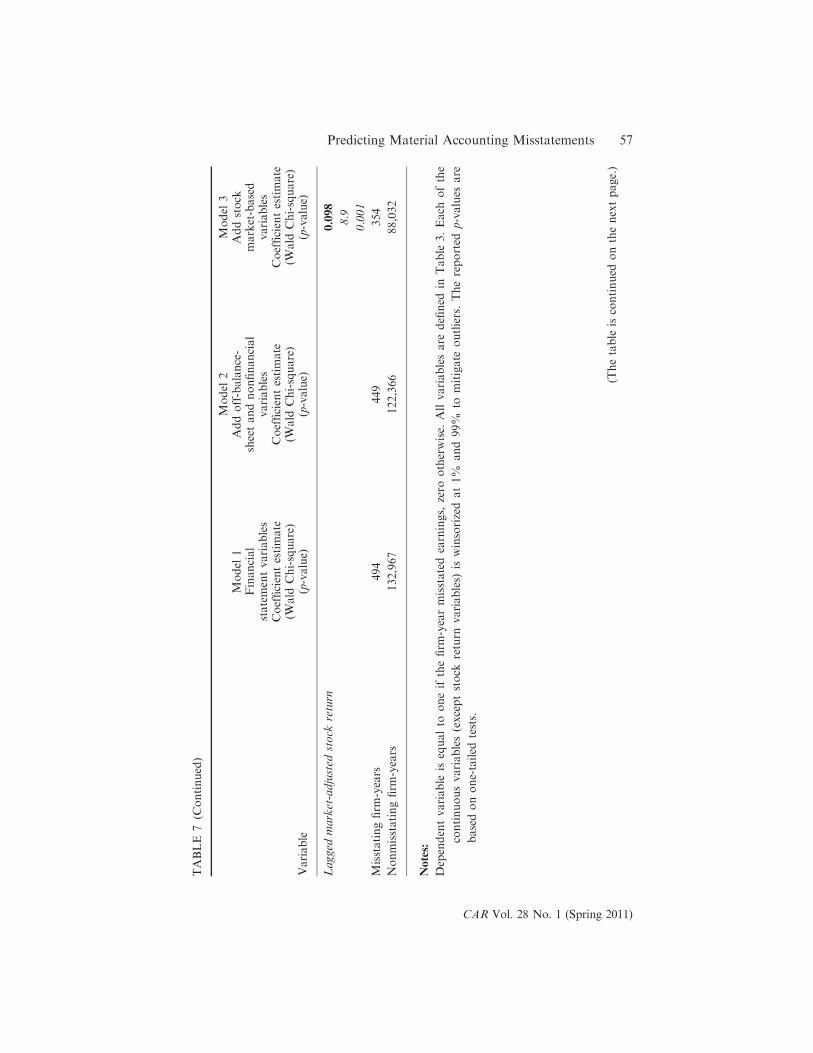
TABLE
7(C
ontinued)
Variable
Model
1Financial
statementvariables
Coefficientestimate
(Wald
Chi-square)
(p-value)
Model
2Addoff-balance-
sheetandnonfinancial
variables
Coefficientestimate
(Wald
Chi-square)
(p-value)
Model
3Addstock
market-based
variables
Coefficientestimate
(Wald
Chi-square)
(p-value)
Lagged
market-adjusted
stock
return
0.098
8.9
0.001
Misstatingfirm
-years
494
449
354
Nonmisstatingfirm
-years
132,967
122,366
88,032
Notes:
Dependentvariable
isequalto
oneifthefirm
-yearmisstatedearnings,
zero
otherwise.
Allvariablesare
defined
inTable
3.Each
ofthe
continuousvariables(exceptstock
return
variables)
iswinsorizedat1%
and99%
tomitigate
outliers.Thereported
p-values
are
basedonone-tailed
tests.
(Thetable
iscontinued
onthenextpage.)
Predicting Material Accounting Misstatements 57
CAR Vol. 28 No. 1 (Spring 2011)

TABLE
7(C
ontinued)
Panel
B:Examinationofthedetectionratesofmisstatingandnonmisstatingfirm
sforeach
model
reported
inpanel
A
Model
1Model
2Model
3
NMin.F-score
%of
total
NMin.F-score
%of
total
NMin.F-score
%oftotal
Quintile
1
Misstate
firm
s16
0.053
3.24
13
0.042
2.90
10
0.052
2.82
No-m
isstate
firm
s26,676
0.009
20.06
24,550
0.008
20.06
17,667
0.008
20.07
Quintile
2
Misstate
firm
s43
0.390
8.70
37
0.393
8.24
36
0.386
10.17
No-m
isstate
firm
s26,649
0.385
20.04
24,526
0.351
20.04
17,641
0.382
20.04
Quintile
3
Misstate
firm
s84
0.615
17.00
76
0.600
16.93
61
0.631
17.23
No-m
isstate
firm
s26,609
0.614
20.01
24,487
0.598
20.01
17,617
0.630
20.01
Quintile
4
Misstate
firm
s99
0.936
20.04
94
0.926
20.94
77
0.940
21.75
No-m
isstate
firm
s26,593
0.933
20.00
24,469
0.925
20.00
17,600
0.935
19.99
Quintile
5
Misstate
firm
s252
1.397
51.01
229
1.418
51.00
170
1.415
48.02
No-m
isstate
firm
s26,440
0.933
19.88
24,334
0.925
19.89
17,507
0.935
19.89
Notes:
Allobservationsare
ranked
basedontheirpredictedprobabilities(F-scores)
andsorted
into
quintiles.
Minim
um
F-score
istheminim
um
scaledpredictedprobabilitybasedonestimatesin
panel
Ato
entereach
quintile.
(Thetable
iscontinued
onthenextpage.)
58 Contemporary Accounting Research
CAR Vol. 28 No. 1 (Spring 2011)
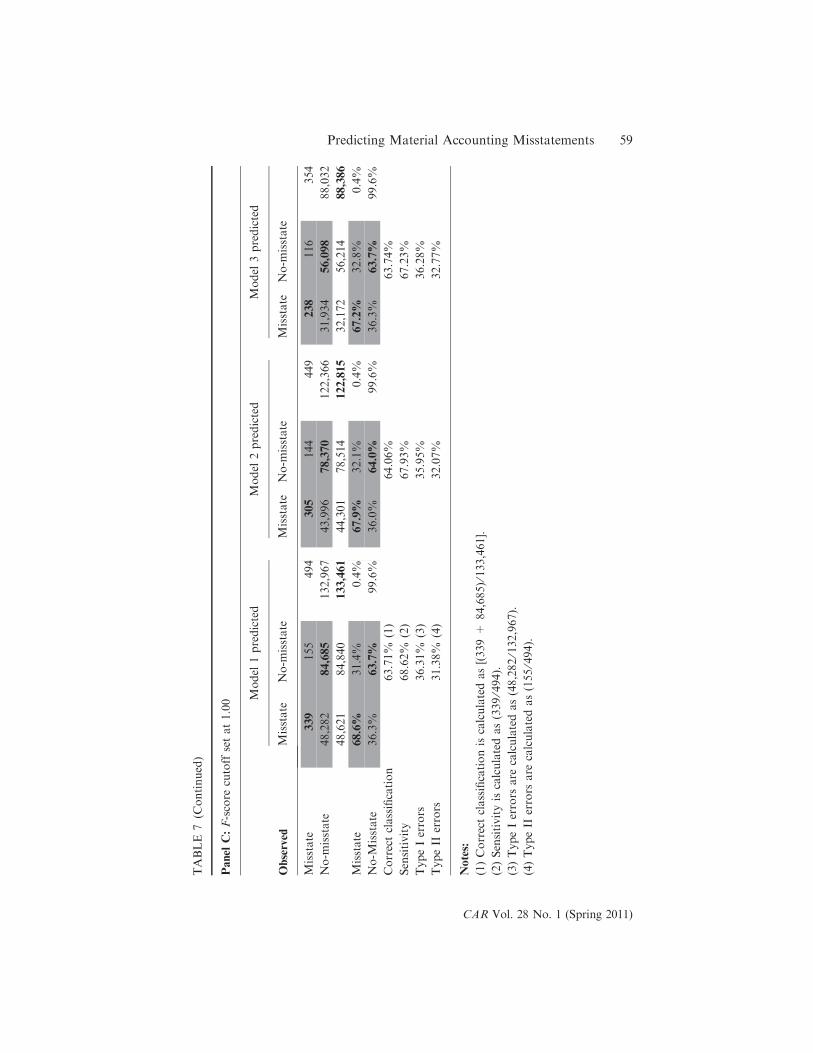
TABLE
7(C
ontinued)
Panel
C:F-score
cutoff
setat1.00
Observed
Model
1predicted
Model
2predicted
Model
3predicted
Misstate
No-m
isstate
Misstate
No-m
isstate
Misstate
No-m
isstate
Misstate
339
155
494
305
144
449
238
116
354
No-m
isstate
48,282
84,685
132,967
43,996
78,370
122,366
31,934
56,098
88,032
48,621
84,840
133,461
44,301
78,514
122,815
32,172
56,214
88,386
Misstate
68.6%
31.4%
0.4%
67.9%
32.1%
0.4%
67.2%
32.8%
0.4%
No-M
isstate
36.3%
63.7%
99.6%
36.0%
64.0%
99.6%
36.3%
63.7%
99.6%
Correctclassification
63.71%
(1)
64.06%
63.74%
Sensitivity
68.62%
(2)
67.93%
67.23%
TypeIerrors
36.31%
(3)
35.95%
36.28%
TypeII
errors
31.38%
(4)
32.07%
32.77%
Notes:
(1)Correctclassificationiscalculatedas[(339+
84,685)⁄133,461].
(2)Sensitivityiscalculatedas(339⁄494).
(3)TypeIerrors
are
calculatedas(48,282⁄132,967).
(4)TypeII
errors
are
calculatedas(155⁄494).
Predicting Material Accounting Misstatements 59
CAR Vol. 28 No. 1 (Spring 2011)

Singhal 1978 to compute a first-order approximation of the remaining slope
estimates for subsequent variable eliminations. Variables are removed based
on these approximations. We set the significance level for elimination at the
15 percent level.10
Model 1 begins with our accruals quality measures, the performance
measures, and the market-related measures that are computed from vari-
ables in the financial statements. After performing backward elimination,
we retain the following variables: RSST accruals, change in receivables,
change in inventory, % soft assets, change in cash sales, change in return on
assets, and actual issuance. For Model 2, we retain the variables from
Model 1 and add the nonfinancial variables and off-balance-sheet vari-
ables. After backward elimination, we retain abnormal change in employees
and existence of operating leases. For Model 3, we add our market-based
variables (our two return measures and book-to-market). The two return
measures, lagged market-adjusted stock return and market-adjusted stock
return in the current year, are retained in the model after backward elimi-
nation. Table 7, panel A provides the resulting coefficient estimates for the
models.
Next, we examine the quality of our models. As we suggested above,
it is important to remember that, because we cannot identify firms that
misstate and are not subsequently caught and investigated by the SEC,
our analysis of errors is based on the joint fact that a firm misstated
and received an enforcement action from the SEC. To examine the qual-
ity of our models, we analyze the predicted probabilities that the model
assigns to each observation. It is not possible to test how well our model
performs at predicting firms that misstate but are not subsequently
caught by the SEC. Predicted values are obtained by plugging each firm’s
individual characteristics into the model and using the estimated coeffi-
cients to determine the predicted value. The predicted probability is
derived as:
Probability ¼ eðPredictedValueÞ
ð1þ eðPredictedValueÞÞ
We then divide the probability by the unconditional expectation of
misstatement to calculate our F-score. The unconditional expectation is
equal to the number of misstatement firms divided by the total number of
firms. Below is an example of how this is done for Model 1 for Enron in
2000.
10. We run the logistic procedure in SAS, with the model selection equal to BACKWARD
and FAST. Other model selection procedures produce similar results.
60 Contemporary Accounting Research
CAR Vol. 28 No. 1 (Spring 2011)
Enron in 2000
Predicted Value¼ÿ7:893þ0:790�ðrsst accÞþ2:518�ðch recÞþ1:191�ðch invÞþ1:979�ðsoft assetsÞ
þ0:171�ðch csÞþ ðÿ0:932Þ� ðch roaÞþ1:029�ðissueÞ
Predicted Value¼ÿ7:893þ0:790�ð0:01659Þþ2:518�ð0:17641Þþ1:191�ð:00718Þþ1:979�ð0:79975Þ
þ0:171�ð1:33335Þþ ðÿ0:932Þ� ðÿ0:01285Þþ1:029�ð1Þ
Predicted Value = )4.575
Probability = e ()4.575)⁄ (1 + e()4.575))
e = 2.71828183
Probability = 0.01020
Unconditional probability = 494 ⁄ (132,967 + 494) = 0.0037
F-score = 0.01020 ⁄0.0037
F-score for Enron = 2.76
An F-score of 1.00 indicates that the firm has the same probability of
misstatement as the unconditional expectation. F-scores greater than one
indicate higher probabilities of misstatement than the unconditional expec-
tation. Enron has an F-score of 2.76. This suggests that Enron has more
than twice the probability of having misstated compared to a randomly
selected firm from the population.
Table 7, panel B ranks firm-years into five portfolios based on the mag-
nitude of their F-scores. We report the frequency with which misstating and
nonmisstating firms fall into each quintile and the minimum F-score
required to be included in each quintile. If our models do a good job of
identifying misstatement firms, then we expect misstatement firms to be
clustered in the fifth portfolio. The results for Model 1 indicate that 51.01
percent of misstatement firms are in quintile 5, compared to the expected
level of 20 percent. The cutoff to be included in quintile 5 (i.e., the mini-
mum value) is 1.397, so Enron’s score for 2000 of 2.76 easily places it in
quintile 5. Model 2 adds nonfinancial and off-balance-sheet variables to the
variables in Model 1, and 51 percent of misstating firms are in quintile 5.
For Model 3, which includes market-related variables, 48.02 percent of
misstating firms are in quintile 5.
In panel C of Table 7, we evaluate the sensitivity of our models and
determine Type I and Type II error rates for an F-score cutoff of 1.00. The
results for Model 1 indicate that we correctly classify 339 of the 494 firms
(sensitivity equal to 68.62 percent). A Type II error occurs when our model
incorrectly classifies a misstating firm as a nonmisstating firm. The Type II
error rate is 31.38 percent (155 divided by 494). A Type I error occurs when
our model incorrectly classifies a nonmisstating firm as a misstating firm.
Predicting Material Accounting Misstatements 61
CAR Vol. 28 No. 1 (Spring 2011)
For an F-score cutoff of 1.00, we incorrectly classify 48,282 nonmisstating
years out of 132,967 total misstating years (our Type I error is 36.31 per-
cent). Similar results are found for Model 2 and Model 3.11
We provide further insights into sensitivity and Type I and Type II
error rates in Figure 2. Figure 2A provides the cumulative distribution of F-
scores for misstating firm-years. Figure 2B reports the cumulative distribu-
tion for all nonmisstating firms. These figures can be used to assess sensitiv-
ity and Type I error rates for any F-score cutoff. For example, for an F-
score of 2.45, Figure 2A reveals that the sensitivity is 18.8 percent (93 of
494 misstating firms have F-scores above this cutoff) and the Type II error
rate is 81.2 percent (401 of 494 misstating firms are classified as ‘‘clean’’),
while the Type I error rate is 5 percent (6,665 of 132,967 nonmisstating
firms have F-scores above this cutoff), while 95 percent of nonmisstating
firms are correctly classified. As a simple rule of thumb, we classify an F-
score greater than 1 as ‘‘above normal risk’’ and an F-score greater than
2.45 as ‘‘high risk’’.
Figure 2 can also provide insights into the likelihoods of Type I and
Type II errors. The cost of these errors is not the same. From an auditor’s
perspective the cost of Type I and Type II errors is likely to differ, with
Type II errors being more costly. When a misstatement goes undetected
(and is later revealed), the auditor is likely to be sued by investors, to be
sanctioned by regulatory bodies such as the SEC and the PCAOB and to
suffer a loss of reputation. A Type I error (a nonmisstating firm is suspected
of misstatement) is not costless and may result in lost fees, as the auditor
may choose to drop a client. Because Type II errors are more costly to the
auditor, an auditor is likely to prefer an F-score cutoff that makes more
Type I errors than Type II errors.
Figure 2C provides insights into how a user might make the trade-off
between Type I and Type II errors and provides a relative cost of errors
ratio. For each F-score, Figure 2C provides the total number of firms
11. In Table 6 we include all observations with available data for the calculation of vari-
ables included in model selection. This results in the number of observations declining
across models and makes direct comparisons across the models difficult. We reestimated
Models 1 and 2 using only observations available for Model 3 and find that variable
selection does not change, with the exception of abnormal change in employees drop-
ping from the model (not tabulated). When using the variables in Table 6 and setting
an F-score cutoff of 1.00, we find that with a consistent set of observations, Model 3
correctly classifies 66.95 percent (237 ⁄ 354) of misstatement firms and 63.86 percent
(55,225 ⁄ 88,032) of nonmisstatement firms. For Model 1 the correct classification of mis-
statement firms increases slightly to 67.23 percent (238 ⁄ 354), while the correct classifica-
tion of nonmisstatement firms decreases slightly to 63.55 percent (55,947 ⁄ 88,032).
Model 2 correctly classifies 65.53 percent (232 ⁄ 354) of misstatement firms and 63.51 per-
cent (55,908 ⁄ 88,032) of nonmisstatement firms. This suggests that, when considering
only firms with stock price information, Model 3 offers a slight improvement in classify-
ing nonmisstatement firms over Model 1 and Model 2 and a slight deterioration in clas-
sifying misstatement firms relative to Model 1.
62 Contemporary Accounting Research
CAR Vol. 28 No. 1 (Spring 2011)
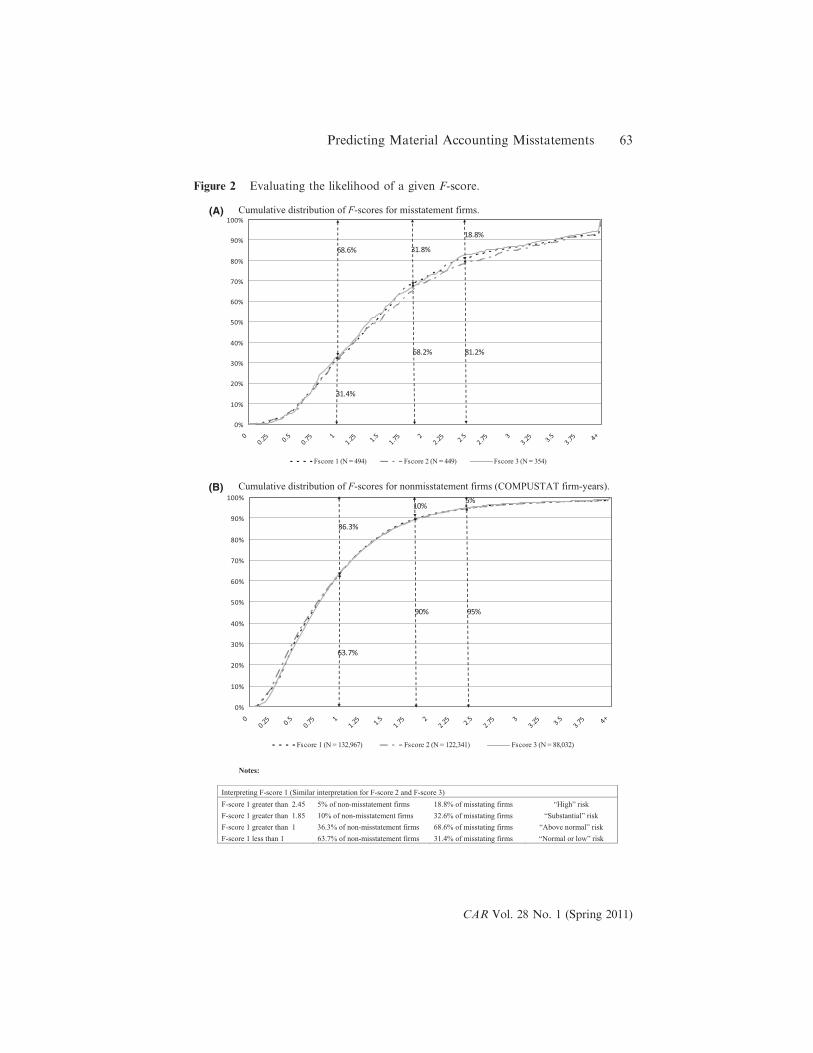
0%
10%
20%
30%
40%
50%
60%
70%
80%
90%
100%
0
0.25
0.5
0.75 1
1.25
1.5
1.75 2
2.25
2.5
2.75 3
3.25
3.5
3.75 4
+
Fscore 1 (N = 494) Fscore 2 (N = 449) Fscore 3 (N = 354)
31.8%
18.8%
31.4%
68.6%
68.2% 81.2%
0%
10%
20%
30%
40%
50%
60%
70%
80%
90%
100%
0
0.25
0.5
0.75 1
1.25
1.5
1.75 2
2.25
2.5
2.75 3
3.25
3.5
3.75 4
+
Fscore 1 (N = 132,967) Fscore 2 (N = 122,341) Fscore 3 (N = 88,032)
5%
63.7%
10%
90% 95%
36.3%
(A)
(B)
Notes:
)3erocs-Fdna2erocs-FrofnoitaterpretniralimiS(1erocs-FgniterpretnI
F-score 1 greater than 2.45 5% of non-misstatement firms 18.8% of misstating firms “High” risk
F-score 1 greater than 1.85 10% of non-misstatement firms 32.6% of misstating firms “Substantial” risk
F-score 1 greater than 1 36.3% of non-misstatement firms 68.6% of misstating firms “Above normal” risk
F-score 1 less than 1 63.7% of non-misstatement firms 31.4% of misstating firms “Normal or low” risk
Cumulative distribution of F-scores for misstatement firms.
Cumulative distribution of F-scores for nonmisstatement firms (COMPUSTAT firm-years).
Figure 2 Evaluating the likelihood of a given F-score.
Predicting Material Accounting Misstatements 63
CAR Vol. 28 No. 1 (Spring 2011)
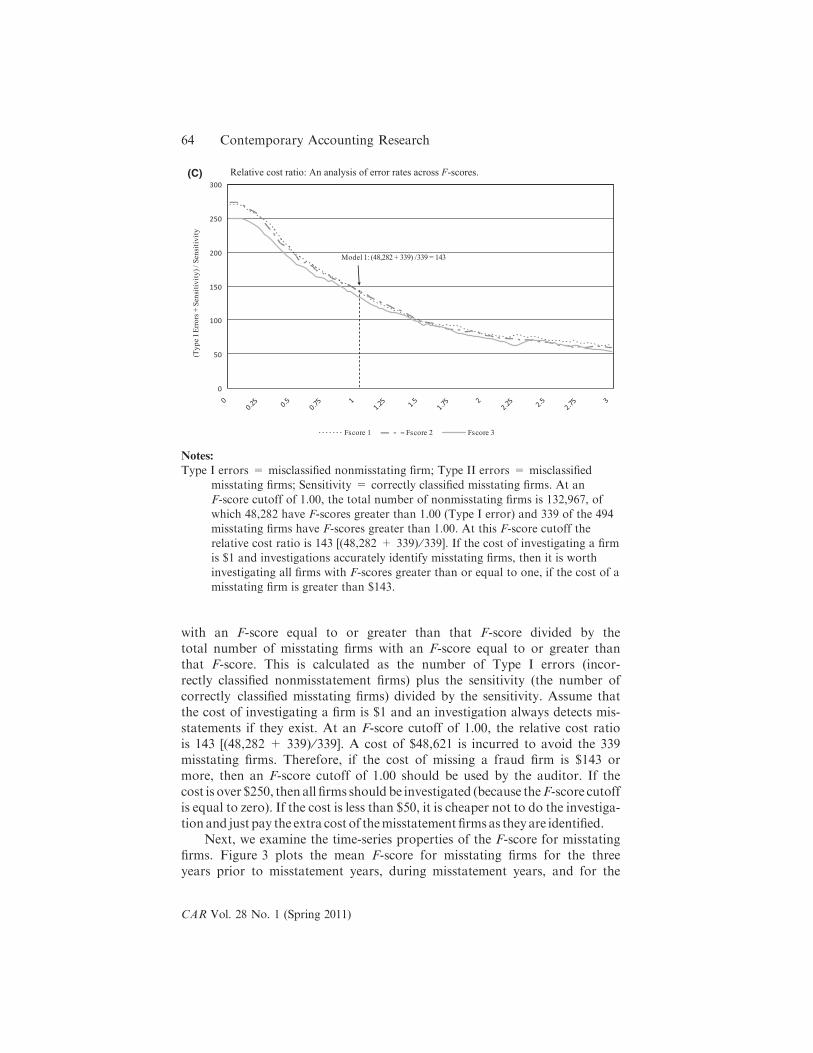
with an F-score equal to or greater than that F-score divided by the
total number of misstating firms with an F-score equal to or greater than
that F-score. This is calculated as the number of Type I errors (incor-
rectly classified nonmisstatement firms) plus the sensitivity (the number of
correctly classified misstating firms) divided by the sensitivity. Assume that
the cost of investigating a firm is $1 and an investigation always detects mis-
statements if they exist. At an F-score cutoff of 1.00, the relative cost ratio
is 143 [(48,282 + 339) ⁄339]. A cost of $48,621 is incurred to avoid the 339
misstating firms. Therefore, if the cost of missing a fraud firm is $143 or
more, then an F-score cutoff of 1.00 should be used by the auditor. If the
cost is over $250, then all firms should be investigated (because theF-score cutoff
is equal to zero). If the cost is less than $50, it is cheaper not to do the investiga-
tion and just pay the extra cost of themisstatement firmsas they are identified.
Next, we examine the time-series properties of the F-score for misstating
firms. Figure 3 plots the mean F-score for misstating firms for the three
years prior to misstatement years, during misstatement years, and for the
0
50
100
150
200
250
300
0
0.25
0.5
0.75 1
1.25
1.5
1.75 2
2.25
2.5
2.75 3
Fscore 1 Fscore 2 Fscore 3
Model 1: (48,282 + 339) /339 = 143
(Ty
pe I
Err
ors
+ S
ensi
tiv
ity
) /
Sen
siti
vit
y
(C) Relative cost ratio: An analysis of error rates across F-scores.
Notes:
Type I errors = misclassified nonmisstating firm; Type II errors = misclassified
misstating firms; Sensitivity = correctly classified misstating firms. At an
F-score cutoff of 1.00, the total number of nonmisstating firms is 132,967, of
which 48,282 have F-scores greater than 1.00 (Type I error) and 339 of the 494
misstating firms have F-scores greater than 1.00. At this F-score cutoff the
relative cost ratio is 143 [(48,282 + 339) ⁄ 339]. If the cost of investigating a firm
is $1 and investigations accurately identify misstating firms, then it is worth
investigating all firms with F-scores greater than or equal to one, if the cost of a
misstating firm is greater than $143.
64 Contemporary Accounting Research
CAR Vol. 28 No. 1 (Spring 2011)
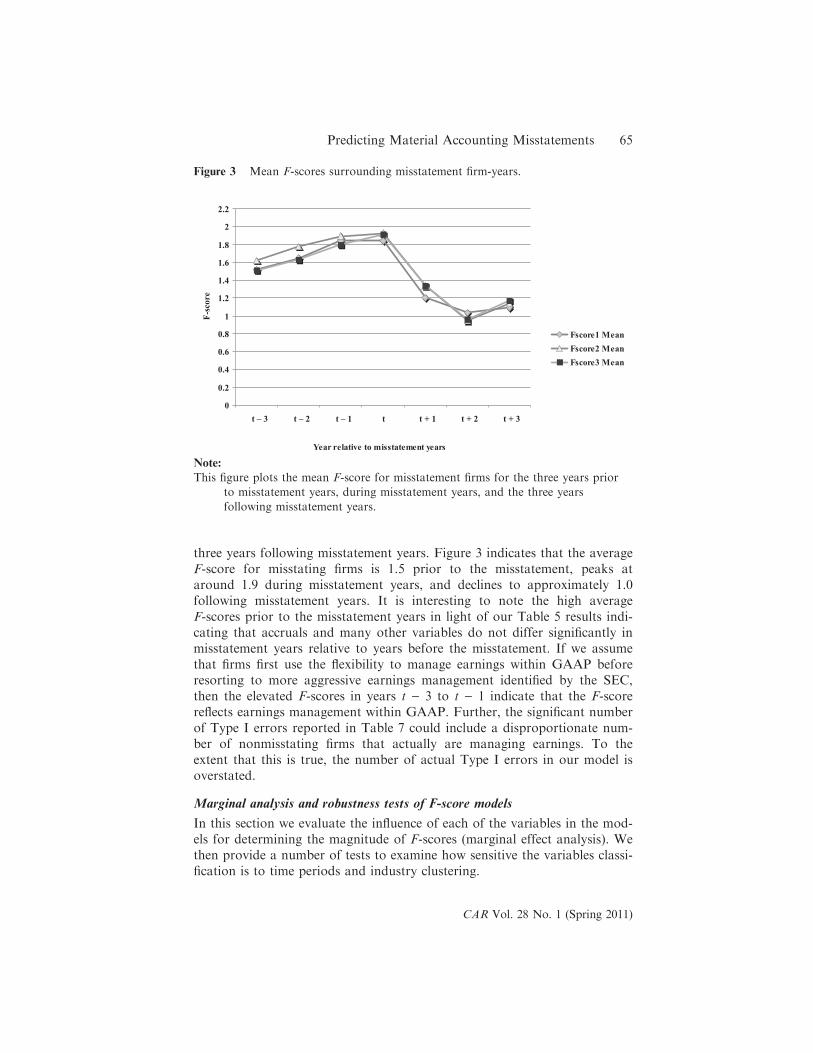
three years following misstatement years. Figure 3 indicates that the average
F-score for misstating firms is 1.5 prior to the misstatement, peaks at
around 1.9 during misstatement years, and declines to approximately 1.0
following misstatement years. It is interesting to note the high average
F-scores prior to the misstatement years in light of our Table 5 results indi-
cating that accruals and many other variables do not differ significantly in
misstatement years relative to years before the misstatement. If we assume
that firms first use the flexibility to manage earnings within GAAP before
resorting to more aggressive earnings management identified by the SEC,
then the elevated F-scores in years t ) 3 to t ) 1 indicate that the F-score
reflects earnings management within GAAP. Further, the significant number
of Type I errors reported in Table 7 could include a disproportionate num-
ber of nonmisstating firms that actually are managing earnings. To the
extent that this is true, the number of actual Type I errors in our model is
overstated.
Marginal analysis and robustness tests of F-score models
In this section we evaluate the influence of each of the variables in the mod-
els for determining the magnitude of F-scores (marginal effect analysis). We
then provide a number of tests to examine how sensitive the variables classi-
fication is to time periods and industry clustering.
0
0.2
0.4
0.6
0.8
1
1.2
1.4
1.6
1.8
2
2.2
t – 3 t – 2 t – 1 t t + 1 t + 2 t + 3
Year relative to misstatement years
F-score
Fscore1 Mean
Fscore2 Mean
Fscore3 Mean
Figure 3 Mean F-scores surrounding misstatement firm-years.
Note:
This figure plots the mean F-score for misstatement firms for the three years prior
to misstatement years, during misstatement years, and the three years
following misstatement years.
Predicting Material Accounting Misstatements 65
CAR Vol. 28 No. 1 (Spring 2011)
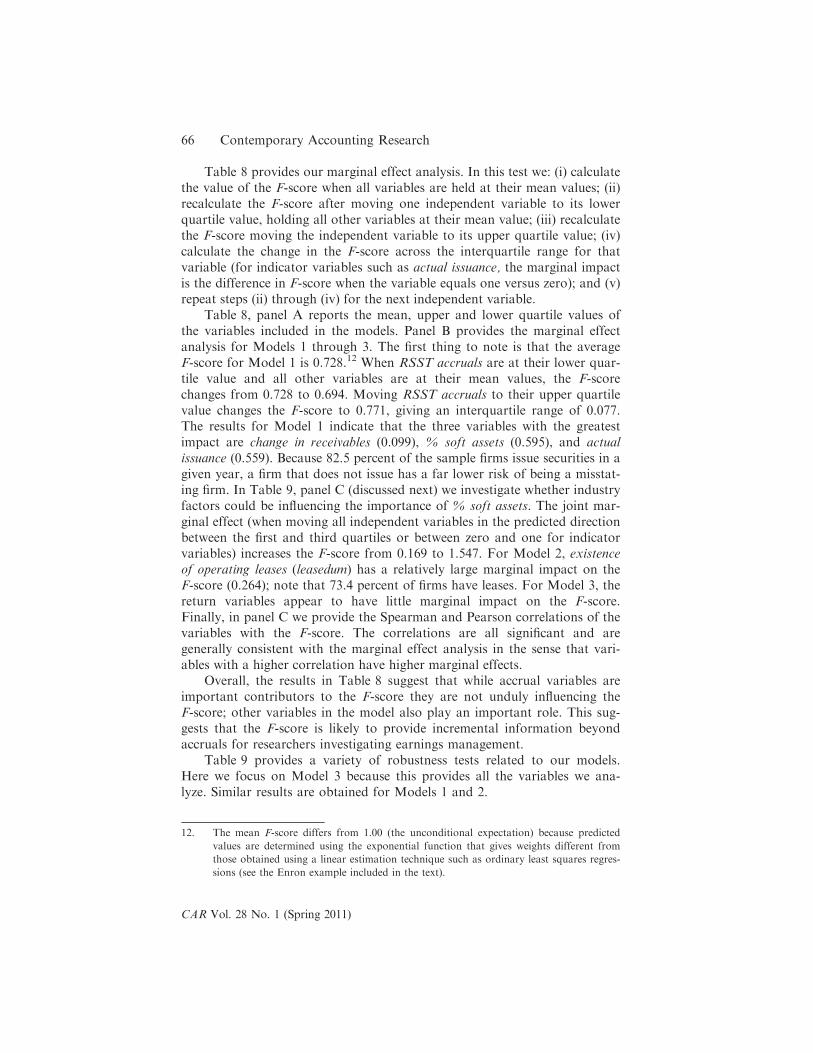
Table 8 provides our marginal effect analysis. In this test we: (i) calculate
the value of the F-score when all variables are held at their mean values; (ii)
recalculate the F-score after moving one independent variable to its lower
quartile value, holding all other variables at their mean value; (iii) recalculate
the F-score moving the independent variable to its upper quartile value; (iv)
calculate the change in the F-score across the interquartile range for that
variable (for indicator variables such as actual issuance, the marginal impact
is the difference in F-score when the variable equals one versus zero); and (v)
repeat steps (ii) through (iv) for the next independent variable.
Table 8, panel A reports the mean, upper and lower quartile values of
the variables included in the models. Panel B provides the marginal effect
analysis for Models 1 through 3. The first thing to note is that the average
F-score for Model 1 is 0.728.12 When RSST accruals are at their lower quar-
tile value and all other variables are at their mean values, the F-score
changes from 0.728 to 0.694. Moving RSST accruals to their upper quartile
value changes the F-score to 0.771, giving an interquartile range of 0.077.
The results for Model 1 indicate that the three variables with the greatest
impact are change in receivables (0.099), % soft assets (0.595), and actual
issuance (0.559). Because 82.5 percent of the sample firms issue securities in a
given year, a firm that does not issue has a far lower risk of being a misstat-
ing firm. In Table 9, panel C (discussed next) we investigate whether industry
factors could be influencing the importance of % soft assets. The joint mar-
ginal effect (when moving all independent variables in the predicted direction
between the first and third quartiles or between zero and one for indicator
variables) increases the F-score from 0.169 to 1.547. For Model 2, existence
of operating leases (leasedum) has a relatively large marginal impact on the
F-score (0.264); note that 73.4 percent of firms have leases. For Model 3, the
return variables appear to have little marginal impact on the F-score.
Finally, in panel C we provide the Spearman and Pearson correlations of the
variables with the F-score. The correlations are all significant and are
generally consistent with the marginal effect analysis in the sense that vari-
ables with a higher correlation have higher marginal effects.
Overall, the results in Table 8 suggest that while accrual variables are
important contributors to the F-score they are not unduly influencing the
F-score; other variables in the model also play an important role. This sug-
gests that the F-score is likely to provide incremental information beyond
accruals for researchers investigating earnings management.
Table 9 provides a variety of robustness tests related to our models.
Here we focus on Model 3 because this provides all the variables we ana-
lyze. Similar results are obtained for Models 1 and 2.
12. The mean F-score differs from 1.00 (the unconditional expectation) because predicted
values are determined using the exponential function that gives weights different from
those obtained using a linear estimation technique such as ordinary least squares regres-
sions (see the Enron example included in the text).
66 Contemporary Accounting Research
CAR Vol. 28 No. 1 (Spring 2011)
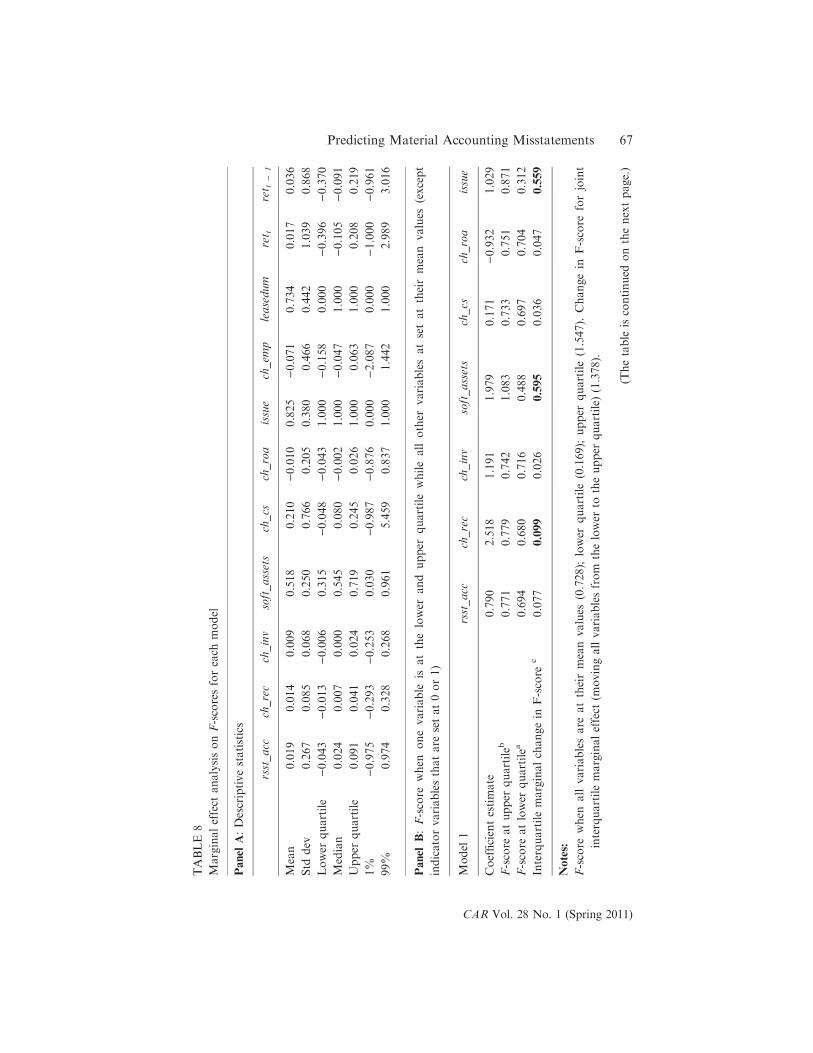
TABLE
8
Marginaleffect
analysisonF-scoresforeach
model
Panel
A:Descriptivestatistics
rsst_acc
ch_rec
ch_inv
soft_assets
ch_cs
ch_roa
issue
ch_em
pleasedum
ret t
ret t)
1
Mean
0.019
0.014
0.009
0.518
0.210
)0.010
0.825
)0.071
0.734
0.017
0.036
Std
dev
0.267
0.085
0.068
0.250
0.766
0.205
0.380
0.466
0.442
1.039
0.868
Lower
quartile
)0.043
)0.013
)0.006
0.315
)0.048
)0.043
1.000
)0.158
0.000
)0.396
)0.370
Median
0.024
0.007
0.000
0.545
0.080
)0.002
1.000
)0.047
1.000
)0.105
)0.091
Upper
quartile
0.091
0.041
0.024
0.719
0.245
0.026
1.000
0.063
1.000
0.208
0.219
1%
)0.975
)0.293
)0.253
0.030
)0.987
)0.876
0.000
)2.087
0.000
)1.000
)0.961
99%
0.974
0.328
0.268
0.961
5.459
0.837
1.000
1.442
1.000
2.989
3.016
Panel
B:F-score
when
onevariable
isatthelower
and
upper
quartilewhileall
other
variablesatsetattheirmean
values
(except
indicatorvariablesthatare
setat0or1)
Model
1rsst_acc
ch_rec
ch_inv
soft_assets
ch_cs
ch_roa
issue
Coefficientestimate
0.790
2.518
1.191
1.979
0.171
)0.932
1.029
F-score
atupper
quartileb
0.771
0.779
0.742
1.083
0.733
0.751
0.871
F-score
atlower
quartilea
0.694
0.680
0.716
0.488
0.697
0.704
0.312
Interquartilemarginalchangein
F-score
c0.077
0.099
0.026
0.595
0.036
0.047
0.559
Notes:
F-score
when
allvariablesare
attheirmeanvalues
(0.728);
lower
quartile(0.169);
upper
quartile(1.547).
Changein
F-score
forjoint
interquartilemarginaleffect
(movingallvariablesfrom
thelower
totheupper
quartile)
(1.378).
(Thetable
iscontinued
onthenextpage.)
Predicting Material Accounting Misstatements 67
CAR Vol. 28 No. 1 (Spring 2011)
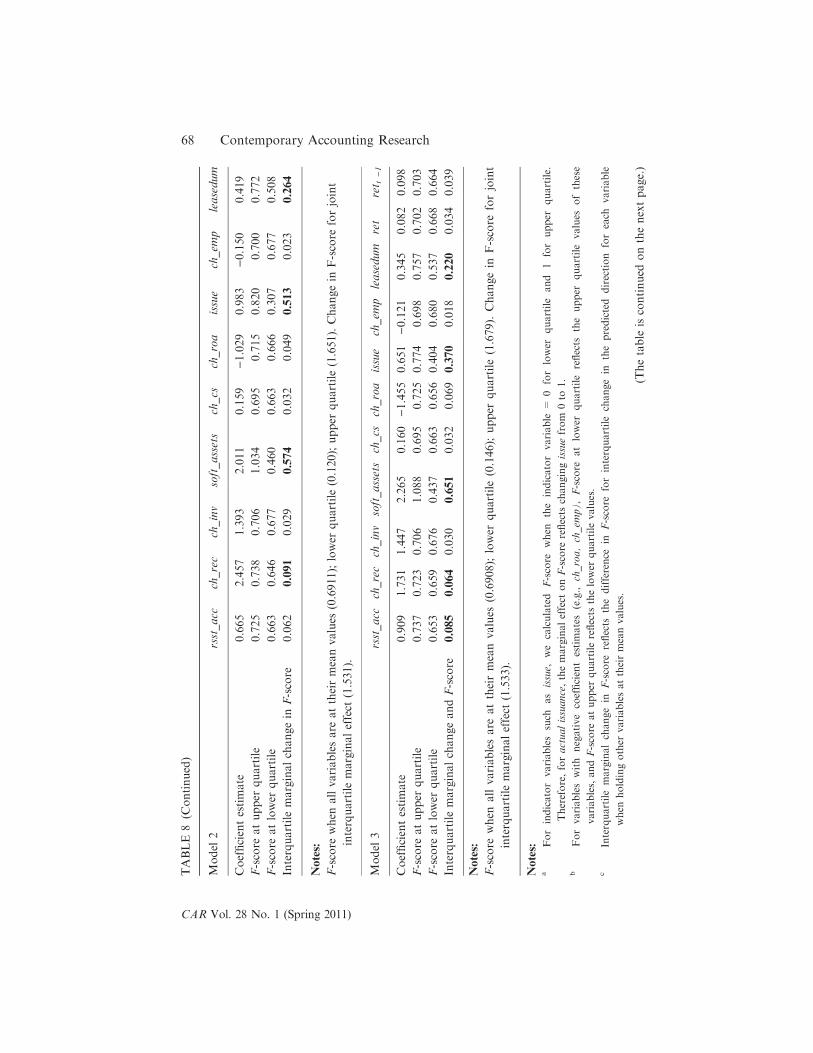
TABLE
8(C
ontinued)
Model
2rsst_acc
ch_rec
ch_inv
soft_assets
ch_cs
ch_roa
issue
ch_em
pleasedum
Coefficientestimate
0.665
2.457
1.393
2.011
0.159
)1.029
0.983
)0.150
0.419
F-score
atupper
quartile
0.725
0.738
0.706
1.034
0.695
0.715
0.820
0.700
0.772
F-score
atlower
quartile
0.663
0.646
0.677
0.460
0.663
0.666
0.307
0.677
0.508
Interquartilemarginalchangein
F-score
0.062
0.091
0.029
0.574
0.032
0.049
0.513
0.023
0.264
Notes:
F-score
when
allvariablesare
attheirmeanvalues
(0.6911);lower
quartile(0.120);upper
quartile(1.651).Changein
F-score
forjoint
interquartilemarginaleffect
(1.531).
Model
3rsst_acc
ch_rec
ch_inv
soft_assets
ch_cs
ch_roa
issue
ch_em
pleasedum
ret
ret t)1
Coefficientestimate
0.909
1.731
1.447
2.265
0.160
)1.455
0.651
)0.121
0.345
0.082
0.098
F-score
atupper
quartile
0.737
0.723
0.706
1.088
0.695
0.725
0.774
0.698
0.757
0.702
0.703
F-score
atlower
quartile
0.653
0.659
0.676
0.437
0.663
0.656
0.404
0.680
0.537
0.668
0.664
InterquartilemarginalchangeandF-score
0.085
0.064
0.030
0.651
0.032
0.069
0.370
0.018
0.220
0.034
0.039
Notes:
F-score
when
allvariablesare
attheirmeanvalues
(0.6908);
lower
quartile(0.146);
upper
quartile(1.679).
Changein
F-score
forjoint
interquartilemarginaleffect
(1.533).
Notes:
aForindicatorvariablessuch
asissue,
we
calculated
F-score
when
the
indicatorvariable
=0
forlower
quartile
and
1forupper
quartile.
Therefore,foractualissuance,themarginaleffect
onF-score
reflects
changingissuefrom
0to
1.
bForvariableswith
negativecoefficientestimates(e.g.,
ch_roa,ch_em
p),F-score
atlower
quartile
reflects
theupper
quartilevalues
ofthese
variables,andF-score
atupper
quartilereflects
thelower
quartilevalues.
cInterquartilemarginalchangein
F-score
reflects
thedifference
inF-score
forinterquartilechangein
thepredicted
direction
foreach
variable
when
holdingother
variablesattheirmeanvalues.
(Thetable
iscontinued
onthenextpage.)
68 Contemporary Accounting Research
CAR Vol. 28 No. 1 (Spring 2011)
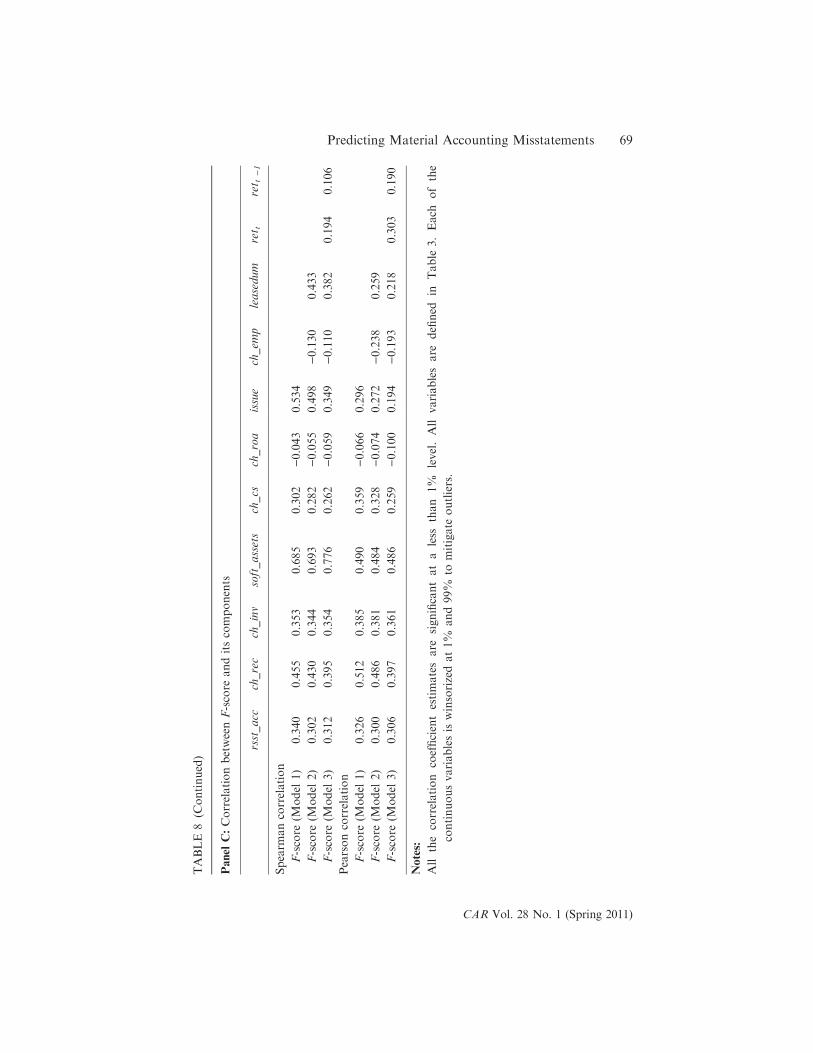
TABLE
8(C
ontinued)
Panel
C:CorrelationbetweenF-score
anditscomponents
rsst_acc
ch_rec
ch_inv
soft_assets
ch_cs
ch_roa
issue
ch_em
pleasedum
ret t
ret t)1
Spearm
ancorrelation
F-score
(Model
1)
0.340
0.455
0.353
0.685
0.302
)0.043
0.534
F-score
(Model
2)
0.302
0.430
0.344
0.693
0.282
)0.055
0.498
)0.130
0.433
F-score
(Model
3)
0.312
0.395
0.354
0.776
0.262
)0.059
0.349
)0.110
0.382
0.194
0.106
Pearsoncorrelation
F-score
(Model
1)
0.326
0.512
0.385
0.490
0.359
)0.066
0.296
F-score
(Model
2)
0.300
0.486
0.381
0.484
0.328
)0.074
0.272
)0.238
0.259
F-score
(Model
3)
0.306
0.397
0.361
0.486
0.259
)0.100
0.194
)0.193
0.218
0.303
0.190
Notes:
All
thecorrelation
coefficientestimatesare
significantata
less
than
1%
level.All
variablesare
defined
inTable
3.Each
ofthe
continuousvariablesiswinsorizedat1%
and99%
tomitigate
outliers.
Predicting Material Accounting Misstatements 69
CAR Vol. 28 No. 1 (Spring 2011)

TABLE
9
Robustnesstests
Panel
A:Logisticregressionsexaminingthedeterminants
ofmisstatements
estimatedforModel
3
Variable
(1)Variablesselected
for
Model
3for1979–1998period
Coefficientestimate
(Wald
Chi-square)
(2)Variablesselected
forModel
3excluding
boom
years
(1998–2000)
Coefficientestimate
(Wald
Chi-square)
(3)Addingindustry
variablesto
Model
3in
Table
7Coefficientestimate
(Wald
Chi-square)
Intercept
)7.560***
)7.597***
)8.005***
550.9
612.0
705.5
RSST
accruals
1.049***
0.885***
0.849***
10.9
8.8
9.8
Changein
receivables
1.227**
1.639***
1.543***
2.8
5.5
6.0
Changein
inventory
1.813**
1.797***
1.680**
4.9
5.3
5.2
%Soft
assets
1.768***
1.963***
2.214***
33.2
45.2
64.7
Changein
cash
sales
0.195***
0.188***
0.153**
8.2
8.2
5.2
Changein
return
onassets
)1.280***
)1.317***
)1.328***
10.5
13.5
17.3
Actualissuance
0.521**
0.501**
0.639***
4.7
4.8
7.9
Abnorm
alchangein
employees
)0.122
1.5
(Thetable
iscontinued
onthenextpage.)
70 Contemporary Accounting Research
CAR Vol. 28 No. 1 (Spring 2011)
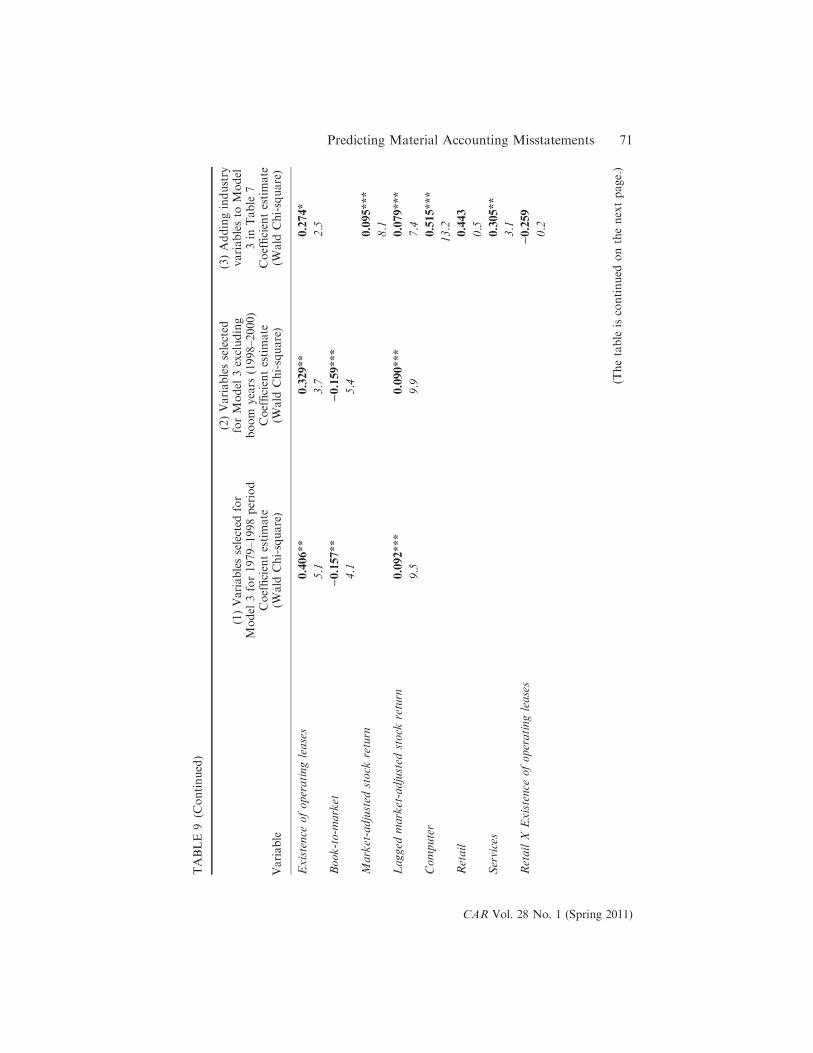
TABLE
9(C
ontinued)
Variable
(1)Variablesselected
for
Model
3for1979–1998period
Coefficientestimate
(Wald
Chi-square)
(2)Variablesselected
forModel
3excluding
boom
years
(1998–2000)
Coefficientestimate
(Wald
Chi-square)
(3)Addingindustry
variablesto
Model
3in
Table
7Coefficientestimate
(Wald
Chi-square)
Existence
ofoperatingleases
0.406**
0.329**
0.274*
5.1
3.7
2.5
Book-to-m
arket
)0.157**
)0.159***
4.1
5.4
Market-adjusted
stock
return
0.095***
8.1
Lagged
market-adjusted
stock
return
0.092***
0.090***
0.079***
9.5
9.9
7.4
Computer
0.515***
13.2
Retail
0.443
0.5
Services
0.305**
3.1
RetailX
Existence
ofoperatingleases
)0.259
0.2
(Thetable
iscontinued
onthenextpage.)
Predicting Material Accounting Misstatements 71
CAR Vol. 28 No. 1 (Spring 2011)
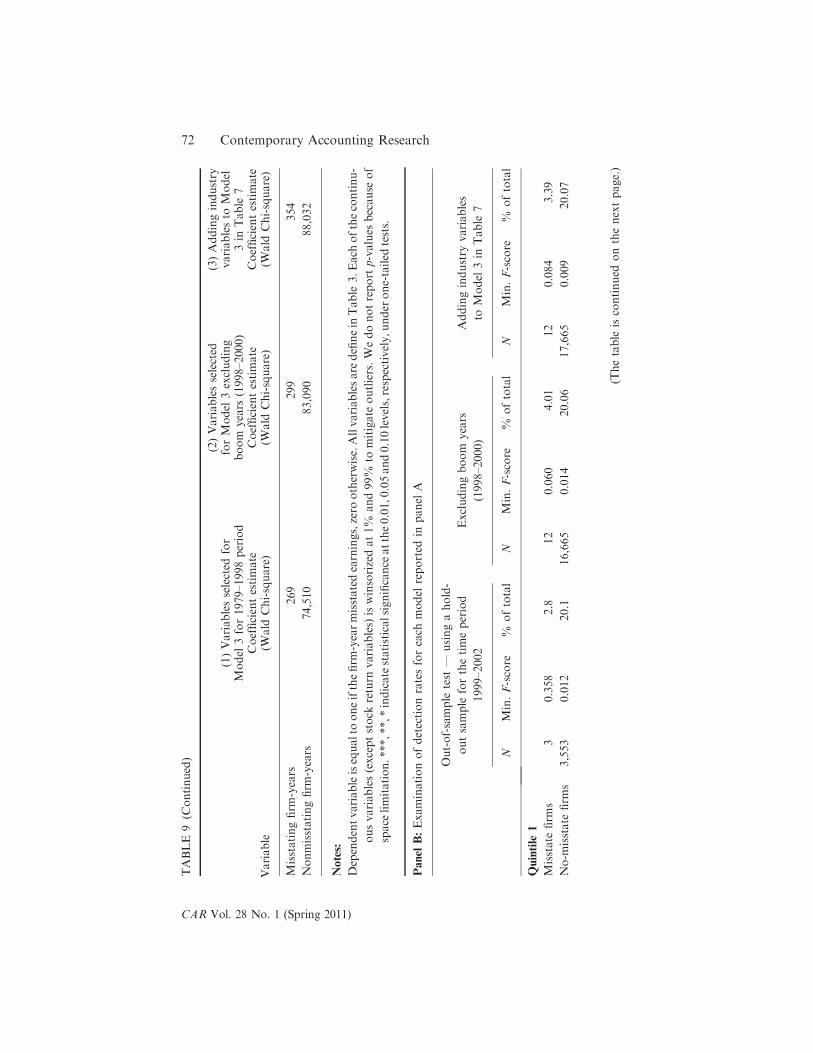
TABLE
9(C
ontinued)
Variable
(1)Variablesselected
for
Model
3for1979–1998period
Coefficientestimate
(Wald
Chi-square)
(2)Variablesselected
forModel
3excluding
boom
years
(1998–2000)
Coefficientestimate
(Wald
Chi-square)
(3)Addingindustry
variablesto
Model
3in
Table
7Coefficientestimate
(Wald
Chi-square)
Misstatingfirm
-years
269
299
354
Nonmisstatingfirm
-years
74,510
83,090
88,032
Notes:
Dependentvariableisequalto
oneifthefirm
-yearmisstatedearnings,zero
otherwise.Allvariablesare
definein
Table
3.Each
ofthecontinu-
ousvariables(exceptstock
return
variables)
iswinsorizedat1%
and99%
tomitigate
outliers.Wedonotreport
p-values
because
of
space
limitation.***,**,*indicatestatisticalsignificance
atthe0.01,0.05and0.10levels,respectively,under
one-tailed
tests.
Panel
B:Examinationofdetectionratesforeach
model
reported
inpanel
A
Out-of-sample
test
—usingahold-
outsample
forthetimeperiod
1999–2002
Excludingboom
years
(1998–2000)
Addingindustry
variables
toModel
3in
Table
7
NMin.F-score
%oftotal
NMin.F-score
%oftotal
NMin.F-score
%oftotal
Quintile
1
Misstate
firm
s3
0.358
2.8
12
0.060
4.01
12
0.084
3.39
No-m
isstate
firm
s3,553
0.012
20.1
16,665
0.014
20.06
17,665
0.009
20.07
(Thetable
iscontinued
onthenextpage.)
72 Contemporary Accounting Research
CAR Vol. 28 No. 1 (Spring 2011)
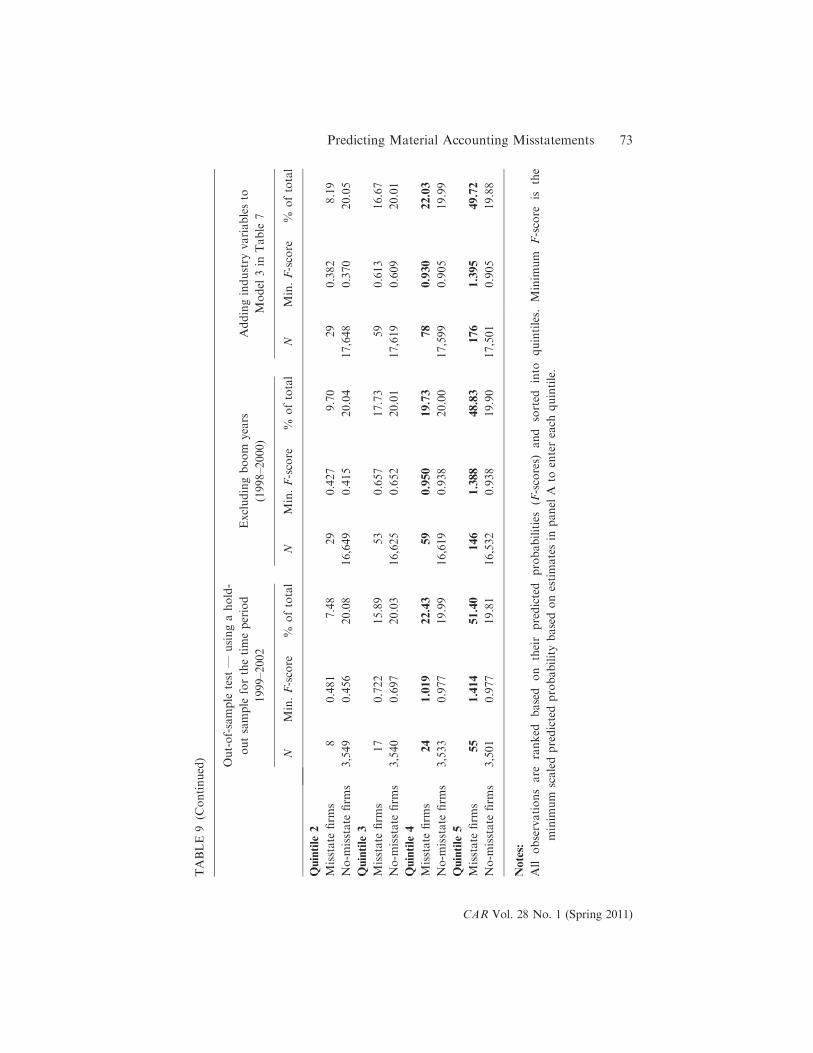
TABLE9
(Continued) Out-of-sample
test
—usingahold-
outsample
forthetimeperiod
1999–2002
Excludingboom
years
(1998–2000)
Addingindustry
variablesto
Model
3in
Table
7
NMin.F-score
%oftotal
NMin.F-score
%oftotal
NMin.F-score
%oftotal
Quintile
2
Misstate
firm
s8
0.481
7.48
29
0.427
9.70
29
0.382
8.19
No-m
isstate
firm
s3,549
0.456
20.08
16,649
0.415
20.04
17,648
0.370
20.05
Quintile
3
Misstate
firm
s17
0.722
15.89
53
0.657
17.73
59
0.613
16.67
No-m
isstate
firm
s3,540
0.697
20.03
16,625
0.652
20.01
17,619
0.609
20.01
Quintile
4
Misstate
firm
s24
1.019
22.43
59
0.950
19.73
78
0.930
22.03
No-m
isstate
firm
s3,533
0.977
19.99
16,619
0.938
20.00
17,599
0.905
19.99
Quintile
5
Misstate
firm
s55
1.414
51.40
146
1.388
48.83
176
1.395
49.72
No-m
isstate
firm
s3,501
0.977
19.81
16,532
0.938
19.90
17,501
0.905
19.88
Notes:
All
observationsare
ranked
based
on
theirpredicted
probabilities(F-scores)
and
sorted
into
quintiles.
Minim
um
F-score
isthe
minim
um
scaledpredictedprobabilitybasedonestimatesin
panel
Ato
entereach
quintile.
Predicting Material Accounting Misstatements 73
CAR Vol. 28 No. 1 (Spring 2011)
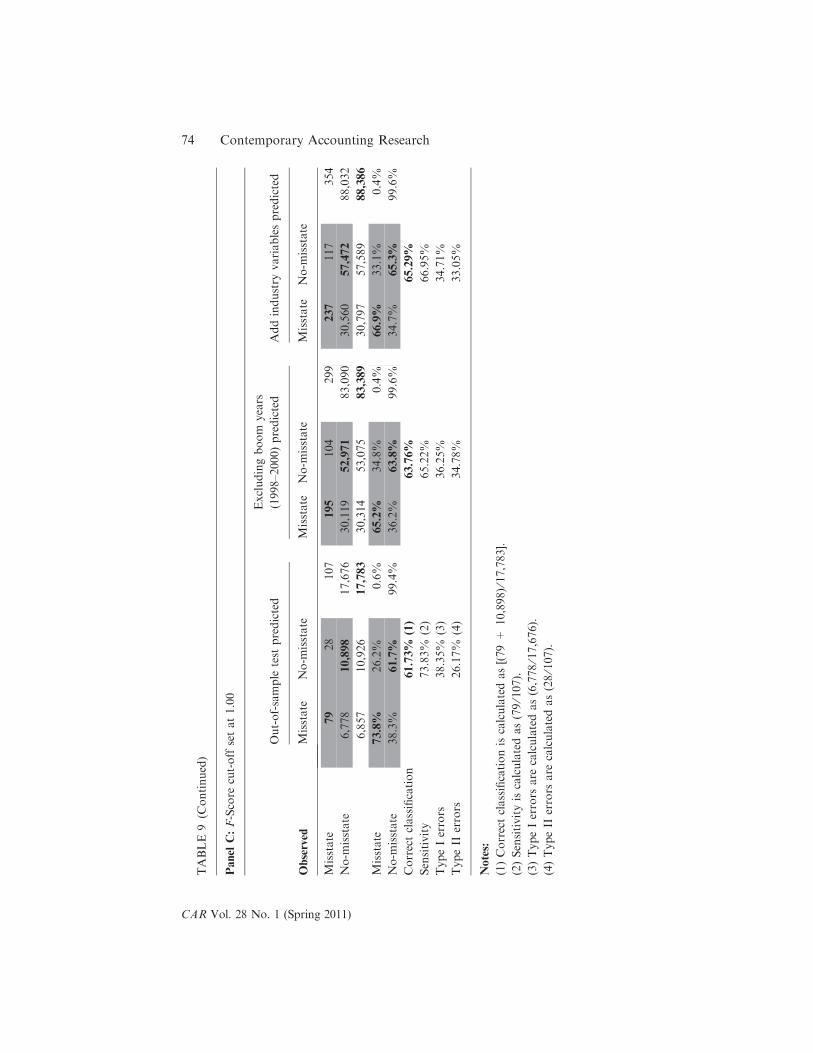
TABLE
9(C
ontinued)
Panel
C:F-Score
cut-offsetat1.00
Observed
Out-of-sample
test
predicted
Excludingboom
years
(1998–2000)predicted
Addindustry
variablespredicted
Misstate
No-m
isstate
Misstate
No-m
isstate
Misstate
No-m
isstate
Misstate
79
28
107
195
104
299
237
117
354
No-m
isstate
6,778
10,898
17,676
30,119
52,971
83,090
30,560
57,472
88,032
6,857
10,926
17,783
30,314
53,075
83,389
30,797
57,589
88,386
Misstate
73.8%
26.2%
0.6%
65.2%
34.8%
0.4%
66.9%
33.1%
0.4%
No-m
isstate
38.3%
61.7%
99.4%
36.2%
63.8%
99.6%
34.7%
65.3%
99.6%
Correctclassification
61.73%
(1)
63.76%
65.29%
Sensitivity
73.83%
(2)
65.22%
66.95%
TypeIerrors
38.35%
(3)
36.25%
34.71%
TypeII
errors
26.17%
(4)
34.78%
33.05%
Notes:
(1)Correctclassificationiscalculatedas[(79+
10,898)⁄17,783].
(2)Sensitivityiscalculatedas(79⁄107).
(3)TypeIerrors
are
calculatedas(6,778⁄17,676).
(4)TypeII
errors
are
calculatedas(28⁄107).
74 Contemporary Accounting Research
CAR Vol. 28 No. 1 (Spring 2011)
We first investigate the sensitivity of our models to the time period
examined. In Table 7 we develop our prediction model and evaluate its
effectiveness using the same sample. Therefore, the models suffer from a
hindsight bias and could overrepresent our predictive ability. To evaluate
the importance of this concern, we test the sensitivity of variable selection
by estimating models using the backward elimination technique during the
1979 to 1998 time period. We follow a similar procedure of first including
only financial statement variables, then adding off-balance-sheet variables
to Model 2 and market-related variables to Model 3. We find that all and
only the original variables load in Model 1 in the earlier time period.
However, for Model 2, we find that abnormal change in employees no
longer loads, and for Model 3, book-to-market loads, but market-adjusted
return does not. We report the results for 1979–1998 Model 3 in Table 9,
panel A, column 1. We use the new estimates from this model to predict
the F-scores for a holdout sample of firm-years from 1999 to 2002. We
rank the holdout sample firms into quintiles and report the frequency and
mean probabilities for misstating and nonmisstating firms by quintiles. The
results are reported in Table 9, panel B. Compared to the results in
Table 7, panel B for Model 3, the model shows a slight improvement in
the percentage of misstating firms classified in quintile 5 (51.4 percent ver-
sus 48.02 percent in Table 7). However, generally the model does not
appear to be too time specific.13
Another concern is that the Internet boom years (1998 to 2000) repre-
sent a large proportion of misstatements and so could unduly affect variable
selection. We therefore rerun our backward elimination technique for our
models excluding these years. The results are reported in column 2 of
Table 9. We find that abnormal change in employees no longer loads, while
book-to-market loads. In panels B and C we find similar results to those
13. We also conduct a rolling-window out-of-sample test. For Model 1 (financial statement
variables), starting in 1990, we conducted backward elimination using all available data
up until that point beginning with the significant variables from Table 6. Then we used
the model to select variables and estimate coefficients. Using the results, we applied the
model to the following year’s data. We then did this for every year (the last year is esti-
mated using the data through 2001 and applying this to 2002). The variables selected
are quite consistent over time. For the 12 years, the variables differ from the model in
Table 7 as follows: 1990 – RSST accruals and change in inventory are excluded while
WC accruals is included; 1991 – RSST accruals and change in return on assests are
excluded; 1992 – identical variables; 1993 – identical variables; and 1994 – change in
inventory is excluded while WC accruals is included; 1995 – change in inventory is
excluded; 1996 – change in inventory is excluded while WC accruals is included; 1997–
2001 – identical variables. Out of 12 years, the model is identical for seven years. The
changes in other years primarily involve substituting working capital accruals for total
accruals or the elimination of inventory. This should not be surprising as the three
variables are highly correlated. An analysis of the predicted out of sample F-scores for
misstatement and nonmisstatement firms shows results similar to the out of sample
results presented in Table 9.
Predicting Material Accounting Misstatements 75
CAR Vol. 28 No. 1 (Spring 2011)
reported in Table 7. Therefore, the models do not appear to be overly sensi-
tive to Internet firms and their specific accounting problems.
A final concern is related to the undue impact of certain industries.
Table 2, panel B documents that the computer, retail, and service industries
appear to be overrepresented in the population of misstating firms. In addi-
tion, because leasing is used extensively in retail, another concern is that our
leasing results could be due to the overrepresentation of retail firms in our
sample. Further, we find that % soft assets is an important influencing vari-
able, and this is likely to vary with industry composition and be higher in com-
puter and service industries.14 Therefore, our next test investigates whether
our models are unduly influenced by these industries and the existence of oper-
ating leases. We create industry dummies and an interactive dummy (retail ·
existence of operating leases) and add these variables to the estimation of
Model 3 in Table 7. The results in Table 9, panel A, column 3 indicate that
the coefficient on % soft assets declines slightly from 2.265 in Table 7 to 2.214
in Table 9 but remains highly statistically significant. In addition, the coeffi-
cients on the service industry and the computer industry are significant.
Table 9, panel B indicates that the number of firms classified in quintile 5 is
176, which is only six more firms than the number (170) in Table 7, panel B.
In addition, using a cutoff F-score of 1.00, we find that the number of cor-
rectly classified misstatement firms is similar in Table 9 (237 firm-years) and
Table 7 (238 firm-years). Overall, the model does not appear to be unduly dri-
ven by characteristics of the computer, retail, or service industries.
5. Conclusion
This paper provides a comprehensive sample of firms investigated by the
SEC for misstating earnings. We conduct a detailed analysis of 2,190
AAERs available between 1982 and 2005 and identify firms with misstated
quarterly or annual earnings. We document the most common types of mis-
statements and find that the overstatement of revenues, misstatement of
expenses, and capitalizing costs are the most frequent types of misstate-
ments. We also identify the industries and time periods in which misstate-
ments are most common.
We investigate the characteristics of misstating firms on various
dimensions, including accrual quality, financial performance, nonfinancial
14. % soft assets is likely to vary by industry because the need for ‘‘soft’’ versus ‘‘hard’’
assets such as PP&E varies with output technologies. The average % soft assets is the
following for each industry: Textile and Apparel 0.687; Retail 0.594; Durable Manufac-
turers 0.589; Computers 0.56; Lumber, Furniture, & Printing 0.551; Chemicals 0.543;
Food & Tobacco 0.537; Services 0.503; Agriculture 0.466; Pharmaceuticals 0.46; Mining
& Construction 0.453; Transportation 0.385; Utilities 0.277; Refining & Extractive
0.243. Note that in Table 5, each firm acts as its own control and we find significantly
higher % soft assets in manipulation years relative to earlier years. This suggests that
industry effects are not the only determinant of the higher soft asset ratio for AAER
firms.
76 Contemporary Accounting Research
CAR Vol. 28 No. 1 (Spring 2011)
performance, off-balance-sheet activities, and market-related variables. We
find that at the time of misstatements, accrual quality is low and both finan-
cial and nonfinancial measures of performance are deteriorating. We also
find that financing activities and related off-balance-sheet activities are
much more likely during misstatement periods. Finally, we find that manag-
ers of misstating firms appear to be sensitive to their firm’s stock price.
These firms have experienced strong recent earnings and price performance
and trade at high valuations relative to fundamentals. The misstatements
appear to be made with the objective of covering up a slowdown in finan-
cial performance in order to maintain high stock market valuations.
Many accounting researchers use measures of ‘‘discretionary accruals’’
as their proxy for earnings management. Our paper contributes to this line
of research by showing that financial statement information beyond accruals
is useful for identifying earnings manipulation. Our composite measure of
the likelihood of manipulation (F-score) offers researchers a complementary
and supplementary measure to discretionary accruals for identifying low-
quality-earnings firms. In addition, our paper shows that the modified Jones
model tends to have less power than unadjusted measures of accruals (such
as working capital accrual or RSST accruals) to identify misstatement years.
We also find that growth in cash sales is unusually high during misstate-
ment years. An important avenue for future research is to better understand
the role of real transaction or cash-flow management.
We emphasize that one unavoidable issue in developing models to
detect misstatement is that the revelation of a misstatement by the SEC is a
rare event. Thus, similar to bankruptcy prediction models, our models gen-
erate a high frequency of false positives (i.e., many firms that do not have
enforcement actions against them are predicted to have misstated their earn-
ings). Another limitation of our analysis is that we can identify only mis-
statements that were actually identified by the SEC. There are likely many
cases where a misstatement goes undetected or is at least not subject to an
SEC enforcement action. An interesting avenue for future research would
be to investigate the characteristics of high-F-score firms that are not identi-
fied by the SEC. For example, do high-F-score firms engage in earnings
management within the realm of GAAP? Do they experience declines in
subsequent financial performance? Are they more likely to record future
asset write-offs or write-downs? In addition, can models be improved by
considering corporate governance arrangements, top executive characteris-
tics, or industry-specific characteristics?
Finally, our analysis should provide useful insights to auditors, regula-
tors, investors, and other financial statement users about the characteristics
of misstating firms. By better understanding these characteristics, financial
statement users should be in a better position to identify and curtail
misstatement activity in the future. The efficient functioning of capital mar-
kets depends crucially on the quality of the financial information provided
to capital market participants. Curtailing misstatement activity should lead
Predicting Material Accounting Misstatements 77
CAR Vol. 28 No. 1 (Spring 2011)
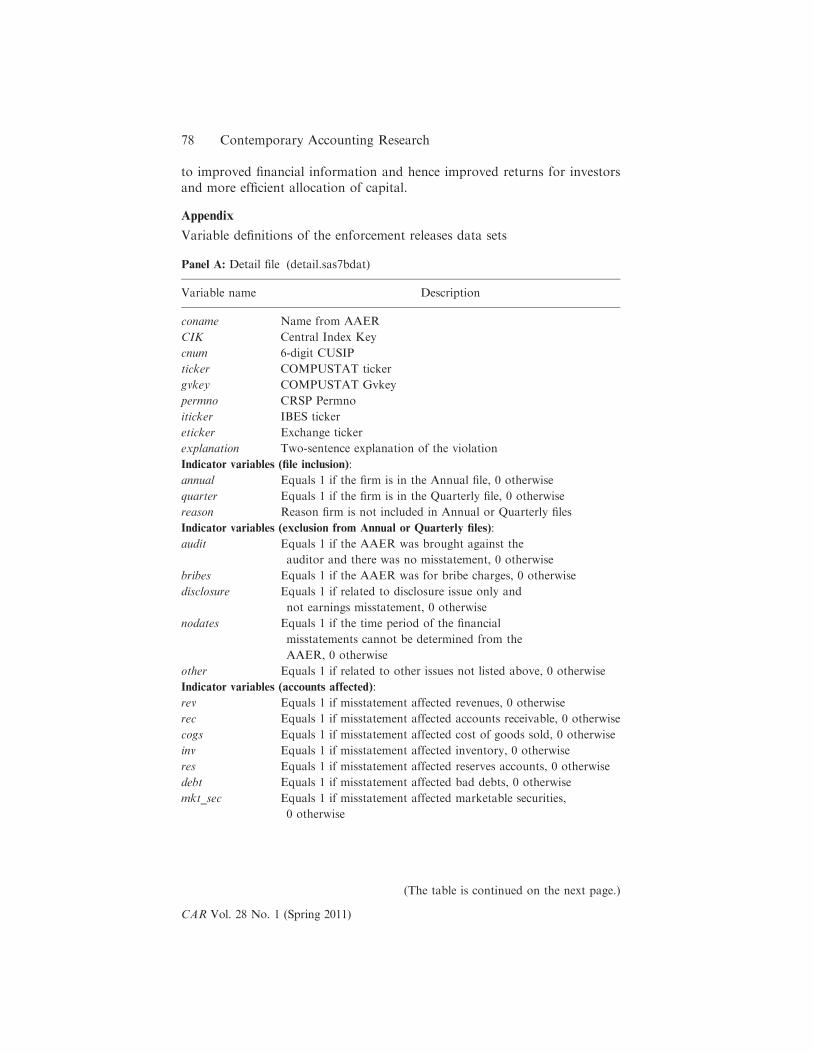
to improved financial information and hence improved returns for investors
and more efficient allocation of capital.
Appendix
Variable definitions of the enforcement releases data sets
Panel A: Detail file (detail.sas7bdat)
Variable name Description
coname Name from AAER
CIK Central Index Key
cnum 6-digit CUSIP
ticker COMPUSTAT ticker
gvkey COMPUSTAT Gvkey
permno CRSP Permno
iticker IBES ticker
eticker Exchange ticker
explanation Two-sentence explanation of the violation
Indicator variables (file inclusion):
annual Equals 1 if the firm is in the Annual file, 0 otherwise
quarter Equals 1 if the firm is in the Quarterly file, 0 otherwise
reason Reason firm is not included in Annual or Quarterly files
Indicator variables (exclusion from Annual or Quarterly files):
audit Equals 1 if the AAER was brought against the
auditor and there was no misstatement, 0 otherwise
bribes Equals 1 if the AAER was for bribe charges, 0 otherwise
disclosure Equals 1 if related to disclosure issue only and
not earnings misstatement, 0 otherwise
nodates Equals 1 if the time period of the financial
misstatements cannot be determined from the
AAER, 0 otherwise
other Equals 1 if related to other issues not listed above, 0 otherwise
Indicator variables (accounts affected):
rev Equals 1 if misstatement affected revenues, 0 otherwise
rec Equals 1 if misstatement affected accounts receivable, 0 otherwise
cogs Equals 1 if misstatement affected cost of goods sold, 0 otherwise
inv Equals 1 if misstatement affected inventory, 0 otherwise
res Equals 1 if misstatement affected reserves accounts, 0 otherwise
debt Equals 1 if misstatement affected bad debts, 0 otherwise
mkt_sec Equals 1 if misstatement affected marketable securities,
0 otherwise
(The table is continued on the next page.)
78 Contemporary Accounting Research
CAR Vol. 28 No. 1 (Spring 2011)
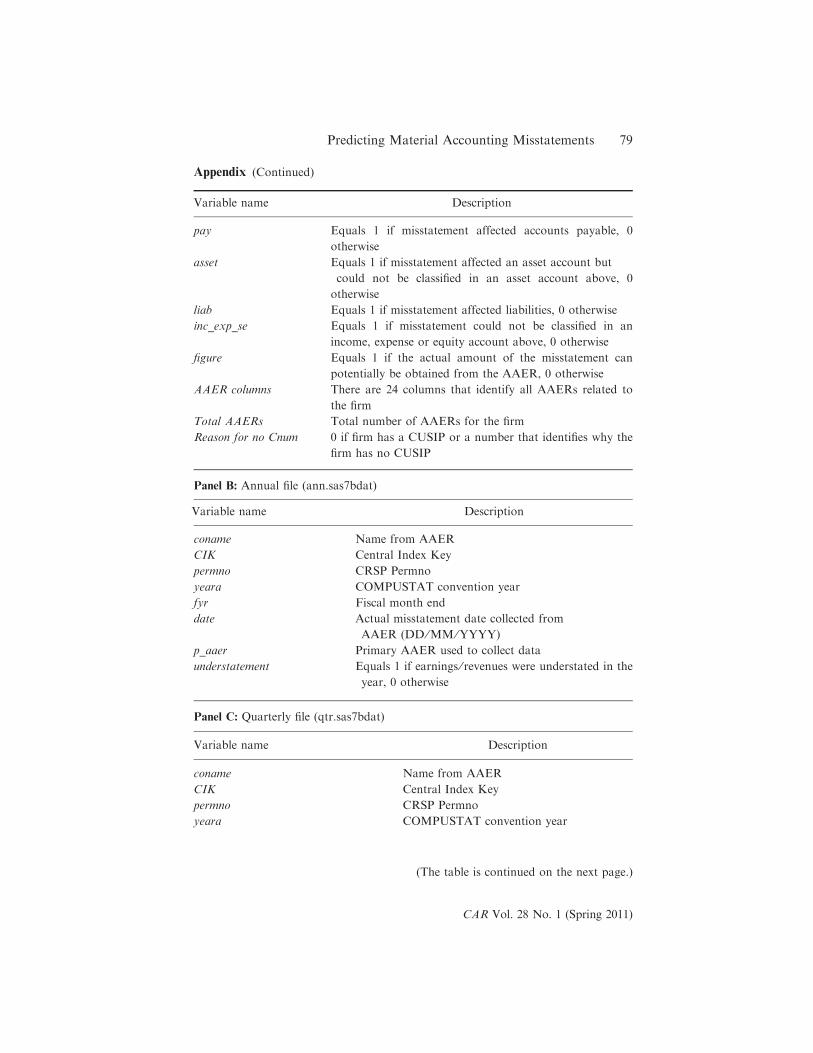
Appendix (Continued)
Variable name Description
pay Equals 1 if misstatement affected accounts payable, 0
otherwise
asset Equals 1 if misstatement affected an asset account but
could not be classified in an asset account above, 0
otherwise
liab Equals 1 if misstatement affected liabilities, 0 otherwise
inc_exp_se Equals 1 if misstatement could not be classified in an
income, expense or equity account above, 0 otherwise
figure Equals 1 if the actual amount of the misstatement can
potentially be obtained from the AAER, 0 otherwise
AAER columns There are 24 columns that identify all AAERs related to
the firm
Total AAERs Total number of AAERs for the firm
Reason for no Cnum 0 if firm has a CUSIP or a number that identifies why the
firm has no CUSIP
Panel B: Annual file (ann.sas7bdat)
Variable name Description
coname Name from AAER
CIK Central Index Key
permno CRSP Permno
yeara COMPUSTAT convention year
fyr Fiscal month end
date Actual misstatement date collected from
AAER (DD ⁄MM ⁄YYYY)
p_aaer Primary AAER used to collect data
understatement Equals 1 if earnings ⁄ revenues were understated in the
year, 0 otherwise
Panel C: Quarterly file (qtr.sas7bdat)
Variable name Description
coname Name from AAER
CIK Central Index Key
permno CRSP Permno
yeara COMPUSTAT convention year
(The table is continued on the next page.)
Predicting Material Accounting Misstatements 79
CAR Vol. 28 No. 1 (Spring 2011)

Appendix (Continued)
Variable name Description
fyr Fiscal month end
qtr Quarter (1, 2, 3 or 4)
date Actual date collected from AAER (DD ⁄MM ⁄YYYY)
p_aaer Primary AAER used to collect data
understatement Equals 1 if earnings ⁄ revenues were understated
in the quarter, 0 otherwise
References
Allen, E., C. Larson, and R. Sloan. 2009. Accrual reversals, earnings and stock
returns. Working paper, Washington University in St. Louis.
Barton, J., and P. Simko. 2002. The balance sheet as an earnings management
constraint. The Accounting Review 77 (Supplement): 1–27.
Bayley, L., and S. Taylor. 2007. Identifying earnings overstatements: A practical
test. Working paper, ABN Amro Sydney and University of New South Wales.
Beasley, M. 1996. An empirical analysis of the relation between the board of director
composition and financial statement fraud. The Accounting Review 71 (4): 443–65.
Beneish, M. D. 1997. Detecting GAAP violations: Implications for assessing
earnings management among firms with extreme financial performance.
Journal of Accounting and Public Policy 16 (3): 271–309.
Beneish, M. D. 1998. Discussion of ‘‘Are accruals during initial public offerings
opportunistic?’’ Review of Accounting Studies 3 (1–2): 209–21.
Beneish, M. D. 1999a. The detection of earnings manipulation. Financial Analysts
Journal 55 (5): 24–36.
Beneish, M. D. 1999b. Incentives and penalties related to earnings overstatements
that violate GAAP. The Accounting Review 74 (4): 425–57.
Brazel, J. F., K. L. Jones, and M. F. Zimbelman. 2009. Using nonfinancial measures
to assess fraud risk. Journal of Accounting Research 47 (5): 1135–66.
Comprix, J., and K. A. Mueller, III. 2006. Asymmetric treatment of reported
pension expense and income amounts in CEO cash compensation calculations.
Journal of Accounting and Economics 42 (3): 385–416.
Dechow, P. M., and I. Dichev. 2002. The quality of accruals and earnings: The role of
accrual estimation errors. The Accounting Review 77 (Supplement): 35–59.
Dechow, P. M., W. Ge, and C. Schrand. 2010. Understanding earnings quality.
Journal of Accounting and Economics. Forthcoming.
Dechow, P. M., R. G. Sloan, and A. P. Sweeney. 1995. Detecting earnings
management. The Accounting Review 70 (2): 193–226.
Dechow, P. M., R. G. Sloan, and A. P. Sweeney. 1996. Causes and consequences of
earnings misstatement: An analysis of firms subject to enforcement actions by
the SEC. Contemporary Accounting Research 13 (1): 1–36.
80 Contemporary Accounting Research
CAR Vol. 28 No. 1 (Spring 2011)
DeFond, M. L., and J. Jiambalvo. 1994. Debt covenant violation and misstatement
of accruals. Journal of Accounting and Economics 17 (1): 145–76.
Erickson, M., M. Hanlon, and E. L. Maydew. 2004. How much will firms pay for
earnings that do not exist? Evidence of taxes paid on allegedly fraudulent
earnings. The Accounting Review 79 (2): 387–408.
Ettredge, M., L. Sun, P. Lee, and A. Anandarajan. 2006. Do deferred tax data
signal earnings fraud? Working paper, University of Kansas School of Business.
Farber, D. 2005. Restoring trust after fraud: Does corporate governance matter?
The Accounting Review 80 (2): 539–61.
Feroz, E., K. Park, and V. Pastena. 1991. The financial and market effects of the
SEC’s accounting and auditing enforcement releases. Journal of Accounting
Research 29 (Supplement): 107–42.
Frankel, R. M., M. F. Johnson, and K. K. Nelson. 2002. The relation between
auditors’ fees for no audit services and earnings management. The Accounting
Review 77 (Supplement): 71–103.
Ge, W. 2007. Off-balance-sheet activities, earnings persistence and stock
prices: Evidence from operating leases. Working paper, University of
Washington.
Graham, J., C. Harvey, and S. Rajgopal. 2005. The economic implications of
corporate financial reporting. Journal of Accounting and Economics 40 (1–3):
3–73.
Healy, P. 1985. The effect of bonus schemes on accounting decisions. Journal of
Accounting and Economics 7 (1): 85–107.
Karpoff, J., S. Lee, and G. Martin. 2008. The cost to firms of cooking the books.
Journal of Financial and Quantitative Analysis 43 (3): 581–611.
Kothari, S. P., A. Leone, and C. Wasley. 2005. Performance-matched discretionary
accrual measures. Journal of Accounting and Economics 39 (1): 163–97.
Lawless, J. F., and K. Singhal. 1978. Efficient screening of nonnormal regression
models. Biometrics 34 (2): 318–27.
Miller, G. S. 2006. The press as a watchdog for accounting fraud. Journal of
Accounting Research 44 (5): 1001–33.
Phillips, J., M. Pincus, and S. Ohloft-Rego. 2003. Earnings management: New
evidence based on deferred tax expense. The Accounting Review 78 (2):
491–521.
Plumlee, M., and T. L. Yohn. 2010. An analysis of the underlying causes attributed
to restatements. The Accounting Review 24 (1): 41–64.
Rajgopal, S., T. Shevlin, and M. Venkatachalam. 2003. Does the stock
market fully appreciate the implications of leading indicators for future
earnings? Evidence from order backlog. Review of Accounting Studies 8 (4):
461–92.
Rangan, S. 1998. Earnings management and the performance of seasoned equity
offerings. Journal of Financial Economics 50 (1): 101–22.
Richardson, S., R. Sloan, M. Soliman, and I. Tuna. 2005. Accrual reliability,
earnings persistence, and stock prices. Journal of Accounting and Economics 39
(3): 437–85.
Predicting Material Accounting Misstatements 81
CAR Vol. 28 No. 1 (Spring 2011)
Skinner, D. J., and R. G. Sloan. 2002. Earnings surprises, growth expectations, and
stock returns or don’t let an earnings torpedo sink your portfolio. Review of
Accounting Studies 7 (2–3): 289–312.
Skousen, C. J., and C. J. Wright. 2006. Contemporaneous risk factors and the
prediction of financial statement fraud. Working paper, University of Texas at
Arlington.
Teoh, S. H., I. Welch, and T. J. Wong. 1998. Earnings management and the
underperformance of seasoned equity offerings. Journal of Financial Economics
50 (1): 63–99.
82 Contemporary Accounting Research
CAR Vol. 28 No. 1 (Spring 2011)