Predicting expression patterns from regulatory sequence in Drosophila segmentation
7
ARTICLES Predicting expression patterns from regulatory sequence in Drosophila segmentation Eran Segal 1 *, Tali Raveh-Sadka 1 *, Mark Schroeder 2 , Ulrich Unnerstall 2 & Ulrike Gaul 2 The establishment of complex expression patterns at precise times and locations is key to metazoan development, yet a mechanistic understanding of the underlying transcription control networks is still missing. Here we describe a novel thermodynamic model that computes expression patterns as a function of cis-regulatory sequence and of the binding-site preferences and expression of participating transcription factors. We apply this model to the segmentation gene network of Drosophila melanogaster and find that it predicts expression patterns of cis-regulatory modules with remarkable accuracy, demonstrating that positional information is encoded in the regulatory sequence and input factor distribution. Our analysis reveals that both strong and weaker binding sites contribute, leading to high occupancy of the module DNA, and conferring robustness against mutation; short-range homotypic clustering of weaker sites facilitates cooperative binding, which is necessary to sharpen the patterns. Our computational framework is generally applicable to most protein–DNA interaction systems. Precise spatio-temporal control of gene expression lies at the heart of metazoan development. The necessary instructions are encoded in cis- regulatory elements, or modules, which typically contain multiple binding sites for multiple transcription factors 1 . When bound, tran- scription factors promote or inhibit expression of the neighbouring gene, with the net expression outcome determined by how all factor effects integrate. The binding of factors depends on their affinity to the binding sites, but also on their expression levels; because these vary spatially and temporally, the constellation of bound factors on the module sequence and the resulting expression level will vary accord- ingly. Thus, understanding the rules by which modules ‘compute’ expression from the input factor expression is key to understanding transcriptional processes in general and pattern formation in particular. Genetic, molecular and biochemical studies, more recently comple- mented by ChIP-chip 2 and by computational approaches exploiting site clustering 3–5 , conservation 6 or co-regulation detected by DNA micro- arrays 7 , have collectively identified many of the genes, modules and binding sites involved in key developmental processes. To unravel the logic by which these components interact, various types of logical 8 , probabilistic 7,9 , thermodynamic 10–12 , and reaction–diffusion models 13–15 have been constructed, providing interesting insights. However, these methods do not explicitly model transcription factor binding to regu- latory sequence, or do so on a limited scale 10,12,16 . Thus, a quantitative mechanistic description of the transcriptional control events that lie at the core of developmental pattern formation is still missing. Here we present a new computational framework that models the entire process of transcriptional regulation, from the expression of the input factors to their binding to cis-regulatory sequence and the module expression patterns resulting from these binding events. The model is based on physical properties and takes into account binding competition between factors, cooperative binding interactions, and contributions from weak binding sites. We apply our framework to the well-characterized segmentation gene network of the early Drosophila embryo, which consists of a four-tiered hierarchy of maternal and zygotic factors that define the antero-posterior body axis in a stepwise refinement of expression patterns 17–20 . The maternal factors form gradients spanning the entire antero-posterior axis; they are translated into broad, non-periodic domains of zygotic gap gene expression and subsequently into periodic patterns of seven ‘pair rule’ and finally fourteen segmental stripes that prefigure the four- teen segments of the larva. Regulation within this network is highly combinatorial and, in the top tiers, almost entirely transcriptional. Thermodynamic model of transcription control Our model takes as input expression levels and DNA-binding specifi- cities for a set of transcription factors, and predicts the expression level that any arbitrary DNA sequence will give rise to when receiving input from these factors (Fig. 1). The model has two main components: one that computes the occupancy distribution of factors on a given target DNA sequence, and another that translates this occupancy distribution into a level of expression. To account for differing input factor concen- trations, these computations are performed separately for every position along the spatio-temporal axis of interest, here the antero-posterior axis. In the first model component, we consider all possible configura- tions of factor molecules on the sequence; by not allowing overlap between two molecules in any one configuration, we model the com- petition between factors that results from their steric hindrance constraints (Fig. 1, and Supplementary Fig. 1). The probability of a configuration is computed from the local concentration of the participating factors and the strength of the binding sites they occupy in the configuration, as measured by the position specific scoring matrix (PSSM) score 21 . We do not use predetermined thresholds for defining factor-binding sites, allowing both weak and strong fac- tor binding to contribute, and we model self-cooperativity between two factor molecules bound to neighbouring sites, assuming that this effect decays with the distance between the sites. The second model *These authors contributed equally to this work. 1 Department of Computer Science and Applied Mathematics, Weizmann Institute of Science, Rehovot 76100, Israel. 2 Laboratory of Developmental Neurogenetics, Rockefeller University, New York, New York 10065, USA. Vol 451 | 31 January 2008 | doi:10.1038/nature06496 535 Nature Publishing Group ©2008
Transcript of Predicting expression patterns from regulatory sequence in Drosophila segmentation

ARTICLES
Predicting expression patternsfrom regulatory sequence inDrosophila segmentationEran Segal1*, Tali Raveh-Sadka1*, Mark Schroeder2, Ulrich Unnerstall2 & Ulrike Gaul2
The establishment of complex expression patterns at precise times and locations is key to metazoan development, yet amechanistic understanding of the underlying transcription control networks is still missing. Here we describe a novelthermodynamic model that computes expression patterns as a function of cis-regulatory sequence and of the binding-sitepreferences and expression of participating transcription factors. We apply this model to the segmentation gene network ofDrosophila melanogaster and find that it predicts expression patterns of cis-regulatory modules with remarkable accuracy,demonstrating that positional information is encoded in the regulatory sequence and input factor distribution. Our analysisreveals that both strong and weaker binding sites contribute, leading to high occupancy of the module DNA, and conferringrobustness against mutation; short-range homotypic clustering of weaker sites facilitates cooperative binding, which is necessaryto sharpen the patterns. Our computational framework is generally applicable to most protein–DNA interaction systems.
Precise spatio-temporal control of gene expression lies at the heart ofmetazoan development. The necessary instructions are encoded in cis-regulatory elements, or modules, which typically contain multiplebinding sites for multiple transcription factors1. When bound, tran-scription factors promote or inhibit expression of the neighbouringgene, with the net expression outcome determined by how all factoreffects integrate. The binding of factors depends on their affinity to thebinding sites, but also on their expression levels; because these varyspatially and temporally, the constellation of bound factors on themodule sequence and the resulting expression level will vary accord-ingly. Thus, understanding the rules by which modules ‘compute’expression from the input factor expression is key to understandingtranscriptional processes in general and pattern formation in particular.
Genetic, molecular and biochemical studies, more recently comple-mented by ChIP-chip2 and by computational approaches exploiting siteclustering3–5, conservation6 or co-regulation detected by DNA micro-arrays7, have collectively identified many of the genes, modules andbinding sites involved in key developmental processes. To unravel thelogic by which these components interact, various types of logical8,probabilistic7,9, thermodynamic10–12, and reaction–diffusion models13–15
have been constructed, providing interesting insights. However, thesemethods do not explicitly model transcription factor binding to regu-latory sequence, or do so on a limited scale10,12,16. Thus, a quantitativemechanistic description of the transcriptional control events that lie atthe core of developmental pattern formation is still missing.
Here we present a new computational framework that models theentire process of transcriptional regulation, from the expression ofthe input factors to their binding to cis-regulatory sequence and themodule expression patterns resulting from these binding events. Themodel is based on physical properties and takes into account bindingcompetition between factors, cooperative binding interactions, andcontributions from weak binding sites. We apply our frameworkto the well-characterized segmentation gene network of the early
Drosophila embryo, which consists of a four-tiered hierarchy ofmaternal and zygotic factors that define the antero-posterior bodyaxis in a stepwise refinement of expression patterns17–20. The maternalfactors form gradients spanning the entire antero-posterior axis; theyare translated into broad, non-periodic domains of zygotic gap geneexpression and subsequently into periodic patterns of seven ‘pairrule’ and finally fourteen segmental stripes that prefigure the four-teen segments of the larva. Regulation within this network is highlycombinatorial and, in the top tiers, almost entirely transcriptional.
Thermodynamic model of transcription control
Our model takes as input expression levels and DNA-binding specifi-cities for a set of transcription factors, and predicts the expression levelthat any arbitrary DNA sequence will give rise to when receiving inputfrom these factors (Fig. 1). The model has two main components: onethat computes the occupancy distribution of factors on a given targetDNA sequence, and another that translates this occupancy distributioninto a level of expression. To account for differing input factor concen-trations, these computations are performed separately for every positionalong the spatio-temporal axis of interest, here the antero-posterior axis.
In the first model component, we consider all possible configura-tions of factor molecules on the sequence; by not allowing overlapbetween two molecules in any one configuration, we model the com-petition between factors that results from their steric hindranceconstraints (Fig. 1, and Supplementary Fig. 1). The probability ofa configuration is computed from the local concentration of theparticipating factors and the strength of the binding sites they occupyin the configuration, as measured by the position specific scoringmatrix (PSSM) score21. We do not use predetermined thresholdsfor defining factor-binding sites, allowing both weak and strong fac-tor binding to contribute, and we model self-cooperativity betweentwo factor molecules bound to neighbouring sites, assuming that thiseffect decays with the distance between the sites. The second model
*These authors contributed equally to this work.
1Department of Computer Science and Applied Mathematics, Weizmann Institute of Science, Rehovot 76100, Israel. 2Laboratory of Developmental Neurogenetics, RockefellerUniversity, New York, New York 10065, USA.
Vol 451 | 31 January 2008 | doi:10.1038/nature06496
535Nature Publishing Group©2008

component translates each configuration into its resulting expressionlevel. We assume that each bound factor molecule contributes inde-pendently to the expression outcome, with activator molecules con-tributing positively and repressor molecules contributing negatively.We use the logistic function to translate these contributions intoexpression because it has the desired saturation properties wherebymaximal or minimal transcription is achieved beyond a certain num-ber of bound activator and repressor molecules, respectively. Thefinal expression outcome of a sequence is then the sum of the expres-sion contributions of each configuration, weighted by their probabi-lity (see Supplementary Information).
The model has three free parameters for each transcription factor,representing values that are typically unknown: (1) the absolute con-centration of the factor in vivo; (2) the transcription rate resultingfrom its interactions with the basal machinery; and (3) the strength ofbinding cooperativity for the factor. In addition, we parameterize thePSSMs representing the factors’ binding preferences because they aretypically based on a limited number of footprinted binding sites, butwe constrain PSSM learning to maintain the measured consensus(see Methods). We devised a learning algorithm that fits the modelparameters to minimize the error between the measured and model-predicted expression for a set of input modules. This model-fittingtask is complex because it requires traversing the uncomputablylarge number of possible factor configurations on the sequence,and calculating the expression contribution of each such configura-tion. To approximate this computation, we devised a sampling-basedalgorithm, guaranteed to converge to the correct computation as thenumber of samples increases.
Modelling pattern formation in segmentation
To apply our model to the segmentation network, we used as inputthe spatial expression patterns22 for eight key transcription factors,that is, Bicoid (BCD), Hunchback (HB), Caudal (CAD), Kruppel(KR), Giant (GT), Torso-response element (TorRE), Knirps (KNI),Tailless (TLL), and their binding-site preferences5,23. We asked themodel to predict the spatial expression of 44 gap and pair-rule genemodules with known patterns, collated from literature and from ourown work5. We modelled the input–output relationship for onedevelopmental time point, using a time at which both the input factor
patterns and the output module expression patterns are mature(mid-blastoderm; approximately 20 min into cell cycle 14).
The expression patterns predicted by a model trained on these dataexhibit good or fair agreement with the measured patterns for mostmodules (Fig. 2a). The parameters behave in a biologically plausiblefashion: fitted values typically differ by less than an order of mag-nitude between the different factors, and the trained PSSMs showonly small changes from their original settings (Fig. 3a, andSupplementary Fig. 2). The expression of gap gene modules is gene-rally predicted very well, suggesting that our model has adequatelycaptured their input and rules. In contrast, prediction of pair-rulegene modules is more mixed, with failures resulting from missingactivation (modules receiving little maternal activator input), oroccasionally from ectopic expression that is due to missing repres-sion, mostly in the head region of the embryo (Supplementary Fig. 3).Because our model includes only self-cooperative interaction, we alsofail to predict the module generating even-skipped (eve) stripe 2(eve_2), which is known to require positive synergy between BCDand HB24. Overall, the failures of our model are as instructive as itssuccesses—they suggest that some input factors and some higherinteraction rules are not captured, but also that the model does notartificially compensate for these missing features.
Model validation
A critical test for our model is whether it can predict the expressionpatterns of modules that were not used as input when fitting theparameters. We used two such sets of held-out modules: 11 recentlypublished anterior modules4, and 15 segmentation modules fromthe related species D. pseudoobscura, which we identified and testedin a separate study (S. Sinha et al., manuscript in preparation). Theexpression of D. pseudoobscura modules was measured using trans-genic reporter constructs in D. melanogaster, such that all observedeffects were attributable to module sequence. While producing onlymild to moderate changes in expression, the D. pseudoobscuramodules show substantial sequence turnover compared to theirD. melanogaster orthologues (average sequence identity 49%; Sup-plementary Fig. 4) and thus represent a profound cis perturbation.For both test sets, our model, using the parameters trained on theoriginal 44 modules, predicts expression with mostly good or fair
CADTarget gene
+
+
= 0.26ModuleKNI
1w + 4w = –3
4w + 1w = -3
4w + 3w = 1
… … … …
…TAAATACTTGGCAATACTCTAGGAATTTTCTAGACTTTACCTACTGGCTAAATCGAAG…
AP position 35
0.0018
0.0071
0.0012
tuptuO
upnIt
Th
reydo
mgnilledo
m ciman
CAD
HB
KNI
Binding preferences
0 %EL100 80 60 40 20
(No HB binding)
Transcript
AP position 35
E x P(c)Configurations (c) Expression (E)P(c)
Binding site
CAD
w = 1 w = –1
0 200 400 600 bp
AP position (% EL)
Configurations offactor binding toDNA and resultingexpression
Binding energyalong modulesequence, for agiven AP position
Module sequence Input factor distribution
Fit parameters tomaximize agreementbetween measuredand predicted patterns
Factor occupancyover all AP positions
Predicted module expression
Measured module expression
0.002 x 0.0018
0.953 x 0.0071
0.269 x 0.0012
Figure 1 | Overview of the thermodynamicmodel and approach. Flow diagram showinginput, output and the main steps of thecomputational framework, for a simplifiedversion of the eve_4_6 module with threetranscription factor inputs. The computation isshown for one particular position along theantero-posterior (AP) axis, measured aspercentage of egg length (%EL). At each antero-posterior position, the factor concentrations (toppanels) define a binding energy landscape for allfactors across the module sequence, which is thentranslated into a factor occupancy distribution(middle panel). Each factor configuration, c,results in a particular expression level, E,represented as a fraction of the maximalachievable transcription rate and calculated fromthe number of transcription factors bound in theconfiguration and the factor-specific expressioncontribution parameters wtf , using the logisticfunction. The overall resulting expressionoutcome at each position (bottom panel) is thencomputed as the sum of the expressioncontribution of each configuration, weighted bytheir probability P(c). For a detailed descriptionsee main text and Supplementary Information.
ARTICLES NATURE | Vol 451 | 31 January 2008
536Nature Publishing Group©2008
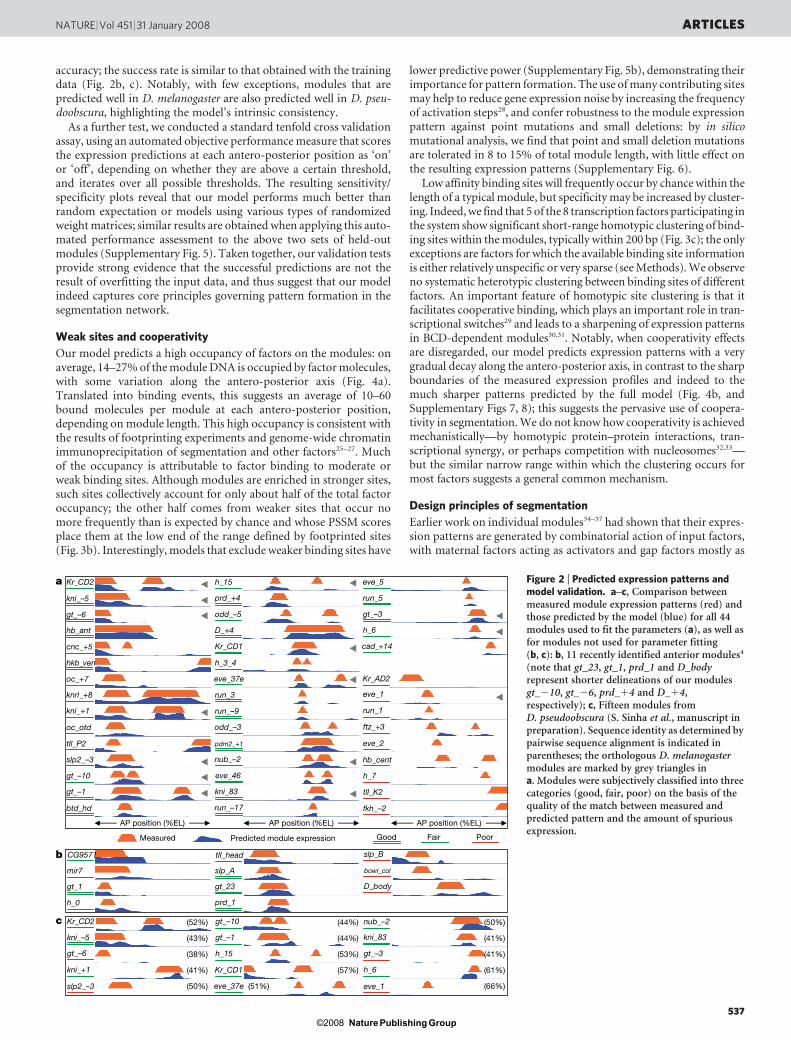
accuracy; the success rate is similar to that obtained with the trainingdata (Fig. 2b, c). Notably, with few exceptions, modules that arepredicted well in D. melanogaster are also predicted well in D. pseu-doobscura, highlighting the model’s intrinsic consistency.
As a further test, we conducted a standard tenfold cross validationassay, using an automated objective performance measure that scoresthe expression predictions at each antero-posterior position as ‘on’or ‘off’, depending on whether they are above a certain threshold,and iterates over all possible thresholds. The resulting sensitivity/specificity plots reveal that our model performs much better thanrandom expectation or models using various types of randomizedweight matrices; similar results are obtained when applying this auto-mated performance assessment to the above two sets of held-outmodules (Supplementary Fig. 5). Taken together, our validation testsprovide strong evidence that the successful predictions are not theresult of overfitting the input data, and thus suggest that our modelindeed captures core principles governing pattern formation in thesegmentation network.
Weak sites and cooperativity
Our model predicts a high occupancy of factors on the modules: onaverage, 14–27% of the module DNA is occupied by factor molecules,with some variation along the antero-posterior axis (Fig. 4a).Translated into binding events, this suggests an average of 10–60bound molecules per module at each antero-posterior position,depending on module length. This high occupancy is consistent withthe results of footprinting experiments and genome-wide chromatinimmunoprecipitation of segmentation and other factors25–27. Muchof the occupancy is attributable to factor binding to moderate orweak binding sites. Although modules are enriched in stronger sites,such sites collectively account for only about half of the total factoroccupancy; the other half comes from weaker sites that occur nomore frequently than is expected by chance and whose PSSM scoresplace them at the low end of the range defined by footprinted sites(Fig. 3b). Interestingly, models that exclude weaker binding sites have
lower predictive power (Supplementary Fig. 5b), demonstrating theirimportance for pattern formation. The use of many contributing sitesmay help to reduce gene expression noise by increasing the frequencyof activation steps28, and confer robustness to the module expressionpattern against point mutations and small deletions: by in silicomutational analysis, we find that point and small deletion mutationsare tolerated in 8 to 15% of total module length, with little effect onthe resulting expression patterns (Supplementary Fig. 6).
Low affinity binding sites will frequently occur by chance within thelength of a typical module, but specificity may be increased by cluster-ing. Indeed, we find that 5 of the 8 transcription factors participating inthe system show significant short-range homotypic clustering of bind-ing sites within the modules, typically within 200 bp (Fig. 3c); the onlyexceptions are factors for which the available binding site informationis either relatively unspecific or very sparse (see Methods). We observeno systematic heterotypic clustering between binding sites of differentfactors. An important feature of homotypic site clustering is that itfacilitates cooperative binding, which plays an important role in tran-scriptional switches29 and leads to a sharpening of expression patternsin BCD-dependent modules30,31. Notably, when cooperativity effectsare disregarded, our model predicts expression patterns with a verygradual decay along the antero-posterior axis, in contrast to the sharpboundaries of the measured expression profiles and indeed to themuch sharper patterns predicted by the full model (Fig. 4b, andSupplementary Figs 7, 8); this suggests the pervasive use of coopera-tivity in segmentation. We do not know how cooperativity is achievedmechanistically—by homotypic protein–protein interactions, tran-scriptional synergy, or perhaps competition with nucleosomes32,33—but the similar narrow range within which the clustering occurs formost factors suggests a general common mechanism.
Design principles of segmentation
Earlier work on individual modules34–37 had shown that their expres-sion patterns are generated by combinatorial action of input factors,with maternal factors acting as activators and gap factors mostly as
a
PoorFairGoodPredicted Measured module expression
Kr_CD2
gt_–6
kni_–5
hb_ant
oc_+7
kni_+1
oc_otd
tll_P2
gt_–10
gt_–1
cnc_+5
hkb_ven
slp2_–3
knrl_+8
btd_hd
Kr_CD1
D_+4
h_3_4
eve_37e
run_3
odd_–5
prd_+4
h_15
AP position (%EL) AP position (%EL) AP position (%EL)
cad_+14
h_6
eve_5
odd_–3
nub_–2
gt_–3
run_5
run_–9
kni_83
run_–17
eve_46
pdm2_+1
Kr_AD2
hb_cent
eve_2
eve_1
run_1
ftz_+3
tll_K2
fkh_–2
h_7
b
kni_+1
slp2_–3
kni_–5
gt_–6
Kr_CD2 gt_–10
gt_–1
h_15
Kr_CD1
eve_37e
nub_–2
kni_83
gt_–3
h_6
eve_1
gt_1
h_0
CG9571
mir7
prd_1
gt_23
tll_head
slp_A
D_body
bowl_col
slp_B
c (52%)
(43%)
(38%)
(41%)
(50%)
(44%)
(44%)
(53%)
(57%)
(51%)
(50%)
(41%)
(41%)
(61%)
(66%)
Figure 2 | Predicted expression patterns andmodel validation. a–c, Comparison betweenmeasured module expression patterns (red) andthose predicted by the model (blue) for all 44modules used to fit the parameters (a), as well asfor modules not used for parameter fitting(b, c): b, 11 recently identified anterior modules4
(note that gt_23, gt_1, prd_1 and D_bodyrepresent shorter delineations of our modulesgt_210, gt_26, prd_14 and D_14,respectively); c, Fifteen modules fromD. pseudoobscura (S. Sinha et al., manuscript inpreparation). Sequence identity as determined bypairwise sequence alignment is indicated inparentheses; the orthologous D. melanogastermodules are marked by grey triangles ina. Modules were subjectively classified into threecategories (good, fair, poor) on the basis of thequality of the match between measured andpredicted pattern and the amount of spuriousexpression.
NATURE | Vol 451 | 31 January 2008 ARTICLES
537Nature Publishing Group©2008

repressors. The results of our modelling support these generalnotions, but argue against other previously suggested design princi-ples. Our model classifies the maternal factors BCD, CAD and TorREas activators, and the zygotic gap factors (HB, GT, KR, KNI, TLL) asrepressors (Fig. 3a), suggesting that context-dependent function,which had been proposed for some gap factors24,35,38–40, is not neces-sary to account for most expression patterns. The maternal activatorsshow higher total occupancy in modules that are expressed and loweroccupancy in modules that are not expressed in the same region asthey are, indicating that their prevalent mode of action is indeedactivation; the zygotic factors show the converse behaviour(Fig. 3d). Interestingly, both activators and repressors show signifi-cant binding in ‘inappropriate’ modules, albeit at lower levels, sug-gesting that module design is not entirely parsimonious.
When we examine how the expression patterns of individual mod-ules are generated, we find that all modules are highly combinatorialin design and generally contain one or two types of activating inputand multiple repressive inputs, with preference for co-extensive acti-vator(s) and against co-extensive repressors: modules typicallyreceive activation from the activator most appropriate for theirregion, with some choice in the middle (BCD/CAD) and at the ter-mini (BCD/TorRE or CAD/TorRE) of the embryo; the choice ofactivator(s) entails the choice of appropriate repressors. An illustra-tive example for these design features is the differential factor occu-pancy in the modules generating the two main expression domains of
the gap gene gt (Fig. 5, and Supplementary Figs 9, 10). Modulesgenerally disfavour but do not exclude sites for co-extensivelyexpressed repressors; sites for the cognate factor, however, are veryrare: of the 11 modules driving the expression of the primary gap genedomains, only 3 have significant input by the factor itself (gt_26,Kr_CD2, tll_K2) (Supplementary Fig. 10). This argues against a sig-nificant role for direct auto-regulation of gap factors in the pattern-ing, which had figured prominently in several theoretical models15,41.
Interestingly, we find no (positive) correlation between thestrength of BCD input and the posterior border of target moduleexpression (Fig. 4c). This finding suggests that the number/quality ofBCD-binding sites in the target modules is not the sole determinantof position in the anterior portion of the embryo as envisaged by thegradient–affinity model of BCD action42,43; rather, module expres-sion boundaries seem to be determined as much by repressive gapgene input as by attenuation of maternal activation4.
We find little overlap between the binding preferences of the dif-ferent input factors, and as noted above, no heterotypic clustering.This suggests that the different factors bind to the DNA largely inde-pendently and that sequence-specific competition or occlusion,which had been proposed as a mechanism of repressor action35,44,45,does not play a major role. The one exception is the strong overlapin binding preferences between HB and CAD (Fig. 4d, andSupplementary Fig. 11), which is in fact exploited in the design ofmany posterior modules: because the two factors have opposing
0.0
0.1
0.2
1
2
3
–11 –7 –3 1 5 9 13 17
–11 –7 –3 1 5 9 13 17
–11 –7 –3 1 5 9 13 19
–11 –7 –3 1 5 9 13 17
0.1
0.2
0.3
0.0 1
2
3
4
kcabhcnuH
lep purK
Site-to-site distances (bp)
Fraction of:a b c d
diociB
Original
Trained
Permuted sites
True sites
P < 0.01
Site freq. vs random
known sites
Coop.5.73
Expr.1.85
Conc.0.003
laduaC
binding sitestotal occupancy
Binding site strength
Coop.4.45
Expr.–0.22
Conc.0.004
Coop.4.20
Expr.1.04
Conc.0.001
Coop.6.22
Expr.–0.05
Conc.0.008
1
00
6
4
2
0
1
0
12
8
4
0
Factorexpression
AP position (%EL)
expressed modulesnon-expressed modules
Avg. factoroccupancy in:
1
0
108
4
0
6
2
1
0
20
15
10
0
5
0.1
0.2
0.0 0
10
20
1
2
3
0.1
0.2
0.3
0.0
0
2
4
6
8
0 200 400 600 800 100 75 50 25
0100 75 50 25
0100 75 50 25
0100 75 50 25
0 200 400 600 800
0 200 400 600 800
0 200 400 600 800
0
5
10
15
20
0
10152025
5
0
2345
1
Figure 3 | Participating transcription factors and their behaviour. a, PSSMsrepresenting binding preferences before (upper panels) and after (lowerpanels) training and other parameters (absolute factor concentration,expression contribution and self-cooperativity) as fitted by our model, forfour key transcription factors regulating segmentation (see SupplementaryFig. 2 for all eight factors). b, Binding-site strength and contribution tooccupancy. For each factor, histograms show as a function of site strength:the number of binding sites (expressed as fraction of all sites, light bluecolumns, left scale), and the fraction of the total factor occupancycontributed by sites of this strength (orange columns, left scale). Binding-site strength is defined as the log-ratio between the PSSM and backgroundmodel score of the site21, using a uniform background. Over-/under-representation of sites in modules (grey line, right scale) is calculated as theratio of the number of sites of a given strength in the actual module sequence
versus the number of such sites in randomly permuted module sequence(shown is mean 6 s.d. computed from 100 permutations). The strength ofexperimentally footprinted sites is represented by dark blue squares belowthe histogram. c, Short-range homotypic clustering of binding sites. Shownis the number of pairwise distances between same-factor sites that are withina range of k to k 1 50 bp, plotted for values of k from 0 to 800 (y axis) andexpressed as average per module (blue line), compared to results of 1,000permutation tests in which the predicted sites are randomly placed withineach module (grey line, mean 6 s.d.). d, For each factor, shown is themeasured endogenous expression (black), compared with the averagepredicted total factor occupancy in modules expressed at a given antero-posterior position (blue), and with average predicted total occupancy inmodules not expressed at that position (pink); note differing behaviour ofactivators and repressors.
ARTICLES NATURE | Vol 451 | 31 January 2008
538Nature Publishing Group©2008

expression patterns and functions, a broad abdominal pattern can begenerated through differential occupation of overlapping CAD/HBsites along the antero-posterior axis by one or the other factor, withCAD causing activation in the posterior portion of the embryo andHB causing repression in the anterior and near the posterior ter-minal. Additional repressive input then further narrows moduleexpression boundaries, as seen, for example, in gt_23 (Fig. 5, andSupplementary Fig. 10).
The central biological task of the segmentation gene network is tosubdivide the embryo along the antero-posterior axis by translatingbroad maternal gradients into successively narrower and sharperpatterns. Our analysis suggests that this is accomplished by parallelcombinatorial input of multiple factors and self-cooperative factorinteraction. It is intriguing that these crucial design features areembedded locally within the cis-regulatory sequence rather than inthe trans-factor network and the basal machinery, which presumablyincreases the reliability of the readout and the ability of the system toevolve.
Conclusions
We have presented a quantitative model for transcription control inpattern formation that integrates sequence and expression informa-tion and seeks to capture the mechanistic core of the process. Inputfactors bind DNA at thermodynamic equilibrium, dependent onlyon their concentration and on the arrangement and quality of theirsites within the modules, but without introducing thresholds or otherfilters. By applying the model to the segmentation network ofDrosophila, we demonstrate that these principles, in conjunction withuniform and biologically plausible parameters for the unknownaspects of the molecular interactions, are sufficient to produce thepatterns of most experimentally validated modules with substantial
accuracy, even across species. A notable feature of our approach isthat the network structure between factors and their target genes isnot pre-defined; rather, we assume a fully connected network inwhich all possible factor–module interactions are considered andthe network structure is an emergent property of the molecular cis-regulatory interactions, changing dynamically with the variation inlocal factor concentrations. Our framework is generally applicableand likely to prove useful for many other protein–DNA interactionsystems. Several important issues need to be addressed to improvefurther the predictive accuracy of our model, such as integrating thetemporal evolution of expression patterns, modelling heterotypicsynergy (BCD/HB) or other non-additive factor interactions (forexample, repressor quenching), identifying missing input factors,and incorporating competition with nucleosomes. The model willalso greatly benefit from additional experimentation to constrainparameter values, such as measuring factor cooperativity andimproving the PSSMs.
METHODS SUMMARY
Spatial expression patterns and measured binding preferences for eight tran-
scription factors in the segmentation network were obtained from published
sources5,22; for selected factors, the functionality of the consensus sites was con-
firmed by insertion into a synthetic enhancer46. Expression patterns for seg-
mentation gene modules were collected from published sources4,5 or our own
work and measured as described5. The full mathematical details and fitting
procedures of our model are described in the Supplementary Information.
The significance of local clustering of binding sites was assessed by calculating
b
No coop.
Coop.
AP position (%EL)
Module expression
Occupancy
Measured module expr.
BCD distribution
Sequence position
BCD binding energyhb_ant
c
100 80 60 40 20 0 Posterior border of expr. (%EL)
0
2
4
6
8
10 BCDd
Hunchback
Known sites: BCDKnown sites: HB
10
–60 –40 –20 200
r = 0.03
0–10–20–30–40–50–60
r = 0.31
Hunchback
Cau
dal
Bic
oid
Known sites: CADKnown sites: HB
–60 –40 –20 200
10
0
–10
–20
–30
–40
AP position (%EL)100 80 60 40 20 0
0.30
0.25
0.20
0.15
0.10
aO
ccup
ied
bas
e p
airs
(%)
Bic
oid
aff
inity
Figure 4 | Cooperative DNA binding and binding site overlap. a, Fraction ofmodule sequence (mean 6 s.d.) that is occupied by factors at each antero-posterior position, averaged across all modules. b, Effects of modelling self-cooperativity for the hb_ant module: with cooperative binding permitted,graded BCD input is translated into a much sharper pattern of BCDoccupancy and predicted module expression. c, Strength of BCD inputshows no (positive) correlation with the posterior boundary of moduleexpression. For each module, the position of its measured posteriorexpression boundary (x axis) is plotted against the maximum predicted totaloccupancy of BCD along any antero-posterior position (‘Bicoid affinity’,y axis); BCD protein distribution is shown as a purple curve. d, Scatterplotsvisualizing the correlation between the binding-site strengths (presented asthe log-ratio between the PSSM and background model score) with whichtwo factors bind to each position in the concatenated sequence of allmodules. HB and CAD show significant overlap in their binding preferences,whereas HB and BCD do not; see also Supplementary Fig. 11. The knownbinding sites for the two factors, from which the PSSMs were derived, arehighlighted.
tna_bh2p _llt
01– _tg
1 –_tg6_4_eve
3–_tg
Measured Predicted
BCD
HB KNIKR TLLGT
Activatoroccupancy
Expression
Repressoroccupancy
100
Gap genes(repressors)
Pair-rule genes
Maternal genes(activators)
0
GT KR KNI TLLHB
75 50 25
CADBCD TorRE
AP position (% EL)
AP position (%EL)
a
b
Kr_
CD
1
CAD TorRE
Inp
ut fa
ctor
dis
trib
utio
n
Figure 5 | Regulatory input and expression of segmentation modules.a, Distribution of the eight participating transcription factors along theantero-posterior axis, with maternal factors (activators) and gap factors(repressors) plotted separately, and schematic depiction of the globalarchitecture of the segmentation network. b, Graphs show the occupanciesof the participating transcription factors at every position along the antero-posterior axis for selected modules, thus indicating which factors controlexpression at a particular position. Occupancy curves are colour-coded byfactor; the curves for activators (middle) and repressors (bottom) aresuperimposed and plotted separately; the resulting predicted expressionlevel (grey) is shown on top, superimposed on measured expression level(orange); see also Supplementary Fig. 10.
NATURE | Vol 451 | 31 January 2008 ARTICLES
539Nature Publishing Group©2008

the number of all pairwise distances between sites for the factor(s) consideredthat fall within moving windows of 50 bp, and comparing this to the results
obtained when the same number of binding sites are randomly placed within
each module. The occupancy of a factor at a base pair and antero-posterior
position is defined as the sum of the probabilities of all configurations in which
the base is occupied by the factor; the total occupancy contribution of a binding
site is then the sum of its occupancy across all antero-posterior positions, and the
fractional occupancy contribution of a binding site is equal to its total occupancy
divided by the total occupancy of all binding sites for the factor. For input data
and results, see our website http://genie.weizmann.ac.il/pubs/segnet08.
Full Methods and any associated references are available in the online version ofthe paper at www.nature.com/nature.
Received 2 August; accepted 20 November 2007.Published online 2 January 2008.
1. Jackle, H. et al. Transcriptional control by Drosophila gap genes. J. Cell Sci. (suppl.)16, 39–51 (1992).
2. Ren, B. et al. Genome-wide location and function of DNA binding proteins. Science290, 2306–2309 (2000).
3. Berman, B. P. et al. Computational identification of developmental enhancers:conservation and function of transcription factor binding-site clusters inDrosophila melanogaster and Drosophila pseudoobscura. Genome Biol. 5, R61(2004).
4. Ochoa-Espinosa, A. et al. The role of binding site cluster strength in Bicoid-dependent patterning in Drosophila. Proc. Natl Acad. Sci. USA 102, 4960–4965(2005).
5. Schroeder, M. D. et al. Transcriptional control in the segmentation gene networkof Drosophila. PLoS Biol. 2, E271 (2004).
6. Xie, X. et al. Systematic discovery of regulatory motifs in human promoters and 39
UTRs by comparison of several mammals. Nature 434, 338–345 (2005).7. Tavazoie, S., Hughes, J. D., Campbell, M. J., Cho, R. J. & Church, G. M. Systematic
determination of genetic network architecture. Nature Genet. 22, 281–285 (1999).8. Albert, R. & Othmer, H. G. The topology of the regulatory interactions predicts the
expression pattern of the segment polarity genes in Drosophila melanogaster.J. Theor. Biol. 223, 1–18 (2003).
9. Segal, E. et al. Module networks: identifying regulatory modules and theircondition-specific regulators from gene expression data. Nature Genet. 34,166–176 (2003).
10. Granek, J. A. & Clarke, N. D. Explicit equilibrium modeling of transcription-factorbinding and gene regulation. Genome Biol. 6, R87 (2005).
11. Bintu, L. et al. Transcriptional regulation by the numbers: models. Curr. Opin.Genet. Dev. 15, 116–124 (2005).
12. Zinzen, R. P., Senger, K., Levine, M. & Papatsenko, D. Computational models forneurogenic gene expression in the Drosophila embryo. Curr. Biol. 16, 1358–1365(2006).
13. von Dassow, G., Meir, E., Munro, E. M. & Odell, G. M. The segment polaritynetwork is a robust developmental module. Nature 406, 188–192 (2000).
14. Eldar, A. et al. Robustness of the BMP morphogen gradient in Drosophilaembryonic patterning. Nature 419, 304–308 (2002).
15. Jaeger, J. et al. Dynamic control of positional information in the early Drosophilaembryo. Nature 430, 368–371 (2004).
16. Janssens, H. et al. Quantitative and predictive model of transcriptional control ofthe Drosophila melanogaster even skipped gene. Nature Genet. 38, 1159–1165(2006).
17. Nasiadka, A., Dietrich, B. H. & Krause, H. M. in Advances in Developmental Biologyand Biochemistry: Regulation of Gene Expression at the Beginning of Development (ed.DePamphilis, M.) 155–204 (2002).
18. Rivera-Pomar, R. & Jackle, H. From gradients to stripes in Drosophilaembryogenesis: filling in the gaps. Trends Genet. 12, 478–483 (1996).
19. Furriols, M. & Casanova, J. In and out of Torso RTK signalling. EMBO J. 22,1947–1952 (2003).
20. St Johnston, D. & Nusslein-Volhard, C. The origin of pattern and polarity in theDrosophila embryo. Cell 68, 201–219 (1992).
21. Stormo, G. D. & Hartzell, G. W. III. Identifying protein-binding sites from unalignedDNA fragments. Proc. Natl Acad. Sci. USA 86, 1183–1187 (1989).
22. Myasnikova, E., Samsonova, A., Kozlov, K., Samsonova, M. & Reinitz, J.Registration of the expression patterns of Drosophila segmentation genes by twoindependent methods. Bioinformatics 17, 3–12 (2001).
23. Rajewsky, N., Vergassola, M., Gaul, U. & Siggia, E. D. Computational detection ofgenomic cis-regulatory modules applied to body patterning in the early Drosophilaembryo. BMC Bioinformatics 3, 30 (2002).
24. Simpson-Brose, M., Treisman, J. & Desplan, C. Synergy between the hunchbackand bicoid morphogens is required for anterior patterning in Drosophila. Cell 78,855–865 (1994).
25. Tanay, A. Extensive low-affinity transcriptional interactions in the yeast genome.Genome Res. 16, 962–972 (2006).
26. Carr, A. & Biggin, M. D. A comparison of in vivo and in vitro DNA-bindingspecificities suggests a new model for homeoprotein DNA binding in Drosophilaembryos. EMBO J. 18, 1598–1608 (1999).
27. Biggin, M. D. & Tjian, R. Transcriptional regulation in Drosophila: the post-genomechallenge. Funct. Integr. Genomics 1, 223–234 (2001).
28. Raser, J. M. & O’Shea, E. K. Control of stochasticity in eukaryotic gene expression.Science 304, 1811–1814 (2004).
29. Ptashne, M. & Gann, A. Genes and Signals 26–37 (Cold Spring Harbor LaboratoryPress, Cold Spring Harbor, 2002).
30. Crauk, O. & Dostatni, N. Bicoid determines sharp and precise target geneexpression in the Drosophila embryo. Curr. Biol. 15, 1888–1898 (2005).
31. Lebrecht, D. et al. Bicoid cooperative DNA binding is critical for embryonicpatterning in Drosophila. Proc. Natl Acad. Sci. USA 102, 13176–13181 (2005).
32. Segal, E. et al. A genomic code for nucleosome positioning. Nature 442, 772–778(2006).
33. Vashee, S., Melcher, K., Ding, W. V., Johnston, S. A. & Kodadek, T. Evidence fortwo modes of cooperative DNA binding in vivo that do not involve directprotein–protein interactions. Curr. Biol. 8, 452–458 (1998).
34. Hoch, M., Seifert, E. & Jackle, H. Gene expression mediated by cis-actingsequences of the Kruppel gene in response to the Drosophila morphogens bicoidand hunchback. EMBO J. 10, 2267–2278 (1991).
35. Small, S., Kraut, R., Hoey, T., Warrior, R. & Levine, M. Transcriptional regulation ofa pair-rule stripe in Drosophila. Genes Dev. 5, 827–839 (1991).
36. Rivera-Pomar, R., Lu, X., Perrimon, N., Taubert, H. & Jackle, H. Activation ofposterior gap gene expression in the Drosophila blastoderm. Nature 376, 253–256(1995).
37. Arnosti, D. N., Barolo, S., Levine, M. & Small, S. The eve stripe 2 enhanceremploys multiple modes of transcriptional synergy. Development 122, 205–214(1996).
38. Sauer, F. & Jackle, H. Heterodimeric Drosophila gap gene protein complexes actingas transcriptional repressors. EMBO J. 14, 4773–4780 (1995).
39. La Rosee, A., Hader, T., Taubert, H., Rivera-Pomar, R. & Jackle, H. Mechanism andBicoid-dependent control of hairy stripe 7 expression in the posterior region of theDrosophila embryo. EMBO J. 16, 4403–4411 (1997).
40. Langeland, J. A., Attai, S. F., Vorwerk, K. & Carroll, S. B. Positioning adjacent pair-rule stripes in the posterior Drosophila embryo. Development 120, 2945–2955(1994).
41. Meinhardt, H. Hierarchical inductions of cell states: a model for segmentation inDrosophila. J. Cell Sci. (Suppl.) 4, 357–381 (1986).
42. Driever, W. & Nusslein-Volhard, C. The bicoid protein determines position in theDrosophila embryo in a concentration-dependent manner. Cell 54, 95–104(1988).
43. Ephrussi, A. & St Johnston, D. Seeing is believing: the bicoid morphogen gradientmatures. Cell 116, 143–152 (2004).
44. Hoch, M., Gerwin, N., Taubert, H. & Jackle, H. Competition for overlappingsites in the regulatory region of the Drosophila gene Kruppel. Science 256, 94–97(1992).
45. Stanojevic, D., Small, S. & Levine, M. Regulation of a segmentation stripe byoverlapping activators and repressors in the Drosophila embryo. Science 254,1385–1387 (1991).
46. Sutrias-Grau, M. & Arnosti, D. N. CtBP contributes quantitatively to Knirpsrepression activity in an NAD binding-dependent manner. Mol. Cell. Biol. 24,5953–5966 (2004).
Supplementary Information is linked to the online version of the paper atwww.nature.com/nature.
Acknowledgements We thank D. Leaman and M. Dandapani for the in vivo analysisof binding sites and are indebted to E. Siggia, S. Sinha and J. Widom for valuablediscussions at the outset of the project. This work was supported by a Fellowshipfrom the Center for Studies in Physics and Biology at Rockefeller University (E.S.),by the European Network of Excellence (E.S. and T.R.-S.), by a RockefellerUniversity Graduate Fellowship (M.S.) and by an NIH grant (U.G.); E.S. is theincumbent of the Soretta and Henry Shapiro career development chair.
Author Information Reprints and permissions information is available atwww.nature.com/reprints. Correspondence and requests for materials should beaddressed to E.S. ([email protected]) or U.G. ([email protected]).
ARTICLES NATURE | Vol 451 | 31 January 2008
540Nature Publishing Group©2008

METHODSData sets. Spatial expression patterns for eight transcription factors in the net-
work were obtained from ref. 22, and measured binding sites for these factors
were obtained from ref. 5. Sequences and expression patterns for 44 gap and pair-
rule gene modules are from ref. 5, S. Sinha et al., manuscript in preparation, and
M.S and U.G., unpublished, and are available at our website (see below). Module
expression patterns were measured as described5. Binding-site information is
available for all eight transcription factors5, but varies considerably in extent and
quality, with two factors, KNI and TLL, having fairly unspecific PSSMs, and
TorRE an overly specific one, owing to the paucity of known binding sites(Supplementary Fig. 2a). Despite such differences, the consensus sequences for
BCD, HB, GT, KR47 and KNI48 show excellent in vivo binding when placed in
synthetic modules (Supplementary Fig. 12) and can thus be considered reliable.
We therefore constrained our procedure for fitting the factor weight matrices
such that they maintain the experimentally derived consensus.
Thermodynamic model. The full mathematical details and fitting procedures of
our model are provided in Supplementary Information.
Testing the significance of local clustering of binding sites. We define the
occupancy of a factor at a base pair and a particular antero-posterior position
as the sum of the probabilities of all those configurations at that antero-posterior
position in which the base pair is occupied by the factor. This quantity can be
computed exactly using dynamic programming (see Supplementary Infor-
mation). To test whether binding sites of a factor are significantly locally clus-
tered in modules, we defined discrete binding sites for each factor as those sites
that have an occupancy for the factor of $0.2 in at least one antero-posterior
position. We then calculated the number of all pairwise distances between sites
for the same factor that fall within a window k to k 1 50 base pairs, for different
values of k ranging from 0 to 1,000. To test for significance, we randomlypermuted the locations of the binding sites for the tested factor within each
module (while preserving the number of binding sites per module), and repeated
the computation for the randomly placed sites. Each permutation was per-
formed 1,000 times.
Calculating the occupancy contribution of binding sites. The occupancy of a
binding site by a factor at each particular position is computed as above. We
define the total occupancy contribution of a binding site as the sum of its
occupancy across all antero-posterior positions. The fractional occupancy con-
tribution of a binding site is then equal to its total occupancy divided by the sum
of the total occupancy of all binding sites for the factor. For the histograms in
Fig. 3b, we only considered binding sites that achieve occupancy $0.01 at any
antero-posterior position.
Experimental methods. The functions of transcription-factor-binding sites
were tested by insertion into a synthetic ventral enhancer driving a lacZ
reporter46 and examination of the resulting in vivo expression by RNA in situ
hybridization.
URLs. For input data and results, see http://genie.weizmann.ac.il/pubs/segnet08.
The results are viewable in Genomica (http://Genomica.weizmann.ac.il), a geno-mic analysis software freely available for academic use.
47. Gray, S. & Levine, M. Short-range transcriptional repressors mediate bothquenching and direct repression within complex loci in Drosophila. Genes Dev. 10,700–710 (1996).
48. Arnosti, D. N., Gray, S., Barolo, S., Zhou, J. & Levine, M. The gap protein knirpsmediates both quenching and direct repression in the Drosophila embryo. EMBO J.15, 3659–3666 (1996).
doi:10.1038/nature06496
Nature Publishing Group©2008