Shock and Discontinuity Normals, Mach Numbers, and Related ...

Predicting Depth, Surface Normals and Semantic Labels
with a Common Multi-Scale Convolutional Architecture
David Eigen1 Rob Fergus1,2
1 Dept. of Computer Science, Courant Institute, New York University2 Facebook AI Research
{deigen,fergus}@cs.nyu.edu
Abstract
In this paper we address three different computer vision
tasks using a single multiscale convolutional network archi-
tecture: depth prediction, surface normal estimation, and
semantic labeling. The network that we develop is able
to adapt naturally to each task using only small modifica-
tions, regressing from the input image to the output map di-
rectly. Our method progressively refines predictions using a
sequence of scales, and captures many image details with-
out any superpixels or low-level segmentation. We achieve
state-of-the-art performance on benchmarks for all three
tasks.
1. Introduction
Scene understanding is a central problem in vision that
has many different aspects. These include semantic labels
describing the identity of different scene portions; surface
normals or depth estimates describing the physical geome-
try; instance labels of the extent of individual objects; and
affordances capturing possible interactions of people with
the environment. Many of these are often represented with
a pixel-map containing a value or label for each pixel, e.g. a
map containing the semantic label of the object visible at
each pixel, or the vector coordinates of the surface normal
orientation.
In this paper, we address three of these tasks, depth pre-
diction, surface normal estimation and semantic segmenta-
tion — all using a single common architecture. Our multi-
scale approach generates pixel-maps directly from an input
image, without the need for low-level superpixels or con-
tours, and is able to align to many image details using a
series of convolutional network stacks applied at increasing
resolution. At test time, all three outputs can be generated
in real time (∼30Hz). We achieve state-of-the art results
on all three tasks we investigate, demonstrating our model’s
versatility.
There are several advantages in developing a general
model for pixel-map regression. First, applications to new
tasks may be quickly developed, with much of the new work
lying in defining an appropriate training set and loss func-
tion; in this light, our work is a step towards building off-
the-shelf regressor models that can be used for many ap-
plications. In addition, use of a single architecture helps
simplify the implementation of systems that require multi-
ple modalities, e.g. robotics or augmented reality, which in
turn can help enable research progress in these areas. Lastly,
in the case of depth and normals, much of the computation
can be shared between modalities, making the system more
efficient.
2. Related Work
Convolutional networks have been applied with great
success for object classification and detection [19, 12, 30,
32, 34]. Most such systems classify either a single object
label for an entire input window, or bounding boxes for a
few objects in each scene. However, ConvNets have re-
cently been applied to a variety of other tasks, including
pose estimation [36, 27], stereo depth [38, 25], and instance
segmentation [14]. Most of these systems use ConvNets to
find only local features, or generate descriptors of discrete
proposal regions; by contrast, our network uses both local
and global views to predict a variety of output types. In ad-
dition, while each of these methods tackle just one or two
tasks at most, we are able to apply our network to three dis-
parate tasks.
Our method builds upon the approach taken by Eigen
et al. [8], who apply two convolutional networks in stages
for single-image depth map prediction. We develop a more
general network that uses a sequence of three scales to gen-
erate features and refine predictions to higher resolution,
which we apply to multiple tasks, including surface nor-
mals estimation and per-pixel semantic labeling. Moreover,
we improve performance in depth prediction as well, illus-
trating how our enhancements help improve all tasks.
Single-image surface normal estimation has been ad-
dressed by Fouhey et al. [10, 11], Ladicky et al. [21], Barron
and Malik [3, 2], and most recently by Wang et al. [37], the
latter in work concurrent with ours. Fouhey et al. match to
discriminative local templates [10] followed by a global op-
12650

timization on a grid drawn from vanishing point rays [11],
while Ladicky et al. learn a regression from over-segmented
regions to a discrete set of normals and mixture coefficients.
Barron and Malik [3, 2] infer normals from RGB-D inputs
using a set of handcrafted priors, along with illumination
and reflectance. From RGB inputs, Wang et al. [37] use
convolutional networks to combine normals estimates from
local and global scales, while also employing cues from
room layout, edge labels and vanishing points. Importantly,
we achieve as good or superior results with a more general
multiscale architecture that can naturally be used to perform
many different tasks.
Prior work on semantic segmentation includes many dif-
ferent approaches, both using RGB-only data [35, 4, 9] as
well as RGB-D [31, 29, 26, 6, 15, 17, 13]. Most of these
use local features to classify over-segmented regions, fol-
lowed by a global consistency optimization such as a CRF.
By comparison, our method takes an essentially inverted ap-
proach: We make a consistent global prediction first, then
follow it with iterative local refinements. In so doing, the lo-
cal networks are made aware of their place within the global
scene, and can can use this information in their refined pre-
dictions.
Gupta et al. [13, 14] create semantic segmentations first
by generating contours, then classifying regions using either
hand-generated features and SVM [13], or a convolutional
network for object detection [14]. Notably, [13] also per-
forms amodal completion, which transfers labels between
disparate regions of the image by comparing planes from
the depth.
Most related to our method in semantic segmentation
are other approaches using convolutional networks. Farabet
et al. [9] and Couprie et al. [6] each use a convolutional net-
work applied to multiple scales in parallel generate features,
then aggregate predictions using superpixels. Our method
differs in several important ways. First, our model has a
large, full-image field of view at the coarsest scale; as we
demonstrate, this is of critical importance, particularly for
depth and normals tasks. In addition, we do not use super-
pixels or post-process smoothing — instead, our network
produces fairly smooth outputs on its own, allowing us to
take a simple pixel-wise maximum.
Pinheiro et al. [28] use a recurrent convolutional network
in which each iteration incorporates progressively more
context, by combining a more coarsely-sampled image in-
put along with the local prediction from the previous itera-
tion. This direction is precisely the reverse of our approach,
which makes a global prediction first, then iteratively re-
fines it. In addition, whereas they apply the same network
parameters at all scales, we learn distinct networks that can
specialize in the edits appropriate to their stage.
Most recently, in concurrent work, Long et al. [24] adapt
the recent VGG ImageNet model [32] to semantic segmen-
upsample
Input
Normals
conv/pool
conv/pool
!!!"
convolutions
!!!"
convolutions
full conn.
!!!"
conv/pool
Scale 1
Scale 2
Scale 3
concat
concat
upsample
Depth Labels
Layer 1.1 1.2 1.3 1.4 1.5 1.6 1.7 upsamp
Scale 1
Size 37x27 18x13 18x13 18x13 8x6 1x1 19x14 74x55
(AlexNet)
#convs 1 1 1 1 1 – – –
#chan 96 256 384 384 256 4096 64 64
ker. sz 11x11 5x5 3x3 3x3 3x3 – – –
Ratio /8 /16 /16 /16 /32 – /16 /4
l.rate 0.001 0.001 0.001 0.001 0.001 see text
Layer 1.1 1.2 1.3 1.4 1.5 1.6 1.7 upsamp
Scale 1
Size 150x112 75x56 37x28 18x14 9x7 1x1 19x14 74x55
(VGG)
#convs 2 2 3 3 3 – – –
#chan 64 128 256 512 512 4096 64 64
ker. sz 3x3 3x3 3x3 3x3 3x3 – – –
Ratio /2 /4 /8 /16 /32 – /16 /4
l.rate 0.001 0.001 0.001 0.001 0.001 see text
Scale 2
Layer 2.1 2.2 2.3 2.4 2.5 upsamp
Size 74x55 74x55 74x55 74x55 74x55 147x109
#chan 96+64 64 64 64 C C
ker. sz 9x9 5x5 5x5 5x5 5x5 –
Ratio /4 /4 /4 /4 /4 /2
l.rate 0.001 0.01 0.01 0.01 0.001
Scale 3
Layer 3.1 3.2 3.3 3.4 final
Size 147x109 147x109 147x109 147x109 147x109
#chan 96+C 64 64 C C
ker. sz 9x9 5x5 5x5 5x5 –
Ratio /2 /2 /2 /2 /2
l.rate 0.001 0.01 0.01 0.001
Figure 1. Model architecture. C is the number of output channels
in the final prediction, which depends on the task. The input to the
network is 320x240.
tation by applying 1x1 convolutional label classifiers at fea-
ture maps from different layers, corresponding to different
scales, and averaging the outputs. By contrast, we apply
networks for different scales in series, which allows them to
make more complex edits and refinements, starting from the
full image field of view. Thus our architecture easily adapts
to many tasks, whereas by considering relatively smaller
context and summing predictions, theirs is specific to se-
mantic labeling.
2651
3. Model Architecture
Our model is a multi-scale deep network that first pre-
dicts a coarse global output based on the entire image area,
then refines it using finer-scale local networks. This scheme
is illustrated in Fig. 1. While our model was initially based
upon the architecture proposed by [8], it offers several ar-
chitectural improvements. First, we make the model deeper
(more convolutional layers). Second, we add a third scale
at higher resolution, bringing the final output resolution up
to half the input, or 147 × 109 for NYUDepth. Third, in-
stead of passing output predictions from scale 1 to scale 2,
we pass multichannel feature maps; in so doing, we found
we could also train the first two scales of the network jointly
from the start, somewhat simplifying the training procedure
and yielding performance gains.
Scale 1: Full-Image View The first scale in the net-
work predicts a coarse but spatially-varying set of features
for the entire image area, based on a large, full-image field
of view, which we accomplish this through the use of two
fully-connected layers. The output of the last full layer is
reshaped to 1/16-scale in its spatial dimensions by 64 fea-
tures, then upsampled by a factor of 4 to 1/4-scale. Note
since the feature upsampling is linear, this corresponds to
a decomposition of a big fully connected layer from layer
1.6 to the larger 74× 55 map; since such a matrix would be
prohibitively large and only capable of producing a blurry
output given the more constrained input features, we con-
strain the resolution and upsample. Note, however, that the
1/16-scale output is still large enough to capture consider-
able spatial variation, and in fact is twice as large as the
1/32-scale final convolutional features of the coarse stack.
Since the top layers are fully connected, each spatial lo-
cation in the output connects to the all the image features,
incorporating a very large field of view. This stands in con-
trast to the multiscale approach of [6, 9], who produce maps
where the field of view of each output location is a more lo-
cal region centered on the output pixel. This full-view con-
nection is especially important for depth and normals tasks,
as we investigate in Section 7.1.
As shown in Fig. 1, we trained two different sizes of
our model: One where this scale is based on an ImageNet-
trained AlexNet [19], and one where it is initialized using
the Oxford VGG network [32]. We report differences in
performance between the models on all tasks, to measure
the impact of model size in each.
Scale 2: Predictions The job of the second scale is to
produce predictions at a mid-level resolution, by incorpo-
rating a more detailed but narrower view of the image along
with the full-image information supplied by the coarse net-
work. We accomplish this by concatenating the feature
maps of the coarse network with those from a single layer
of convolution and pooling, performed at finer stride (see
Fig. 1). The output of the second scale is a 55x74 prediction
(for NYUDepth), with the number of channels depending
on the task. We train Scales 1 and 2 of the model together
jointly, using SGD on the losses described in Section 4.
Scale 3: Higher Resolution The final scale of our
model refines the predictions to higher resolution. We con-
catenate the Scale-2 outputs with feature maps generated
from the original input at yet finer stride, thus incorporat-
ing a more detailed view of the image. The further refine-
ment aligns the output to higher-resolution details, produc-
ing spatially coherent yet quite detailed outputs. The final
output resolution is half the network input.
4. TasksWe apply this same architecture structure to each of the
three tasks we investigate: depths, normals and semantic
labeling. Each makes use of a different loss function and
target data defining the task.
4.1. DepthFor depth prediction, we use a loss function comparing
the predicted and ground-truth log depth maps D and D∗.
Letting d = D −D∗ be their difference, we set the loss to
Ldepth(D,D∗) =1
n
�
i
d2i −1
2n2
�
�
i
di
�2
+1
n
�
i
[(∇xdi)2 + (∇ydi)
2] (1)
where the sums are over valid pixels i and n is the number
of valid pixels (we mask out pixels where the ground truth
is missing). Here, ∇xdi and ∇ydi are the horizontal and
vertical image gradients of the difference.
Our loss is similar to that of [8], who also use the l2and scale-invariant difference terms in the first line. How-
ever, we also include a first-order matching term (∇xdi)2+
(∇ydi)2, which compares image gradients of the predic-
tion with the ground truth. This encourages predictions to
have not only close-by values, but also similar local struc-
ture. We found it indeed produces outputs that better follow
depth gradients, with no degradation in measured l2 perfor-
mance.
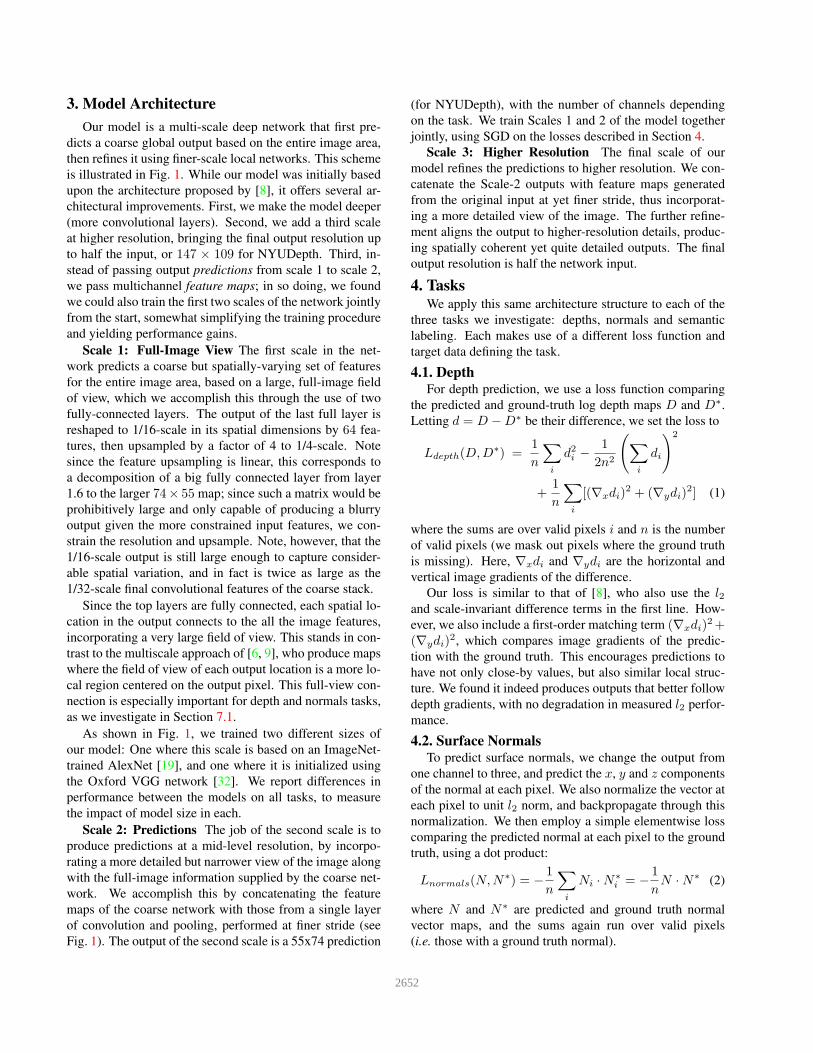
4.2. Surface NormalsTo predict surface normals, we change the output from
one channel to three, and predict the x, y and z components
of the normal at each pixel. We also normalize the vector at
each pixel to unit l2 norm, and backpropagate through this
normalization. We then employ a simple elementwise loss
comparing the predicted normal at each pixel to the ground
truth, using a dot product:
Lnormals(N,N∗) = −1
n
�
i
Ni ·N∗
i = −1
nN ·N∗ (2)
where N and N∗ are predicted and ground truth normal
vector maps, and the sums again run over valid pixels
(i.e. those with a ground truth normal).
2652

For ground truth targets, we compute the normal map
using the same method as in Silberman et al. [31], which
estimates normals from depth by fitting least-squares planes
to neighboring sets of points in the point cloud.
4.3. Semantic LabelsFor semantic labeling, we use a pixelwise softmax clas-
sifier to predict a class label for each pixel. The final output
then has as many channels as there are classes. We use a
simple pixelwise cross-entropy loss,
Lsemantic(C,C∗) = −
1
n
�
i
C∗
i log(Ci) (3)
where Ci = ezi/�
c ezi,c is the class prediction at pixel i
given the output z of the final convolutional linear layer 3.4.
When labeling the NYUDepth RGB-D dataset, we use
the ground truth depth and normals as additional input chan-
nels. We convolve each of the three input types (RGB, depth
and normals) with a different set of 32 × 9 × 9 filters, then
concatenate the resulting three feature sets along with the
network output from the previous scale to form the input
to the next. We also tried the “HHA” encoding proposed by
[14], but did not see a benefit in our case, thus we opt for the
simpler approach of using the depth and xyz-normals di-
rectly. Note the first scale is initialized using ImageNet, and
we keep it RGB-only. Applying convolutions to each input
type separately, rather than concatenating all the channels
together in pixel space and filtering the joint input, enforces
independence between the features at the lowest filter level,
which we found helped performance.
5. Training5.1. Training Procedure
We train our model in two phases using SGD: First, we
jointly train both Scales 1 and 2. Second, we fix the param-
eters of these scales and train Scale 3. Since Scale 3 con-
tains four times as many pixels as Scale 2, it is expensive
to train using the entire image area for each gradient step.
To speed up training, we instead use random crops of size
74x55: We first forward-propagate the entire image through
scales 1 and 2, upsample, and crop the resulting Scale 3 in-
put, as well as the original RGB input at the correspond-
ing location. The cropped image and Scale 2 prediction are
forward- and back-propagated through the Scale 3 network,
and the weights updated. We find this speeds up training
by about a factor of 3, including the overhead for inference
of the first two scales, and results in about the same if not
slightly better error from the increased stochasticity.
All three tasks use the same initialization and learning
rates in nearly all layers, indicating that hyperparameter set-
tings are in fact fairly robust to changes in task. Each were
first tuned using the depth task, then verified to be an appro-
priate order of magnitude for each other task using a small
validation set of 50 scenes. The only differences are: (i)
The learning rate for the normals task is 10 times larger
than depth or labels. (ii) Relative learning rates of layers
1.6 and 1.7 are 0.1 each for depth/normals, but 1.0 and 0.01
for semantic labeling. (iii) The dropout rate of layer 1.6 is
0.5 for depth/normals, but 0.8 for semantic labels, as there
are fewer training images.
We initialize the convolutional layers in Scale 1 using
ImageNet-trained weights, and randomly initialize the fully
connected layers of Scale 1 and all layers in Scales 2 and 3.
We train using batches of size 32 for the AlexNet-initialized
model but batches of size 16 for the VGG-initialized model
due to memory constraints. In each case we step down the
global learning rate by a factor of 10 after approximately
2M gradient steps, and train for an additional 0.5M steps.
5.2. Data AugmentationIn all cases, we apply random data transforms to aug-
ment the training data. We use random scaling, in-plane
rotation, translation, color, flips and contrast. When trans-
forming an input and target, we apply corresponding trans-
formations to RGB, depth, normals and labels. Note the
normal vector transformation is the inverse-transpose of the
worldspace transform: Flips and in-plane rotations require
flipping or rotating the normals, while to scale the image
by a factor s, we divide the depths by s but multiply the zcoordinate of the normals and renormalize.
5.3. Combining Depth and NormalsWe combine both depths and normals networks together
to share computation, creating a network using a single
scale 1 stack, but separate scale 2 and 3 stacks. Thus we
predict both depth and normals at the same time, given an
RGB image. This produces a 1.6x speedup compared to
using two separate models. 1
6. Performance Experiments6.1. Depth
We first apply our method to depth prediction on
NYUDepth v2. We train using the entire NYUDepth v2
raw data distribution, using the scene split specified in the
official train/test distribution. We then test on the common
distribution depth maps, including filled-in areas, but con-
strained to the axis-aligned rectangle where there there is
a valid depth map projection. Since the network output
is a lower resolution than the original NYUDepth images,
and excludes a small border, we bilinearly upsample our
network outputs to the original 640x480 image scale, and
extrapolate the missing border using a cross-bilateral filter.
We compare our method to prior works Ladicky et al. [20],
1This shared model also enabled us to try enforcing compatibility be-
tween predicted normals and those obtained via finite difference of the
predicted depth (predicting normals directly performs considerably better
than using finite difference). However, while this constraint was able to
improve the normals from finite difference, it failed to improve either task
individually. Thus, while we make use of the shared model for computa-
tional efficiency, we do not use the extra compatibility constraint.
2653

(a) (b) (c) (d)
Figure 2. Example depth results. (a) RGB input; (b) result of [8];
(c) our result; (d) ground truth. Note the color range of each image
is individually scaled.
Depth Prediction
Ladicky[20]Karsch[18] Baig [1] Liu [23] Eigen[8] Ours(A) Ours(VGG)
δ < 1.25 0.542 – 0.597 0.614 0.614 0.697 0.769
δ < 1.252 0.829 – – 0.883 0.888 0.912 0.950
δ < 1.253 0.940 – – 0.971 0.972 0.977 0.988
abs rel – 0.350 0.259 0.230 0.214 0.198 0.158
sqr rel – – – – 0.204 0.180 0.121
RMS(lin) – 1.2 0.839 0.824 0.877 0.753 0.641
RMS(log) – – – – 0.283 0.255 0.214
sc-inv. – – 0.242 – 0.219 0.202 0.171
Table 1. Depth estimation measurements. Note higher is better for
top rows of the table, while lower is better for the bottom section.
Karsh et al. [18], Baig et al. [1], Liu et al. [23] and Eigen
et al. [8].
The results are shown in Table 1. Our model obtains best
performance in all metrics, due to our larger architecture
and improved training. In addition, the VGG version of our
model significantly outperforms the smaller AlexNet ver-
sion, reenforcing the importance of model size; this is the
case even though the depth task is seemingly far removed
from the classification task with which the initial coarse
weights were first trained. Qualitative results in Fig. 2 show
substantial improvement in detail sharpness over [8].
6.2. Surface NormalsNext we apply our method to surface normals predic-
tion. We compare against the 3D Primitives (3DP) and “In-
door Origami” works of Fouhey et al. [10, 11], Ladicky
et al. [21], and Wang et al. [37]. As with the depth network,
we used the full raw dataset for training, since ground-truth
normal maps can be generated for all images. Since differ-
ent systems have different ways of calculating ground truth
normal maps, we compare using both the ground truth as
constructed in [21] as well as the method used in [31]. The
differences between ground truths are due primarily to the
fact that [21] uses more aggressive smoothing; thus [21]
tends to present flatter areas, while [31] is noisier but keeps
Surface Normal Estimation (GT [21])
Angle Distance Within t◦ Deg.
Mean Median 11.25◦ 22.5◦ 30◦
3DP [10] 35.3 31.2 16.4 36.6 48.2
Ladicky &al. [21] 33.5 23.1 27.5 49.0 58.7
Fouhey &al. [11] 35.2 17.9 40.5 54.1 58.9
Wang &al. [37] 26.9 14.8 42.0 61.2 68.2
Ours (AlexNet) 23.7 15.5 39.2 62.0 71.1
Ours (VGG) 20.9 13.2 44.4 67.2 75.9
Surface Normal Estimation (GT [31])
Angle Distance Within t◦ Deg.
Mean Median 11.25◦ 22.5◦ 30◦
3DP [10] 37.7 34.1 14.0 32.7 44.1
Ladicky &al. [21] 35.5 25.5 24.0 45.6 55.9
Wang &al. [37] 28.8 17.9 35.2 57.1 65.5
Ours (AlexNet) 25.9 18.2 33.2 57.5 67.7
Ours (VGG) 22.2 15.3 38.6 64.0 73.9
Table 2. Surface normals prediction measured against the ground
truth constructed by [21] (top) and [31] (bottom).
more details present. We measure performance with the
same metrics as in [10]: The mean and median angle from
the ground truth across all unmasked pixels, as well as the
percent of vectors whose angle falls within three thresholds.
Results are shown in Table 2. The smaller version of
our model performs similarly or slightly better than Wang
et al., while the larger version substantially outperforms all
comparison methods. Figure 3 shows example predictions.
Note the details captured by our method, such as the curva-
ture of the blanket on the bed in the first row, sofas in the
second row, and objects in the last row.
6.3. Semantic Labels
6.3.1 NYU Depth
We finally apply our method to semantic segmentation, first
also on NYUDepth. Because this data provides a depth
channel, we use the ground-truth depth and normals as in-
put into the semantic segmentation network, as described
in Section 4.3. We evaluate our method on semantic class
sets with 4, 13 and 40 labels, described in [31], [6] and
[13], respectively. The 4-class segmentation task uses high-
level category labels “floor”, “structure”, “furniture” and
“props”, while the 13- and 40-class tasks use different sets
of more fine-grained categories. We compare with several
recent methods, using the metrics commonly used to eval-
uate each task: For the 4- and 13-class tasks we use pixel-
wise and per-class accuracy; for the 40-class task, we also
compare using the mean pixel-frequency weighted Jaccard
index of each class, and the flat mean Jaccard index.
Results are shown in Table 3. We decisively outperform
the comparison methods on the 4- and 14-class tasks. In
the 40-class task, our model outperforms Gupta et al. ’14
with both model sizes, and Long et al. with the larger size.
Qualitative results are shown in Fig. 4. Even though our
method does not use superpixels or any piecewise constant
assumptions, it nevertheless tends to produce large constant
regions most of the time.
2654

4-Class Semantic SegmentationPixel Class
Couprie &al. [6] 64.5 63.5
Khan &al. [15] 69.2 65.6
Stuckler &al. [33] 70.9 67.0
Mueller &al. [26] 72.3 71.9
Gupta &al. ’13 [13] 78 –
Ours (AlexNet) 80.6 79.1
Ours (VGG) 83.2 82.0
13-Class SemanticPixel Class
Couprie &al. [6] 52.4 36.2
Wang &al. [37] – 42.2
Hermans &al. [17] 54.2 48.0
Khan &al. [15] ∗ 58.3 45.1
Ours (AlexNet) 70.5 59.4
Ours (VGG) 75.4 66.9
40-Class Semantic SegmentationPix. Acc. Per-Cls Acc. Freq. Jaccard Av. Jaccard
Gupta&al.’13 [13] 59.1 28.4 45.6 27.4
Gupta&al.’14 [14] 60.3 35.1 47.0 28.6
Long&al. [24] 65.4 46.1 49.5 34.0
Ours (AlexNet) 62.9 41.3 47.6 30.8
Ours (VGG) 65.6 45.1 51.4 34.1
Table 3. Semantic labeling on NYUDepth v2∗Khan&al. use a different overlapping label set.
Sift Flow Semantic Segmentation
Pix. Acc. Per-Class Acc. Freq. Jacc Av. Jacc
Farabet &al. (1) [9] 78.5 29.6 – –
Farabet &al. (2) [9] 74.2 46.0 – –
Tighe &al. [35] 78.6 39.2 – –
Pinheiro &al. [28] 77.7 29.8 – –
Long &al. [24] 85.1 51.7 76.1 39.5
Ours (AlexNet) (1) 84.0 42.0 73.7 33.1
Ours (AlexNet) (2) 81.6 48.2 71.3 32.6
Ours (VGG) (1) 86.8 46.4 77.9 38.8
Ours (VGG) (2) 83.8 55.7 74.7 37.6
Table 4. Semantic labeling on the Sift Flow dataset. (1) and (2)
correspond to non-reweighted and class-reweighted versions of
our model (see text).
6.3.2 Sift Flow
We confirm our method can be applied to additional scene
types by evaluating on the Sift Flow dataset [22], which
contains images of outdoor cityscapes and landscapes seg-
mented into 33 categories. We found no need to adjust
convolutional kernel sizes or learning rates for this dataset,
and simply transfer the values used for NYUDepth directly;
however, we do adjust the output sizes of the layers to match
the new image sizes.
We compare against Tighe et al. [35], Farabet et al. [9],
Pinheiro [28] and Long et al. [24]. Note that Farabet
et al. train two models, using empirical or rebalanced class
distributions by resampling superpixels. We train a more
class-balanced version of our model by reweighting each
class in the cross-entropy loss; we weight each pixel by
αc = median freq/freq(c) where freq(c) is the number
of pixels of class c divided by the total number of pixels in
images where c is present, and median freq is the median
of these frequencies.
Results are in Table 4; we compare regular (1) and
reweighted (2) versions of our model against comparison
methods. Our smaller model substantially outperforms all
but Long et al. , while our larger model performs similarly
to Long et al. This demonstrates our model’s adaptability
not just to different tasks but also different data.
6.3.3 Pascal VOC
In addition, we also verify our method using Pascal VOC.
Similarly to Long et al. [24], we train using the 2011 train-
Pascal VOC Semantic Segmentation2011 Validation 2011 Test 2012 Test
Pix. Acc. Per-Cls Acc. Freq.Jacc Av.Jacc Av.Jacc Av.Jacc
Dai&al.[7] – – – – – 61.8
Long&al.[24] 90.3 75.9 83.2 62.7 62.7 62.2
Chen&al.[5] – – – – – 71.6
Ours (VGG) 90.3 72.4 82.9 62.2 62.5 62.6
Table 5. Semantic labeling on Pascal VOC 2011 and 2012.
Contributions of Scales
Depth Normals4-Class 13-Class
RGB+D+N RGB RGB+D+N RGB
Pixelwise Error Pixelwise Accuracy
lower is better higher is better
Scale 1 only 0.218 29.7 71.5 71.5 58.1 58.1
Scale 2 only 0.290 31.8 77.4 67.2 65.1 53.1
Scales 1 + 2 0.216 26.1 80.1 74.4 69.8 63.2
Scales 1 + 2 + 3 0.198 25.9 80.6 75.3 70.5 64.0
Table 6. Comparison of networks for different scales for depth,
normals and semantic labeling tasks with 4 and 13 categories.
Largest single contributing scale is underlined.
ing set augmented with 8498 training images collected by
Hariharan et al. [16], and evaluate using the 736 images
from the 2011 validation set not also in the Hariharan ex-
tra set, as well as on the 2011 and 2012 test sets. We per-
form online data augmentations as in our NYUDepth and
Sift Flow models, and use the same learning rates. Because
these images have arbitrary aspect ratio, we train our model
on square inputs, and scale the smaller side of each image
to 256; at test time we apply the model with a stride of 128
to cover the image (two applications are usually sufficient).
Results are shown in Table 5 and Fig. 5. We compare
with Dai et al. [7], Long et al. [24] and Chen et al. [5];
the latter is a more recent work that augments a convo-
lutional network with large top-layer field of and fully-
connected CRF. Our model performs comparably to Long
et al., even as it generalizes to multiple tasks, demonstrated
by its adeptness at depth and normals prediction.
7. Probe Experiments
7.1. Contributions of Scales
We compare performance broken down according to the
different scales in our model in Table 6. For depth, nor-
mals and 4- and 13-class semantic labeling tasks, we train
and evaluate the model using just scale 1, just scale 2, both,
or all three scales 1, 2 and 3. For the coarse scale-1-only
prediction, we replace the last fully connected layer of the
coarse stack with a fully connected layer that outputs di-
rectly to target size, i.e. a pixel map of either 1, 3, 4 or 13
channels depending on the task. The spatial resolution is
the same as is used for the coarse features in our model, and
is upsampled in the same way.
We report the “abs relative difference” measure (i.e. |D−D∗|/D∗) to compare depth, mean angle distance for nor-
mals, and pixelwise accuracy for semantic segmentation.
First, we note there is progressive improvement in all
tasks as scales are added (rows 1, 3, and 4). In addition,
we find the largest single contribution to performance is the
2655

RGB input 3DP [10] Ladicky&al. [21] Wang&al. [37] Ours (VGG) Ground Truth
Figure 3. Comparison of surface normal maps.
Effect of Depth/Normals Inputs
Scale 2 only Scales 1 + 2
Pix. Acc. Per-class Pix. Acc. Per-class
RGB only 53.1 38.3 63.2 50.6
RGB + pred. D&N 58.7 43.8 65.0 49.5
RGB + g.t. D&N 65.1 52.3 69.8 58.9
Table 7. Comparison of RGB-only, predicted depth/normals, and
ground-truth depth/normals as input to the 13-class semantic task.
coarse Scale 1 for depth and normals, but the more local
Scale 2 for the semantic tasks — however, this is only due to
the fact that the depth and normals channels are introduced
at Scale 2 for the semantic labeling task. Looking at the
labeling network with RGB-only inputs, we find that the
coarse scale is again the larger contributer, indicating the
importance of the global view. (Of course, this scale was
also initialized with ImageNet convolution weights that are
much related to the semantic task; however, even initializing
randomly achieves 54.5% for 13-class scale 1 only, still the
largest contribution, albeit by a smaller amount).
7.2. Effect of Depth and Normals Inputs
The fact that we can recover much of the depth and nor-
mals information from the RGB image naturally leads to
two questions: (i) How important are the depth and normals
inputs relative to RGB in the semantic labeling task? (ii)
What might happen if we were to replace the true depth and
normals inputs with the predictions made by our network?
To study this, we trained and tested our network using
either Scale 2 alone or both Scales 1 and 2 for the 13-
class semantic labeling task under three input conditions:
(a) the RGB image only, (b) the RGB image along with
predicted depth and normals, or (c) RGB plus true depth
and normals. Results are in Table 7. Using ground truth
depth/normals shows substantial improvements over RGB
alone. Predicted depth/normals appear to have little effect
when using both scales, but a tangible improvement when
using only Scale 2. We believe this is because any relevant
information provided by predicted depths/normals for label-
ing can also be extracted from the input; thus the labeling
network can learn this same information itself, just from the
label targets. However, this supposes that the network struc-
ture is capable of learning these relations: If this is not the
case, e.g. when using only Scale 2, we do see improvement.
This is also consistent with Section 7.1, where we found the
coarse network was important for prediction in all tasks —
indeed, supplying the predicted depth/normals to scale 2 is
able to recover much of the performance obtained by the
RGB-only scales 1+2 model.
8. DiscussionTogether, depth, surface normals and semantic labels
provide a rich account of a scene. We have proposed a sim-
ple and fast multiscale architecture using convolutional net-
works that gives excellent performance on all three modali-
ties. The models beat existing methods on the vast majority
of benchmarks we explored. This is impressive given that
many of these methods are specific to a single modality and
often slower and more complex algorithms than ours. As
such, our model provides a convenient new baseline for the
three tasks. To this end, code and trained models can be
found at http://cs.nyu.edu/˜deigen/dnl/.
2656

RGB input 4-Class Prediction 13-Class Prediction 13-Class Ground Truth
Figure 4. Example semantic labeling results for NYUDepth: (a) input image; (b) 4-class labeling result; (c) 13-class result; (d) 13-class
ground truth.
Figure 5. Example semantic labeling results for Pascal VOC 2011. For each image, we show RGB input, our prediction, and ground truth.
AcknowledgementsThis work was supported by an ONR #N00014-13-1-0646 and an NSF CAREER grant.
2657

References
[1] M. H. Baig and L. Torresani. Coarse-to-fine depth estimation
from a single image via coupled regression and dictionary
learning. arXiv:1501.04537, 2015. 5
[2] J. T. Barron and J. Malik. Intrinsic scene properties from a
single rgb-d image. CVPR, 2013. 1, 2
[3] J. T. Barron and J. Malik. Shape, illumination, and re-
flectance from shading. TPAMI, 2015. 1, 2
[4] J. Carreira and C. Sminchisescu. Cpmc: Automatic object
segmentation using constrained parametric min-cuts. PAMI,
2012. 2
[5] L.-C. Chen, G. Papandreou, I. Kokkinos, K. Murphy, and
A. L. Yuille. Semantic image segmentation with deep con-
volutional nets and fully connected crfs. ICLR, 2015. 6
[6] C. Couprie, C. Farabet, L. Najman, and Y. LeCun. Indoor
semantic segmentation using depth information. ICLR, 2013.
2, 3, 5, 6
[7] J. Dai, K. He, and J. Sun. Convolutional feature masking for
joint object and stuff segmentation. arXiv 1412.1283, 2014.
6
[8] D. Eigen, C. Puhrsch, and R. Fergus. Depth map prediction
from a single image using a multi-scale deep network. NIPS,
2014. 1, 3, 5
[9] C. Farabet, C. Couprie, L. Najman, and Y. LeCun. Scene
parsing with multiscale feature learning, purity trees, and op-
timal covers. arXiv:1202.2160, 2012. 2, 3, 6
[10] D. F. Fouhey, A. Gupta, and M. Hebert. Data-driven 3d prim-
itives for single image understanding. In ICCV, 2013. 1, 5,
7
[11] D. F. Fouhey, A. Gupta, and M. Hebert. Unfolding an indoor
origami world. In ECCV, 2014. 1, 2, 5
[12] R. B. Girshick, J. Donahue, T. Darrell, and J. Malik. Rich
feature hierarchies for accurate object detection and semantic
segmentation. CVPR, 2014. 1
[13] S. Gupta, P. Arbelaez, and J. Malik. Perceptual organiza-
tion and recognition of indoor scenes from rgb-d images. In
CVPR, 2013. 2, 5, 6
[14] S. Gupta, R. Girshick, P. Arbelaez, and J. Malik. Learning
rich features from rgb-d images for object detection and seg-
mentation. In ECCV. 2014. 1, 2, 4, 6
[15] S. K. Hameed, M. Bennamoun, F. Sohel, and R. Togneri. Ge-
ometry driven semantic labeling of indoor scenes. In ECCV.
2014. 2, 6
[16] B. Hariharan, P. Arbelaez, R. Girshick, and J. Malik. Simul-
taneous detection and segmentation. In ECCV. 2014. 6
[17] A. Hermans, G. Floros, and B. Leibe. Dense 3d semantic
mapping of indoor scenes from rgb-d images. ICRA, 2014.
2, 6
[18] K. Karsch, C. Liu, S. B. Kang, and N. England. Depth extrac-
tion from video using non-parametric sampling. In TPAMI,
2014. 5
[19] A. Krizhevsky, I. Sutskever, and G. Hinton. Imagenet clas-
sification with deep convolutional neural networks. In NIPS,
2012. 1, 3
[20] L. Ladicky, J. Shi, and M. Pollefeys. Pulling things out of
perspective. In CVPR, 2014. 4, 5
[21] L. Ladicky, B. Zeisl, and M. Pollefeys. Discriminatively
trained dense surface normal estimation. 1, 5, 7
[22] C. Liu, J. Yuen, A. Torralba, J. Sivic, and W. Freeman. Sift
flow: dense correspondence across difference scenes. 2008.
6
[23] F. Liu, C. Shen, and G. Lin. Deep convolutional neural fields
for depth estimation from a single image. arXiv:1411.6387,
2014. 5
[24] J. Long, E. Shelhamer, and T. Darrell. Fully convolutional
networks for semantic segmentation. CoRR, abs/1411.4038,
2014. 2, 6
[25] R. Memisevic and C. Conrad. Stereopsis via deep learning.
In NIPS Workshop on Deep Learning, 2011. 1
[26] A. C. Muller and S. Behnke. Learning depth-sensitive condi-
tional random fields for semantic segmentation of rgb-d im-
ages. ICRA, 2014. 2, 6
[27] M. Osadchy, Y. Le Cun, and M. L. Miller. Synergistic face
detection and pose estimation with energy-based models. In
Toward Category-Level Object Recognition, pages 196–206.
Springer, 2006. 1
[28] P. Pinheiro and R. Collobert. Recurrent convolutional neural
networks for scene labeling. In ICML, 2014. 2, 6
[29] X. Ren, L. Bo, and D. Fox. Rgb-(d) scene labeling: Features
and algorithms. In CVPR, 2012. 2
[30] P. Sermanet, D. Eigen, X. Zhang, M. Mathieu, R. Fergus,
and Y. LeCun. Overfeat: Integrated recognition, localization
and detection using convolutional networks. ICLR, 2013. 1
[31] N. Silberman, D. Hoiem, P. Kohli, and R. Fergus. Indoor
segmentation and support inference from rgbd images. In
ECCV, 2012. 2, 4, 5
[32] K. Simonyan and A. Zisserman. Very deep convolu-
tional networks for large-scale image recognition. CoRR,
abs/1409.1556, 2014. 1, 2, 3
[33] J. Stuckler, B. Waldvogel, H. Schulz, and S. Behnke. Dense
real-time mapping of object-class semantics from rgb-d
video. J. Real-Time Image Processing, 2014. 6
[34] C. Szegedy, W. Liu, Y. Jia, P. Sermanet, S. Reed,
D. Anguelov, D. Erhan, V. Vanhoucke, and A. Rabinovich.
Going deeper with convolutions. CoRR, abs/1409.4842,
2014. 1
[35] J. Tighe and S. Lazebnik. Finding things: Image parsing with
regions and per-exemplar detectors. In CVPR, 2013. 2, 6
[36] J. Tompson, A. Jain, Y. LeCun, and C. Bregler. Joint training
of a convolutional network and a graphical model for human
pose estimation. NIPS, 2014. 1
[37] A. Wang, J. Lu, G. Wang, J. Cai, and T.-J. Cham. Multi-
modal unsupervised feature learning for rgb-d scene label-
ing. In ECCV. 2014. 1, 2, 5, 6, 7
[38] J. Zbontar and Y. LeCun. Computing the stereo match-
ing cost with a convolutional neural network. CoRR,
abs/1409.4326, 2014. 1
2658