Predicting activity using the electrostatic ...
35
Predicting activity using the electrostatic complementarity of protein-ligand complexes Matthias Bauer
Transcript of Predicting activity using the electrostatic ...
Predicting activity using the electrostatic
complementarity of protein-ligand complexes
Matthias Bauer

© CressetCONFIDENTIAL © CressetCONFIDENTIAL
> Introduction
> Theoretical background of
computing electrostatic
complementarity
> Case studies
> Conclusion and Outlook
Overview
© CressetCONFIDENTIAL © CressetCONFIDENTIAL
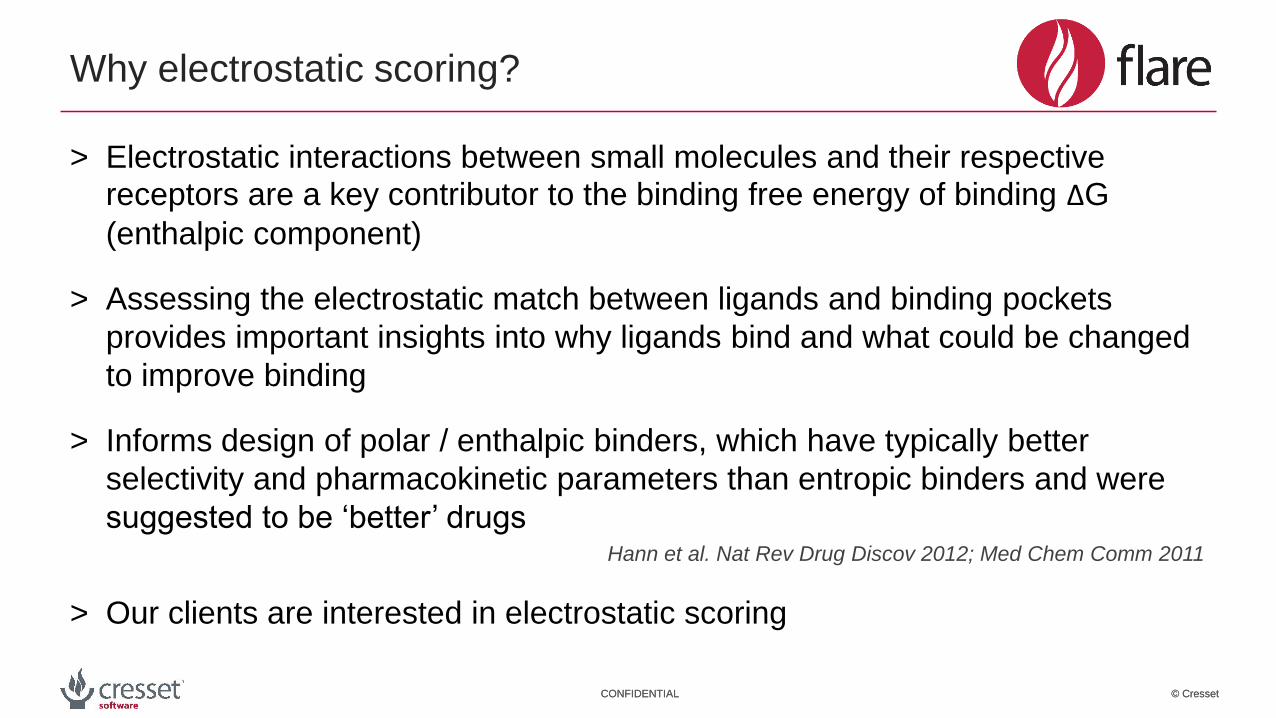
Why electrostatic scoring?
> Electrostatic interactions between small molecules and their respective receptors are a key contributor to the binding free energy of binding ΔG
(enthalpic component)
> Assessing the electrostatic match between ligands and binding pockets
provides important insights into why ligands bind and what could be changed
to improve binding
> Informs design of polar / enthalpic binders, which have typically better
selectivity and pharmacokinetic parameters than entropic binders and were
suggested to be ‘better’ drugsHann et al. Nat Rev Drug Discov 2012; Med Chem Comm 2011
> Our clients are interested in electrostatic scoring
© CressetCONFIDENTIAL © CressetCONFIDENTIAL
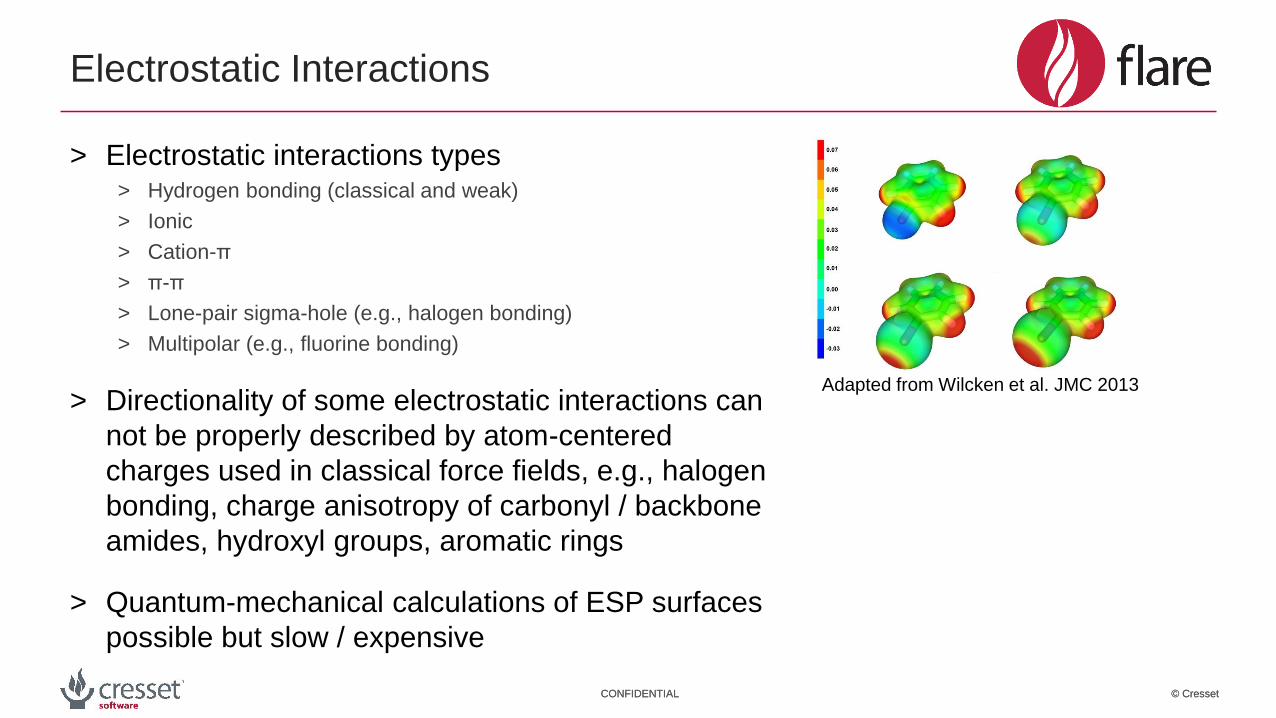
> Electrostatic interactions types> Hydrogen bonding (classical and weak)
> Ionic
> Cation-π
> π-π
> Lone-pair sigma-hole (e.g., halogen bonding)
> Multipolar (e.g., fluorine bonding)
> Directionality of some electrostatic interactions can
not be properly described by atom-centered
charges used in classical force fields, e.g., halogen
bonding, charge anisotropy of carbonyl / backbone
amides, hydroxyl groups, aromatic rings
> Quantum-mechanical calculations of ESP surfaces
possible but slow / expensive
Electrostatic Interactions
Adapted from Wilcken et al. JMC 2013
© CressetCONFIDENTIAL © CressetCONFIDENTIAL
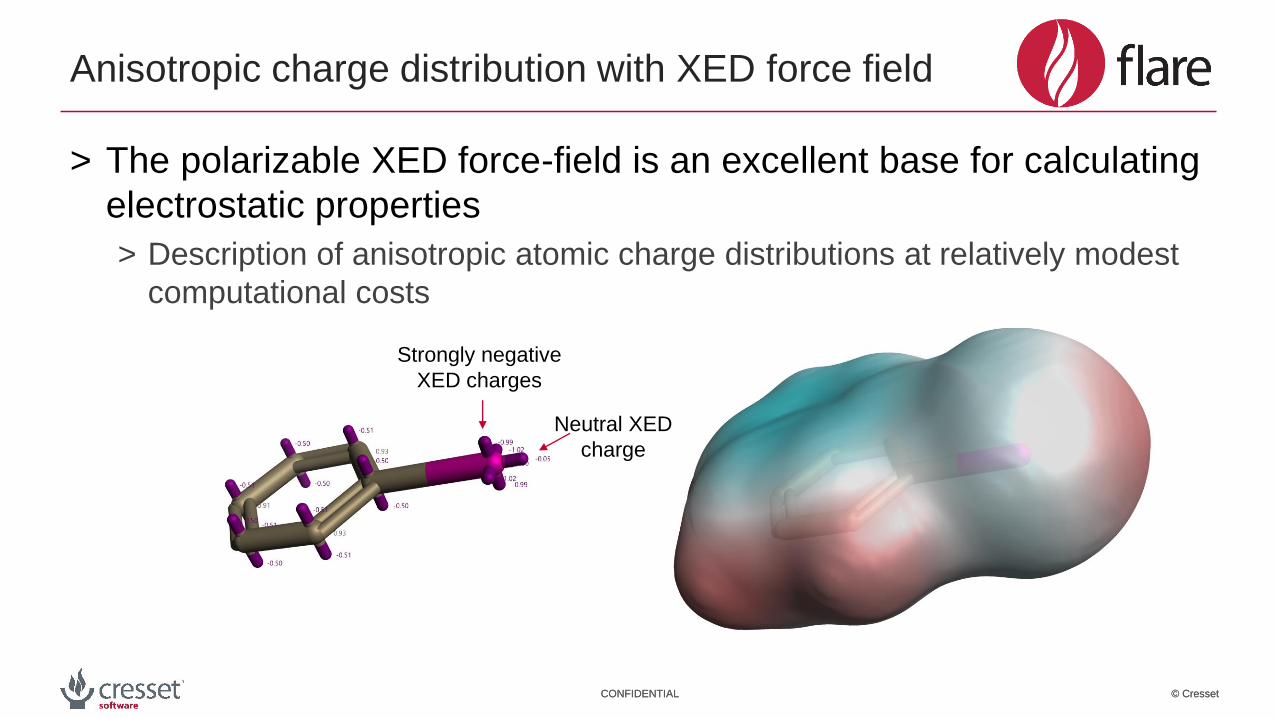
Anisotropic charge distribution with XED force field
> The polarizable XED force-field is an excellent base for calculating
electrostatic properties
> Description of anisotropic atomic charge distributions at relatively modest
computational costs
Strongly negative
XED charges
Neutral XED
charge
© CressetCONFIDENTIAL © CressetCONFIDENTIAL
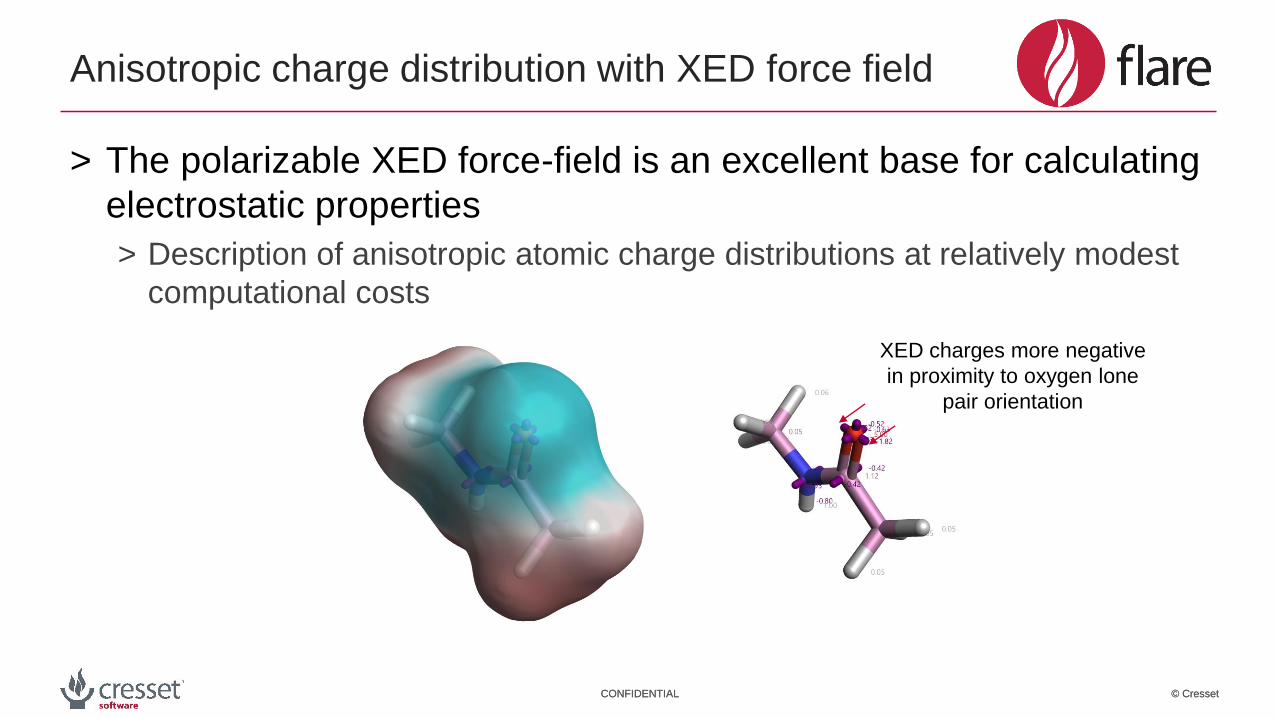
XED charges more negative
in proximity to oxygen lone
pair orientation
Anisotropic charge distribution with XED force field
> The polarizable XED force-field is an excellent base for calculating
electrostatic properties
> Description of anisotropic atomic charge distributions at relatively modest
computational costs

© CressetCONFIDENTIAL © CressetCONFIDENTIAL
> Electrostatic potential and complementarity calculations are an extension of protein interaction potential function in Flare™ which calculates protein fields
> Flooding with probe atoms (vdW parameters of oxygen atom) and calculation of interaction potentials at each point
Coulomb force
Interaction potentials
Cheeseright, Mackey et al. JCIM 2006
© CressetCONFIDENTIAL © CressetCONFIDENTIAL
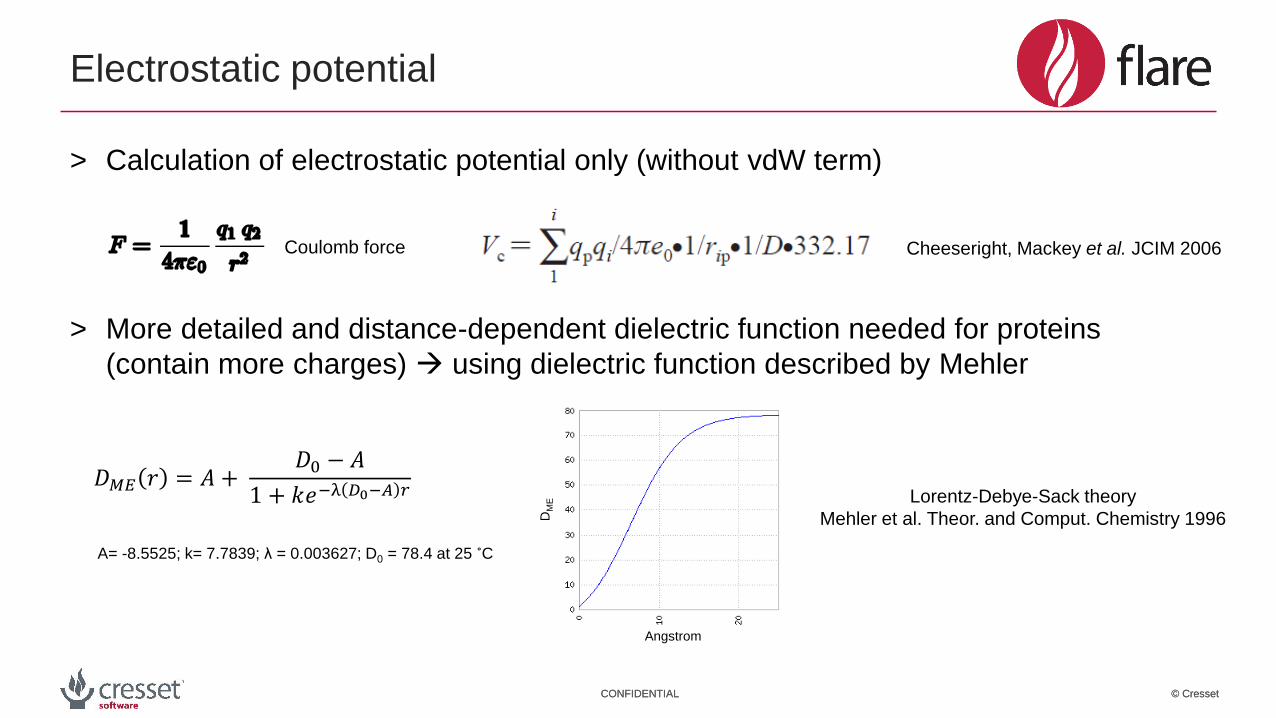
> Calculation of electrostatic potential only (without vdW term)
> More detailed and distance-dependent dielectric function needed for proteins
(contain more charges) using dielectric function described by Mehler
Coulomb force
Electrostatic potential
Lorentz-Debye-Sack theory
Mehler et al. Theor. and Comput. Chemistry 1996
𝐷𝑀𝐸 𝑟 = 𝐴 +𝐷0 − 𝐴
1 + 𝑘𝑒−λ 𝐷0−𝐴 𝑟
Cheeseright, Mackey et al. JCIM 2006
A= -8.5525; k= 7.7839; λ = 0.003627; D0 = 78.4 at 25 ˚C
Angstrom
DM
E
© CressetCONFIDENTIAL © CressetCONFIDENTIAL
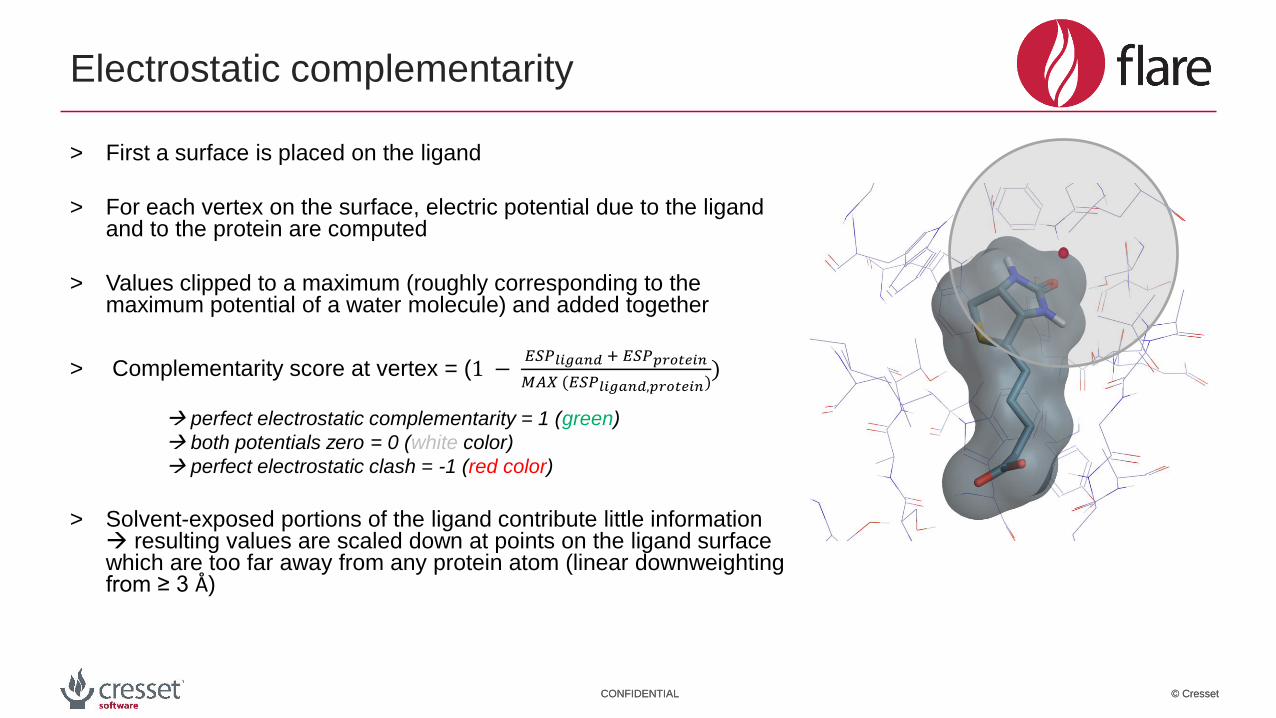
Electrostatic complementarity
> First a surface is placed on the ligand
> For each vertex on the surface, electric potential due to the ligand and to the protein are computed
> Values clipped to a maximum (roughly corresponding to the maximum potential of a water molecule) and added together
> Complementarity score at vertex = (1 −𝐸𝑆𝑃𝑙𝑖𝑔𝑎𝑛𝑑 + 𝐸𝑆𝑃𝑝𝑟𝑜𝑡𝑒𝑖𝑛
𝑀𝐴𝑋 (𝐸𝑆𝑃𝑙𝑖𝑔𝑎𝑛𝑑,𝑝𝑟𝑜𝑡𝑒𝑖𝑛))
perfect electrostatic complementarity = 1 (green)
both potentials zero = 0 (white color)
perfect electrostatic clash = -1 (red color)
> Solvent-exposed portions of the ligand contribute little information resulting values are scaled down at points on the ligand surface which are too far away from any protein atom (linear downweightingfrom ≥ 3 Å)

© CressetCONFIDENTIAL © CressetCONFIDENTIAL
Biotin-Streptavidin example
> Visual inspection of electrostatic potential (Biotin-Strepavidin)
red = positive potential and blue = negative potential
180˚ flip
XED ESP surface of Streptavidin XED ESP surface of Biotin

© CressetCONFIDENTIAL © CressetCONFIDENTIAL
Biotin-Streptavidin example
> Visualization of electrostatic complementarity (Biotin-Strepavidin) green = good complementarity and red = bad complementarity
180˚ flip
EC surface of Streptavidin EC surface of Biotin
© CressetCONFIDENTIAL © CressetCONFIDENTIAL
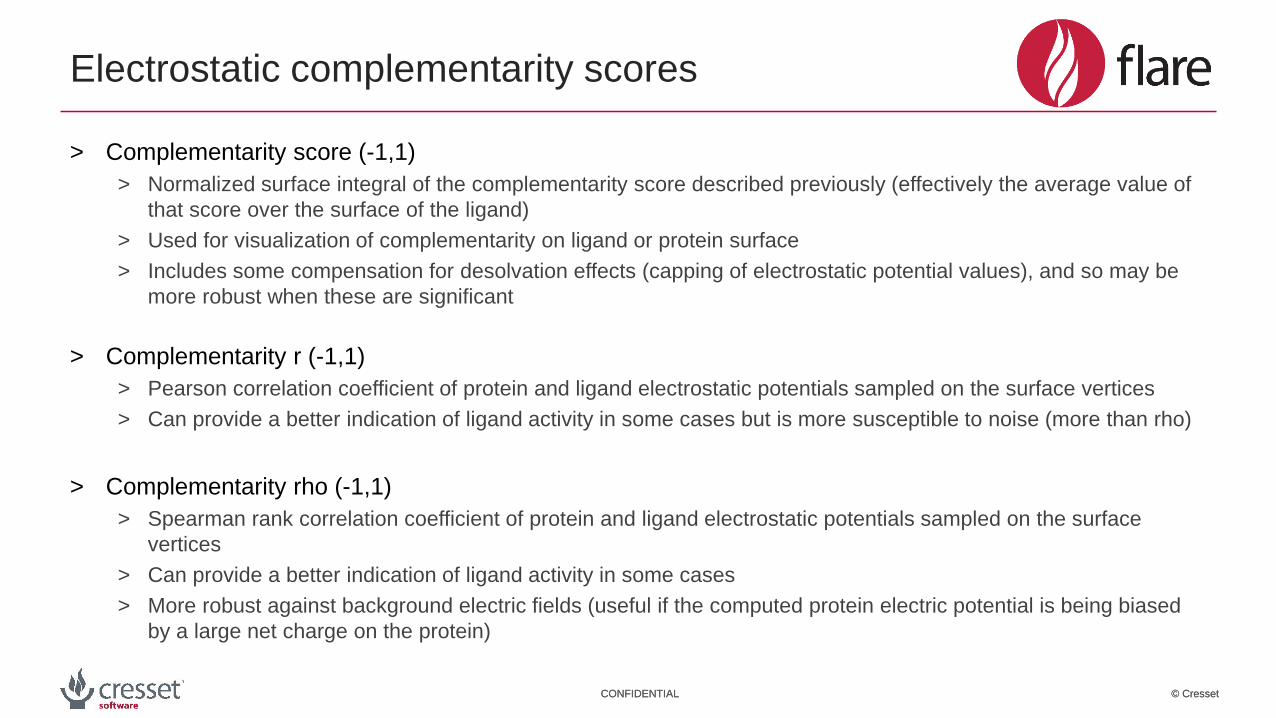
Electrostatic complementarity scores
> Complementarity score (-1,1)
> Normalized surface integral of the complementarity score described previously (effectively the average value of
that score over the surface of the ligand)
> Used for visualization of complementarity on ligand or protein surface
> Includes some compensation for desolvation effects (capping of electrostatic potential values), and so may be
more robust when these are significant
> Complementarity r (-1,1)
> Pearson correlation coefficient of protein and ligand electrostatic potentials sampled on the surface vertices
> Can provide a better indication of ligand activity in some cases but is more susceptible to noise (more than rho)
> Complementarity rho (-1,1)
> Spearman rank correlation coefficient of protein and ligand electrostatic potentials sampled on the surface
vertices
> Can provide a better indication of ligand activity in some cases
> More robust against background electric fields (useful if the computed protein electric potential is being biased
by a large net charge on the protein)
© CressetCONFIDENTIAL © CressetCONFIDENTIAL
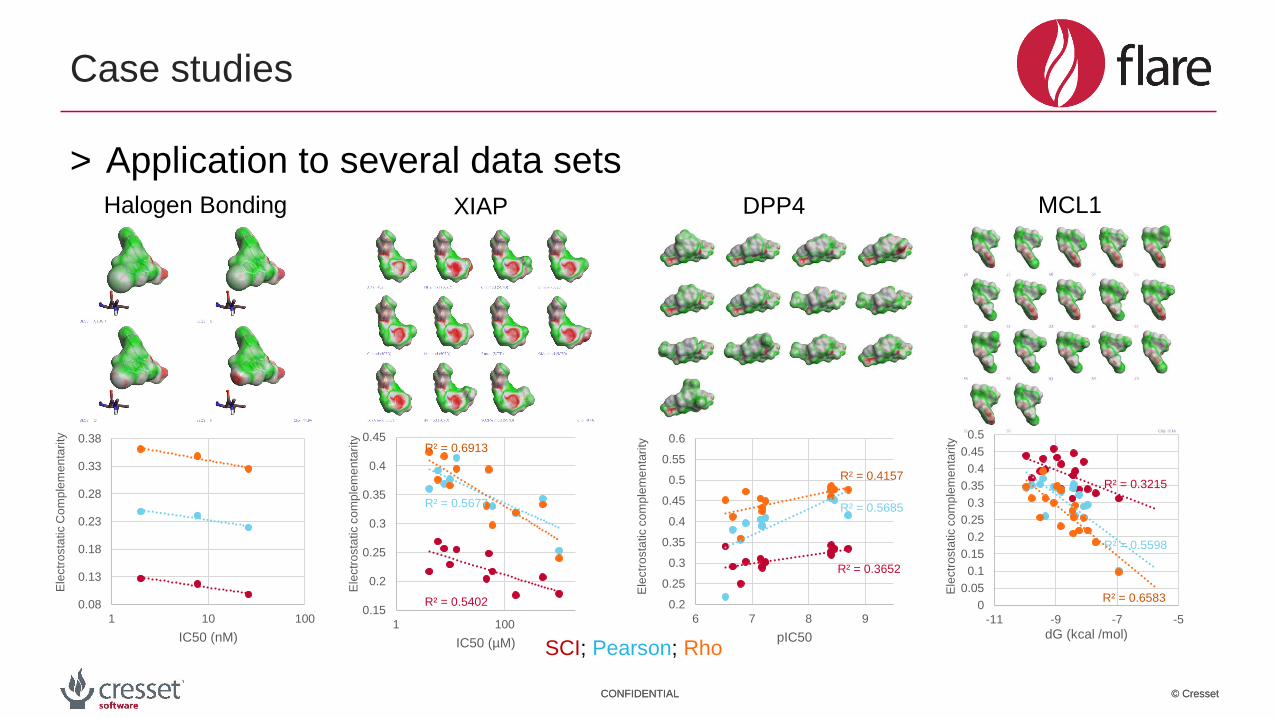
> Application to several data sets
Case studies
Halogen Bonding XIAP DPP4 MCL1
0.08
0.13
0.18
0.23
0.28
0.33
0.38
1 10 100
Ele
ctr
osta
tic C
om
ple
me
nta
rity
IC50 (nM)
R² = 0.5402
R² = 0.5677
R² = 0.6913
0.15
0.2
0.25
0.3
0.35
0.4
0.45
1 100
Ele
ctr
osta
tic c
om
ple
me
nta
rity
IC50 (µM)
R² = 0.3652
R² = 0.5685
R² = 0.4157
0.2
0.25
0.3
0.35
0.4
0.45
0.5
0.55
0.6
6 7 8 9
Ele
ctr
osta
tic c
om
ple
me
nta
rity
pIC50
R² = 0.3215
R² = 0.5598
R² = 0.65830
0.05
0.1
0.15
0.2
0.25
0.3
0.35
0.4
0.45
0.5
-11 -9 -7 -5
Ele
ctr
osta
tic c
om
ple
me
nta
rity
dG (kcal /mol)
SCI; Pearson; Rho

© CressetCONFIDENTIAL © CressetCONFIDENTIAL
Halogen Bonding example
> Concept
Wilcken et al. JMC 2013
Driven by the σ-hole
(anisotropy of electron
density on halogen)
C6H5F C6H5Cl
C6H5Br C6H5I
Hal as Lewis acid
Electron donor
> Interesting case for electrostatic interactions
> Sigma hole increases from CI to I
> Halogen bond strength increases from CI to I
© CressetCONFIDENTIAL © CressetCONFIDENTIAL
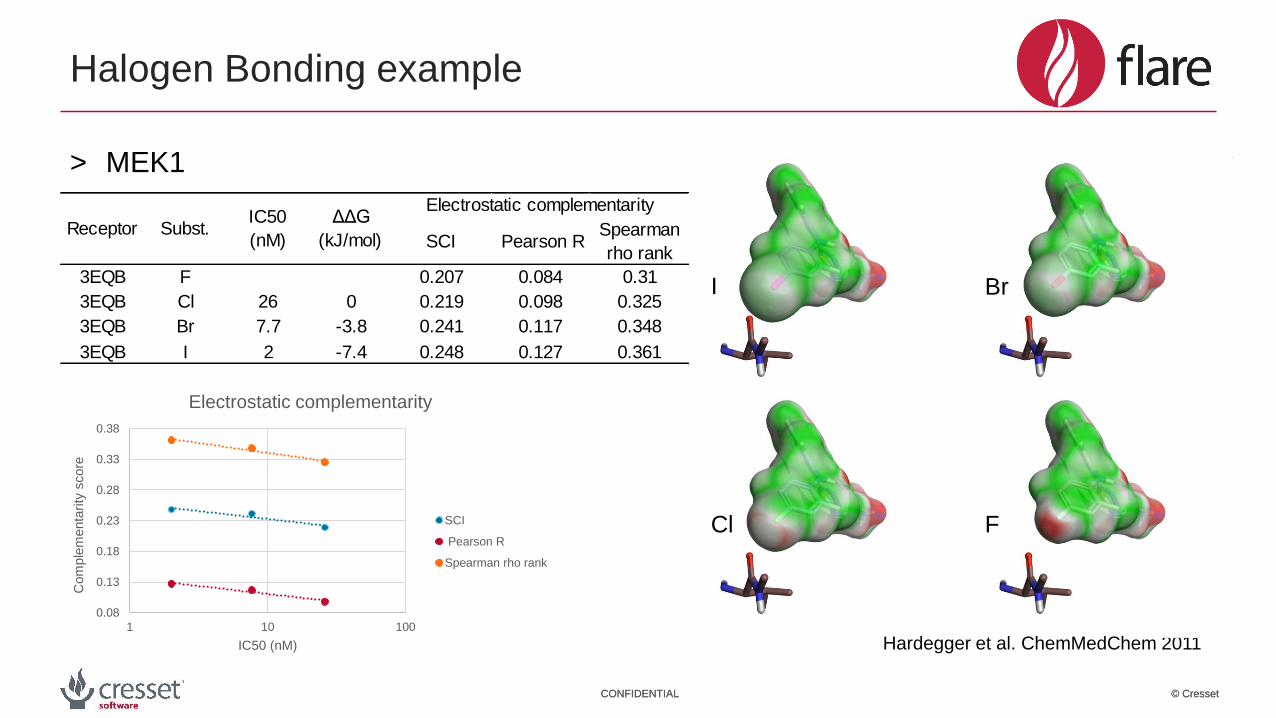
Halogen Bonding example
> MEK1
0.08
0.13
0.18
0.23
0.28
0.33
0.38
1 10 100
Com
ple
menta
rity
score
IC50 (nM)
Electrostatic complementarity
SCI
Pearson R
Spearman rho rank
Hardegger et al. ChemMedChem 2011
I Br
Cl F
SCI Pearson RSpearman
rho rank
3EQB F 0.207 0.084 0.31
3EQB Cl 26 0 0.219 0.098 0.325
3EQB Br 7.7 -3.8 0.241 0.117 0.348
3EQB I 2 -7.4 0.248 0.127 0.361
Electrostatic complementarityΔΔG
(kJ/mol)
IC50
(nM)Subst.Receptor

© CressetCONFIDENTIAL © CressetCONFIDENTIAL
> p53-Y220C example
Halogen Bonding example
> Cathepsin-L example
0.25
0.3
0.35
0.4
0.45
0.5
3 30Com
ple
menta
rity
score
IC50 (nM)
Hardegger et al. ChemMedChem 2011
0.3
0.35
0.4
0.45
0.5
0.55
100 1000 10000
Com
ple
menta
rity
score
KD (µM)
Wilcken et al. JMC Perspective 2013

© CressetCONFIDENTIAL © CressetCONFIDENTIAL
Halogen bioisosterism
> p53-Y220C: Ethynyl as halogen bioisostere
XED ESP surface
QM ESP surface
Similar electrostatic complementarity
I Ethynyl I Ethynyl
Wilcken et al. ACS Chem Biol 2015

© CressetCONFIDENTIAL © CressetCONFIDENTIAL
PDB 5C7D
XIAP data set
> Inhibitors against IAP proteins (PPI target)
reported by Chessari et al. (JMC 2015)
> Electrostatic optimization of indoline scaffold
(QM ESP analysis and Cresset field points)
> Using 5C7D as receptor and modeling of ligands

© CressetCONFIDENTIAL © CressetCONFIDENTIAL
XIAP case study
Ele
ctr
osta
tic
com
ple
menta
rity
Ele
ctr
osta
tic
com
ple
menta
rity
Ele
ctr
osta
tic
com
ple
menta
rity
IC50 (µM)
R² = 0.5402
0.15
0.17
0.19
0.21
0.23
0.25
0.27
0.29
1 10 100 1000
Complementarity SCI
R² = 0.5677
0.22
0.27
0.32
0.37
0.42
0.47
1 10 100 1000
ComplementarityPearson R
R² = 0.6913
0.2
0.25
0.3
0.35
0.4
0.45
1 10 100 1000
ComplementaritySpearman rho rank
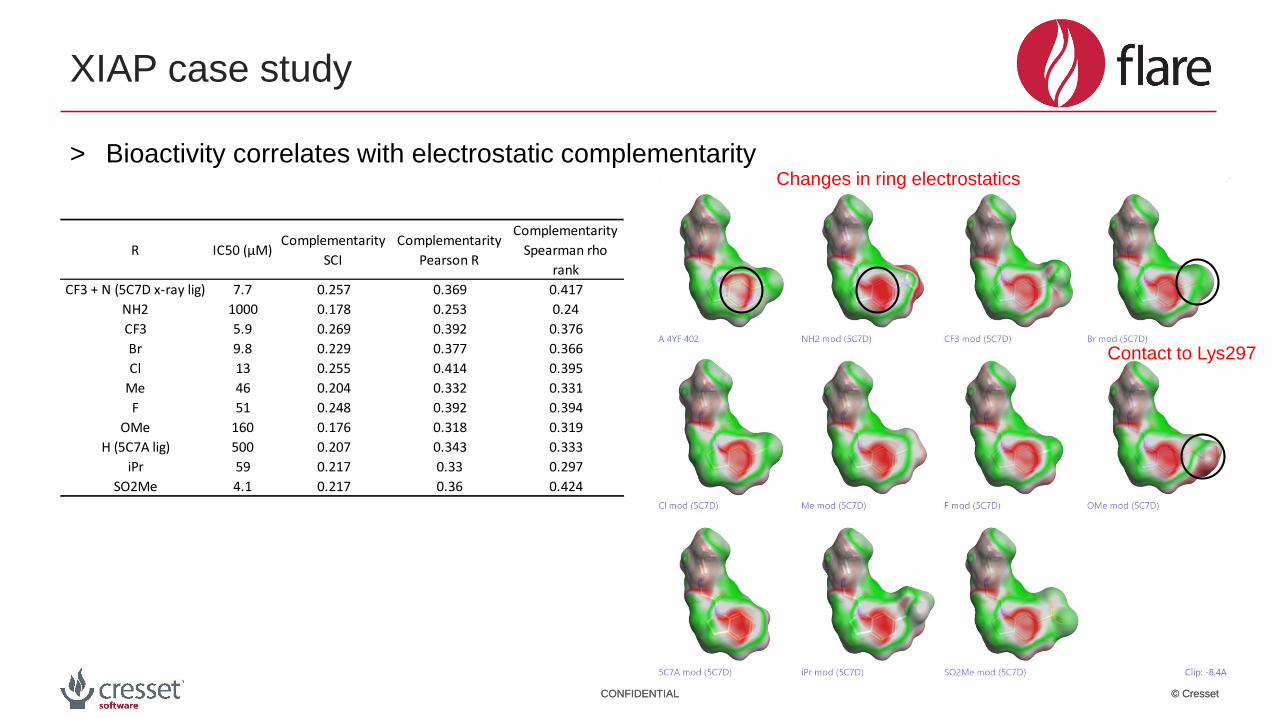
> Bioactivity correlates with electrostatic complementarity
R IC50 (µM)Complementarity
SCI
Complementarity
Pearson R
Complementarity
Spearman rho
rank
CF3 + N (5C7D x-ray lig) 7.7 0.257 0.369 0.417
NH2 1000 0.178 0.253 0.24
CF3 5.9 0.269 0.392 0.376
Br 9.8 0.229 0.377 0.366
Cl 13 0.255 0.414 0.395
Me 46 0.204 0.332 0.331
F 51 0.248 0.392 0.394
OMe 160 0.176 0.318 0.319
H (5C7A lig) 500 0.207 0.343 0.333
iPr 59 0.217 0.33 0.297
SO2Me 4.1 0.217 0.36 0.424
© CressetCONFIDENTIAL © CressetCONFIDENTIAL
XIAP case study
Changes in ring electrostatics
Contact to Lys297
> Bioactivity correlates with electrostatic complementarity
R IC50 (µM)Complementarity
SCI
Complementarity
Pearson R
Complementarity
Spearman rho
rank
CF3 + N (5C7D x-ray lig) 7.7 0.257 0.369 0.417
NH2 1000 0.178 0.253 0.24
CF3 5.9 0.269 0.392 0.376
Br 9.8 0.229 0.377 0.366
Cl 13 0.255 0.414 0.395
Me 46 0.204 0.332 0.331
F 51 0.248 0.392 0.394
OMe 160 0.176 0.318 0.319
H (5C7A lig) 500 0.207 0.343 0.333
iPr 59 0.217 0.33 0.297
SO2Me 4.1 0.217 0.36 0.424

© CressetCONFIDENTIAL © CressetCONFIDENTIAL
> Attractive (Cl or F) or
repulsive (NH2 or Me)
electrostatic interactions
with charged lysine 297
side chain
XIAP – electrostatic match with lysine side chain
NH2
F Me
Cl
© CressetCONFIDENTIAL © CressetCONFIDENTIAL
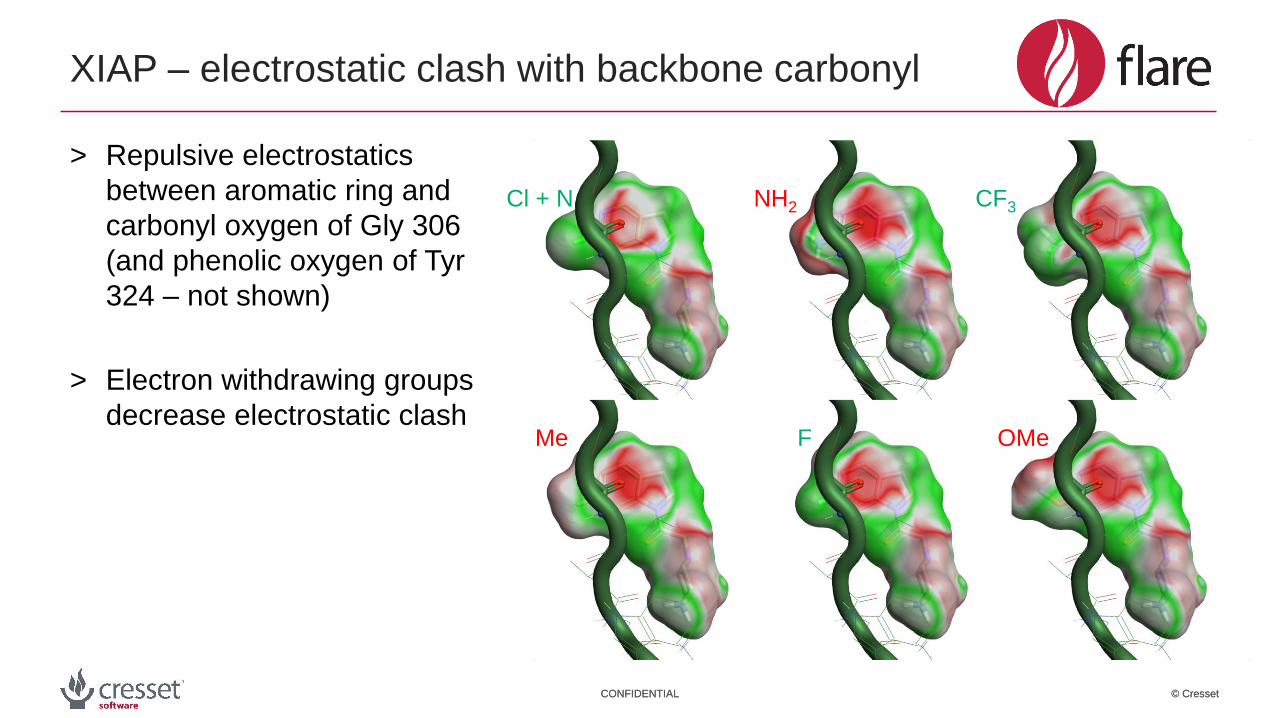
> Repulsive electrostatics
between aromatic ring and
carbonyl oxygen of Gly 306
(and phenolic oxygen of Tyr
324 – not shown)
> Electron withdrawing groups
decrease electrostatic clash
XIAP – electrostatic clash with backbone carbonyl
NH2
OMe
CF3
F Me
Cl + N

© CressetCONFIDENTIAL © CressetCONFIDENTIAL
DPP4 data set
Tyr547
‘Pendant’
> Data extracted from bindingDB(Kim et al. JMC 2008 and Kowalchick et al. Bioorg and Med Chem Letters 2007)
> Using 1X70 X-ray structure as receptor
> Subset of ligands that make contact to Tyr 547 and alignment using a modified reference ligand

© CressetCONFIDENTIAL © CressetCONFIDENTIAL
DPP4 case study
compound ID pIC50 Complementarity
SCI
Complementarity
Pearson R
Complementarity
Spearman rho
rank
73 6.66 0.291 0.38 0.411
69 7.18 0.288 0.388 0.425
71 6.89 0.303 0.396 0.472
72 6.8 0.25 0.356 0.359
70 7.18 0.292 0.391 0.433
65 7.15 0.31 0.405 0.455
62 8.7 0.334 0.415 0.476
68 8.46 0.334 0.451 0.477
64 8.4 0.319 0.455 0.46
74 8.4 0.335 0.476 0.474
66 8.4 0.328 0.473 0.476
46 7.24 0.302 0.409 0.449
75 6.53 0.34 0.218 0.451
pIC50
Ele
ctr
osta
tic
com
ple
menta
rity
Ele
ctr
osta
tic
com
ple
menta
rity
Ele
ctr
osta
tic
com
ple
menta
rity
R² = 0.3652
0.24
0.26
0.28
0.3
0.32
0.34
0.36
6 7 8 9
Complementarity SCI
R² = 0.5685
0.2
0.3
0.4
0.5
0.6
6 7 8 9
ComplementarityPearson R
R² = 0.4157
0.34
0.36
0.38
0.4
0.42
0.44
0.46
0.48
0.5
6 7 8 9
Complementa…
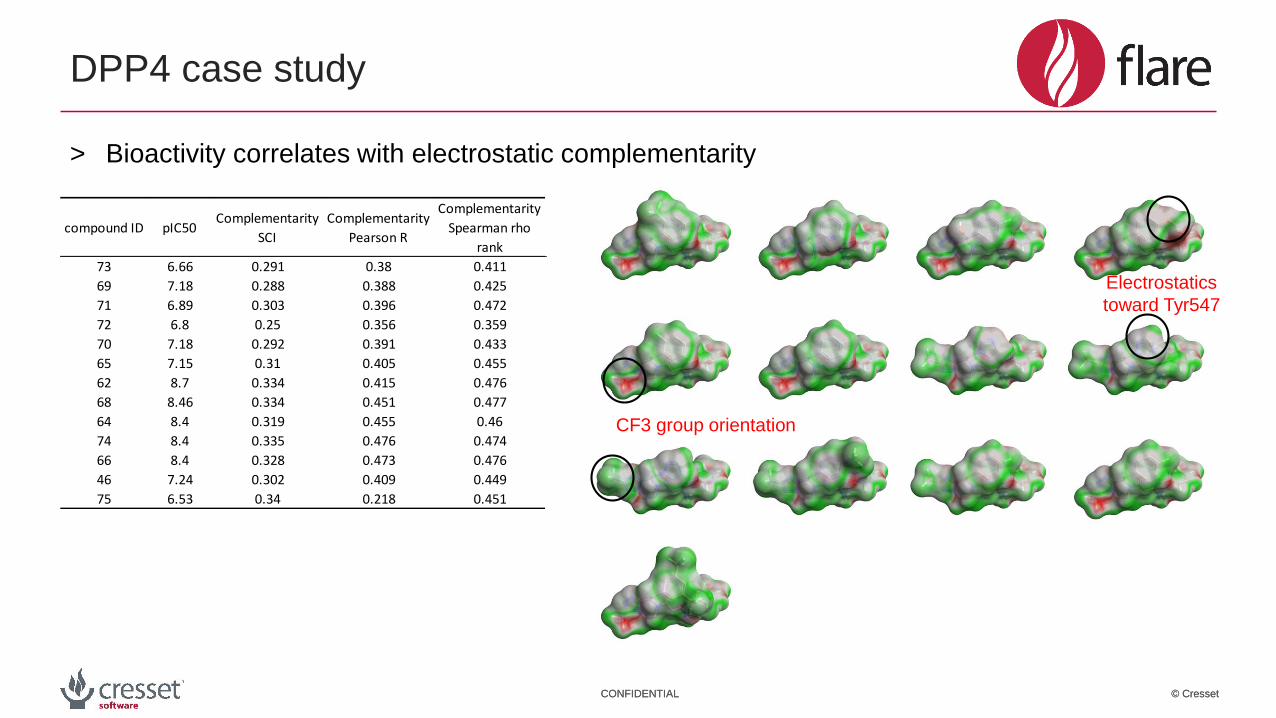
> Bioactivity correlates with electrostatic complementarity
© CressetCONFIDENTIAL © CressetCONFIDENTIAL
DPP4 case study
CF3 group orientation
Electrostatics
toward Tyr547
compound ID pIC50 Complementarity
SCI
Complementarity
Pearson R
Complementarity
Spearman rho
rank
73 6.66 0.291 0.38 0.411
69 7.18 0.288 0.388 0.425
71 6.89 0.303 0.396 0.472
72 6.8 0.25 0.356 0.359
70 7.18 0.292 0.391 0.433
65 7.15 0.31 0.405 0.455
62 8.7 0.334 0.415 0.476
68 8.46 0.334 0.451 0.477
64 8.4 0.319 0.455 0.46
74 8.4 0.335 0.476 0.474
66 8.4 0.328 0.473 0.476
46 7.24 0.302 0.409 0.449
75 6.53 0.34 0.218 0.451
> Bioactivity correlates with electrostatic complementarity

© CressetCONFIDENTIAL © CressetCONFIDENTIAL
> Orientation of CF3 group
leads to attractive or
partially repulsive
electrostatic interactions in
proximity to Arg 358
DPP4 – orientation of trifluoromethyl group
Compound 74
pIC50 = 8.4
SCI = 0.343
Pearson = 0.479
Compound 46
pIC50 = 7.24
SCI = 0.302
Pearson = 0.409
Arg 358 Arg 358

© CressetCONFIDENTIAL © CressetCONFIDENTIAL
> Repulsive electrostatics
between Methoxy group and
phenol ring of Tyr 547
> F substituent shows a
smaller electrostatic clash
than OMe group
DPP4 – electrostatic match with Tyrosine
Compound 72
pIC50 = 6.8
SCI = 0.25
Pearson = 0.356
Compound 70
pIC50 = 7.18
SCI = 0.292
Pearson = 0.391
Tyr 547 Tyr 547

© CressetCONFIDENTIAL © CressetCONFIDENTIAL
C-H…π
interactions with
Tyr547
DPP4 – orientation of imidazole group
Alt. Cmpd. 62
SCI = 0.334
Rho = 0.476
Compound 62
SCI = 0.323
Rho = 0.456
> Reference alignment does
not provide information for
orientation of imidazole
> Orientation of imidazole
ring changes
complementarity score
> electrostatic
complementarity can help
to identify the most likely
rotamer / binding
conformation

© CressetCONFIDENTIAL © CressetCONFIDENTIAL
MCL1 data set
> MCL1 data set part of Schrodinger FEP benchmark (Wang et al. JACS 2015)
> 6B4L X-ray structure as receptor and X-ray ligand used as reference for Forge™ alignment
© CressetCONFIDENTIAL © CressetCONFIDENTIAL
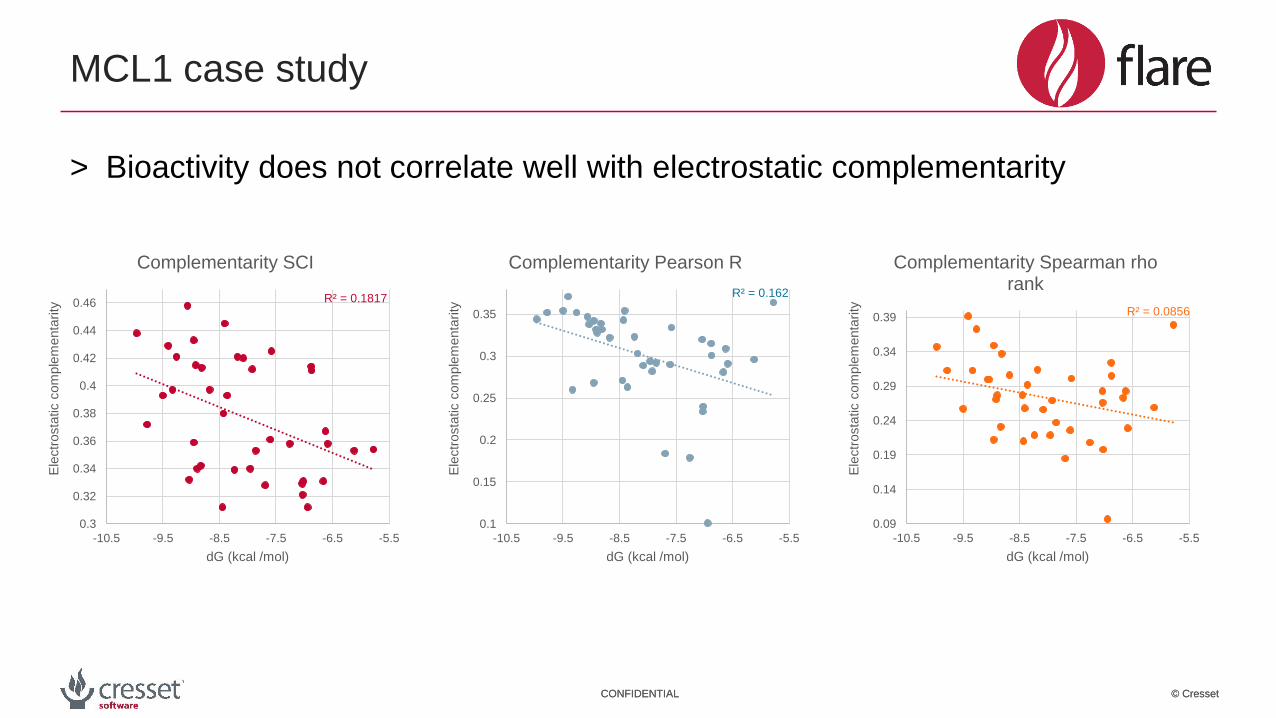
MCL1 case study
R² = 0.1817
0.3
0.32
0.34
0.36
0.38
0.4
0.42
0.44
0.46
-10.5 -9.5 -8.5 -7.5 -6.5 -5.5
Ele
ctr
osta
tic c
om
ple
menta
rity
dG (kcal /mol)
Complementarity SCI
R² = 0.162
0.1
0.15
0.2
0.25
0.3
0.35
-10.5 -9.5 -8.5 -7.5 -6.5 -5.5
Ele
ctr
osta
tic c
om
ple
menta
rity
dG (kcal /mol)
Complementarity Pearson R
R² = 0.0856
0.09
0.14
0.19
0.24
0.29
0.34
0.39
-10.5 -9.5 -8.5 -7.5 -6.5 -5.5
Ele
ctr
osta
tic c
om
ple
menta
rity
dG (kcal /mol)
Complementarity Spearman rho rank
> Bioactivity does not correlate well with electrostatic complementarity
© CressetCONFIDENTIAL © CressetCONFIDENTIAL
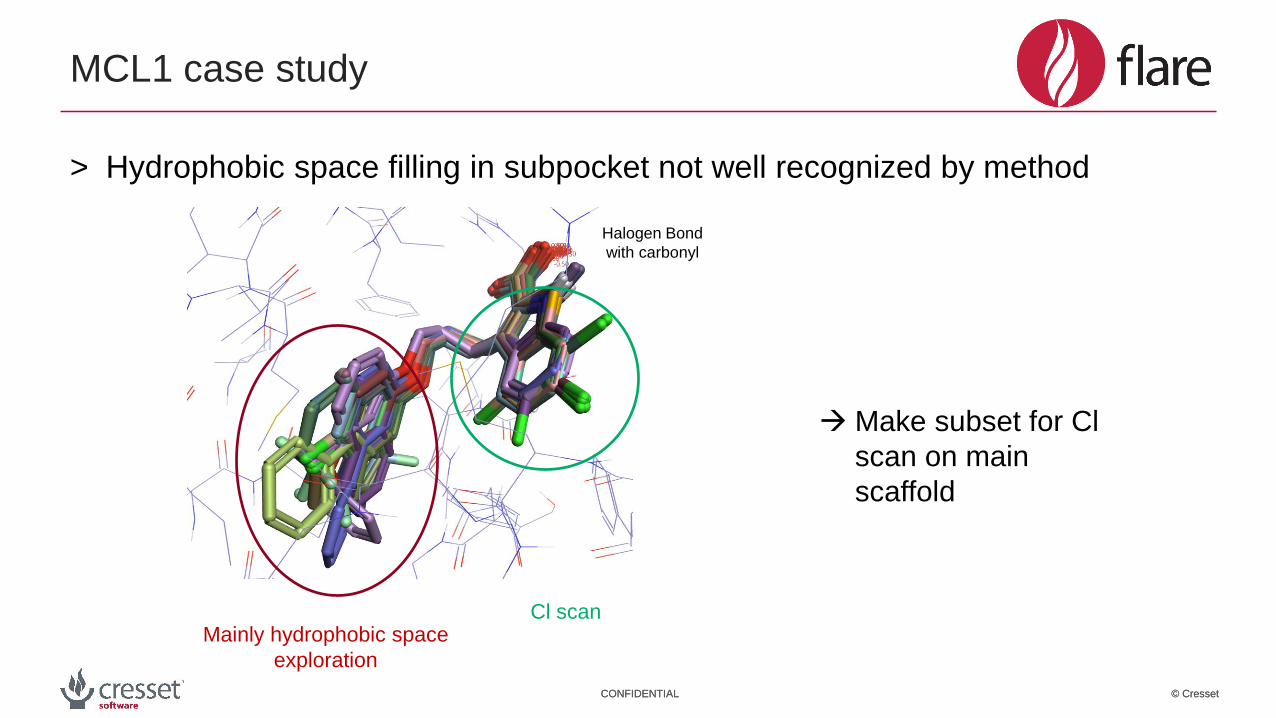
MCL1 case study
Mainly hydrophobic space
exploration
Cl scan
Halogen Bond
with carbonyl
Make subset for Cl
scan on main
scaffold
> Hydrophobic space filling in subpocket not well recognized by method
© CressetCONFIDENTIAL © CressetCONFIDENTIAL
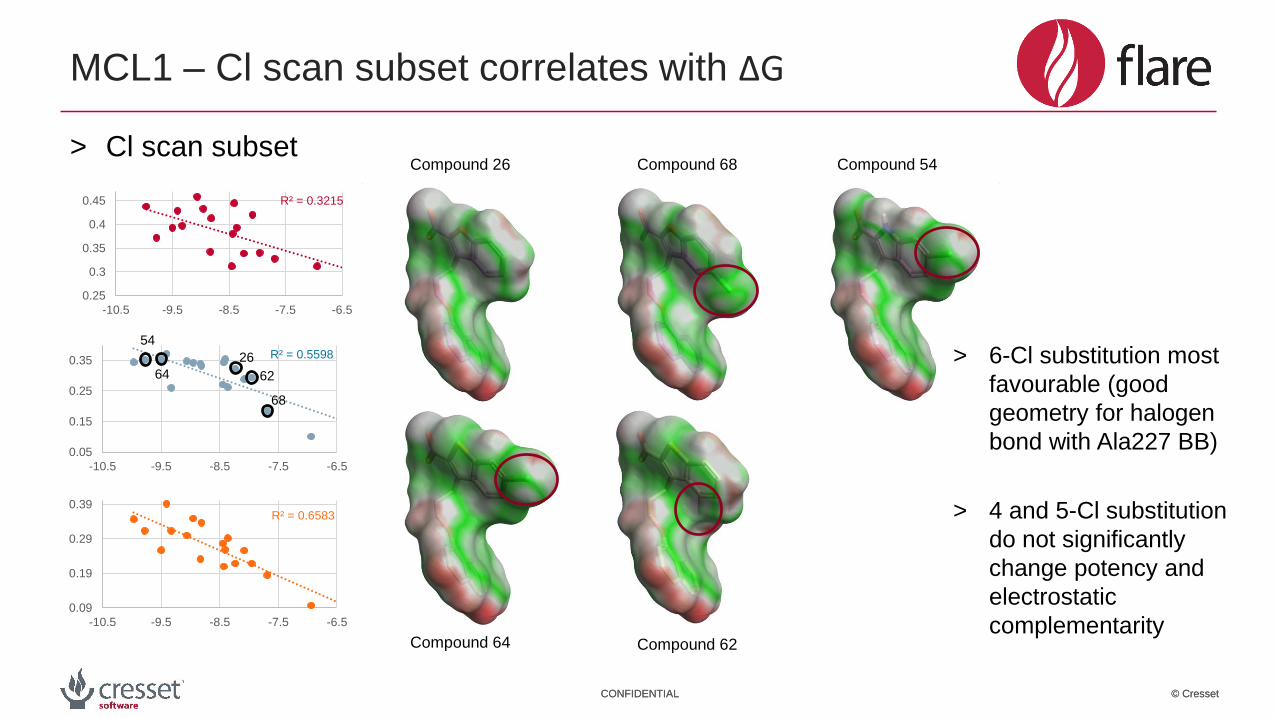
MCL1 – Cl scan subset correlates with ΔG
> Cl scan subset
R² = 0.3215
0.25
0.3
0.35
0.4
0.45
-10.5 -9.5 -8.5 -7.5 -6.5
R² = 0.5598
0.05
0.15
0.25
0.35
-10.5 -9.5 -8.5 -7.5 -6.5
> 6-Cl substitution most
favourable (good
geometry for halogen
bond with Ala227 BB)
> 4 and 5-Cl substitution
do not significantly
change potency and
electrostatic
complementarity
Compound 68 Compound 54Compound 26
Compound 64 Compound 62
26
68
64 62
54
R² = 0.6583
0.09
0.19
0.29
0.39
-10.5 -9.5 -8.5 -7.5 -6.5
© CressetCONFIDENTIAL © CressetCONFIDENTIAL
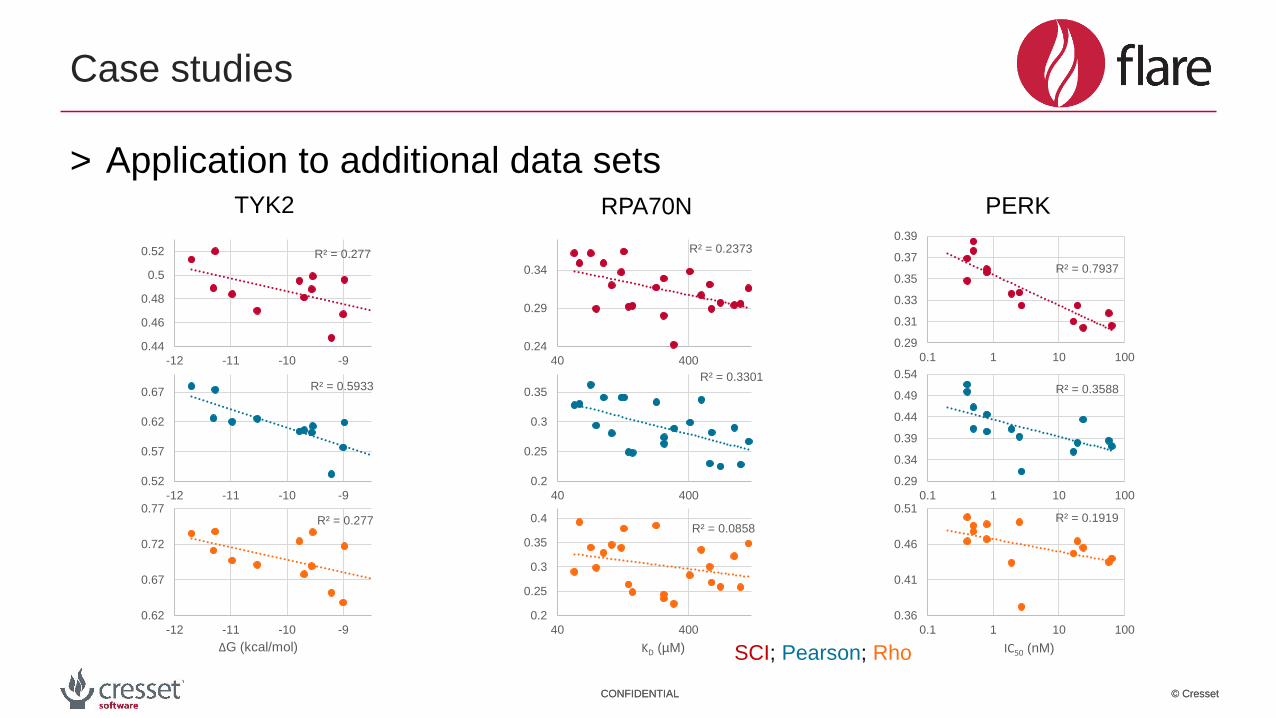
> Application to additional data sets
Case studies
TYK2 RPA70N PERK
SCI; Pearson; RhoΔG (kcal/mol) KD (µM) IC50 (nM)
R² = 0.7937
0.29
0.31
0.33
0.35
0.37
0.39
0.1 1 10 100
R² = 0.3588
0.29
0.34
0.39
0.44
0.49
0.54
0.1 1 10 100
R² = 0.1919
0.36
0.41
0.46
0.51
0.1 1 10 100
R² = 0.277
0.44
0.46
0.48
0.5
0.52
-12 -11 -10 -9
R² = 0.5933
0.52
0.57
0.62
0.67
-12 -11 -10 -9
R² = 0.277
0.62
0.67
0.72
0.77
-12 -11 -10 -9
R² = 0.2373
0.24
0.29
0.34
40 400
R² = 0.3301
0.2
0.25
0.3
0.35
40 400
R² = 0.0858
0.2
0.25
0.3
0.35
0.4
40 400

© CressetCONFIDENTIAL © CressetCONFIDENTIAL
> Meaningful assessment of electrostatic complementarity at low computational costs (< 1 second per molecule on a desktop workstation)
> Possible to rank bioactivities of ligands (provided electrostatics play a main role in affinity changes)
> Caveats: does not calculate free energy of binding ΔG (desolvation, cavity term and space filling, entropic contributions, conformational effects missing); orthogonal multipolar interactions (fluorine bonding)
> Additional validation and future research: Improved handling of solvent exposed areas, rescoring of docking results, evaluation of and comparison to ab initio approaches
Conclusion and Outlook

© CressetCONFIDENTIAL © CressetCONFIDENTIAL
cressetgroup
Thank you for your attention
Acknowledgements:
Mark Mackey
Paolo Tosco
Giovanna Tedesco
Tim Cheeseright
Andy Vinter