
PREDATORY LENDING AND THE SUBPRIME CRISIS · to test whether predatory lending was a key element in...
56
NBER WORKING PAPER SERIES PREDATORY LENDING AND THE SUBPRIME CRISIS Sumit Agarwal Gene Amromin Itzhak Ben-David Souphala Chomsisengphet Douglas D. Evanoff Working Paper 19550 http://www.nber.org/papers/w19550 NATIONAL BUREAU OF ECONOMIC RESEARCH 1050 Massachusetts Avenue Cambridge, MA 02138 October 2013 We thank Caitlin Kearns for outstanding research assistance. We thank Amit Seru and an anonymous referee for important and insightful comments. Thanks are also due to participants at numerous conferences and seminars for their helpful feedback. Ben-David’s research is supported by the Dice Center and the Neil Klatskin Chair in Finance and Real Estate. The views in this paper are those of the authors and may not reflect those of the Federal Reserve System, the Federal Reserve Bank of Chicago, the Office of the Comptroller of the Currency, or the National Bureau of Economic Research. NBER working papers are circulated for discussion and comment purposes. They have not been peer- reviewed or been subject to the review by the NBER Board of Directors that accompanies official NBER publications. © 2013 by Sumit Agarwal, Gene Amromin, Itzhak Ben-David, Souphala Chomsisengphet, and Douglas D. Evanoff. All rights reserved. Short sections of text, not to exceed two paragraphs, may be quoted without explicit permission provided that full credit, including © notice, is given to the source.
Transcript of PREDATORY LENDING AND THE SUBPRIME CRISIS · to test whether predatory lending was a key element in...

NBER WORKING PAPER SERIES
PREDATORY LENDING AND THE SUBPRIME CRISIS
Sumit AgarwalGene Amromin
Itzhak Ben-DavidSouphala Chomsisengphet
Douglas D. Evanoff
Working Paper 19550http://www.nber.org/papers/w19550
NATIONAL BUREAU OF ECONOMIC RESEARCH1050 Massachusetts Avenue
Cambridge, MA 02138October 2013
We thank Caitlin Kearns for outstanding research assistance. We thank Amit Seru and an anonymousreferee for important and insightful comments. Thanks are also due to participants at numerous conferencesand seminars for their helpful feedback. Ben-David’s research is supported by the Dice Center andthe Neil Klatskin Chair in Finance and Real Estate. The views in this paper are those of the authorsand may not reflect those of the Federal Reserve System, the Federal Reserve Bank of Chicago, theOffice of the Comptroller of the Currency, or the National Bureau of Economic Research.
NBER working papers are circulated for discussion and comment purposes. They have not been peer-reviewed or been subject to the review by the NBER Board of Directors that accompanies officialNBER publications.
© 2013 by Sumit Agarwal, Gene Amromin, Itzhak Ben-David, Souphala Chomsisengphet, and DouglasD. Evanoff. All rights reserved. Short sections of text, not to exceed two paragraphs, may be quotedwithout explicit permission provided that full credit, including © notice, is given to the source.
Predatory Lending and the Subprime CrisisSumit Agarwal, Gene Amromin, Itzhak Ben-David, Souphala Chomsisengphet, and DouglasD. EvanoffNBER Working Paper No. 19550October 2013JEL No. D14,D18
ABSTRACT
We measure the effect of an anti-predatory pilot program (Chicago, 2006) on mortgage default ratesto test whether predatory lending was a key element in fueling the subprime crisis. Under the program,risky borrowers and/or risky mortgage contracts triggered review sessions by housing counselors whoshared their findings with the state regulator. The pilot cut market activity in half, largely throughthe exit of lenders specializing in risky loans and through decline in the share of subprime borrowers.Our results suggest that predatory lending practices contributed to high mortgage default rates amongsubprime borrowers, raising them by about a third.
Sumit AgarwalAssociate Professor of Finance and Real EstateNUS Business SchoolMochtar Raidy Building, BIZ115 Kent Ridge RoadSingapore, [email protected]
Gene AmrominFederal Reserve Bank of Chicago230 South LaSalle StreetChicago, IL [email protected]
Itzhak Ben-DavidFisher College of BusinessThe Ohio State University2100 Neil AvenueColumbus, OH 43210and [email protected]
Souphala Chomsisengphet Office of the Comptroller of the Currency Department of Treasury Washington, DC. [email protected]
Douglas D. Evanoff Federal Reserve Bank of Chicago 230 South LaSalle Street Chicago, IL 60604-1413 [email protected]
2
1. Introduction
Predatory lending has been the focus of intense academic and policy debate surrounding
the recent housing crisis. Predatory lending—commonly defined as imposing unfair and abusive
loan terms on borrowers, often through aggressive sales tactics, or loans that contain terms and
conditions that ultimately harm borrowers (GAO, 2004; FDIC, 2006)—has also captured much
media attention and appears to be a major concern for borrowers.1 While all agree that mortgages
with abusive terms are costly to borrowers and to taxpayers, the extent of the phenomenon is
hard to quantify and is politically charged (e.g., Agarwal and Evanoff, 2013; Engel and McCoy,
2007). Several journalistic accounts and industry reports take the position that predatory lending
had a central role in creating and feeding the housing bubble, particularly through subprime loan
originations (e.g., the Financial Crisis Inquiry Commission, 2010; Hudson, 2010; Center for
Responsible Lending, 2009). To our knowledge, there is no systematic evidence to date
measuring the effect of predatory lending on mortgage performance. Our paper attempts to fill
this gap.
In academic literature, predatory lending is modeled as cases in which lenders possess
private information about borrowers’ future ability to repay loans and encourage mortgages with
terms that borrowers cannot afford (Bond, Musto, and Yilmaz, 2009). This model clearly
portrays the empirical challenge in measuring predatory lending: because it is difficult to observe
lenders’ informational advantage over borrowers, it is hard to measure the size of the
phenomenon and assess its role in precipitating the subprime mortgage crisis.
In this paper, we attempt to overcome this challenge by analyzing the effects of a pilot
anti-predatory legislative program implemented in Chicago near the peak of the real-estate
boom. The pilot required “low-credit-quality” applicants and applicants for “risky” mortgages to
submit their loan offers from state-licensed lenders for third-party review by HUD-certified
financial counselors. As described in greater detail below, the fact that the pilot applied only in
certain areas during a specific time period, only to certain borrower and mortgage contract
1 Guiso, Sapienza, and Zingales (2013) find that about half of surveyed borrowers would be willing to strategically default on their mortgage should they discover that their lender was involved in predatory lending.

3
combinations, and only to a specific set of lenders allows us to parse out its effect on the
availability of mortgage credit with predatory characteristics and to evaluate ex post mortgage
performance. The study draws on detailed loan-level data from public and proprietary sources, as
well as data provided by one of the largest counseling agencies involved in the pilot.
Our empirical strategy is based on classic difference-in-differences analysis that contrasts
changes in mortgage market composition and loan performance in the treated sample with those
in a control sample. Unlike bacteria in a petri dish, lenders and borrowers could respond to the
mandated treatment either by leaving the pilot area or by adapting to the new rules. Hence, we
pay particular attention to endogenous selection of lenders and borrowers out of treatment. If
predatory lending resulted in significantly higher default rates and thus precipitated the crisis, we
should observe a significant reduction in default rates in the targeted market as predatory lending
declined.
We find that following passage of the legislative pilot, the number of active lenders
declined disproportionately in the target geographic area. The decline was particularly
pronounced among state-licensed lenders that specialized in the origination of subprime loans,
many of which included contract features deemed objectionable by the legislation. Nearly half of
the state-licensed lenders exited the pilot zip codes, more than double the exit rate in the control
areas. The remaining lenders made fewer risky loans and originated credit to borrowers with
higher credit quality. Specifically, we show that the volumes of loan applications and
originations by state-licensed lenders in the pilot area declined by 51% and 61%, respectively.
The average FICO score of borrowers who were able to obtain credit during the pilot period was
8 points higher (15% of one standard deviation).
The resulting mortgages issued in the pilot area were less likely to feature “risky”
characteristics (as defined by legislators) that would subject them to counselor review. For
instance, there were fewer loans with negative amortization or prepayment penalties, as well as
fewer low-documentation and low down-payment loans. This set of findings suggests, therefore,

4
that the legislation had a deep impact on market activity and likely drove much of the predatory
lending activity from the market.
Yet, although the pilot dramatically affected market activity, it had a relatively moderate
effect on borrower default rates. When we restrict our analysis to the subset of market
participants directly targeted by the pilot—subprime borrowers and state-licensed lenders—we
find improvements in 18-month default rates of 6 to 7 percentage points, relative to the
unconditional default rate of 27%. Moreover, all of the statistically measurable improvement in
loan performance came from changes in the composition of lenders, many of whom were driven
out by the legislation. These estimates suggest that while predatory lending contributed to high
default rates, it may have not been as instrumental in precipitating the financial crisis as
popularly believed.
In practice, it may be difficult to distinguish predatory lending practices from merely
“aggressive” ones. To make headway in separating the two, we exploit another feature of the
anti-predatory program. The heart of the HB4050 pilot was the imposition of a mortgage review
requirement for risky borrowers and for those who chose risky loans. During the review,
counselors identified loans that were suspected of having predatory characteristics, e.g., loans
with above-market rates, loans appearing to be unaffordable based on borrower characteristics,
and loans with indications of fraud. We analyze a sample of 121 loans for which we have
detailed counselor assessment data.2 We conjecture that loans that were flagged as predatory and
yet were pursued by borrowers (i.e., borrowers ignored the counselors’ advice) were more likely
to default relative to non-flagged loans. Indeed, we find that these predatory loans had 18-month
delinquency rates that were 6.5 percentage points higher than nonflagged loans. The difference
in delinquency rates was even higher for loans with fraud indicia, which had a 12.3 percentage
point differential.
2 For an in-depth analysis of the role of mortgage counseling, see Agarwal, Amromin, Ben-David, Chomsisengphet, and Evanoff (2010, 2012).

5
Our findings have important implications for policymakers. First, the pilot program was a
blunt policy tool that swept up a wide swath of borrowers, lenders, and products and caused
substantial market disruption. Second, despite the measureable improvements in mortgage
performance in the subpopulation most affected by the pilot, default rates remained alarmingly
high, suggesting that predatory lending practices may have played a relatively limited role in
triggering the crisis. In fact, because some of the loans eliminated by the pilot may have been
aggressive rather than predatory, we are likely to be overstating the effect of predatory lending
practices. Third, evaluation of welfare gains or losses stemming from such policy programs is
fraught with difficulties, many of which are exacerbated by the distortions that exist in housing
markets. Our paper does not attempt to gauge the welfare consequences of the pilot, and
policymakers should be aware that such consequences are difficult to measure. Finally, the
HB4050 pilot demonstrates the political difficulty of implementing policies that “lean” against
asset bubbles.3 Specifically, interest groups (real-estate professionals as well as community
activists) protested against the legislation. Both groups viewed the preceding run-up in real-
estate prices as an opportunity for their constituents to achieve their goals (profits or housing
access), and they therefore perceived the legislation as harmful.
Our paper relates to two strands of the literature. The first explores the role of
intermediaries in precipitating the financial crisis. Keys et al. (2010) show that securitization
leads to lax screening by mortgage lenders. Ben-David (2011, 2012) finds that intermediaries
expanded the mortgage market by enabling otherwise ineligible borrowers to misrepresent asset
valuations to obtain larger loans, and by pushing buyers to overpay for properties. Rajan, Seru,
and Vig (2013) show that soft information about borrowers is lost as the chain of intermediaries
in the origination process becomes longer, leading to a decline in the quality of originated
mortgages. Finally, see Agarwal and Ben-David (2013) who study the role of loan officer
compensation leading up to the financial crisis.
3 As discussed in detail in Section 2.2, the program was terminated early, providing further evidence of the high cost of identifying predatory lending—the regulators could not withstand the political pressure associated with implementing the program.

6
The second strand of the literature studies predatory lending in personal finance. In
particular, researchers have focused on the debate about whether payday lending helps or
exploits borrowers. Morse (2011) shows that borrowers in areas with payday lending are more
resilient to natural disasters. In contrast, Melzer (2011) uses cross-border variation and finds no
evidence that payday lending alleviates hardship. Bertrand and Morse (2011) find that providing
additional information about loans to payday borrowers reduces loan take-up. Agarwal, Skiba,
and Tobacman (2009) show that payday borrowers preserve access to formal credit through their
credit cards while paying very high interest rates on their payday loans.
2. Illinois Predatory Lending Database Pilot Program (HB4050)
2.1. Description of the Pilot Program
In 2005, the Illinois legislature passed a bill intended to curtail predatory lending.
Although the state had a number of anti-predatory provisions in place, like prevailing practices
elsewhere in the country, they were based on loan characteristics. Some political leaders in
Illinois became concerned about the ease with which lenders could avoid the trigger criteria of
anti-predatory programs by creatively packaging their loans. For instance, balloon mortgages
targeted by regulations were replaced with adjustable rate mortgages (ARMs) with short fixed-
rate periods and steep rate reset slopes (the so-called 2/28 and 3/27 hybrid ARMs).4
Consequently, the new bill included a new enforcement mechanism and tougher penalties for
noncompliance. It also sought to educate borrowers prior to closing on their new mortgage loans.
To that effect, the legislation sponsored by Illinois House Speaker Michael Madigan
mandated review of mortgage offers for “high-risk borrowers” by HUD-certified housing
counselors. High-risk borrowers were defined as applicants with sufficiently low credit scores or
sufficiently risky product choices. The legislation set the FICO score threshold for mandatory
counseling at 620, with an additional provision that borrowers with FICO scores in the 621–650
4 For a detailed analysis of the impact of the state anti-predatory lending laws on the type of mortgage products used in the market, see Bostic et al. (2012).

7
range receive counseling if they chose what the regulation defined as high-risk mortgage
products. Such mortgages included interest-only loans, loans with interest rate adjustments
within three years, loans underwritten on the basis of stated income (low-documentation loans),
and repeated refinancings within the past 12 months (Category I loans). Borrowers were subject
to counseling regardless of their FICO score if they took out loans that allowed negative
amortization, had prepayment penalties, or had closing costs in excess of 5% (Category II loans).
The proposal was modeled on a Federal Housing Administration (FHA) program from the
1970s,5 and it generated a lot of excitement among Illinois lawmakers, who passed House Bill
4050 (HB4050) on the last day of the 2005 legislative session. HB4050 applied only to loans
offered by state-licensed mortgage lenders, as the state lacks legal authority to regulate federally
chartered institutions and generally exempts them from mortgage licensing requirements.
Furthermore, HB4050 applied only to select neighborhoods, namely, ten zip codes on the City of
Chicago’s South Side.
The need for a high-risk borrower counseling session was determined on the day of the
application, and the borrower had ten days to contact the agency to schedule it. The lender was
required to cover the $300 cost of the session. The goal of these sessions, lasting one to two
hours, was to discuss the terms of the specific offer for a home purchase or refinancing loan and
to explain their meaning and consequences to the prospective borrower. The counselors were not
supposed to advise borrowers about their optimal mortgage choice in the sense of Campbell and
Cocco (2003); rather, they were to warn them against common pitfalls. The counselors were also
expected to verify the loan application information about the borrower (e.g., income and
expenses). None of the recommendations was binding—borrowers could always choose to
proceed with the loan offer at hand.
At the end of the session, the counselor recorded a number of findings in a state-
administered database. These included whether the lender charged excessive fees, whether the
5 See “Illinois Tries New Tack Against Predatory Loans” by Amy Merrick, Wall Street Journal Online, 21 August 2007, http://online.wsj.com/article/SB118765937527803664.html.

8
loan interest rate was in excess of the market rate, whether the borrower understood the
transaction and/or could afford the loan, and so forth. Even though HB4050 established the
database for pilot evaluation purposes, lenders feared that the state’s collection of this
information could lead to potential regulatory (e.g., license revocation) or legal (e.g., class-action
lawsuits) actions.
As another direct penalty for noncompliance, lenders lost the right to foreclose on a
delinquent property. Under HB4050, title companies did not receive a “safe harbor” provision
for “good faith compliance with the law.” As a result, clerical errors at any point in the loan
application process could potentially invalidate the title, making the lender unable to pursue
foreclosure.6,7 Finally, lenders reportedly feared losing some of their ability to steer borrowers
toward high margin products.
The new regulation imposed costs on borrowers as well. Even though session fees had to
be borne by the lender, anecdotal evidence suggests brokers attempted to pass them on to
borrowers in the form of higher closing costs and administrative charges (Bates and Van Zandt,
2007, and personal communication with mortgage counselors). HB4050 also imposed time costs
on borrowers. By lengthening the expected time until closing, the new law could force borrowers
to pay for longer credit lock periods, further raising loan costs.
Both the counseling session and the independent collection of borrower data allowed
counselors to form their own assessment of the borrower’s creditworthiness. Effectively, the
counselors were able to elicit private information that may or may not have been used by lenders
6 According to the Cook County Recorder of Deeds, even federally regulated lenders had to procure a certificate of exemption from HB4050 to obtain a clean title. Consequently, all lenders were affected to at least some degree by the legislation. 7 This feature of HB4050 caused some investors to warn about their willingness to purchase loans originated in pilot zip codes. Most of these warnings stipulated that to be eligible for purchase, a loan had to receive a certificate of counseling or of exemption from counseling. However, the presence of one of these certificates was a requirement for loan closing and recording, which itself is a prerequisite for sale or securitization under standard purchase criteria. It is thus unclear whether would-be investors had any additional reasons to worry about recorded loans under HB4050. In any event, the share of securitized loans in the treated zip codes declined from 83% to 70% during the pilot period. However, this decline was not appreciably different from that in the control zip codes. It thus appears that the pilot did not have a sizable impact on secondary market activity counter to the historical experience in Georgia and New Jersey discussed in Keys et al. (2010).
9
to make approval and/or pricing decisions and then give that information to state regulators. This
external verification process, together with strict penalties for noncompliance, likely provided
strong incentives for lenders to better screen out marginal applications prior to referring
approved applications to counseling. One extreme form of screening was to cease lending in
HB4050 areas altogether.
A report by the nonprofit Housing Action Illinois (2007) summarized the counselors’
assessments of HB4050 covered loans. Over the course of the pilot, about 1,200 borrowers had
their loan offers reviewed by 41 HUD-certified counselors from 11 agencies. Housing Action
Illinois (2007) reports that 9% of the mortgages were deemed to have indications of fraud. About
half of the borrowers were advised that they could not afford the loan or were close to not being
able to do so. For 22% of the borrowers, loan rates were determined to be more than 300 basis
points above the market rate. For 9% of the borrowers, the counselors found a discrepancy
between the loan documentation and the verbal description of the mortgage. Perhaps most
alarmingly, an overwhelming majority of borrowers who were receiving adjustable rate loans did
not understand that their mortgage payment was not fixed over the life of the loan.
2.2. Early Termination of the Pilot Program
The program was meant to run as a four-year pilot in select Chicago neighborhoods.
Afterwards, its coverage was expected to be expanded to the entire metropolitan area. In spite of
vocal opposition from community-based groups and affected lenders, Illinois politicians
clamored to have their districts included in the pilot. This effort by politicians looks particularly
ironic in retrospect, given the eventual response of the population in the pilot area.
As mentioned earlier, only loans offered by state-licensed mortgage lenders were subject
to HB4050. In disadvantaged Chicago neighborhoods, much of the lending had been done
through state-licensed mortgage bankers, which presented themselves as a local and nimble
alternative to the more traditional bank lenders.8 Consequently, the legislation was likely to
8 Using the Home Mortgage Disclosure Act (HMDA) data described in detail in Section 3, we estimate that state-licensed mortgage bankers accounted for 64% of mortgage loans originations in the HB4050 zip codes during 2005.
10
increase the regulatory burden on the very entities providing credit in the selected pilot area. The
possibility that this could result in credit rationing prompted many observers to voice concern
about the potential effect of HB4050 on housing values in the selected zip codes.
The geographic focus of the legislation differed substantially from typical regulatory
approaches that require counseling for certain loan types (Bates and Van Zandt, 2007). This
feature of the legislation generated considerable opposition from community activists and
residents and prompted several lawsuits. Because the selected pilot area was overwhelmingly
populated by Hispanic and African American residents (81%, see Table 1, Panel A), the
selection also prompted heated accusations of discriminatory intent on the part of lawmakers.
Specifically, community activists formed an organization named the Coalition to Rescind
HB4050, led by John Paul (president of the Greater Englewood Family Taskforce) and Julie
Santos (an immigrants’ rights activist). In the media and through vocal protests at the grassroots
level, the organization put legal and political pressure on politicians to revoke the legislation.9
The other group to oppose HB4050 comprised mortgage lenders and real-estate brokers,
who claimed that the bill imposed onerous costs on real-estate professionals and that it reduced
market activity. This group also applied considerable pressure to abolish HB4050, ranging from
highly publicized refusals to lend in the pilot zip codes to joining legal actions against the
legislation.10
As mortgage lenders threatened to withdraw from the pilot zip codes en masse, and as the
tide of concerns about credit access began to rise, opposition to HB4050 reached fever pitch.11
The pilot program was suspended indefinitely on January 17, 2007 after only 20 weeks of
9 The Chicago Tribune reported on November 2, 2006 that a group of residents and members of the real-estate community submitted a lawsuit against the state, claiming discrimination. 10 The unusual confluence of interests between community activists and real-estate professionals in opposing the same regulatory action is reminiscent of Yandle’s (1983, 1999) “Bootleggers and Baptists” theory. The classic example of this theory is the banning of Sunday sales of alcohol—a regulation supported by both bootleggers and Baptists. The former endorsed the legislation because it allowed them to maintain the business of illegally selling liquor without competition. The latter approved of the regulation because it directly supported their objective of discouraging consumption of alcoholic beverages. 11 The record of a public hearing held on November 27, 2006 provides a good illustration of the acrimony surrounding HB4050 (see http://www.idfpr.com/newsrls/032107HB4050PublicMeeting112706.pdf).

11
operation. To provide some of the flavor of the public debate, we summarize the main news
items about the HB4050 legislation in the national and local media in the Appendix.
2.3. How Was the Pilot Program Area Selected?
HB4050 instructed the state regulatory body (Department of Financial and Professional
Regulation, or IDFPR) to designate a pilot area on the basis of “the high rate of foreclosure on
residential home mortgages that is primarily the result of predatory lending practices.” The pilot
area announced by IDFPR in February 2006 encompassed ten contiguous zip codes on the
southwest side of Chicago (the solid shaded areas in Figure 1).12 Four of these zip codes were
located in Illinois House Speaker Madigan’s district.
Table 1 summarizes some of the key demographic and mortgage characteristics for the
pilot area and the rest of the City of Chicago.13 The mortgage data come from the First American
CoreLogic LoanPerformance data set on securitized, subprime and Alt-A mortgages (henceforth,
the LP data). Panel A shows that IDFPR’s decision at the time was based on the fact that these
zip codes had substantially higher default rates (Column (1)) compared to the rest of the city
(Column (3)), even though they experienced stronger growth in house prices.14,15 The pilot zip
codes were also predominantly minority-populated and had much higher rates of unemployment
and poverty (Panel A) relative to the rest of Chicago. A simple comparison of population counts
and the total number of loan originations in the nonprime-LP data strongly suggests that the
HB4050 area had a disproportional share of subprime and Alt-A mortgages.
12 The HB4050 zip codes are: 60620, 60621, 60623, 60628, 60629, 60632, 60636, 60638, 60643, and 60652. 13 Panel A also provides this information for the set of 12 zip codes that comprise one of our control samples—zip codes similar to those affected by HB4050 but not chosen for the pilot. Their selection is discussed in detail in Section 3. The comparisons here are made between the ten HB4050 zip codes and the 31 Chicago zip codes that exclude both the HB4050 and the 12 control zip codes. 14 In this table, we use mortgage characteristics and performance for 2005 because this was the information set available to legislators at the beginning of 2006, when the legislation was voted on. 15 Default is defined as a 90+ day delinquency, foreclosure, or real-estate owned within 18 months of origination.
12
3. Data and Selection of Control Groups and Empirical Test Design
3.1. Data Sources
Our study relies on several complementary sources of data that cover the calendar years
2005–2007. First, we use data collected under the Home Mortgage Disclosure Act (HMDA) to
assess elements of supply and demand for credit. In the absence of loan application and
counseling data collected under the statutory authority of HB4050, we turn to HMDA as the next
best source of information on loan application volume, rejection rates, and so forth. Using
information from HUD and hand-collected data, we distinguish between lenders who specialize
in prime and subprime loans, as well as between lenders that are licensed by Illinois and those
exempt from licensing. Because the effect of the legislation was likely to be felt most acutely by
state-licensed subprime lenders, we use this list to refine our analysis. Furthermore, the HMDA
data allow us to examine how HB4050 affected credit supply along the extensive margin, i.e., to
identify lenders that left the market altogether. Overall, the HMDA data include 92,658 loans
that were originated in the HB4050 zip codes during the 2005–2007 period.
We also use the First American CoreLogic LoanPerformance (LP) database to assess the
effect of HB4050 on contract type and performance of mortgages originated in the treated zip
codes during 2005–2007. The LP data set includes detailed borrower and loan information such
as FICO scores and debt service-to-income (DTI) and loan-to-value (LTV) ratios as well as
mortgage terms, including maturity, product type (e.g., fixed or adjustable rate mortgage),
interest rate, and interest rate spread. It also contains information on whether a given loan has a
prepayment penalty, allows negative amortization, or required full documentation in
underwriting. These and other characteristics of the LP data are summarized in Table 1, Panels B
and C. FICO scores allow us to determine which borrowers in the HB4050 zip codes were
automatically or conditionally subject to loan counseling. The LP data set includes 37,564
mortgage loans originated in Chicago zip codes in 2005–2007.
Because the LP data do not include information about the identity of the mortgage
originator for loans, we need to match observations in the HMDA and LP data sets to examine

13
the effects of the legislation. We match on the basis of the zip code, loan amount, and date of
origination. Our matched data set yields 18,724 observations in the HB4050 zip codes.
In the later part of our analysis, we use information from one of the counseling agencies.
These data are part of the database constructed under the HB4050 legislation, which includes
information on original mortgage offers reviewed during 191 counseling sessions. We match
these data to the Cook County Recorder of Deeds and LP data sets to obtain loan characteristics
on the counseled loans. The resulting data set includes 121 loans (other loans may not have been
securitized and, therefore, not included in the LP data set). We use this data set to gauge the
extent to which counseling had a direct effect on mortgage choice.
Finally, we use Census and IRS data to control for zip code–level characteristics of
income and population composition.
3.2. Constructing a Zip Code–Based Control Group
To evaluate the effect of the HB4050 legislation, we develop control samples that are
similar to the pilot area but are unaffected by the legislation. As discussed in Section 2.3, the
selection of treated zip codes was driven by their demographic and mortgage characteristics, as
well as by political considerations. In fact, HB4050 zip codes exhibit characteristics that are far
from unique in the Chicago area. We use this information to construct a control group that is
meant to resemble the pilot area in terms of its pretreatment socioeconomic characteristics and
housing market conditions. Without the intervention, we plausibly expect the HB4050 zip codes
would have experienced the same changes in outcome variables as our control group zip codes.
To develop the control group, we move beyond the univariate metric of foreclosure rates to a set
of measures identifying economically disadvantaged inner-city neighborhoods.
In particular, we use 2005 IRS zip code–level income statistics, as well as the 2000
Census shares of minority population and of those living below the poverty level, and the
unemployment rate to identify zip codes within the City of Chicago limits that have similar
characteristics and the smallest geographic distance from the HB4050 zip codes. The resulting

14
12–zip code area has about as many residents as the treatment area and experienced a similar
path of house price changes, as summarized in Column (2), Panel A of Table 1. The statistics in
Panel B of Table 1 corroborate our conclusion that the control zip codes are similar to the treated
area in terms of their high default and delinquency rates, low borrower FICO scores, and
disproportionate reliance on riskier mortgage products.16 Judging by the spirit and the letter of
stated legislative guidelines, these zip codes (shown by the striped area in Figure 1) could have
plausibly been selected for HB4050 treatment.17
The HMDA database contains 80,876 loans originated in the 12–zip code control sample
during the 2005–2007 period. The control sample contains 34,451 loan originations in the LP
data set, 17,759 of which can be matched with HMDA data.
3.3. Constructing a Synthetic Zip Code Control Sample
To further establish the empirical robustness of our analysis, we construct a synthetic
HB4050-like area in the spirit of Abadie and Gardeazabal (2003).18 Instead of identifying a
similar but untreated set of zip codes, we build up a comparison sample loan by loan, by
matching on the basis of observable loan characteristics. Specifically, for each of the loans issued
in the ten–zip code HB4050 area, we look for a loan most similar to it that was issued elsewhere
within the City of Chicago in the same month. The metric for similarity is the geometric distance
in terms of standardized values of the borrower’s FICO score, the loan’s DTI and LTV ratios, the
log of home value, and the loan’s intended purpose (purchase or refinancing). Once a loan is
matched to an HB4050-area loan, it is removed from the set of potential matches and the process
16 In an earlier version of the paper, we used the reverse sequence to construct the control sample. That is, we built up the set of control zip codes by minimizing the distance in observed mortgage characteristics in the pre-HB4050 LP data. Afterward we checked for similarities in socioeconomic characteristics between the treatment and control areas. All of the results reported below are robust to the definition of the control area and are available upon request. 17 The control area comprises the following zip codes: 60609, 60617, 60619, 60624, 60633, 60637, 60639, 60644, 60649, 60651, 60655, and 60827. 18 It would be ideal to look at transactions that lie on either side of the border between the HB4050 and the control zip codes to tease out the effect of the counseling mandate. Unfortunately, the LP data do not contain street addresses.

15
is repeated for the next HB4050-area loan. The resulting synthetic HB4050-like area is made up
of observations from all 43 of the non-HB4050 Chicago zip codes. Not surprisingly, 65% of the
observations in this synthetic area come from the 12 comparable zip codes identified in the
preceding section on the basis of their socioeconomic characteristics.
In Table 1, Panel B, we compare the characteristics of borrowers and mortgages in the
treated zip codes sample to those in the synthetic control sample. The panel shows that for each
loan characteristic the samples have very similar properties. Because we are not constrained by
geographic proximity, the synthetic sample more closely matches the loans in the HB4050
treatment area than does the control sample. However, all three samples display remarkably
similar characteristics.
3.4. Design of Tests: HB4050 Legislation as an Exogenous Shock to Predatory Lending
To recap our data summary, the majority of lending in the HB4050 area was done by
state-licensed lenders specializing in subprime loans. Many of these loans had short reset periods
(hybrid ARMs) and prepayment penalties, and did not require full documentation of income—all
characteristics that are commonly associated with “predatory lending.” These loans also had
been defaulting at very high rates (more than 20% of subprime loans originated in HB4050 zip
codes in the year prior to the pilot defaulted within their first 18 months). Thus, to the extent that
HB4050 made it more difficult for this subset of lenders to originate such loans with high ex post
default rates, we regard the pilot as an exogenous shock to lending practices with potentially
predatory characteristics.
Our empirical analysis is based on the idea that HB4050 did not have a material effect in
untreated but similar areas. If predatory lending leads to higher default rates, we would expect
the negative exogenous shock to such lending practices to have a sizable effect on loan
performance.
Another way to think about the proposed empirical design is as a two-stage analysis. In
the first stage, we verify that the legislation had a material effect on mortgage origination

16
practices in the treated area. For example, we show that in the treated area the fraction of “high-
risk” mortgages declined significantly, as did the overall volume of originations and the number
of active lenders.
The second stage of the analysis measures the effect of the shock to the lending market
on mortgage performance. This stage is based on cross-sectional and temporal variation in a
difference-in-differences framework. Specifically, our tests measure the difference in the
response of various variables (e.g., default status, contract choice, etc.) as a function of whether
the loan was originated in a zip code subject to HB4050. Our regressions include both time
controls and cross-sectional controls, as in classic difference-in-differences analysis.
Our basic regression specifications have the following form:
Responseijt = α + β Treatmentjt + γ Time dummiest + δ Zip dummiesj + θ Controlsijt + εijt, (1)
where Responseijt is the loan-level response variable, such as default status of loan i originated at
time t in zip j; Treatmentjt is a dummy variable that receives a value of one if zip code j is subject
to mandatory counseling in month t and the loan is originated by a state-licensed lender, and 0
otherwise; and Time and Zip dummies capture fixed time and location effects, respectively. In all
regressions, we cluster errors at the zip code level.19 For each loan, the response is evaluated at
only one point in time (e.g., interest rate at origination or default status 18 months thereafter).
Consequently, our data set is made up of a series of monthly cross-sections. The set of controls
varies with the underlying data source, but it includes variables such as LTV at origination,
borrower FICO score, loan interest rate, and so forth.
3.5. Discussion of the Exclusion Restriction and the Context of the Estimates
Our empirical tests provide estimates of the effect of the anti-predatory program on the
performance of loans. Here we discuss whether our estimates of improved mortgage
19 Clustering allows for an arbitrary covariance structure of error terms over time within each zip code and, thus, adjusts standard error estimates for serial correlation, potentially correcting a serious inference problem (Bertrand, Duflo, and Mullainathan, 2004). Depending on the sample, there are 22 or 53 zip codes in our regressions.
17
performance can be attributed to the reduction in predatory lending and whether the result can be
generalized to the entire national market. We identify the effect of predatory lending on borrower
default based on the assumption that HB4050 affected default rates only through its impact on
predatory lending (the exclusion restriction). This assumption may not hold for two main
reasons: (1) the legislation is likely to have altered additional aspects of borrower decision
making, and (2) the legislation is likely to have induced spillovers of borrowers and lenders from
the treated zip codes into neighboring zip codes. Below, we analyze the potential effects of
violating the exclusion restriction assumption.
The anti-predatory program affected the performance of loans through two main
channels: oversight and education. First, the program imposed oversight on lenders by subjecting
their loan offers to external review, thus causing predatory lenders to be more cautious. Second,
the program provided a detailed review to borrowers, which could have improved their decision
making. During the 20 weeks in which the pilot program took place, over 1,200 borrowers
received information about mortgages. In our sample of 191 loans, about 19% did not pursue
their loan application following the counseling and another 40% modified some of the mortgage
characteristics. Although it is difficult to clearly distinguish between the channels, our
measurement of the effect of predatory lending relies on the direct effect of the program through
oversight. It is plausible, however, that the indirect channel of education violates the exclusion
restriction and that some of the effect of the anti-predatory program on default rates came
through this indirect channel.
Moreover, spillovers of loans from the treatment sample to the control sample violate the
exclusion restriction because they may have adversely affected the quality of loans originated in
the control sample. Such spillovers could have happened along three dimensions: spatial, cross-
sectional, and temporal. First, potential purchasers could have moved from the treated area to
surrounding areas (most likely to the control zip codes, as they have similar characteristics).
Figure 2a presents the volume of applications in the treated zip codes and the control sample zip
codes, per state-licensed lenders (treated) and non-state-licensed lenders (not treated). Figure 2b

18
presents similar analysis for originated mortgages. The figures show no apparent spillover in
volume. Second, borrowers could have shifted to lenders in the treated area that were not subject
to the legislation, i.e., non-state-chartered lenders. However, again Figures 2a and 2b do not
show evidence of such a move. One possible explanation for the lack of spillover is that the
market was segmented and state-licensed lenders and non-state-licensed lenders serviced
different populations (subprime and prime borrowers, respectively). Third, there is the possibility
of a run-up in mortgage applications in the treated area before the starting date of the program
(which was known in advance). Figures 2a and 2b do suggest some buildup in applications and
approvals before the onset of HB4050. They also show a minor tick-up immediately after the
termination of the program, in March 2007. Potentially this is a spillover effect, and these loans
could have been originated during the legislation period.
We argue that both violations of the exclusion restriction assumption cause our estimates
of the effect of predatory lending on borrower default rates to be overstated. If the program
affected default rates through the education channel, then we cannot ascribe the entire measured
effect to the elimination of predatory lending. Further, if there were spillovers, then the credit
quality of the control group is worse than it would be otherwise, creating a greater spread in
default rates between the treated and control groups.
In a similar vein, it is likely that the legislation had an effect not only on predatory
lending, but also on merely “aggressive” lending practices that pushed the boundaries of legally
permissible behavior without violating them. In this case, the effect that we attribute to predatory
lending should be ascribed to both predatory and aggressive lending practices. With the
exception of our analysis in Section 6, distinguishing between the two types of practices is
difficult. Nevertheless, this limitation also bounds our results from above. Even if we overstate
the number of predatory loans eliminated by the pilot, our results show that the effect on default
rates is relatively small.
A second issue is whether the effects of predatory lending measured in the context of the
HB4050 legislation can be extrapolated to the national level. There are several reasons to be

19
skeptical of this. The treatment area was characterized by high delinquency rates due,
supposedly, to predatory lending. This lending was done by a particular subset of financial
intermediaries who were readily identifiable and subject to state regulation. The penalties for
noncompliance were fairly harsh, partially because of lack of clarity regarding enforcement. All
of these factors are unlikely to hold for the country as a whole, limiting the effect of such
regulatory intervention. Furthermore, the limited geographic scope of HB4050 made it relatively
easy for lenders to exit, whether because of high compliance costs or for the strategic goal of
highlighting the contractionary effects of the pilot on credit availability. This amplified the effect
of the pilot but would not be applicable at the national level. For all of these reasons, it is likely
that our estimates are an upper bound for the effect of predatory lending.
4. The Effects of HB4050 on Predatory Lending
As described above, the legislation disrupted mortgage markets by changing the loan
origination process for certain borrowers and products. This section empirically evaluates its
effect on loan volumes, borrower and mortgage characteristics, and lender participation.
4.1. Impact of the Legislation on Application and Mortgage Volumes
We measure mortgage market activity by the volume of loan applications and loan
originations captured in the HMDA database.20 Figure 2a depicts the total number of loan
applications in the treated zip codes (the solid line) and in the control zip codes (the dashed line).
This information is reported in two panels that further subdivide applications reported by state-
licensed lenders (who are subject to the legislation) and all other lenders (labeled exempt).
There is a precipitous decline in loan applications among state-licensed mortgage lenders
in HB4050 zip codes around the time the regulation became effective (September 1, 2006). For
these lenders, the application volume dropped from 5,276 in August 2006 to 3,584 in September
20 We count all relevant HMDA records that have one of the following action codes: originated, denied, approved but not taken, withdrawn, or incomplete.

20
(32% decline), and to 2,275 in October. We observe some run-up in applications in the treated
areas prior to the legislation period, though it is much smaller than the subsequent drop. In
contrast, application levels in control zip codes hold steady through December 2006. Following
the repeal of HB4050, activity levels in both control and treatment areas converged nearly
instantaneously; then they plummeted jointly to about half that of the market heyday. For non-
state-licensed lenders (chart on the right), we observe no differential effect in the HB4050 and
control zip codes throughout the period examined.
We observe similarly striking evidence when examining mortgage originations. In Figure
2b, the left chart shows mortgage originations for state-licensed lenders. Originations in HB4050
zip codes collapsed from 2,046 in August 2006 to 785 in September 2006 (a 62% decline) and
remained at this depressed level until the end of 2006. Their levels completely converged with
originations in the control zip codes following the termination of the program in February 2007,
by which time subprime lending activity was grinding to a halt nationwide. Again, we do not
observe any effects of the legislation for non-state-licensed lenders in either the HB4050 or the
control zip codes.
Table 2 presents the triple difference (diff-in-diff-in-diff) analysis of the drop in activity,
as captured by the HMDA data. We calculate the difference between the number of applications
before and during the legislation period in HB4050 and control zip codes among state-licensed
lenders. We then repeat the same calculation for non-state-licensed lenders and calculate the
difference in the results between the two lender subsets. Panel A focuses on changes in the
monthly rate of applications. It shows a substantial decline in the treated zip codes relative to the
controls among state-licensed lenders: 51% versus 14%. In contrast, there is no measurable
difference in the number of applications to non-state-licensed lenders, which increased
marginally during the pilot period in both the treated and the control areas. Consequently, the
difference between changes in treatment and control applications for state-licensed and non-
state-licensed lenders is striking at nearly 29%. This leads us to conclude that HB4050

21
significantly lowered borrower applications for mortgage credit and that its impact was, in fact,
concentrated among state-licensed lenders.
Next, we use the same method to estimate relative changes in origination activity. As
shown in Table 2, Panel B, we find a decrease of 61% in the total number of mortgage
originations by state-licensed lenders in HB4050 zip codes, with a 68% decline in purchase
mortgages and a 54% decline in mortgage refinance transactions. As with applications, the drop
in originations by state-licensed lenders in control zip codes is much smaller. Although there is a
marginal rise in originations by non-state-licensed lenders, the increase is far too small to
compensate for losses in credit origination by state-licensed lenders. Overall, the difference in
the relative decline in total originations by state-licensed lenders in the treatment area and time
period amounted to 39%. This further underscores our contention that the two sets of lenders
served different segments of the market.
In preparation for the default analysis that follows, we also perform a robustness check of
these results based on the matched sample between the LP data set (which contains default
information) and the HMDA data. The results are reported in Panel C, and they follow exactly
the same pattern. The magnitude of the declines, both relative and absolute, is even stronger in
the matched sample, which is heavily tilted towards state-licensed lenders that originated
subprime loans. For example, the panel shows a 67% drop in originations among such lenders in
treated zip codes, relative to a 14% runoff in the control area.
We also note that the effect of the legislation is more pronounced for refinancing
transactions relative to purchase mortgages. This result is consistent with Choi (2011), who
examines the effect of anti-predatory legislation on origination volumes and finds a small effect
for purchase mortgages and a larger effect for refinancing mortgages. There are two potential
explanations for this result. First, refinancing activity is often discretionary. In particular,
borrowers who refinance a loan can often wait or find alternative sources of financing. For
purchases, however, if a buyer wants to complete the transaction, she usually has to take out a
mortgage in a timely manner. Second, the HB4050 legislation specified frequent refinancing

22
transactions as one of the triggers for identifying risky mortgages that would require counseling.
Therefore, one would expect a greater decline in refinancing transactions.
In sum, the results show that the legislation had far-reaching effects on the volumes of
mortgage applications and originated loans. Moreover, these effects were most pronounced in the
targeted population—state-licensed lenders originating loans for low-FICO-score borrowers.
4.2. Differential Impact of the Legislation by Borrower and Mortgage Characteristics
Given that the legislation had a significant effect on mortgage originations, we examine
whether there was a change in the composition of borrower and mortgage types during the
treatment period. After all, the pilot effectively increased the cost of originating mortgages to
low-credit-quality borrowers as well as the cost of originating what were considered risky loans.
To explore this issue, we use a sample including all mortgages in the LP-HMDA data set
that were originated in the treatment and control zip codes between 2005 and 2007. The
dependent variables are borrower and mortgage characteristics. The independent variable of
interest is the interaction between the HB4050 dummy and the state-licensed lender dummy,
which takes a value of one if the loan was originated subject to the HB4050 legislation. The
regressions include month fixed effects interacted with a state-licensed dummy and zip code
fixed effects interacted with the state-licensed dummy. This specification assures that there are
fixed effects for each dimension that is differenced out (time, zip code, and type of lender).
Standard errors are clustered by zip code to account for correlation within geographical areas.
The regression results in Table 3, Panel A show that the composition of borrowers and
mortgage types changed significantly following the legislation. Column (1) indicates the average
FICO score of loans originated in the treated zip codes during the HB4050 period was 7.8 points
higher. This result is material as it reflects a shift of 0.13 standard deviations in the distribution
of borrowers (see Table 1, Panel B). Column (2) shows further evidence that the credit quality of
borrowers increased: the average interest spread declined by 0.43 percentage points—or 0.43
23
standard deviations. Overall, this evidence suggests that during the treatment period, the
population of borrowers was of appreciably better credit quality.
We also observe that the originated mortgages are less likely to fall into risky categories
as defined by HB4050. In Columns (3) to (8), we examine the change in a variety of mortgage
characteristics: whether loans are adjustable rate mortgages, have low documentation, are
classified as risky mortgages by the HB4050 regulation (Category I or Category II), or are 100%
loan-to-value (LTV), and whether loans are considered “excessively risky” (i.e., mortgages that
are ARM, no- or low-documentation, interest only, and ≥95% LTV).
The regressions show that mortgages originated in the treated areas would be considered
less risky by the legislation on most dimensions. Following implementation of HB4050, ARM
originations declined by 5.2% (t = 2.60; where the base rate in the control sample is 76%),
Category I loans declined by 2.6% (t = 1.53; the base rate is 83%), Category II loans declined by
3.9% (t = 2.78; the base rate is 20%), 100% LTV loans declined by 2.5% (t = 1.39; the base rate
is 16%), and excessive loans declined by 2.2% (t = 2.00; the base rate is 10%). We do not detect
a decline in no- and low-documentation loans.
In Panel B we perform a robustness test for the above results. Here we restrict the sample
to lenders who did not exit from the HB4050 zip codes during the legislation period. As
described in greater detail below, we define the “exit group” as lenders who reduced their
average monthly lending rate by more than 90% relative to the prepilot period. The results show
that the change in the composition of borrowers and products was independent of lender exit,
i.e., the quality of borrowers and loans also increased for the remaining lenders.
Overall, these findings show that new borrowers in the treated group were of better credit
quality and the originated loans were materially less risky, as defined by the legislation, than
those in the control group.

24
4.3. Impact of the Legislation on Lender Exit
Part of the dramatic drop in loan applications can be traced to a number of much-
publicized lender withdrawals from the market. We tackle the question of market exit by
counting the number of unique lenders filing HMDA reports before, during, and after the
treatment period in both the treated and control zip codes. To be counted as an active lender in a
given geographic area, a HMDA-reporting institution must originate at least 10% of its prepilot
average per month during the pilot period, with at least one origination in every month.21 Panel A
of Table 4 summarizes the results of this exercise. Of the 89 active state-licensed lenders in the
treated zip codes in the prelegislative period (January 2005–August 2006), only 46 continued to
lend during the treatment period. In a reprise of mortgage origination results, the decline in the
number of lenders is much greater in the treatment areas, and exit is concentrated among state-
licensed lenders.
As noted before, the legislation created some legal uncertainty about the enforceability of
mortgage contracts in the treated zip codes. This ambiguity by itself may have accounted for the
strong lender response along the extensive margin. It is also conceivable that exit from HB4050
areas was a strategic response by lenders determined to emphasize the disruptive nature of this
high-profile regulation.
We explore the characteristics of exiting lenders in Panel B of Table 4. Because we want
to focus on mortgage contract features and performance, we need to work with the LP-HMDA
data set, which contains fewer lenders. The sample includes 55 lenders that were active in the
HB4050 zip codes during the prepilot period (January 2005–August 2006). The majority of these
lenders (43) were state-licensed. We focus on loans originated during calendar year 2005, when
HB4050 discussions were not prevalent.
We note that exiting lenders were smaller. They originated mortgages to borrowers with
somewhat lower credit scores but charged a slightly lower credit spread. A higher share of those
21 None of the patterns depend on the choice of the threshold level or geographic area. The “every month” condition is intended to eliminate lenders that withdrew from HB4050 zip codes during the fall of 2006 after working off their backlog of earlier applications.

25
mortgages had adjustable-rate contracts. They originated a higher share of Category I and II
loans, but a lower fraction of their loans had no equity (100% LTV). Yet, on net, the 18-month
default rate on mortgages originated in 2005 is measurably higher for state-licensed lenders that
ended up exiting HB4050 areas—11.6% versus 10.4% for lenders that continued operating. We
also note that non-state-licensed lenders in the LP-HMDA sample appear to have had very low
lending volumes and to have been serving a much higher credit quality population.
Overall, our results show state-licensed lenders were more likely to exit the HB4050 zip
codes during the legislation period. These lenders appear to have served a population with lower
credit quality and to have provided loans that were categorized by regulators as risky.
5. The Effect of the Anti-Predatory Program on Default Rates
The previous sections established that the legislation reduced market activity in general,
and in particular, improved the average credit quality of borrowers, improved the risk profile of
mortgages, and affected lenders that originated risky loans. From the point of view of the
legislators, these effects are in line with their objective—to reduce what was perceived to be
predatory lending activity.
Given these changes in the market, we now examine the effects of the legislation on
mortgage performance. The hypothesis that we test is whether lower predatory lending activity
had a material effect on mortgage default. We measure loan performance by flagging borrowers
who defaulted on their loans within 18 months of origination.22 We then estimate a series of
ordinary least squares (OLS) regressions, as defined in equation (1), in which the set of controls
includes measures of borrower credit quality (FICO score), contract terms (LTV ratio, interest
spread, and logged property valuation), and contract type (no- or low-documentation, and
indicators for Categories I and II). In addition, we include three sets of fixed effects: month
dummies interacted with a state-licensed lender indicator, zip code dummies interacted with a
22 A loan is considered defaulted if it is 90+ days past due, in bankruptcy, or in foreclosure or is real-estate owned by the lender.

26
state-licensed lender indicator, and zip code interacted with calendar month. These fixed effects
control for variation in all three dimensions that define the treatment: zip code, month, and
lender type.
We present two sets of base regressions in Table 5, Panels A and B. Panel A uses a
sample based on all mortgages between 2005 and 2007 originated in the pilot zip codes in
addition to mortgages in the 12–zip code control group. Panel B uses the same treatment group
but uses the synthetic control sample of matched loans (as defined in Section 3.3). The
dependent variable in all regressions is an indicator of loan default within 18 months. In all
regressions, the variable of interest is an indicator of whether the loan is part of the treatment
group (i.e., originated by a state-licensed lender during the pilot period in the pilot zip codes).
In each panel, there are six regression specifications. In Column (1) in each panel, we
include no controls other than the fixed effects described above. In Column (2), we add controls
for FICO score and logged loan amount. In Column (3), we add the no/low documentation
indicator, indicators of whether the loans fall under Category I or Category II, and the LTV
variable. Columns (4) to (6) repeat the specifications of Columns (1) to (3) but add lender fixed
effects.
The results in Table 5, Panels A and B show that when we consider the entire treated
group, the effects of the legislation on default rates are virtually nonexistent. In Panel A, there is
no discernible effect. In Panel B, the effect on the treatment loans is negative, but it is
economically small and statistically insignificant. The magnitude of legislation-related declines
in default rates is about 1 percentage point (no lender fixed effects) or about 2.5 percentage
points (with lender fixed effects). The unconditional likelihood of default in the loan-matched
control sample during the pilot time is 23.8%; hence, the legislation caused a decline in default
of up to 11% for the treated group.
In Panels C and D, we present additional specifications of the baseline regressions to
hone down on drivers of default in different subsamples, focusing on subgroups that are likely to
exhibit stronger results. Panel C uses a control sample that is based on the 12 control zip codes,
27
while Panel D is based on the matched synthetic sample. In the first specification, the sample
includes only subprime borrowers (FICO ≤ 620). In the second specification, the sample is
restricted to loans originated by state-licensed lenders. The third specification includes only
loans made to subprime borrowers by state-licensed lenders. The fourth specification is restricted
even further to state lenders who did not exit from the sample.
Comparing the results in the different specifications sheds light on the source of the
decline in default rates. Specifically, the decline in the default rate is steepest in the matched
synthetic sample that is restricted to the subprime population and state-licensed lenders. It is also
the only sample in which the improvement in default rates is statistically significant. For this
population, the decline in default is about 6 to 7 percentage points, out of a base rate of about
27.2% (third specification in Panel D). This means that the improvement in mortgage
performance is concentrated in the subprime population.
To answer the question of whether the decline in default is due to the exit of predatory
lenders, we compare the third and fourth specifications. The samples used in these specifications
are the same except that the latter is limited to lenders that continued lending in the treatment zip
codes during the pilot period. The regressions show that the decline in default dissipates once
this restriction is imposed. Put differently, we observe no improvement in the performance of
subprime loans originated by lenders that continued to operate in HB4050 zip codes during the
pilot period. The juxtaposition of these results leads us to conclude that the decline in default was
driven by lender exit.
In Panel E, we provide additional specifications for robustness purposes. The dependent
variable in these regressions is an indicator of whether the loan defaulted within 36 months (as
opposed to 18 months earlier). The motivation for this is to verify that our results are not driven
by a difference in the sensitivity of the explored populations to the financial crisis; a period of 36
months extends well into the crisis period. Then, we rerun the third and fourth specifications
from Panels C and D. The results show that that the decline in default mirrors the panels above.

28
To summarize, our results show that the overall effect of the legislation on mortgage
default rates in treated areas was relatively minor: a decline of 1 to 2.5 percentage points, for a
base rate default of 24 to 27 percent. We find, however, that the pilot had a stronger effect on the
subprime population, for whom the improvement in default rates was statistically and
economically significant: between 5 and 7 percentage points, for a base rate of default of 27%
(18% to 26% relative decline). Furthermore, our evidence shows that the decline in defaults was
driven by lender exit. Hence, these findings suggest the withdrawal from the market of some
lenders resulted in a measurable improvement in loan performance for those subprime borrowers
who were able to access the credit market.
6. Estimating the Default Rate of Predatory Loans
With estimates obtained in the preceding sections, we can calculate the default rate of
“predatory” loans, after making some assumptions about loan distribution across markets. In this
exercise, “predatory loans” are defined as loans that were not originated during the HB4050 pilot
period, presumably because of the effect of the treatment. Our goal here is to approximate the
hypothetical default rate of predatory loans.
We estimate that the default rate on subprime loans that were not originated due to
HB4050 would have been about 32 percent. We performed this algebraic calculation in the
following manner: from Table 1, Panel B, we see the default rates in the treated and control
samples were very similar both before and after the treatment period. It was only during the
treatment period that they diverged. Thus, assuming they would have been similar without the
treatment, we can back out the hypothetical default rate for the precluded predatory loans. In the
synthetic control sample of state-licensed subprime loans, all originated loans during the
treatment period had a default rate of 26.4 percent (Table 1, Panel B, Column (6)). In the treated
group, loan activity declined by 53.7% (Table 2, Panel C, state-licensed lenders), and the default
rate declined by about 7.0 percentage points (Table 5, Panel D, third specification, Columns (4)-
(6)). Therefore, the “precluded” predatory loans would have required a default rate of 32.4% in

29
order to reach an average default rate of 26.4%.23 With this calculation, predatory loans appear to
have a default rate 6.0 percentage points (32.4% – 26.4%) higher than loans that are not
predatory.
It is important to note that the pilot also disrupted mortgage activity outside of the
narrowly defined subprime segment of the market. Those segments did not realize any gains
from improved mortgage performance (e.g., Table 5, Panels A and B) but did experience the
costs of the disruption.
Because of the assumptions required for the above calculation, we utilize alternative data
to test for robustness of this estimate using a different methodology. Specifically, we calculate
the default rate of predatory loans using data provided by one of the HUD counseling agencies
that collected loan and borrower information as part of the HB4050 mandate. Our sample
includes 121 loans that we could match to loans in the LP data set.
During the counseling process, the counselors flagged some loans as potentially being
predatory. They used three main criteria in making this determination: the loan was priced above
the market rates, the borrower was thought not to be able to afford the loan, and the loan was
thought to have fraud indicia (Housing Action Illinois, 2007). We use these flags to measure the
effect of predatory lending in two empirical settings.
Our first test compares the performance of loans with predatory flags to those not
identified as predatory. Table 6, Panel A shows the results. A loan flagged as predatory yet still
originated had a 6.5 percentage points higher default rate (90+ days delinquent) within 18
months (Column (1)). This magnitude is very similar to the above calculation of a 6.0 percentage
point differential in default rates (although it is not statistically different from zero given our
limited sample size). We also measure the probability of default of the subsample of loans that
were flagged as having indicia of fraud (as opposed to using the three criteria discussed above).
We find the default rate differential for these loans to be even higher at 12.3 percentage points
(Column (3)).
23 (26.4% - 7.0%) * (100% - 53.7%) + X * 53.7% = 26.4%; X = 32.4%.

30
An additional question is whether counselors flagged loans as problematic based on
readily observable information or whether they also relied on soft information collected during
the counseling sessions. This question is relevant for policy design because if only observable
information was used in making the predatory designation, the same outcome could have been
achieved with a specific underwriting protocol and without counselor review.
To tackle this question, we construct a sample of loans in the control zip codes that are
matched to the 121 counseled loans for which we have contract and performance data.
Specifically, we match each counseled loan with up to ten other loans in the control zip codes
that were originated during the same time period, were originated for the same purpose
(purchase/refinance), and had similar house prices, adjustable/fixed rate types, leverage,
documentation levels, interest rates, and FICO scores.24 Overall, our matched sample includes
1,048 loans (summary statistics are provided in Table 1, Panel E). If a counseled loan is flagged,
we give it a “red flag” indicator and similarly tag each of its matched control loans. Assuming
that the predatory designation was given based on observables only, we would expect to continue
to see higher default probabilities on all “red flag” loans but not to see any differential impact
among the “red flag” loans that were actually counseled.
Table 6, Panel B presents the regression results. Consistent with the previous evidence,
the regression shows that the “red flag” loans have about a 6 percentage point higher default rate
than nonflagged loans. The interaction with the counseling indicator suggests that the loans that
were actually counseled are not materially different from those that were matched to them, which
is consistent with the idea that loans were flagged based solely on observables.
We repeat the same exercise with “red flag” defined as only cases of suspected fraud. The
coefficient on the fraud red flag and its interaction with the counseling indicator (Columns (3)-
(4)) are positive but very imprecisely estimated. This finding suggests that our loan-matching
procedure did not match well on the fraud dimension—most likely because indicia of fraud are
24 More precisely, we include loans that were originated within 31 days of one another and that had house prices within $8,000, leverage within 10%, interest rates within 1%, and FICO scores within 20 points.

31
based on soft information collected by counselors that is unobservable in the raw mortgage
servicer data. The results in Panel B indicate that some dimensions of predatory lending, such as
loan affordability and excessive interest rates, are readily captured with observable data, while
others such as fraud indicia are not.
To summarize, this section used multiple methods to measure the default rates of
predatory loans. The different methods generated strikingly similar estimates: predatory loans
originated in this period had an 18-month default rate that was about 6 percentage points higher
than similar loans that were not predatory.
7. Conclusion
Whether predatory lending was an important factor in precipitating the subprime crisis is
one of the key questions in the academic and policy debate about the sources of the crisis and its
aftermath. The main empirical challenge in answering this question is that it is difficult to
distinguish predatory loans from nonpredatory loans on an ex ante basis. In general, predatory
lenders exploit borrowers by having an informational advantage over them. This informational
advantage is not easily discernible when examining the observable characteristics alone.
In this study we use an anti-predatory legislative pilot (HB4050) enacted in 2006 in
Chicago as an instrument for identifying predatory lending. The legislation required certain
borrowers in ten zip codes in Chicago to seek counseling when they took out a mortgage from
state-licensed lenders. Following implementation of the pilot, market activity dropped by about
40%, largely through the exit of lenders specializing in risky loans and through a decline in the
share of subprime borrowers. Default rates in the subpopulation targeted by the pilot—subprime
borrowers served by state-licensed lenders—improved by 6 to 7 percentage points, relative to the
unconditional default rate of 26 percent. We use these estimates to impute a hypothetical default
rate of about 32 percent on the presumably predatory loans that were not originated due to
HB4050. We obtain similar estimates using other techniques based on subsamples of loans that
were counseled and flagged as being predatory.

32
In interpreting our results, the first thing to note is that the pilot represented a very blunt
policy tool. Its bluntness reflects the severe informational problems that exist in identifying
predatory lending. Predatory lending is about unobservable information: lenders engage in
predatory lending when they exploit borrowers by having superior information about their ability
to repay the loan (Bond, Musto, and Yilmaz, 2009). Given the ambiguity and subjectivity in
identifying which loans are predatory and which are not, regulators must resort to rough proxies
(Litan, 2001). In the case of HB4050, predatory loans were proxied as loans made in the poorer
parts of the city to borrowers with low credit scores and with a certain risk profile. Of course,
these proxies are imperfect and therefore may impose costs on lenders who do not make
predatory loans and on borrowers who are not being exploited.
The bluntness of HB4050 resulted in severe market disruptions, as it drove about half of
the state-licensed lenders out of the market, lowered the number of originated mortgages by
about a third, and imposed high counseling costs on the remaining borrowers and lenders. The
wide and fairly indiscriminate reach of the pilot also triggered intense public opposition from all
of the affected parties—communities and lenders alike—ultimately leading to its early
termination. This response highlights the political difficulties involved in policy interventions in
an environment with inherently complex incentive structures and asymmetric information held
by lenders, borrowers, and regulators.
The pilot did appear to lower default rates among its primary target population—
subprime borrowers served by state-licensed lenders. Although these improvements in mortgage
performance were measurable, the default rates among the treated subset of borrowers remained
alarmingly high. This suggests that potentially predatory lending practices by themselves cannot
account for the meltdown in the subprime mortgage market.
Our finding that eliminating bad lenders had a greater impact on mortgage defaults than
eliminating bad loans also suggests that reckless, rather than predatory, lending practices deserve
greater scrutiny. Although answering this question is beyond the scope of this paper, these results
are consistent with recent research that highlights the role of long intermediation chains in

33
mortgage origination leading up to the crisis. In particular, the majority of lenders subject to
HB4050 were mortgage banks and brokers that securitized the lion’s share of their loans. Such
lending practices have been found to be associated with aggressive misrepresentation of
information throughout the mortgage origination and funding process and with subsequently
higher defaults (Keys et al., 2010; Jiang, Nelson, and Vytlacil, 2012; Piskorski, Seru, and Witkin,
2013). In a similar vein, our finding that borrowers often chose to pursue bad loans in spite of
(justified) warnings from counselors brings up questions of the role played by the borrowers
themselves. These results join the body of literature showing that reckless lending and
borrowing, combined with distorted incentives of intermediaries, were at the heart of the
subprime crisis (e.g., Ben-David, 2011; Agarwal and Ben-David, 2013).
It may be tempting to conduct a back-of-the-envelope welfare analysis by linking the
estimates of reductions in defaults with the costs of such defaults and of the counseling itself.25
However, doing so fails to take into account a number of important effects—losses in utility
incurred by excluded borrowers, positive spillovers on neighborhood property values from lower
defaults, losses from inefficient contract choices that resulted from trying to avoid counseling
sessions, and so forth. Moreover, evaluating the overall welfare effect of this intervention
requires weighing the relative costs and benefits accruing to different market participants.26 It is
further complicated by various distortions that already exist in the housing market due to unique
tax treatment, zoning restrictions, and so forth, as well as potential externalities produced by
individual housing decisions.
25 For instance, we could have taken the average house value in HB4050 zip codes of $190,000 and assumed a deadweight loss from foreclosure of about 30% (Campbell, Giglio, and Pathak, 2011). Based on the estimate of a 6% higher default rate resulting from predatory lending, the expected benefit from curbing predatory lending would be $3,420 (0.06*$190,000*30%) per borrower. Therefore, the pre-borrower net direct benefit (net of counseling fee and approximately $100 for the cost of time) would be of approximately $2,000. 26 Some recent attempts to theoretically model the welfare effects of policy choices in household financial markets include Carlin and Gervais (2009); Bolton, Freixas, and Shapiro (2007); and Carlin (2009).
34
Mandated financial counseling and increased oversight of lenders are important policy
tools being considered in the wake of the housing market crisis.27 Both policies impose
restrictions on free contracting between borrowers and lenders. As such, they can be expected to
shrink credit markets, particularly for the financially disadvantaged segments of the population.
In addition to providing an estimate of the quantitative impact of anti-predatory-lending
programs, our paper sounds a cautionary note about the difficulties of implementing effective
policy in an informationally opaque setting with complex and conflicting incentives.
27 In 2010 Congress passed the Dodd-Frank Act, which created a new Consumer Financial Protection Bureau (CFPB) to safeguard consumers from unfair, deceptive, and abusive practices in the financial sector. Among other approaches, CFPB is likely to consider increasing access to financial counseling.

35
References Abadie, A., Gardeazabal, J., 2003. The economic costs of conflict: A case study of the Basque
country. American Economic Review 93(1), 113-132.
Agarwal, S., Evanoff, D. 2013. Do lenders steer borrowers to high risk mortgage products. Working paper. National University of Singapore.
Agarwal, S., Amromin, G., Ben-David, I., Chomsisengphet, S., Evanoff, D., 2010. Learning to cope: Voluntary financial education programs and the housing crisis. American Economic Review 100(2), 495-500.
Agarwal, S., Amromin, G., Ben-David, I., Chomsisengphet, S., Evanoff, D., 2012. The effects of financial education on household financial decision making: Evidence from a natural experiment of mortgage advice. Working paper. The Ohio State University.
Agarwal, S., Ben-David, I., 2013. Do loan officers’ incentives lead to lax lending standards? Working paper. The Ohio State University.
Agarwal, S., Skiba, P., Tobacman, J., 2009. Payday loans and credit cards: New liquidity and credit scoring puzzles? American Economic Review 99(2), 412-417.
Bates, L.K., Van Zandt, S., 2007. Illinois’ new approach to regulating predatory lending: unintended consequences of borrower triggers and spatial targeting. Spatial Policy Analysis Research Consortium working paper 2007-02. University of Illinois.
Ben-David, I., 2011. Financial constraints and inflated home prices during the real-estate boom. American Economic Journal: Applied Economics 102(3), 559-578.
Ben-David, I., 2012. High leverage and high prices: Evidence from the residential real-estate market. Working paper. The Ohio State University.
Bertrand, M., Duflo, E., Mullainathan, S., 2004. How much should we trust difference in differences estimates? Quarterly Journal of Economics 119(1), 249-275.
Bertrand, M., Morse, M., 2011. Information disclosure, cognitive biases and payday borrowing. Journal of Finance 66(6), 1865-1893.
Bolton, P., Freixas, X., Shapiro, J., 2007. Conflicts of interest, information provision, and competition in the financial services industry. Journal of Financial Economics 85(2), 297-330.
Bond, P., Musto, D.K., Yilmaz, B., 2009. Predatory mortgage lending. Journal of Financial Economics 94, 412-427.
Bostic, R.W., Chomsisengphet, S., Engel, K.C., McCoy, P.A., Pennington-Cross, A., Wachter, S., 2012. Mortgage product substitution and state anti-predatory lending laws: Better loans and better borrowers? Atlantic Economic Journal 40(3), 273-294.
Campbell, J.Y., Cocco, J.F., 2003. Household risk management and optimal mortgage choice. Quarterly Journal of Economics 118(4), 1449-1494.
Campbell, J.Y., Giglio, S., Pathak, P., 2011. Forced sales and house prices. American Economic Review 101(5), 2108-2131.

36
Carlin, B., 2009. Strategic price complexity in retail financial markets. Journal of Financial Economics 91(3), 278-287.
Carlin, B., Gervais, S., 2009. Legal protection in retail financial markets. NBER working paper #14972.
Center for Responsible Lending, 2009. Restoring integrity to the financial system predatory lending and the economic crisis. Faith and Credit Issue Guide, September.
Choi, H-S., 2011. The impact of anti-predatory lending laws on mortgage volume. Working paper. Princeton University.
Engel, K.C., McCoy, P.A., 2007. Turning a blind eye: Wall Street finance of predatory Lending. Fordam Law Review 75, 101-165.
Federal Deposit Insurance Corporation (FDIC), 2006. Challenges and FDIC efforts related to predatory lending. Report by the Office of Inspector General, http://www.fdicoig.gov/reports06/06-011.pdf
Financial Crisis Inquiry Commission, 2010. Final report of the National Commission on the Causes of the Financial and Economic Crisis in the United States. Internal report.
Jiang, W., Nelson, A., Vytlacil. E., 2012. Liar's loan? Effects of origination channel and information falsification on mortgage delinquency. Review of Economics and Statistics (forthcoming).
Guiso, L., Sapienza, P., Zingales, L., 2013. The determinants of attitudes towards strategic default on mortgages. Journal of Finance 68(4), 1473-1515.
Housing Action Illinois, 2007. Findings from the HB4050 Predatory Lending Database Pilot Program.
Hudson, M.W., 2010. The Monster: How a Gang of Predatory Lenders and Wall Street Bankers Fleeced America—and Spawned a Global Crisis. Macmillan, New York.
Keys, B.J., Mukherjee, T., Seru, A., Vig, V., 2010. Did securitization lead to lax screening? Evidence from subprime loans. Quarterly Journal of Economics 125(1), 307-362.
Litan, R.E., 2001. A prudent approach to preventing “predatory” lending. Report by The American Bankers Association.
Melzer, B., 2011. The real costs of credit access: Evidence from the payday lending market. Quarterly Journal of Economics 126(1), 517-555.
Morse, A., 2011. Payday lenders: Heroes or villains? Journal of Financial Economics 102(1), 28-44.
Piskorski, T., Seru, A., Witkin, J., 2013. Asset quality misrepresentation by financial intermediaries: Evidence from RMBS market. NBER working paper #18843.
Rajan, U., Seru, A., Vig, V., 2013. The failure of models that predict failure: Distance, incentives and defaults. Journal of Financial Economics, forthcoming.
U.S. Government Accountability Office (GAO), 2004. Consumer protection: Federal and state agencies face challenges in combating predatory lending. Report 04-280, http://www.gao.gov/new.items/d04280.pdf

37
Yandle, B., 1983. Bootleggers and Baptists: The education of a regulatory economist. Regulation 7(3), 12-16.
Yandle, B., 1999. Bootleggers and Baptists in retrospect. Regulation 22(3), 5-7.

38
Appendix. Media News around the Treatment Period The following list of articles reflects the public information and sentiment regarding the HB4050 program. This list provides brief summaries of the articles. July 2005:
- Governor Blagojevich signs House Bill 4050, which is designed to protects homebuyers from
predatory lending in Cook County’s at-risk communities and reduce the incidence of
foreclosures; the project is scheduled to begin January 1, 2006 (U.S. Fed News, July 21, 2005).
- Mortgage brokers are concerned about the impact of the new legislation on origination business
(Origination News, July 1, 2005).
January 2006:
- HB4050 is postponed due to technical and logistic issues (National Mortgage News, January 9,
2006).
March 2006:
- Mortgage lenders object to HB4050 and argue that its compliance costs may prompt firms to
withdraw from the market (Chicago Tribune, March 19, 2006).
August 2006:
- HB4050 goes into effect on September 1, 2006 (Chicago Tribune, August 20, 2006).
September 2006:
- “Mortgage pros fear new state regulations will hurt business” (Chicago Sun-Times, September
11, 2006)
- “Critics say counseling requirement amounts to redlining” (Chicago Tribune, September 18,
2006)
October 2006:
- “State mortgage law backfires on most vulnerable homeowners” (Chicago Sun-Times, October 5,
2006)
- Governor Blagojevich advertises the “[HB4050] pilot program [as] providing borrowers with
critical information on home loans and help[ing] state regulators and law enforcement track and
crack down on dishonest lenders” (October 31, 2006).

39
November 2006:
- A group of residents and members of the real-estate community submit a lawsuit against the state
claiming discrimination. (Chicago Tribune, November 2, 2006)
- “Governor Blagojevich announces results of increased crackdown on unlicensed mortgage loan
originators” (US Fed News, November 3, 2006)
- The Coalition to Rescind HB4050 delivers petitions demanding amendments to HB4050
(November 6). The Coalition is led by John Paul (president of the Greater Englewood Family
Taskforce) and Julie Santos (an immigrants’ rights activist). They work towards the final veto
session before the deadline of December 1, 2006.
John Paul says, “We are calling our State officials to ‘Get on Board’ and ‘Get on FIRE’ working
to rescind this discriminatory law and head-off declining property value.”
Chicago mayoral candidate Dorothy Brown (supports the Coalition) says, “At issue is whether
HR 4050, the state's pilot program designed to fight predatory lending practices, is meeting its
objective or whether it is hurting the very people it is supposed to help... [HB4050] makes it
harder for potential homeowners to get credit in those designated areas.” (South Street Journal,
November 23, 2006)
- “Neighborhood Housing Services (NHS) of Chicago, a nonprofit housing organization, and its
lender partners are providing affordable financing to meet the needs of homebuyers and
homeowners throughout Chicago and in the House Bill 4050 Pilot Program Area” (U.S.
Newswire, November 6, 2006)
- Critics say the counseling requirement is racist. Julie Santos (Coalition to Rescind HB4050) says
that the law has made undocumented Hispanic immigrants afraid to buy homes because they
hesitate to include their legal status in the state program's database. (Chicago Tribune, November
14, 2006)
- “Mortgage counseling law draws 2nd suit.” The suit was filed by three consumers who say they
have had difficulties buying, selling, or refinancing because of the law and one real-estate agent
who reports a significant decline in business because of it, according to the federal complaint.
(Chicago Tribune, November 16, 2006)
- Mortgage brokers, realtors, home builders, and community groups agree about HB4050:
“[HB4050] targets and stigmatizes primarily African American neighborhoods” (Chicago Sun-
Times, November 17, 2006)
- Under the direction of Governor Blagojevich, Secretary of Financial and Professional Regulation
(IDFPR) Dean Martinez announces that he will hold a meeting with community leaders,
legislators, homeowners, and real-estate professionals to discuss ways to improve the pilot
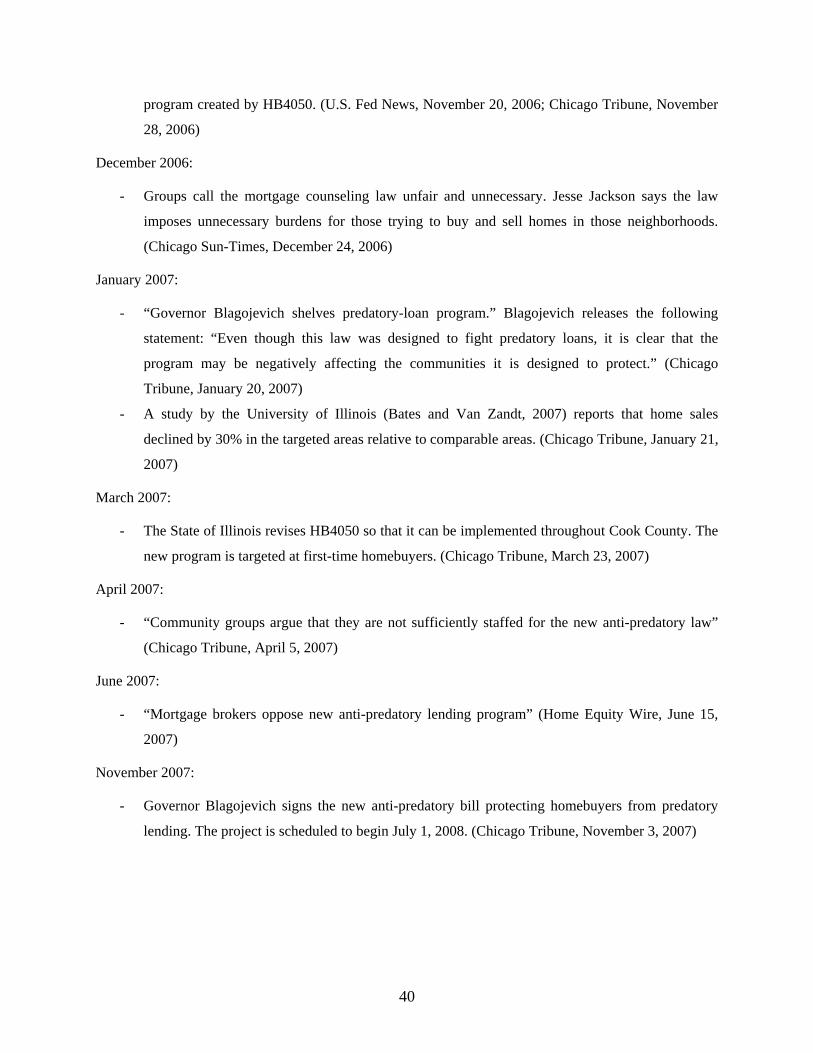
40
program created by HB4050. (U.S. Fed News, November 20, 2006; Chicago Tribune, November
28, 2006)
December 2006:
- Groups call the mortgage counseling law unfair and unnecessary. Jesse Jackson says the law
imposes unnecessary burdens for those trying to buy and sell homes in those neighborhoods.
(Chicago Sun-Times, December 24, 2006)
January 2007:
- “Governor Blagojevich shelves predatory-loan program.” Blagojevich releases the following
statement: “Even though this law was designed to fight predatory loans, it is clear that the
program may be negatively affecting the communities it is designed to protect.” (Chicago
Tribune, January 20, 2007)
- A study by the University of Illinois (Bates and Van Zandt, 2007) reports that home sales
declined by 30% in the targeted areas relative to comparable areas. (Chicago Tribune, January 21,
2007)
March 2007:
- The State of Illinois revises HB4050 so that it can be implemented throughout Cook County. The
new program is targeted at first-time homebuyers. (Chicago Tribune, March 23, 2007)
April 2007:
- “Community groups argue that they are not sufficiently staffed for the new anti-predatory law”
(Chicago Tribune, April 5, 2007)
June 2007:
- “Mortgage brokers oppose new anti-predatory lending program” (Home Equity Wire, June 15,
2007)
November 2007:
- Governor Blagojevich signs the new anti-predatory bill protecting homebuyers from predatory
lending. The project is scheduled to begin July 1, 2008. (Chicago Tribune, November 3, 2007)
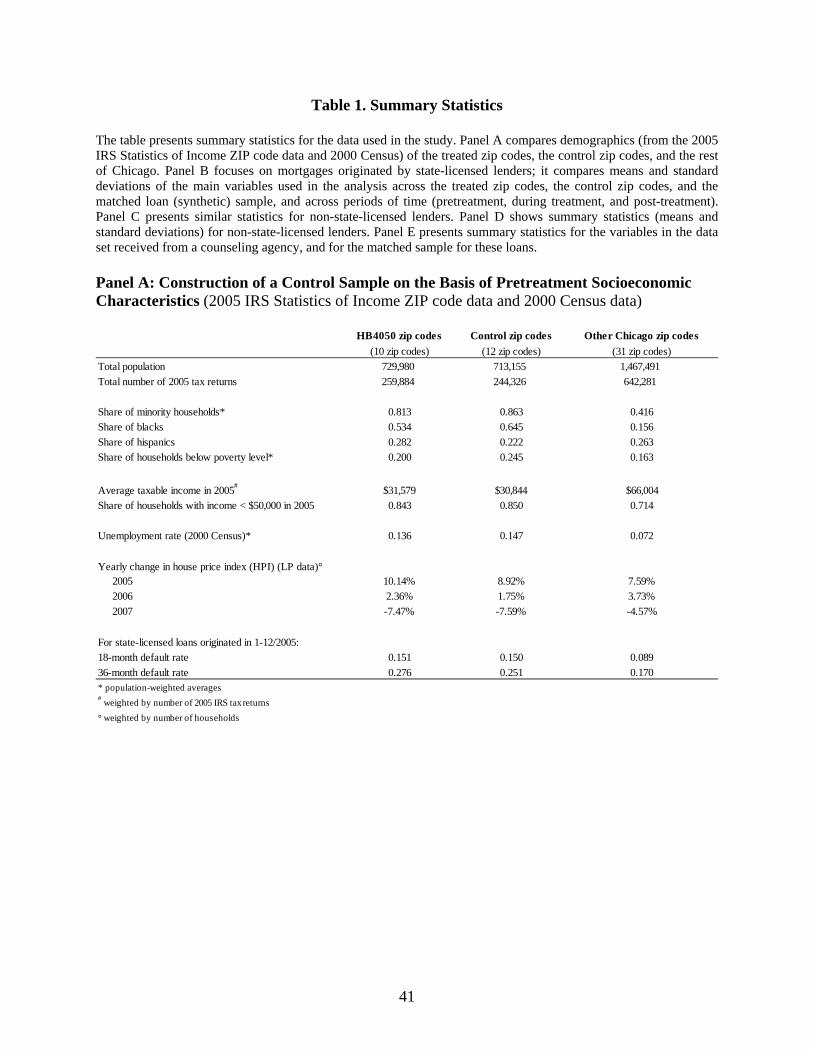
41
Table 1. Summary Statistics The table presents summary statistics for the data used in the study. Panel A compares demographics (from the 2005 IRS Statistics of Income ZIP code data and 2000 Census) of the treated zip codes, the control zip codes, and the rest of Chicago. Panel B focuses on mortgages originated by state-licensed lenders; it compares means and standard deviations of the main variables used in the analysis across the treated zip codes, the control zip codes, and the matched loan (synthetic) sample, and across periods of time (pretreatment, during treatment, and post-treatment). Panel C presents similar statistics for non-state-licensed lenders. Panel D shows summary statistics (means and standard deviations) for non-state-licensed lenders. Panel E presents summary statistics for the variables in the data set received from a counseling agency, and for the matched sample for these loans. Panel A: Construction of a Control Sample on the Basis of Pretreatment Socioeconomic Characteristics (2005 IRS Statistics of Income ZIP code data and 2000 Census data)
HB4050 zip codes Control zip codes Other Chicago zip codes
(10 zip codes) (12 zip codes) (31 zip codes)
Total population 729,980 713,155 1,467,491
Total number of 2005 tax returns 259,884 244,326 642,281
Share of minority households* 0.813 0.863 0.416
Share of blacks 0.534 0.645 0.156
Share of hispanics 0.282 0.222 0.263
Share of households below poverty level* 0.200 0.245 0.163
Average taxable income in 2005#
$31,579 $30,844 $66,004
Share of households with income < $50,000 in 2005 0.843 0.850 0.714
Unemployment rate (2000 Census)* 0.136 0.147 0.072
Yearly change in house price index (HPI) (LP data)° 2005 10.14% 8.92% 7.59%
2006 2.36% 1.75% 3.73%
2007 -7.47% -7.59% -4.57%
For state-licensed loans originated in 1-12/2005:
18-month default rate 0.151 0.150 0.089
36-month default rate 0.276 0.251 0.170* population-weighted averages# weighted by number of 2005 IRS tax returns
° weighted by number of households

42
Table 1. Summary Statistics (Cont.) Panel B: State-Licensed Lenders
Panel C: Non-State-Licensed Lenders
HB 4050 Control Synthetic HB 4050 Control Synthetic HB 4050 Control SyntheticZip codes: 10 12 43 10 12 43 10 12 43N 13,321 11,433 13,321 1,089 2,469 1,089 1,016 920 1,016FICO 621.75 622.47 623.07 630.11 624.67 629.42 614.68 620.77 618.96
[60.95] [62.02] [60.05] [59.30] [60.46] [58.11] [56.37] [59.26] [54.85]FICO ≤ 620 (0/1) 0.49 0.49 0.47 0.42 0.47 0.42 0.55 0.49 0.50
[0.50] [0.50] [0.50] [0.49] [0.50] [0.49] [0.50] [0.50] [0.50]Interest spread (%) 5.13 5.16 5.09 4.87 5.22 5.04 5.05 5.08 5.09
[1.08] [1.11] [1.14] [0.84] [0.96] [1.09] [0.76] [0.85] [0.87]ARM (0/1) 0.86 0.86 0.87 0.74 0.77 0.80 0.64 0.61 0.63
[0.35] [0.35] [0.33] [0.44] [0.42] [0.40] [0.48] [0.49] [0.48]No/low doc (0/1) 0.43 0.45 0.46 0.41 0.44 0.48 0.35 0.34 0.37
[0.50] [0.50] [0.50] [0.49] [0.50] [0.50] [0.48] [0.48] [0.48]Category I (0/1) 0.89 0.90 0.91 0.82 0.84 0.88 0.72 0.70 0.74
[0.31] [0.31] [0.29] [0.39] [0.37] [0.33] [0.45] [0.46] [0.44]Category II (0/1) 0.16 0.16 0.15 0.13 0.18 0.16 0.11 0.16 0.16
[0.37] [0.37] [0.36] [0.34] [0.38] [0.36] [0.32] [0.37] [0.37]100% LTV (0/1) 0.16 0.15 0.15 0.14 0.15 0.14 0.06 0.05 0.05
[0.37] [0.35] [0.36] [0.35] [0.36] [0.34] [0.24] [0.22] [0.21]LTV (%) 84.70 83.43 84.05 83.92 83.25 83.87 80.60 79.10 79.72
[12.03] [12.83] [12.35] [12.09] [12.95] [11.81] [12.32] [13.50] [12.47]Excessive (0/1) 0.12 0.11 0.12 0.09 0.10 0.10 0.03 0.03 0.03
[0.33] [0.32] [0.33] [0.28] [0.31] [0.30] [0.17] [0.18] [0.17]Defaulted within 18 months (0/1) 0.184 0.187 0.162 0.247 0.285 0.264 0.297 0.291 0.274
[0.39] [0.39] [0.37] [0.43] [0.45] [0.44] [0.46] [0.45] [0.45]Defaulted within 36 months (0/1) 0.340 0.320 0.287 0.530 0.538 0.517 0.536 0.527 0.510
[0.47] [0.47] [0.45] [0.50] [0.50] [0.50] [0.50] [0.50] [0.50]
Pre-treatment (1/2005-8/2006) Treatment Period (9/2006-1/2007) Post-treatment (2/2007-12/2007)
HB 4050 Control Synthetic HB 4050 Control Synthetic HB 4050 Control Synthetic
Zip codes: 10 12 43 10 12 43 10 12 43
N 2,276 1,994 2,276 811 758 811 211 185 211
FICO 642.78 639.90 645.64 641.77 635.57 643.57 649.71 647.41 651.28
[61.76] [61.12] [60.56] [61.24] [57.44] [59.49] [63.68] [65.83] [63.32]
FICO ≤ 620 (0/1) 0.37 0.38 0.35 0.34 0.38 0.33 0.34 0.36 0.32
[0.48] [0.49] [0.48] [0.47] [0.49] [0.47] [0.47] [0.48] [0.47]
Interest spread (%) 4.99 5.05 4.72 4.98 5.03 4.80 4.56 4.82 4.28
[1.39] [1.32] [1.47] [1.22] [1.10] [1.21] [1.30] [1.21] [1.40]
ARM (0/1) 0.68 0.70 0.72 0.65 0.67 0.70 0.48 0.54 0.55
[0.47] [0.46] [0.45] [0.48] [0.47] [0.46] [0.50] [0.50] [0.50]
No/low doc (0/1) 0.46 0.46 0.48 0.47 0.50 0.52 0.48 0.52 0.57
[0.50] [0.50] [0.50] [0.50] [0.50] [0.50] [0.50] [0.50] [0.50]
Category I (0/1) 0.86 0.86 0.86 0.77 0.81 0.84 0.74 0.78 0.80
[0.35] [0.35] [0.34] [0.42] [0.39] [0.37] [0.44] [0.42] [0.40]Category II (0/1) 0.39 0.40 0.35 0.19 0.20 0.18 0.36 0.29 0.26
[0.49] [0.49] [0.48] [0.39] [0.40] [0.39] [0.48] [0.46] [0.44]
100% LTV (0/1) 0.15 0.14 0.13 0.13 0.13 0.12 0.01 0.04 0.01
[0.36] [0.35] [0.33] [0.34] [0.34] [0.32] [0.12] [0.20] [0.12]
LTV (%) 82.94 81.87 82.02 82.95 82.61 82.35 77.59 77.05 77.23
[13.72] [14.40] [13.47] [13.39] [13.91] [13.37] [13.24] [13.96] [12.09]
Excessive (0/1) 0.09 0.08 0.09 0.09 0.10 0.09 0.00 0.04 0.03
[0.29] [0.28] [0.28] [0.28] [0.30] [0.29] [0.07] [0.19] [0.18]
Defaulted within 18 months (0/1) 0.156 0.135 0.114 0.207 0.240 0.203 0.147 0.254 0.190
[0.36] [0.34] [0.32] [0.41] [0.43] [0.40] [0.35] [0.44] [0.39]
Defaulted within 36 months (0/1) 0.300 0.276 0.239 0.471 0.471 0.428 0.379 0.465 0.389
[0.46] [0.45] [0.43] [0.50] [0.50] [0.50] [0.49] [0.50] [0.49]
Post-treatment (2/2007-12/2007)Treatment Period (9/2006-1/2007)Pre-treatment (1/2005-8/2006)

43
Table 1. Summary Statistics (Cont.) Panel D: Mean and Standard Deviations of Lender-Level Characteristics for State-Licensed Lenders in the HB4050 Zip Codes in 6–8/2006
Panel E: Means and Standard Deviations of Counseling Agency Data and Matched Loans
N 49
Lender exited during HB4050 (0/1) (>90% decline) 0.51
[0.51]
Share of category I loans 0.88
[0.19]
Share of category II loans 0.19
[0.28]
Share of excessive loans 0.15
[0.22]
log(Avg monthly # transactions) -0.16
[2.07]
HB 4050 loans Matched loans
N 121 1,048
Counselled 1.00 0.00
0.00 0.00
90 days delinquent (18 months) 0.13 0.13
[0.34] [0.34]
90 days delinquent (36 months) 0.41 0.28
[0.49] [0.45]
Foreclosure (18 months) 0.07 0.10
[0.26] [0.30]
Foreclosure (36 months) 0.20 0.21
[0.40] [0.40]
Red flag 0.38
[0.49]Red flag (fraud) 0.12
[0.32]
Category I 0.84 0.82
[0.36] [0.38]
Category II 0.15 0.12
[0.36] [0.33]
LTV (%) 78.22 77.38
[12.80] [13.68]
Excessive 0.38 0.38
[0.49] [0.49]
log(Loan amount) 12.08 12.14
[0.35] [0.38]

44
Table 2. Effects of HB4050 on Market Activity: Application and Mortgage Volumes The table presents mortgage application and origination statistics for the pre-HB4050, HB4050, and post-HB4050 periods. The sample is stratified by lender type (all lenders, state-licensed lenders, and non- state-licensed lenders) and by transaction type (all, purchases, and refinances). Note that the “Purchases” and “Refinances” categories do not necessarily add up to the “All” category because some mortgages have other purposes, e.g., home improvement. Panel A and Panel B present an analysis of mortgage applications using HMDA data. Panel C presents an analysis of mortgage originations using the matched LP-HMDA data. Panel D limits the sample to loans to borrowers with FICO scores lower than 620. Panel A: The Effect of HB4050 on the Number of Mortgage Applications (HMDA Sample)
All Purchases Refinances All Purchases Refinances1/2005-8/2006 4,813 2,201 2,507 4,218 1,949 2,1759/2006-1/2007 (HB4050 period) 2,371 1,086 1,238 3,642 1,631 1,9372/2007-12/2007 2,136 619 1,453 1,882 593 1,240Diff (9/06-1/07 vs. 1/05-8/06) -50.7% -50.7% -50.6% -13.7% -16.3% -11.0%Diff-in-diff -37.1% -34.3% -39.7%
All Purchases Refinances All Purchases Refinances1/2005-8/2006 1,676 561 984 1,362 479 7809/2006-1/2007 (HB4050 period) 1,808 644 1,000 1,585 615 8512/2007-12/2007 1,885 623 1,091 1,585 561 884Diff (9/06-1/07 vs. 1/05-8/06) 7.9% 14.7% 1.6% 16.4% 28.6% 9.1%Diff-in-diff -8.5% -13.9% -7.5%
Diff-in-diff-in-diff -28.6% -20.5% -32.2%
# Applications per Month for State-Licensed LendersAll HB4050 zip codes All Control zip codes
# Applications per Month for Non-State-Licensed LendersAll HB4050 zip codes All Control zip codes

45
Table 2. Effects of HB4050 on Market Activity: Application and Mortgage Volumes (Cont.) Panel B: The Effect of HB4050 on the Number of Originated Mortgages (HMDA Sample)
Panel C: The Effect of HB4050 on the Number of Originated Mortgages for Borrowers with FICO ≤ 620 (LP-HMDA Sample)
All Purchases Refinances All Purchases Refinances1/2005-8/2006 1,803 912 854 1,507 760 7169/2006-1/2007 (HB4050 period) 703 294 394 1,245 529 6932/2007-12/2007 582 154 406 508 153 339Diff (9/06-1/07 vs. 1/05-8/06) -61.0% -67.7% -53.9% -17.4% -30.4% -3.2%Diff-in-diff -43.6% -37.3% -50.7%
All Purchases Refinances All Purchases Refinances1/2005-8/2006 711 252 409 552 199 3159/2006-1/2007 (HB4050 period) 772 261 440 627 222 3552/2007-12/2007 722 240 418 586 209 326Diff (9/06-1/07 vs. 1/05-8/06) 8.5% 3.4% 7.5% 13.6% 11.9% 12.7%Diff-in-diff -5.0% -8.5% -5.1%
Diff-in-diff-in-diff -38.6% -28.8% -45.5%
# Mortgages per Month for Non-State-Licensed LendersAll HB4050 zip codes All Control zip codes
# Mortgages per Month for State-Licensed LendersAll HB4050 zip codes All Control zip codes
All Purchases Refinances All Purchases Refinances1/2005-8/2006 666 278 388 572 237 3359/2006-1/2007 (HB4050 period) 218 71 147 494 163 3312/2007-12/2007 92 16 76 84 16 68Diff (9/06-1/07 vs. 1/05-8/06) -67.3% -74.5% -62.2% -13.6% -31.2% -1.2%Diff-in-diff -53.7% -43.3% -61.0%
All Purchases Refinances All Purchases Refinances1/2005-8/2006 114 45 68 100 36 649/2006-1/2007 (HB4050 period) 162 57 105 152 51 1002/2007-12/2007 19 3 16 17 4 13Diff (9/06-1/07 vs. 1/05-8/06) 42.5% 25.1% 54.1% 52.1% 42.2% 57.7%Diff-in-diff -9.5% -17.1% -3.6%
Diff-in-diff-in-diff -44.2% -26.2% -57.4%
# Mortgages per Month for Non-State-Licensed LendersAll HB4050 zip codes All Control zip codes
# Mortgages per Month for State-Licensed LendersAll HB4050 zip codes All Control zip codes

46
Table 3. Effects of HB4050 on Mortgage Characteristics The table presents regressions of borrower and mortgage characteristics on the HB4050 indicator. The sample used in Panel A includes all lenders. The sample used in Panel B includes only lenders who stayed in the market during the treatment period in the HB4050 zip codes. HB4050 is an indicator of whether the loan was originated in the treated HB4050 zip codes during the treatment period. FICO is the FICO credit score of the borrower. Interest spread measures the interest spread over the same-maturity treasury rate (for fixed rate mortgages) or the quoted interest spread (for adjustable rate mortgages). ARM is an indicator of whether a mortgage is an adjustable rate mortgage. No/low doc is an indicator of whether the loan required no or low documentation. Category I is an indicator of interest-only loans, loans with interest rate adjustments within three years, or loans underwritten on the basis of stated income (no/low-doc loans). Category II includes loans with negative amortization or prepayment penalties. 100% LTV is an indicator of whether the loan has a 100% loan-to-value ratio. Excessive mortgages are defined by HB4050 as mortgages that are ARM, low documentation, interest-only, and ≥95% LTV. Standard errors, presented in parentheses, are clustered at the zip code level. *, **, and *** denote statistical significance at the 10%, 5%, and 1% level, respectively. Panel A: All Lenders
Panel B: Lenders Who Stayed in HB4050 Zip Codes during the Treatment Period
Interest No/low Category I Category II 100% LTV ExcessiveDependent variable: FICO spread (%) ARM (0/1) doc (0/1) (0/1) (0/1) (0/1) (0/1)
(1) (2) (3) (4) (5) (6) (7) (8)HB4050 Zip Code 7.842*** -0.429*** -0.052** 0.007 -0.026 -0.039** -0.025 -0.022** × State licensed lender (1.933) (0.036) (0.020) (0.017) (0.019) (0.014) (0.018) (0.011)
Month × State licensed FE Yes Yes Yes Yes Yes Yes Yes YesZip × State licensed FE Yes Yes Yes Yes Yes Yes Yes Yes
Observations 36,483 29,367 36,483 36,483 36,483 36,483 36,483 36,483
Adj. R2
0.035 0.042 0.057 0.067 0.044 0.041 0.016 0.025
Interest No/low Category I Category II 100% LTV ExcessiveDependent variable: FICO spread (%) ARM (0/1) doc (0/1) (0/1) (0/1) (0/1) (0/1)
(1) (2) (3) (4) (5) (6) (7) (8)HB4050 Zip Code 7.770*** -0.295*** -0.022 0.019 -0.011 -0.043** -0.035* -0.021 × State licensed lender (1.888) (0.037) (0.023) (0.021) (0.021) (0.016) (0.018) (0.013)
Month × State licensed FE Yes Yes Yes Yes Yes Yes Yes YesZip × State licensed FE Yes Yes Yes Yes Yes Yes Yes Yes
Observations 22,311 17,385 22,311 22,311 22,311 22,311 22,311 22,311
Adj. R2
0.042 0.067 0.071 0.072 0.050 0.082 0.022 0.023

47
Table 4. Exit of Lenders Due to HB4050 The table presents analysis of lender exit during the HB4050 pilot. Panel A presents statistics about the number of lenders in the treatment and control areas during different time periods. Panel B shows summary statistics of lenders by whether they stayed or exited the HB4050 zip codes during the anti-predatory pilot. The statistics presented are based on 55 lenders identified in the matched sample HMDA-LP and are based on pre-announcement statistics from January to December 2005.
Panel A: Number of Lenders Operating in the Treatment and Controls Areas
Panel B: Characteristics of Lenders Who Exited the HB4050 Zip Codes (Based on 2005 Originations)
HB4050 Control Synthetic HB4050 Control SyntheticPre HB4050 (1/2005 - 8/2006) 89 79 87 33 33 35HB4050 (9/2006 - 1/2007) 46 63 61 23 27 24Post HB4050 (2/2007 - 12/2007) 28 29 30 15 14 18Diff (9/06-1/07 vs. 1/05-8/06) -48.3% -20.3% -29.9% -30.3% -18.2% -31.4%Diff-in-Diff (Control) -18.4% 1.1%Diff-in-Diff (Synthetic) -28.1% -12.1%
Diff-in-Diff-in-Diff (Control) -19.6%Diff-in-Diff-in-Diff (Synthetic) -15.9%
# State-licensed lenders # Non-state-licensed lenders
Statistics in Jan-Dec/2005 Stayed Exited Stayed Exited# Mortgages (per month) 17.7 11.6 4.8 0.7
Avg FICO 645.8 639.6 675.5 710.5Avg interest spread (%) 4.84 4.73 4.10 3.30
% Arm (0/1) 74.0% 83.8% 59.2% 50.0%
% Low doc 45.0% 52.6% 61.3% 100.0%% Category I 86.6% 93.0% 81.3% 100.0%% Category II 26.8% 29.0% 35.7% 0.0%% Default within 18 months 10.4% 11.6% 9.2% 12.5%% 100% LTV 22.7% 14.6% 8.9% 0.0%% Excessive 11.2% 14.0% 6.6% 0.0%# Lenders 21 22 11 1
State-licensed lenders Non-state-licensed lenders

48
Table 5. The Effect of HB4050 on Borrower Default The table presents regressions of borrower defaults. Panels A and B present baseline regressions. Panels A and C use the treatment sample and a control sample based on zip codes with similar demographics. Panels B and D use the treatment sample and a control sample based on one-to-one loan matching (the synthetic control sample). Panel E uses both control samples. In each panel, there are six regression specifications. In all regressions, we regress the default indicator on the treatment dummy with the following: zip code interacted with calendar month, zip code interacted with a state-licensed lender indicator, and calendar month interacted with a state-licensed lender indicator. These three sets of fixed effects control for variations in all three dimensions that define the treatment: treatment zip code, treatment month, and treatment lender group. In Column (1) in each panel, we include no other controls. In Column (2), we include controls for FICO score and logged loan amount. In Column (3), we include a no/low documentation indicator, indicators of whether the loan is Category I or Category II, and an LTV variable. Columns (4) to (6) repeat the specifications of Columns (1) to (3) but add lender fixed effects. The dependent variable is an indicator of borrower default (within 18 or 36 months). Default is defined as a 90-day delinquency. HB4050 is an indicator of whether the loan was originated in the treated HB4050 zip codes during the treatment period. FICO/100 is the FICO credit score of the borrower (divided by 100). No/low doc is an indicator of whether the loan required no or low documentation. Category I is an indicator for interest-only loans, loans with interest rate adjustments within three years, or loans underwritten on the basis of stated income (no/low-doc loans). Category II includes loans with negative amortization or prepayment penalties. The tables also show statistics about the default rate in the control group. Standard errors, presented in parentheses, are clustered at the zip code level. *, **, and *** denote statistical significance at the 10%, 5%, and 1% level, respectively.
Panel A: All LP-HMDA Loans; HB4050 Loans and Control Sample
Sample:Dependent variable:
Default rate for the control group during pilot:
(1) (2) (3) (4) (5) (6)HB4050 Zip × Month × Lender 0.010 0.009 0.008 0.001 0.000 0.002
(0.025) (0.024) (0.023) (0.028) (0.027) (0.026)
FICO/100 -0.045*** -0.071*** -0.044*** -0.068***
(0.006) (0.005) (0.006) (0.005)log(Loan amount) 0.167*** 0.098*** 0.152*** 0.094***
(0.015) (0.016) (0.014) (0.015)No/low doc 0.048*** 0.047***
(0.007) (0.007)Category I 0.059*** 0.060***
(0.007) (0.007)Category II -0.016** -0.021**
(0.005) (0.007)LTV 0.003*** 0.003***
(0.000) (0.000)
Zip code FE x Month FE Yes Yes Yes Yes Yes YesZip code FE x State-licensed FE Yes Yes Yes Yes Yes YesMonth FE x State-licensed FE Yes Yes Yes Yes Yes YesLender FE No No No Yes Yes Yes
Observations 36,483 36,483 36,483 36,483 36,483 36,483Adj. R2
0.043 0.064 0.082 0.059 0.077 0.092
All mortgages, 2005-2007; Control is based on 12 zip codesDefault within 18 months (0/1)
0.274
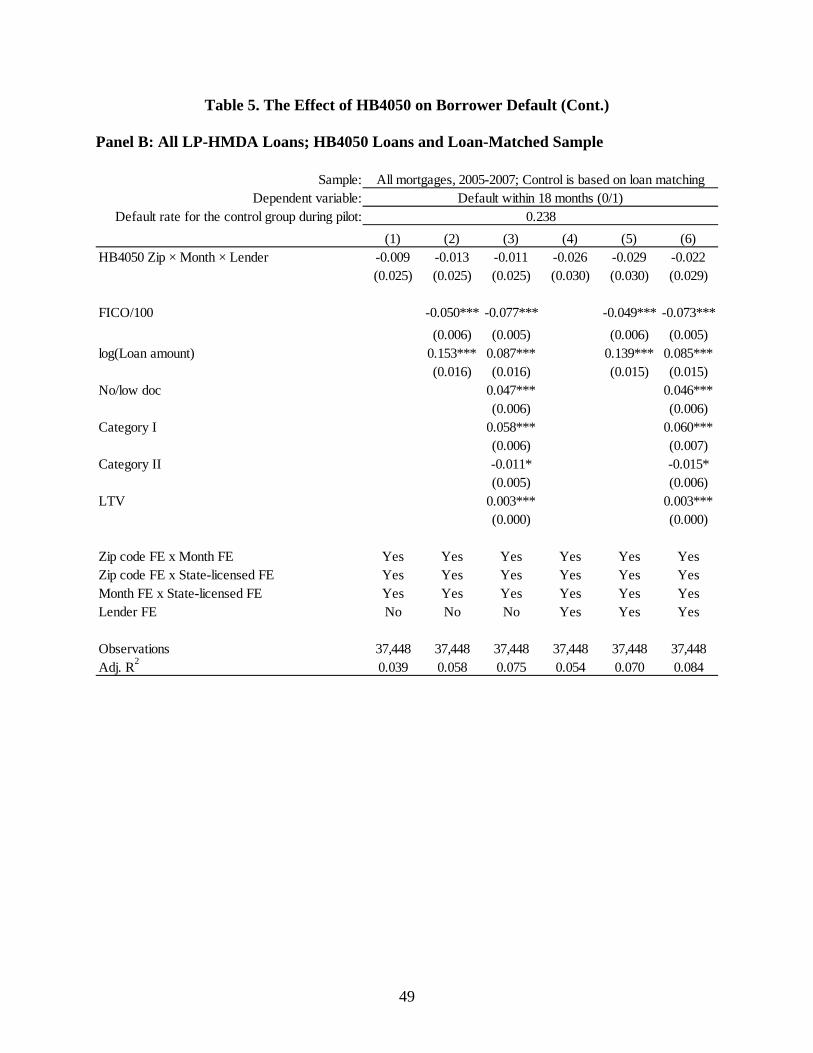
49
Table 5. The Effect of HB4050 on Borrower Default (Cont.) Panel B: All LP-HMDA Loans; HB4050 Loans and Loan-Matched Sample
Sample:
Dependent variable:Default rate for the control group during pilot:
(1) (2) (3) (4) (5) (6)HB4050 Zip × Month × Lender -0.009 -0.013 -0.011 -0.026 -0.029 -0.022
(0.025) (0.025) (0.025) (0.030) (0.030) (0.029)
FICO/100 -0.050*** -0.077*** -0.049*** -0.073***
(0.006) (0.005) (0.006) (0.005)log(Loan amount) 0.153*** 0.087*** 0.139*** 0.085***
(0.016) (0.016) (0.015) (0.015)No/low doc 0.047*** 0.046***
(0.006) (0.006)Category I 0.058*** 0.060***
(0.006) (0.007)Category II -0.011* -0.015*
(0.005) (0.006)LTV 0.003*** 0.003***
(0.000) (0.000)
Zip code FE x Month FE Yes Yes Yes Yes Yes YesZip code FE x State-licensed FE Yes Yes Yes Yes Yes YesMonth FE x State-licensed FE Yes Yes Yes Yes Yes YesLender FE No No No Yes Yes Yes
Observations 37,448 37,448 37,448 37,448 37,448 37,448Adj. R
20.039 0.058 0.075 0.054 0.070 0.084
All mortgages, 2005-2007; Control is based on loan matchingDefault within 18 months (0/1)
0.238

50
Table 5. The Effect of HB4050 on Borrower Default (Cont.) Panel C: Default Regression with Sample Limited to Low FICO Score; Control Zip Codes
Panel D: Default Regression with Sample Limited to Low FICO Score; Synthetic Control
(1) (2) (3) (4) (5) (6) N Default rate for controlFICO≤ 620 loans by state-licensed & non-state-licensed lendersTreatment -0.008 -0.006 -0.012 -0.038 -0.034 -0.033 16,967 0.257
(0.043) (0.043) (0.041) (0.041) (0.040) (0.039)
Adj. R2
0.028 0.043 0.058 0.039 0.051 0.065All loans by state-licensed lendersTreatment -0.034 -0.035 -0.028 -0.036 -0.038 -0.029 30,248 0.285
(0.020) (0.021) (0.019) (0.023) (0.023) (0.022)
Adj. R2
0.038 0.058 0.076 0.049 0.066 0.082All FICO≤ 620 loans by state-licensed lendersTreatment -0.045 -0.048* -0.039 -0.048 -0.051* -0.041 14,668 0.264
(0.026) (0.026) (0.025) (0.028) (0.028) (0.027)
Adj. R2
0.027 0.040 0.056 0.034 0.045 0.060All FICO≤ 620 loans by state-licensed lenders that did not exitTreatment -0.027 -0.031 -0.020 -0.033 -0.036 -0.027 8,583 0.204
(0.028) (0.027) (0.026) (0.028) (0.027) (0.026)
Adj. R2
(0.026) 0.043 0.061 0.031 0.047 0.064
(1) (2) (3) (4) (5) (6) N Default rate for controlFICO≤ 620 loans by state-licensed & non-state-licensed lendersTreatment -0.040 -0.039 -0.042 -0.069 -0.065 -0.064 17,080 0.248
(0.046) (0.047) (0.045) (0.047) (0.047) (0.045)
Adj. R2
0.028 0.041 0.055 0.039 0.049 0.062All loans by state-licensed lendersTreatment -0.038 -0.044* -0.034 -0.043 -0.049* -0.037 30,852 0.264
(0.023) (0.024) (0.023) (0.025) (0.025) (0.025)
Adj. R2
0.040 0.057 0.074 0.050 0.065 0.080All FICO≤ 620 loans by state-licensed lendersTreatment -0.064* -0.071** -0.059* -0.070** -0.075** -0.064* 14,776 0.272
(0.032) (0.032) (0.031) (0.034) (0.034) (0.033)
Adj. R2
0.028 0.039 0.055 0.036 0.045 0.060All FICO≤ 620 loans by state-licensed lenders that did not exitTreatment -0.036 -0.042 -0.026 -0.042 -0.047 -0.033 8,529 0.193
(0.037) (0.036) (0.035) (0.035) (0.034) (0.034)
Adj. R2
0.054 0.070 0.093 0.067 0.079 0.099
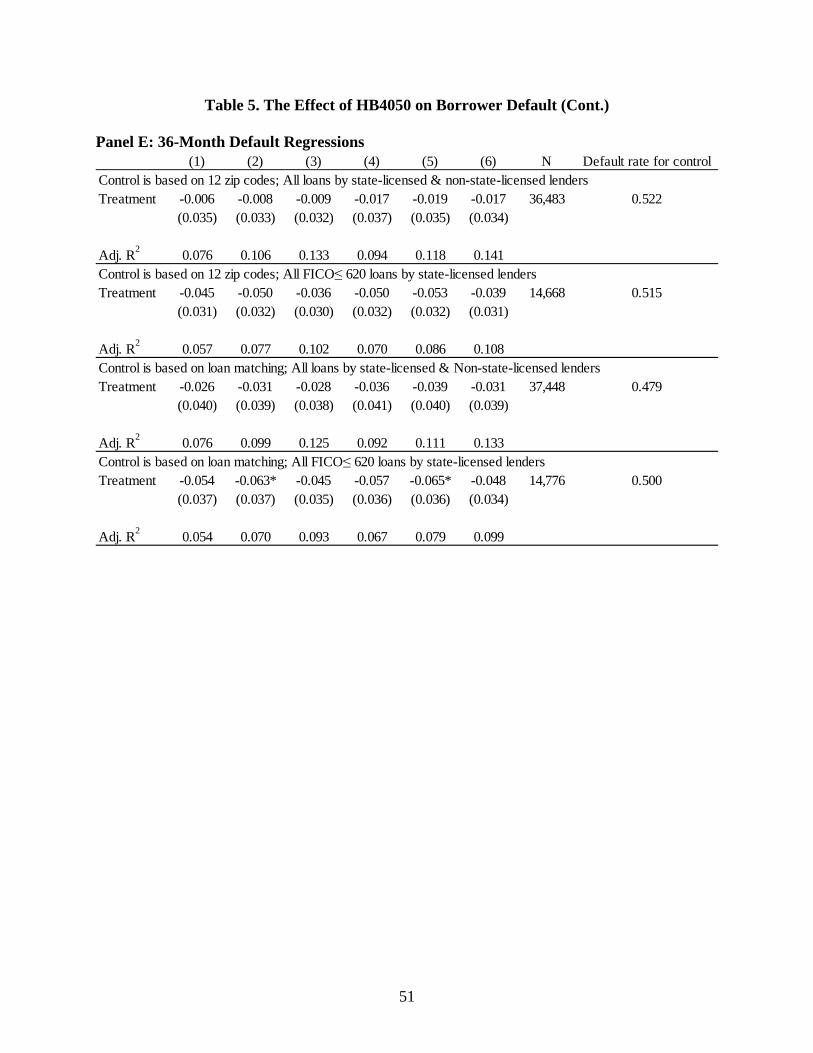
51
Table 5. The Effect of HB4050 on Borrower Default (Cont.) Panel E: 36-Month Default Regressions
(1) (2) (3) (4) (5) (6) N Default rate for controlControl is based on 12 zip codes; All loans by state-licensed & non-state-licensed lendersTreatment -0.006 -0.008 -0.009 -0.017 -0.019 -0.017 36,483 0.522
(0.035) (0.033) (0.032) (0.037) (0.035) (0.034)
Adj. R2
0.076 0.106 0.133 0.094 0.118 0.141Control is based on 12 zip codes; All FICO≤ 620 loans by state-licensed lendersTreatment -0.045 -0.050 -0.036 -0.050 -0.053 -0.039 14,668 0.515
(0.031) (0.032) (0.030) (0.032) (0.032) (0.031)
Adj. R2
0.057 0.077 0.102 0.070 0.086 0.108Control is based on loan matching; All loans by state-licensed & Non-state-licensed lendersTreatment -0.026 -0.031 -0.028 -0.036 -0.039 -0.031 37,448 0.479
(0.040) (0.039) (0.038) (0.041) (0.040) (0.039)
Adj. R2
0.076 0.099 0.125 0.092 0.111 0.133Control is based on loan matching; All FICO≤ 620 loans by state-licensed lendersTreatment -0.054 -0.063* -0.045 -0.057 -0.065* -0.048 14,776 0.500
(0.037) (0.037) (0.035) (0.036) (0.036) (0.034)
Adj. R2
0.054 0.070 0.093 0.067 0.079 0.099

52
Table 6. Measuring the Default Rate of Predatory Loans Using the HB4050 Data Set The table presents analysis of a sample of counseled loans (121 loans) and a control sample of loans matched from other Chicago zip codes (every counseled loan is matched with up to ten similar loans from Chicago). Panel A presents the sample of 121 counseled loans. Panel B presents the sample of 121 together with the 1,048 matched loans. The dependent variable is an indicator of borrower default within 18 months. Default is defined as a 90-day delinquency. Red flag is an indicator of whether the counseled loan was identified as unaffordable or fraudulent by the HUD-certified counselors. Red flag (fraud) is an indicator of whether the counseled loan was identified as having fraud indicia. No/low doc is an indicator of whether the loan required no or low documentation. Category I is an indicator for interest-only loans, loans with interest rate adjustments within three years, or loans underwritten on the basis of stated income (no/low-doc loans). Category II includes loans with negative amortization or prepayment penalties. Excessive mortgages are mortgages that are ARM, no/low documentation, interest-only, or ≥95% LTV. Standard errors, presented in parentheses, are clustered at the zip code level. *, **, and *** denote statistical significance at the 10%, 5%, and 1% level, respectively. Panel A: Predatory Loans in the Counseled Sample
(1) (2) (3) (4)Red flag 0.065 0.036
(0.068) (0.072)Red flag (fraud) 0.123 0.111
(0.106) (0.111)No/low doc -0.081 -0.085
(0.079) (0.079)Category I 0.210* 0.224**
(0.112) (0.111)
Category II 0.024 0.036(0.103) (0.102)
LTV 0.001 0.002
(0.003) (0.003)Excessive 0.100 0.066
(0.207) (0.210)
log(Loan amount) 0.161 0.144(0.124) (0.124)
Month FE Yes Yes Yes Yes
Observations 121 115 121 115
Adj. R2 -0.046 -0.018 -0.042 -0.010
Dependent variable: Defaulted within 18 months (0/1)

53
Table 6. Measuring the Default Rate of Predatory Loans Using the HB4050 Data Set (Cont.)
Panel B: Comparing the Counseled Sample to a Comparable Sample in the Control Zip Codes (18-Month Default Rate)
(1) (2) (3) (4)Red flag 0.061* 0.063*
(0.036) (0.037)Counseled × Red flag -0.011
(0.065)Red flag (fraud) 0.061 0.055
(0.075) (0.075)Counseled × Red flag (fraud) 0.051
(0.102)
Counseled -0.000 0.004 -0.001 -0.007(0.032) (0.041) (0.032) (0.034)
Month FE Yes Yes Yes Yes
Observations 1,159 1,159 1,159 1,159
Adj. R2
0.012 0.011 0.008 0.007
Dependent variable: Defaulted within 18 months (0/1)

54
Figure 1. HB4050 Treatment and Control Zip Codes
This figure presents a map of the HB4050 treatment area (the shaded area) and the control zip codes (the striped area). As described in Section 3.3, the 12–zip code control area is constructed to resemble the treatment area in terms of pretreatment socioeconomic characteristics and housing market conditions. The socioeconomic variables used for selection include 2005 Internal Revenue Service (IRS) zip code–level income statistics, the 2000 Census shares of minority population and of those living below the poverty level, and the unemployment rate. Housing market metrics include default rates on mortgages originated in 2005 as well as zip code–level means of FICO scores, LTV and DTI ratios, and housing values. All of the control zip codes lie within the City of Chicago limits. The 12–zip code control area has about as many residents as the treatment area.

55
Figure 2. HMDA Loan Application Filings This figure presents a time series of loan application filings. Figure 2a depicts filings in both the treatment and control areas, separating lenders subject to HB4050 and those exempt from it. Figure 2b focuses only on the treatment areas, differentiating between lenders that remained active during the mandate period and those that exited HB4050 zip codes. The solid vertical lines denote the time during which HB4050 was in force. Figure 2a. Number of Mortgage Applications in HB4050 Zip Codes and in Control Zip Codes, per State-Licensed and Non-State-Licensed Lenders
Figure 2b. Number of Mortgage Originations in HB4050 Zip Codes and in Control Zip Codes, per State-Licensed and Non-State-Licensed Lenders
0
1,000
2,000
3,000
4,000
5,000
6,000
Jan-
05
Mar
-05
May
-05
Jul-0
5
Sep-
05
Nov
-05
Jan-
06
Mar
-06
May
-06
Jul-0
6
Sep-
06
Nov
-06
Jan-
07
Mar
-07
May
-07
Jul-0
7
Sep-
07
Nov
-07
Num
ber
of A
ppli
cati
ons
State-Licensed Lenders (subject to HB4050)
HB4050 zip codes
Control zip codes
0
1,000
2,000
3,000
4,000
5,000
6,000
Jan-
05
Mar
-05
May
-05
Jul-0
5
Sep-
05
Nov
-05
Jan-
06
Mar
-06
May
-06
Jul-0
6
Sep-
06
Nov
-06
Jan-
07
Mar
-07
May
-07
Jul-0
7
Sep-
07
Nov
-07
Num
ber
of A
ppli
cati
ons
Non-State-Licensed Lenders (Exempt from HB4050)
HB4050 zip codes
Control zip codes
0
500
1,000
1,500
2,000
2,500
Jan-
05
Mar
-05
May
-05
Jul-0
5
Sep-
05
Nov
-05
Jan-
06
Mar
-06
May
-06
Jul-0
6
Sep-
06
Nov
-06
Jan-
07
Mar
-07
May
-07
Jul-0
7
Sep-
07
Nov
-07
Num
ber
of O
rigi
nati
ons
State-Licensed Lenders (subject to HB4050)
HB4050 zip codes
Control zip codes
0
500
1,000
1,500
2,000
2,500
Jan-
05
Mar
-05
May
-05
Jul-0
5
Sep-
05
Nov
-05
Jan-
06
Mar
-06
May
-06
Jul-0
6
Sep-
06
Nov
-06
Jan-
07
Mar
-07
May
-07
Jul-0
7
Sep-
07
Nov
-07
Num
ber
of O
rigi
nati
ons
Non-State-Licensed Lenders (Exempt from HB4050)
HB4050 zip codes
Control zip codes