Precon presentation 2015
81
USING ANALYTICS TO IMPROVE STUDENT SUCCESS: A PRIMER ON LEVERAGING DATA TO ENHANCE STUDENT PERFORMANCE April 12, 2015 Matthew D. Pistilli, PhD
-
Upload
matthew-d-pistilli -
Category
Education
-
view
157 -
download
0
Transcript of Precon presentation 2015
USING ANALYTICS TO
IMPROVE STUDENT
SUCCESS:
A PRIMER ON
LEVERAGING DATA TO
ENHANCE STUDENT
PERFORMANCEApril 12, 2015 Matthew D. Pistilli,
PhD

Plan for the day
Introductions and Purpose
Conceptual Overview
Other Institutions’ Analytics
Five Components of Analytics
Individual/Group Work & Planning
Managing Expectations in Next Steps
Following along:
http://bit.ly/JNGIPreCon2015

Who are we?
Where are we from?
Why are we here?
Introductions and Purpose

Definitions
Student Involvement Theory:
Astin’s Inputs-Environment-Output
Model
Conceptual Overview

Definitions

Definitions of Learning Analytics
The measurement, collection, analysis and
reporting of data about learners and their
contexts, for purposes of understanding and
optimizing learning and the environments in
which it occurs (SoLAR)
Evaluating large data sets to provide decision
makers with information that can help
determine the best course of action for an
organization, with a specific goal of improving
learning outcomes (EDUCAUSE, 2011)

Definitions Continued
Using analytic techniques to help target
instructional, curricular, and support resources
to support the achievement of specific learning
goals (van Bareneveld, Arnold, & Campbell,
2012)
the process of developing actionable insights
through problem definition and the application
of statistical models and analysis against
existing and/or simulated future data (Cooper,
2012)

Definitions Continued
Using data to inform decision-making;
leveraging data to identify students in need of
academic support; and allowing direct user
interaction with a tool to engage in some form
of sensemaking that supports a subsequent
action (Krumm, Washington, Lonn, & Teasley)
The use of data, statistical analysis, and
explanatory and predictive models to gain
insights and act on complex issues (Bichsel,
2012)

Data have power!

Common Themes


Challenge: How do you find the student at risk?
http://www.youthareawesome.com/wp-content/uploads/2010/10/wheres-waldo1.jpg

http://www.youthareawesome.com/wp-content/uploads/2010/10/wheres-waldo1.jpg
Challenge: How do you find the student at risk?

Key Questions Addressed by Analytics
(Davenport, Harris, & Morison, 2010)
Questions to Be Answered
Past Present Future
Information What happened?
(Reporting)
What’s happening
now?
(Alerts)
What will
happen?
(Extrapolation)
Insight
How and why
did it happen?
(Modeling,
Experimental
design)
What’s the next
best action?
(Recommendation)
What’s the
best/worst that
can happen?
(Prediction,
Optimization,
Simulation)

Analytics is about…
Actionable intelligence
Moving research to practice
Basis for design, pedagogy, self-awareness
Changing institutional culture
Understanding the limitations and risks

Inputs-Environment-Output
Student Involvement Theory

Student Involvement Theory
Alexander Astin - UCLA
Involvement:
The amount of physical and psychological energy that the student devotes to the academic experience. (1985, p. 134)
Exists on a continuum, with students investing varying levels of energy
Is both quantitative and qualitative
Direct relationship between student learning and student involvement
Effectiveness of policy or practice directly related to their capacity to increase student learning
(Astin, 1999)

Inputs-Environment-Output
Model
InputsOutpu
t
Environm
ent

Inputs
The personal, background, and
educational characteristics that
students bring with them to
postsecondary education that can
influence educational outcomes
(Astin, 1984).

Inputs
Astin (1993) identified 146 characteristics, including Demographics
Citizenship
Ethnicity
Residency
Sex
Socioeconomic status
High school academic achievement Standardized test scores
GPA
Grades in specific courses
Previous experiences & self-perceptions Reasons for attending college
Expectations
Perceived ability

Outcomes
Basic level
Academic Achievement
Retention
Graduation
More abstractly
Skills
Behaviors
Knowledge
The things we are
attempting to
develop in
students

Environment
Where we have the most control
Factors related to students’ experience while
in college
Astin (1993) identified 192 variables across 8
overarching classifications
Institutional characteristics Financial Aid
Peer group characteristics Major Field
Choice
Faculty characteristics Place of residence
Curriculum Student involvement

Data are changing EVERYTHING

While “Big Data” Raise
Expectations…
student data drive big decisions.

Strategic Intelligence for Higher
Education
How many, how often, where?
Where exactly is the problem?
What actions are needed?
Why is this happening?
What if these trends continue?
What will happen next?
What’s the best that can happen?
Linda Baer,
2014

… requires a shift in
thought.
All this data…

Moving from…
DataDescrib
es
Decides
to…

Other Institutions’ Analytics

Austin Peay University
Degree
Compa
ss

Rio Salado College
Studen
t
Suppor
t
Model

Open Learning Initiative
SNAPP

UMBC Purdue
University
Check My Activity
Campbell & Pistilli, 2012
Analytics 5 Component Model

Modeling retention &
progression
learner
characteristics
instructor
behaviors
fit/learner
perceptions of
belonging
learner
behaviors
course
characteristics
other
supports
retention/
progression
Data Driven
Institutional
Response/Interventions
Data Driven
Institutional
Response/Interventions

Five Components of Analytic
Model
Gather
Predict
ActMonito
r
Refine
Compone
nts are
cyclical
starting
with
gather but
can be
drawn
upon at
any point
in the
cycle.

Analytic Component 1:
Gather

Gather
Data
In multiple formats
From multiple sources
With insights into students & their success
That can be analyzed & manipulated into
formulae
Data is the foundation for this work, and
without good data, the effort may be for
naught.

Where in the world is your
data?
http://geoawesomeness.com/wp-content/uploads/2013/05/music_map.jpg

Gather
Consider:
What types of data are collected at your
institution?
Can you correlate learning data with performance
objectives?
What is being done with the current data?

Gather
Before gathering, determine what will be gathered.
What question are you trying to answer?
To do so, consider…
Where will your focus be?
What data do you already have (or have access to)?
What else do you need to collect? Who owns that data?
What will it take to get access to it?
What are the challenges associated with assembling all the data?
What are the funding implications for data collection and assembly?

Gather
Ultimately, answer the following questions:
1. How will you describe this analytics area to
interested parties?
2. Who are the key stakeholders that need to be
included in discussions?
3. Who should serve as the lead for this area at
your institution?
4. What other considerations are there?

Analytic Component 2:
Predict

Predict
Small group discussion
What student behaviors do you think could be used as
predictors of course outcomes?
Behavior
Source of data
Significance

Predict
Begins with the question asked in Gather:
What do you want to predict?
How do you identify this as a focus area?
Prediction models built will be driven by
Types of data gathered
Question being answered
What’s currently being predicted?
How?
By whom?
In what realms? Student success?
How can you involve those persons in this effort?

Predict
What makes a good model?
Correlation vs. Causation
Expertise required
Data analysis
Statistical
Content
Reliability & Validity
Frequency of updating
Challenges & obstacles

Predict
Develop a framework
Know your student population
Historical data
What interventions are feasible
Rate the predictor

Predict
Ultimately, answer the following questions:
1. How will you describe this analytics area to
interested parties?
2. Who are the key stakeholders that need to be
included in discussions?
3. Who should serve as the lead for this area at
your institution?
4. What other considerations are there?

Analytic Component 3: Act

Act
Harken back to journalism class…
Who?
What?
Where?
When?
Why?
How?
Add:
Available resources?
Timing

Act
Data-Driven Responses
The value of
an idea lies in
the using of it.
~ Thomas
Edison

Act
The importance of feedback:
The purpose of feedback is to reduce the
gap between current understanding [or]
performance and the desired goal.
(Hattie & Timperley, 2007)

Act
Frequency – more is always better
Funding the action
Assessing the impact
What are you assessing?
Were behaviors changed?
How do you know?
Do different actions need to be:
Taken (on your end)?
Suggested (on the students’ end)?

Act
Some things to
bear in mind…

Act
http://c767204.r4.cf2.rackcdn.com/e5f9bcd4-5617-44df-997b-125563cc3027.jpg

Act
< = >

Act
62 words
52 words
40 words

Act
A PERFECT
MATCH! Develop more cost
effective student support
services
Increased efficiency
through more purposeful
student/staff engagement
Supports a more
personalized approach to
promoting retention and
degree completion

Act
Think Pair Share Activity
Take a few minutes to write a message to a
student performing mediocrely.
Share your message with a partner – critique
for:
• Length
• Word/Language choice
• Content
Revise your message based on feedback.

Act
Ultimately, answer the following questions:
1. How will you describe this analytics area to
interested parties?
2. Who are the key stakeholders that need to be
included in discussions?
3. Who should serve as the lead for this area at
your institution?
4. What other considerations are there?

Act
Message construction tool
www.purdue.edu/passnote

Act – A Final Thought
Seek to get
The RIGHT information to
The RIGHT people in
The RIGHT way at
The RIGHT time

Analytic Component 4:
Monitor

Monitor
Formative & summative in nature
Can present challenges and obstacles
It’s a process
Current process must be understood
New/parallel processes developed as necessary
Involving others… to some extent, the more the merrier
Availability of resource (time, money, people)
Timing of monitoring
Ability to react

Monitor
Review
Data collected and used… was it Necessary?
Correct?
Sufficient?
Predictions made… were they Accurate?
Meaningful?
Actions taken… were they Useful?
Sustainable?
Feedback received to date

Monitor
Ultimately, answer the following questions:
1. How will you describe this analytics area to
interested parties?
2. Who are the key stakeholders that need to be
included in discussions?
3. Who should serve as the lead for this area at
your institution?
4. What other considerations are there?

Analytic Component 5: Refine

Refine
Self-improvement process for
Analytics at the institution
The institution
Enrolled students
Continual monitoring
Small tweaks here and there
Major changes after periods of time
Updating of algorithms and statistical models
Outcome data important as
Assessment
Additional components for inclusion in the model

Refine
What was learned from this effort?
Where are the positives?
Where are the deficiencies?
Was the goal realized?
How does the goal/involvement in the project
help meet institutional goals?
Who else needs to be involved to
improve/enhance the process, actions, and
outcomes?
How can lessons learned be applied for future
use?

Refine
Ultimately, answer the following questions:
1. How will you describe this analytics area to
interested parties?
2. Who are the key stakeholders that need to be
included in discussions?
3. Who should serve as the lead for this area at
your institution?
4. What other considerations are there?

Modeling retention &
progression
learner
characteristics
instructor
behaviors
fit/learner
perceptions of
belonging
learner
behaviors
course
characteristics
other
supports
retention/
progression
Data Driven
Institutional
Response/Interventions
Data Driven
Institutional
Response/Interventions

Elevator Speech for Project
Determine/solidify Institutional Goal
Work on Component Templates
Activity

What is your goal for this project?
What have you learned?
What are your next steps?
What questions do you still have?
Institution Reporting & Town
Hall

Managing Expectations in Next
Steps

http://i.imgur.com/nZArTnc.jpg

Expectations Reality
Plug and Play
Immediate results
Solve every problem
– ever!
Universal adoption
Everyone would
love it!
Fits, starts, reboots
Mostly long term
outcomes
Solve some problems,
create some new
problems
Lackluster use
Not everyone loved it

Institutional Challenges
Data in many places, “owned” by many
people/organizations
Different processes, procedures, and
regulations depending on data owner
Everyone can see potential, but all want
something slightly different
Sustainability – “can’t you just…”
Faculty participation is essential
Staffing is a challenge

New Possibilities
Using data that exists on campus
Taking advantages of existing programs
Bringing a “complete picture” beyond
academics
Focusing on the “Action” in “Actionable
Intelligence”

Contact Information
Email: [email protected]
Phone: 317-274-7225
Twitter: @mdpistilli – twitter.com/mdpistilli
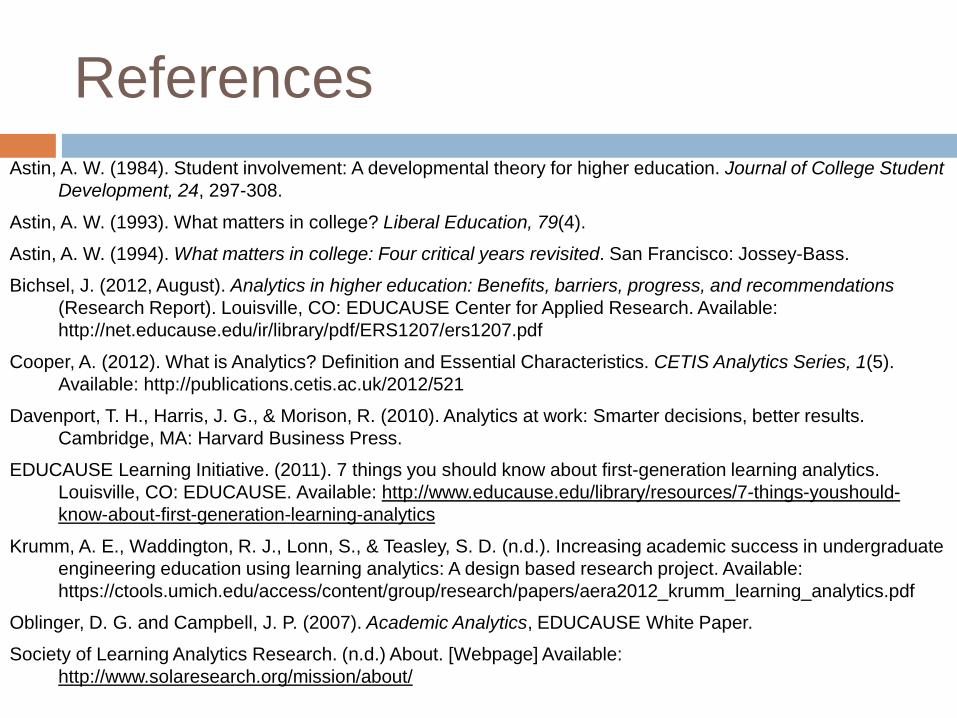
References
Astin, A. W. (1984). Student involvement: A developmental theory for higher education. Journal of College Student
Development, 24, 297-308.
Astin, A. W. (1993). What matters in college? Liberal Education, 79(4).
Astin, A. W. (1994). What matters in college: Four critical years revisited. San Francisco: Jossey-Bass.
Bichsel, J. (2012, August). Analytics in higher education: Benefits, barriers, progress, and recommendations
(Research Report). Louisville, CO: EDUCAUSE Center for Applied Research. Available:
http://net.educause.edu/ir/library/pdf/ERS1207/ers1207.pdf
Cooper, A. (2012). What is Analytics? Definition and Essential Characteristics. CETIS Analytics Series, 1(5).
Available: http://publications.cetis.ac.uk/2012/521
Davenport, T. H., Harris, J. G., & Morison, R. (2010). Analytics at work: Smarter decisions, better results.
Cambridge, MA: Harvard Business Press.
EDUCAUSE Learning Initiative. (2011). 7 things you should know about first-generation learning analytics.
Louisville, CO: EDUCAUSE. Available: http://www.educause.edu/library/resources/7-things-youshould-
know-about-first-generation-learning-analytics
Krumm, A. E., Waddington, R. J., Lonn, S., & Teasley, S. D. (n.d.). Increasing academic success in undergraduate
engineering education using learning analytics: A design based research project. Available:
https://ctools.umich.edu/access/content/group/research/papers/aera2012_krumm_learning_analytics.pdf
Oblinger, D. G. and Campbell, J. P. (2007). Academic Analytics, EDUCAUSE White Paper.
Society of Learning Analytics Research. (n.d.) About. [Webpage] Available:
http://www.solaresearch.org/mission/about/