Precision Nutrient Management - GeoSmart Asia'18 &...
21
Precision Nutrient Management Siva K Balasundram, PhD Associate Professor Department of Agriculture Technology Universiti Putra Malaysia [email protected] GEOSMART ASIA | Kuala Lumpur, Malaysia | October 17-19, 2016 | Geospatial Media & Communications Country Representative
Transcript of Precision Nutrient Management - GeoSmart Asia'18 &...

Precision Nutrient
Management
Siva K Balasundram, PhD
Associate Professor
Department of Agriculture Technology
Universiti Putra Malaysia
GEOSMART ASIA | Kuala Lumpur, Malaysia | October 17-19, 2016 | Geospatial Media & Communications
Country Representative

Motivation for Precision Nutrient
Management (PNM)
Benefit Occurs No Benefit Occurs
ACT Correct action Type II error:
Loss caused
DON’T
ACT
Type I error:
Lost opportunity
Correct inaction
PNM minimizes Type I & Type II errors

Profitability map

Demonstrated benefits of PA
Law et al. (2009a; 2009b)
- PA can be considered as a strategy to increase soil organic
carbon sequestration in oil palm
Baker et al. (2005)
- PA practices reduced the potential off-site transport of
agricultural chemicals via surface runoff, subsurface drainage and
leaching
Snyder (1996)
- Total use of nitrogen fertilizer in a 2-year cropping cycle was
lesser using PA-based nitrogen management as compared to
conventional nitrogen management
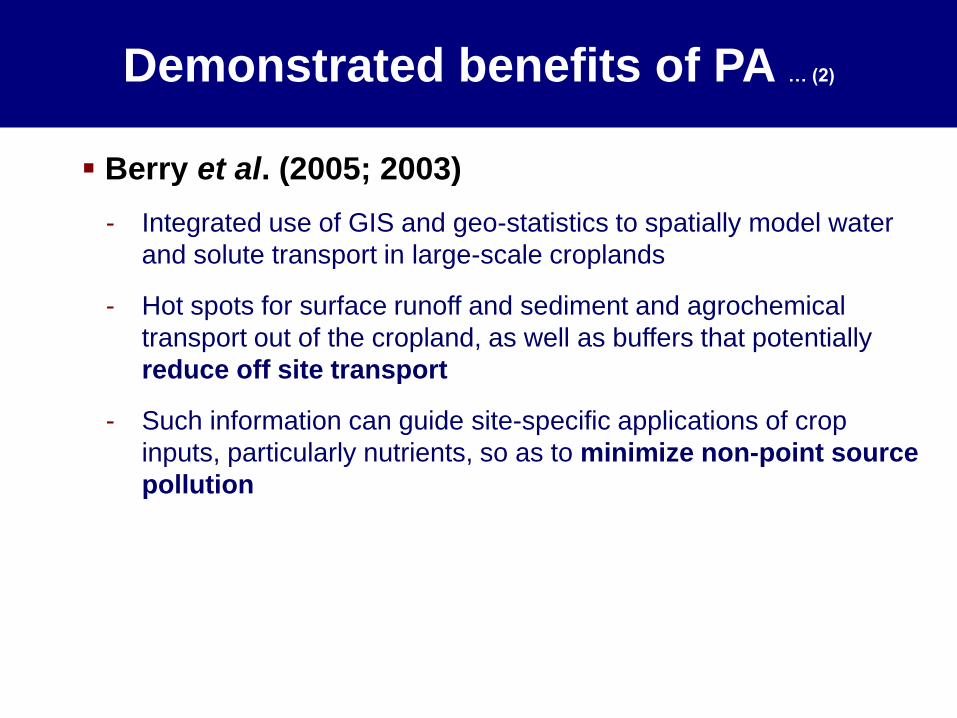
Demonstrated benefits of PA … (2)
Berry et al. (2005; 2003)
- Integrated use of GIS and geo-statistics to spatially model water
and solute transport in large-scale croplands
- Hot spots for surface runoff and sediment and agrochemical
transport out of the cropland, as well as buffers that potentially
reduce off site transport
- Such information can guide site-specific applications of crop
inputs, particularly nutrients, so as to minimize non-point source
pollution

Demonstrated benefits of PA … (3)
Bongiovani (2004)
- PA-based nitrogen fertilization reduced ground water
contamination
Guo-Wei et al. (2008)
- PA-based nutrient management increased the absorption and
use efficiency of nitrogen, phosphorus and potassium in rice
Pompolino et al. (2007)
- PA-based nutrient management reduced nitrogen fertilizer use
by 14% (in Vietnam) and 10% (in The Philippines). Total nitrogen
losses from the soil reduced by 25-27%

Nutrient management
Pest management
Soil erosion management
Soil & water quality
Environmental hazards imposed by
agriculture

PROCESS N P K S OM
Leaching + 0 _ _ _
Denitrification + _ _ _ _
Eutrophication + + _ _ _
Precipitation + + + _ _
Runoff + + _ _ +
Volatilization + _ _ 0 _
Saltation _ _ + _ _
Source: Schepers (2000)
Environmental risks from nutrients
0 – not significant

N fertilizers Highly soluble
Major problem Leaching
Rate of N uptake by plants fits a sigmoid curve
small amounts initially, increasing amounts during grand-
growth stage, lesser amounts as crop matures
Ideal N supply: Based on temporal needs of the crop
to avoid large amounts of nitrate-N in the soil at any one
time
• losses via leaching & denitrification
Precision Nitrogen (N) management

Management Zone (MZ) based on leaching potential
High leaching zone : N
Low leaching zone : N
Leaching MZs
(Mulla & Annandale, 1990):
o Low (index = 5)
o Medium (index = 15)
o High (index = 25)
Precision N management – strategy # 1
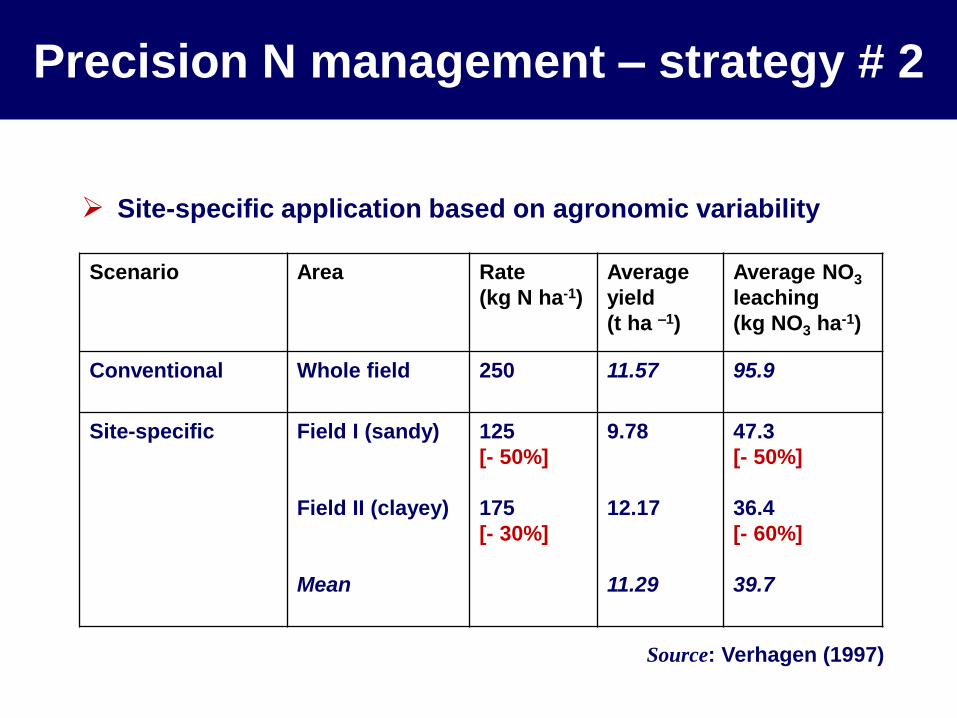
Scenario Area Rate
(kg N ha-1)
Average
yield
(t ha –1)
Average NO3
leaching
(kg NO3 ha-1)
Conventional Whole field 250 11.57 95.9
Site-specific Field I (sandy)
Field II (clayey)
Mean
125
[- 50%]
175
[- 30%]
9.78
12.17
11.29
47.3
[- 50%]
36.4
[- 60%]
39.7
Source: Verhagen (1997)
Site-specific application based on agronomic variability
Precision N management – strategy # 2

P Immobile nutrient
Major problems: 1. Runoff (water-soluble P) 2. Erosion (sediment-bound P)
• Linear
• Soil-specific
Concentration of P in eroded sediment & runoff water
Concentration of extractable P in soil
Precision Phosphorus (P) management

So
uth
to
No
rth
(m
)
West to East (m)
0 73 146 219 293 366
37
73
110
Bray P (mg/kg)
1 - 20
21 - 39
> 40
No application
Variability of extractable P (Bray 1) at soil
surface

Uniform application of P results in test values that are:
1. Excess in extractable P
(prone to losses via runoff & erosion) 21%
2. Low in extractable P
(less desirable for crop growth) 36%
Based on fertilizer recommendation (Rehm et al., 1995):
[Soil testing > 20 mg/kg can be excluded from application]
64% of field need not be fertilized
Rationale for Precision P management

SK Balasundram, PC Robert, DJ Mulla and DL Allan. 2006. Relationship between oil palm yield and soil fertility as affected
by topography in an Indonesian plantation. Communications in Soil Science and Plant Analysis, 37(9&10): 1321-1337.
Effects of topography on soil fertility and oil palm
yields
Empirical production functions were defined for
each topographic position (toeslope, sideslope, summit)
Results:
Yields and soil fertility varied with topographic
position
Measured leaf and soil variables showed varying
levels of optimality/sufficiency across topographic
positions
Our previous work:
Precision oil palm management … (1)

Variables Toeslope Sideslope Summit
Leaf
N
P
K
Mg
Ca
2.75a
0.18a
0.98a
0.40b
0.78a
2.75a
0.15c
0.93b
0.43a
0.72b
2.73a
0.16b
0.96a
0.42ab
0.71b
Soil (0-20 cm)
pH
OM
P
K
Mg
Ca
ECEC
Texture
4.78a
2.59a
79.38a
0.23a
0.65a
1.63a
5.46a
SC
4.27b
2.22b
77.98a
0.20a
0.70a
1.49a
5.80a
LC
4.16c
2.33ab
7.14b
0.20a
0.61a
1.19b
5.02a
LC
Yield 4.43a 3.60b 3.13c
Comparison of variables (leaf and soil) and the
corresponding yield across topography
SK Balasundram, PC Robert, DJ Mulla and DL Allan. 2006. Relationship between oil palm yield and soil fertility as affected
by topography in an Indonesian plantation. Communications in Soil Science and Plant Analysis, 37(9&10): 1321-1337.

Relationship between yield and leaf/soil variables
across topography
Topographic position Regression model§ R2 Adjusted
R2
Toeslope
Sideslope
Summit
(1) Yield = 5.22 – 2.53*Leaf Mg
(2a) Yield = 3.19 + 0.15*Leaf (N:Mg)
(2b) Yield = 3.04 + 2.66*Leaf (P:Mg)
(3) Yield = 3.66 + 0.10*pH
(3) Yield = 8.78 – 0.70*ECEC – 19.03*log (Subsoil Mg)
(1) Yield = 28.25 – 9.28*Leaf N
(4) Yield = 3.88 – 2.57*Soil (K:Mg)
0.76
0.80
0.79
0.66
0.89
0.89
0.75
0.70
0.75
0.74
0.58
0.82
0.86
0.68
§Developed separately using the following group as yield predictors:
(1) leaf variables, (2) leaf nutrient ratios, (3) soil variables, and (4) topsoil nutrient ratios
SK Balasundram, PC Robert, DJ Mulla and DL Allan. 2006. Relationship between oil palm yield and soil fertility as affected
by topography in an Indonesian plantation. Communications in Soil Science and Plant Analysis, 37(9&10): 1321-1337.
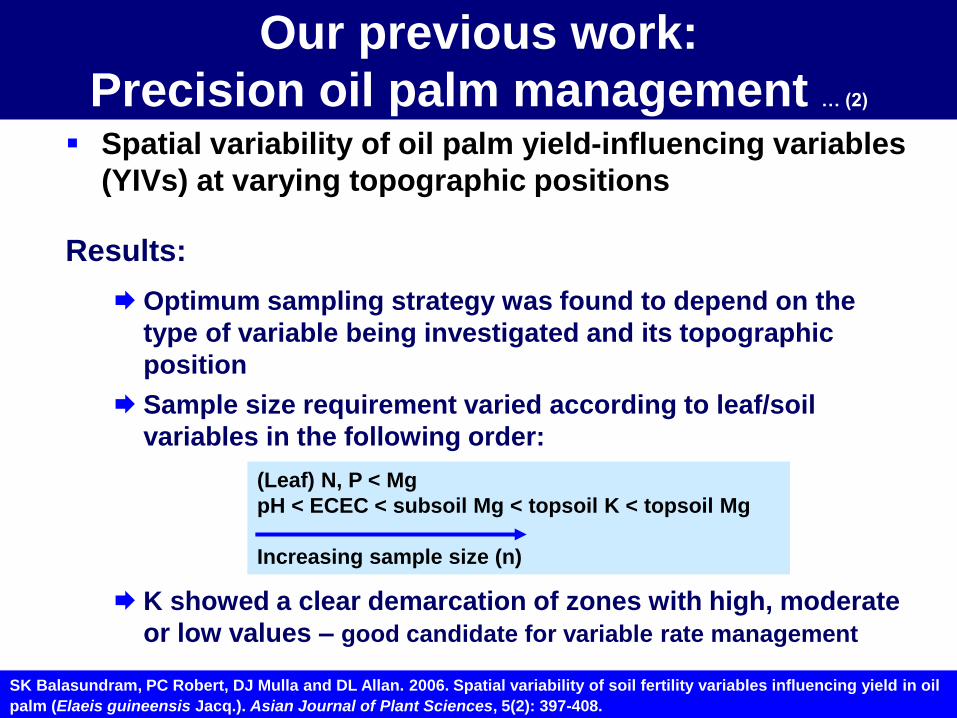
Spatial variability of oil palm yield-influencing variables
(YIVs) at varying topographic positions
Results:
Optimum sampling strategy was found to depend on the
type of variable being investigated and its topographic
position
Sample size requirement varied according to leaf/soil
variables in the following order:
K showed a clear demarcation of zones with high, moderate
or low values – good candidate for variable rate management
(Leaf) N, P < Mg
pH < ECEC < subsoil Mg < topsoil K < topsoil Mg
Increasing sample size (n)
SK Balasundram, PC Robert, DJ Mulla and DL Allan. 2006. Spatial variability of soil fertility variables influencing yield in oil
palm (Elaeis guineensis Jacq.). Asian Journal of Plant Sciences, 5(2): 397-408.
Our previous work:
Precision oil palm management … (2)
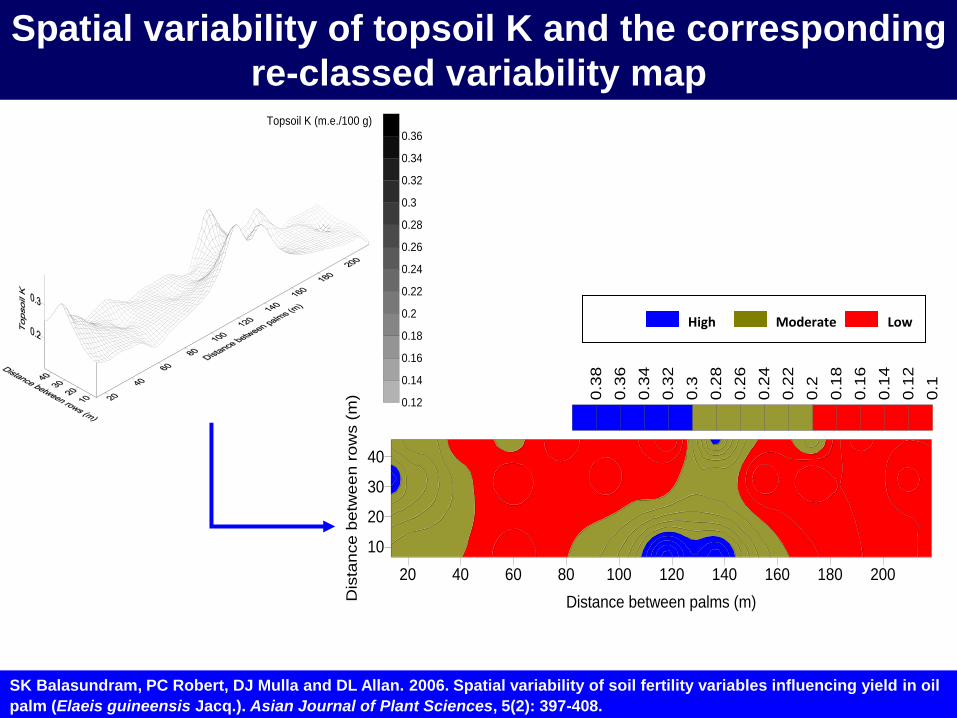
Spatial variability of topsoil K and the corresponding
re-classed variability map
0.12
0.14
0.16
0.18
0.2
0.22
0.24
0.26
0.28
0.3
0.32
0.34
0.36
Topsoil K (m.e./100 g)
20 40 60 80 100 120 140 160 180 200
Distance between palms (m)
10
20
30
40
Dis
tan
ce
betw
ee
n r
ow
s (
m) 0
.1
0.1
2
0.1
4
0.1
6
0.1
8
0.2
0.2
2
0.2
4
0.2
6
0.2
8
0.3
0.3
2
0.3
4
0.3
6
0.3
8
High Moderate Low
SK Balasundram, PC Robert, DJ Mulla and DL Allan. 2006. Spatial variability of soil fertility variables influencing yield in oil
palm (Elaeis guineensis Jacq.). Asian Journal of Plant Sciences, 5(2): 397-408.
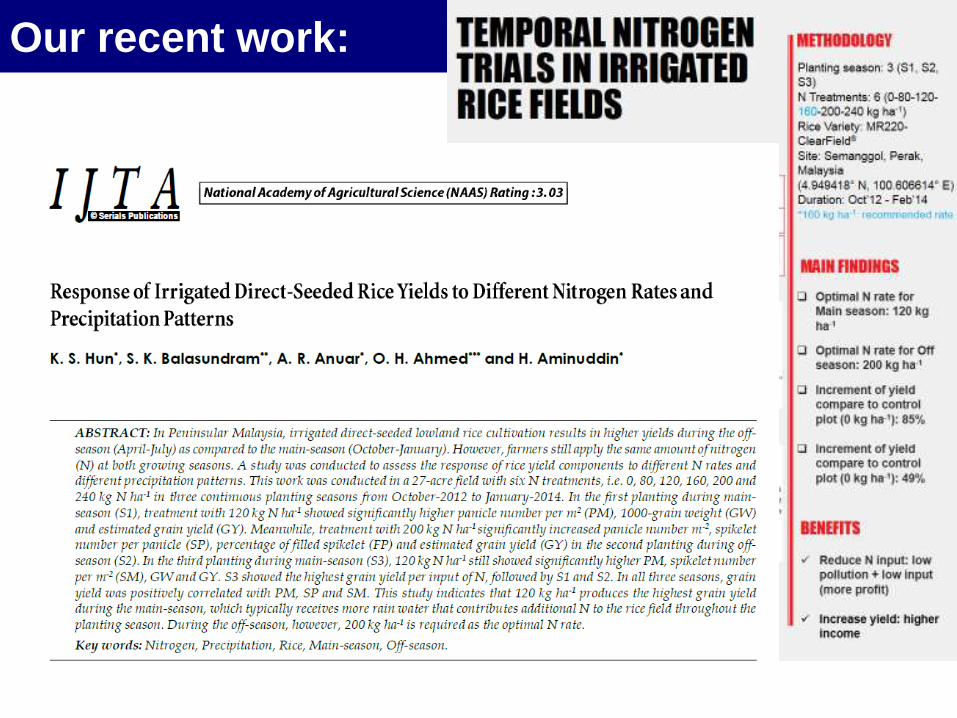
Our recent work:
Hun et al. (2015)

Future perspectives of
Precision Agriculture
Drone technology for detection and monitoring of crop stress
Artificial Neural Network (ANN) for agronomic data analysis
Hyperspectral remote sensing for carbon monitoring
Robotics for agronomic management and crop harvesting
Radio Frequency Identification (RFID) for logistical intelligence
Pollution free
Efficient
Cost effective
Practical
CLIMATE-SMART
SUSTAINABLE