Prebiotic Carbohydrate Profiles of Lentil, Chickpea, and ...
124
Clemson University Clemson University TigerPrints TigerPrints All Dissertations Dissertations 8-2019 Prebiotic Carbohydrate Profiles of Lentil, Chickpea, and Common Prebiotic Carbohydrate Profiles of Lentil, Chickpea, and Common Bean Bean Niroshan Siva Clemson University, [email protected] Follow this and additional works at: https://tigerprints.clemson.edu/all_dissertations Recommended Citation Recommended Citation Siva, Niroshan, "Prebiotic Carbohydrate Profiles of Lentil, Chickpea, and Common Bean" (2019). All Dissertations. 2442. https://tigerprints.clemson.edu/all_dissertations/2442 This Dissertation is brought to you for free and open access by the Dissertations at TigerPrints. It has been accepted for inclusion in All Dissertations by an authorized administrator of TigerPrints. For more information, please contact [email protected].
Transcript of Prebiotic Carbohydrate Profiles of Lentil, Chickpea, and ...

Clemson University Clemson University
TigerPrints TigerPrints
All Dissertations Dissertations
8-2019
Prebiotic Carbohydrate Profiles of Lentil, Chickpea, and Common Prebiotic Carbohydrate Profiles of Lentil, Chickpea, and Common
Bean Bean
Niroshan Siva Clemson University, [email protected]
Follow this and additional works at: https://tigerprints.clemson.edu/all_dissertations
Recommended Citation Recommended Citation Siva, Niroshan, "Prebiotic Carbohydrate Profiles of Lentil, Chickpea, and Common Bean" (2019). All Dissertations. 2442. https://tigerprints.clemson.edu/all_dissertations/2442
This Dissertation is brought to you for free and open access by the Dissertations at TigerPrints. It has been accepted for inclusion in All Dissertations by an authorized administrator of TigerPrints. For more information, please contact [email protected].

i
PREBIOTIC CARBOHYDRATE PROFILES OF LENTIL, CHICKPEA, AND COMMON BEAN
A Dissertation Presented to
the Graduate School of Clemson University
In Partial Fulfillment of the Requirements for the Degree
Doctor of Philosophy Plant and Environmental Sciences
by Niroshan Siva August 2019
Accepted by: Dr. Dil Thavarajah, Committee Chair
Dr. Susan Duckett Dr. William Whiteside
Dr. Elliot Jesch Dr. Pushparajah Thavarajah

ii
ABSTRACT
Pulses such as lentil (Lens culinaris Medikus), common bean (Phaseolus vulgaris
L.), and chickpea (Cicer arietinum L.) are a rich source of protein, prebiotic
carbohydrates, and micronutrients. Prebiotic carbohydrates are utilized by beneficial gut
microorganisms and produce short chain fatty acids which is associated with increasing
mineral absorption and reducing obesity risk. The objectives of these studies were to 1)
identify and quantify prebiotic carbohydrate profiles [simple sugars, sugar alcohols (SA),
raffinose family oligosaccharides (RFO), fructooligosaccharides (FOS), resistant starch
(RS), cellulose, hemicellulose, and amylose)] in different market classes of lentil,
common bean, and chickpea, 2) determine the changes of SA, RFO, FOS, RS, and
amylose concentration in common bean and chickpea market classes in response to
cooking, cooling, and reheating, and 3) determine the changes of SA, RFO, FOS, RS, and
amylose concentration in different market classes of lentil, common bean, chickpea in
response to four cooking temperature ranging from 90 to 120 ºC.
The first study results indicated that a 100 g of lentil, common bean, and chickpea
had 12, 15, and 12 g of prebiotic carbohydrates respectively. Prebiotic carbohydrate
concentrations within the pulse market classes were significantly different. The second
study results showed that a 100 g of cooked common bean and chickpea provide 7–9 and
8–10 g of prebiotic carbohydrates respectively. Cooling and reheating reduced SA and
RFO but increased FOS, RS, and amylose concentrations regardless of the pulse market
classes. The third study results showed that increasing cooking temperature from 90 ºC to
120 ºC, increased SA, RFO, FOS, and amylose concentration but reduced RS

iii
concentration in pulse market classes. Overall, total prebiotic carbohydrates
concentration was increased from 7 to 8 g/100 in lentil, 4 to 7 g/100 g in common bean,
and 7 to 8 g/100 g in chickpea with increasing processing temperature.
In conclusion, prebiotic carbohydrate profiles are different in pulse market classes
and it is possible to breed relevant pulse market classes with higher prebiotic
carbohydrates. Further, processing methods change prebiotic carbohydrates concentration
and therefore change the nutritional quality of pulses. Increasing cooking temperature up
to 120 ºC increase prebiotic carbohydrates concentration in pulses. Thus, manipulation of
processing conditions can be used to develop prebiotic carbohydrates rich pulse foods.
Keywords: pulses, prebiotic carbohydrates, thermal processing, shelf-stable foods

iv
DEDICATION
This dissertation is dedicated to my loving wife, parents, brother, and friends for
their early inspiration, coaching, and enthusiasm. None of this would have happened
without them.

v
ACKNOWLEDGMENTS
I have been plentifully blessed during my degree program and research. Most of
all, I thank my wife, parents, brother, and friends who have given me better life and
shaped me into who I am. I offer my sincere thanks to my advisor, Dr. Dil Thavarajah
and members of the graduate committee, Dr. Susan Duckett, Dr. William Whiteside, Dr.
Pushparajah Thavarajah, and Dr. Elliot Jesch, who gave me tremendous support on this
research. I would like to thank Dr. Susan Duckett’s and Dr. William Whiteside’s research
team, Electron Microscope Facility, and Vegetable/Pulse Quality and Nutrition
Laboratory research team at Clemson University. Also, I would like to thank Dhanuska
Wijesinghe, Suranga Basnagala, Indika Pathirana, and Nathan Johnson for their support
in my life. Finally, I would like to thank College of Agriculture, Forestry, and Life
Sciences (CAFLS), Clemson University, the USDA National Institute of Food and
Agriculture, the International Center for Dry Land Agriculture (ICARDA, Morocco), and
the American Pulse Association for providing funds for this project.

vi
TABLE OF CONTENTS Page
ABSTRACT ........................................................................................................................ ii
DEDICATION ................................................................................................................... iv
ACKNOWLEDGMENTS .................................................................................................. v
LIST OF TABLES ............................................................................................................. ix
LIST OF FIGURES ........................................................................................................... xi
1. INTRODUCTION .......................................................................................................... 1
2. CHAPTER ONE: VARIABILITY IN PREBIOTIC CARBOHYDRATES IN
DIFFERENT MARKET CLASSES OF CHICKPEA, COMMON BEAN AND
LENTIL COLLECTED FROM THE AMERICAN LOCAL MARKET ...................... 4
2.1. Hypotheses ........................................................................................................... 4
2.2. Objective .............................................................................................................. 4
2.3. Abstract ................................................................................................................ 4
2.4. Introduction .......................................................................................................... 5
2.5. Materials and Methods ......................................................................................... 8
2.5.1. Materials ....................................................................................................... 8
2.5.2. Lentil, common bean and chickpea seeds .................................................... 9
2.5.3. Fat and protein removal .............................................................................. 10
2.5.4. Low molecular weight carbohydrates (LMWC) ........................................ 10
2.5.5. Hemicellulose ............................................................................................. 12
2.5.6. Cellulose ..................................................................................................... 12
2.5.7. Resistant starch ........................................................................................... 13
2.5.8. Amylose and amylopectin .......................................................................... 14
2.5.9. Statistical analysis ...................................................................................... 16
2.6. Results ................................................................................................................ 16
2.6.1. Lentil .......................................................................................................... 16
2.6.2. Common bean ............................................................................................. 17
2.6.3. Chickpea ..................................................................................................... 24
2.7. Discussion .......................................................................................................... 25
2.8. Conclusion .......................................................................................................... 30
vii
Table of Contents (Continued)
Page
2.9. Acknowledgements ............................................................................................ 31
2.10. References .......................................................................................................... 31
3. CHAPTER TWO: PREBIOTIC CARBOHYDRATE CONCENTRATIONS OF
COMMON BEAN AND CHICKPEA CHANGE DURING COOKING, COOLING,
AND REHEATING ..................................................................................................... 40
3.1. Hypotheses ......................................................................................................... 40
3.2. Objective ............................................................................................................ 40
3.3. Abstract .............................................................................................................. 40
3.4. Introduction ........................................................................................................ 41
3.5. Materials and Methods ....................................................................................... 44
3.5.1. Materials ..................................................................................................... 44
3.5.2. Seed samples .............................................................................................. 44
3.5.3. Seed size ..................................................................................................... 44
3.5.4. Water absorption ........................................................................................ 45
3.5.5. Seed coat thickness ..................................................................................... 45
3.5.6. Cooking, cooling, and reheating ................................................................. 45
3.5.7. Low molecular weight carbohydrates (LMWCs) ....................................... 46
3.5.8. Resistant starch (RS) .................................................................................. 47
3.5.9. Amylose concentration ............................................................................... 47
3.5.10. Scanning electron microscopy (SEM) ........................................................ 48
3.5.11. Statistical analysis ...................................................................................... 48
3.6. Results ................................................................................................................ 48
3.7. Discussion .......................................................................................................... 57
3.8. Conclusion .......................................................................................................... 61
3.9. Acknowledgments .............................................................................................. 62
3.10. References .......................................................................................................... 62
4. CHAPTER THREE: RETORT PROCESSING TEMPERATURE CHANGE
PREBIOTIC CARBOHYDRATES CONCENTRATION IN PULSES...................... 71
4.1. Hypotheses ......................................................................................................... 71

viii
Table of Contents (Continued)
Page
4.2. Objective ............................................................................................................ 71
4.3. Abstract .............................................................................................................. 71
4.4. Introduction ........................................................................................................ 72
4.5. Materials and Methods ....................................................................................... 75
4.5.1. Materials ..................................................................................................... 75
4.5.2. Seed samples .............................................................................................. 75
4.5.3. Retort cooking ............................................................................................ 76
4.5.4. Determination of Moisture content ............................................................ 76
4.5.5. Determination of SA, RFO, and FOS ......................................................... 76
4.5.6. Determination of RS ................................................................................... 77
4.5.7. Determination of amylose concentration ................................................... 77
4.5.8. Determination of total prebiotic carbohydreates ........................................ 78
4.6. Results ................................................................................................................ 78
4.6.1. Sugar alcohols ............................................................................................ 78
4.6.2. Raffinose, stachyose, verbascose and total RFO ........................................ 82
4.6.3. Kestose, nystose, and total FOS ................................................................. 86
4.6.4. RS ............................................................................................................... 87
4.6.5. Amylose ...................................................................................................... 87
4.7. Discussion .......................................................................................................... 87
4.8. Conclusion .......................................................................................................... 93
4.9. Acknowledgements ............................................................................................ 93
4.10. References .......................................................................................................... 93
5. GENERAL DISCUSSION ......................................................................................... 103
6. CONCLUSIONS AND FUTURE DIRECTION ........................................................ 106
6.1. References ........................................................................................................ 107

ix
LIST OF TABLES
Table Page Table 2. 1. Description of pulse market classes used in this experiment............................ 9
Table 2. 2. Prebiotic carbohydrate profiles of lentil, common bean, and chickpea. ......... 18
Table 2. 3. Concentration of simple sugars of different lentil, common bean, and chickpea
market classes. .................................................................................................................. 19
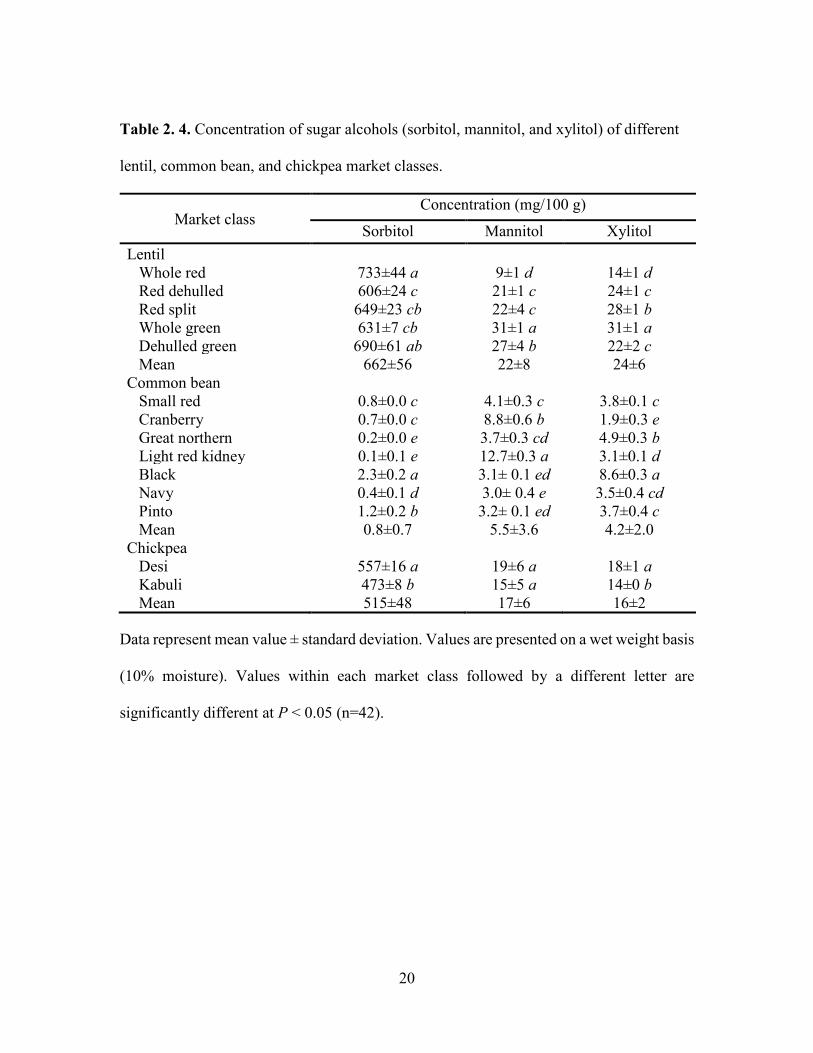
Table 2. 4. Concentration of sugar alcohols (sorbitol, mannitol, and xylitol) of different
lentil, common bean, and chickpea market classes........................................................... 20
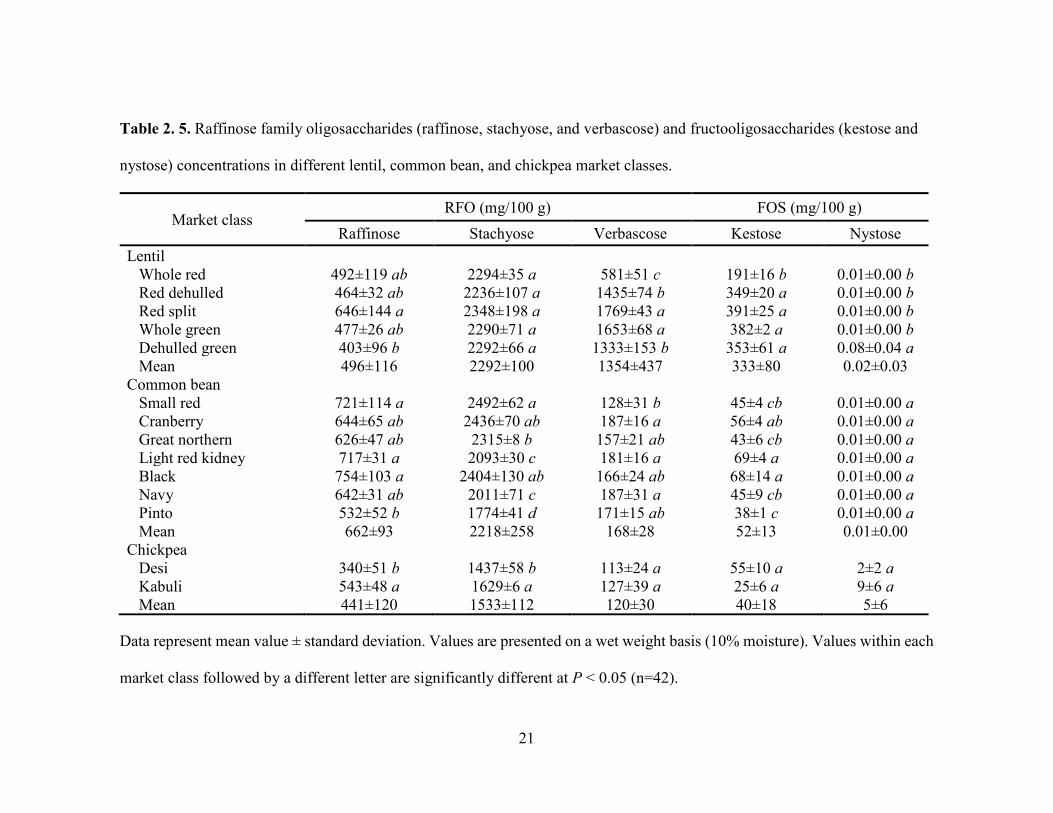
Table 2. 5. Raffinose family oligosaccharides (raffinose, stachyose, and verbascose) and
fructooligosaccharides (kestose and nystose) concentrations in different lentil, common
bean, and chickpea market classes. ................................................................................... 21
Table 3. 1. Physical characteristics of pulse market classes used in this experiment. ...... 45
Table 3. 2. Concentrations of total prebiotic carbohydrates (g) in a 100 g serving of
cooked, cooled, and reheated common bean and chickpea market classes with percent
recommended dietary allowance. ...................................................................................... 50
Table 3. 3. Sugar alcohol (SA) concentrations (mg/100 g) in common bean and chickpea
market classes after cooking, cooling, and reheating. ...................................................... 51

x
List of Tables (Continued)
Page
Table 3. 4. Raffinose family oligosaccharide (RFO) concentrations in common bean and
chickpea market classes after cooking, cooling, and reheating. ....................................... 52
Table 3. 5. Fructooligosaccharide (FOS) concentrations in common bean and chickpea
market classes after cooking, cooling, and reheating. ...................................................... 55
Table 4. 1. Carbohydrates concentration in pulses processed at different temperatures. . 79
Table 4. 2. Prebiotic carbohydrates concentration in lentil market classes processed at
different temperatures. ...................................................................................................... 80
Table 4. 3. Prebiotic carbohydrates concentration in chickpea market classes processed at
different temperatures. ...................................................................................................... 83
Table 4. 4. Prebiotic carbohydrates concentration in common bean market classes
processed at different temperatures. ................................................................................. 84

xi
LIST OF FIGURES
Figure Page Figure 2. 1. Hemicellulose (arabinose+xylose) and cellulose concentrations in different a)
lentil, b) common bean, and c) chickpea market classes .................................................. 22
Figure 2. 2. Soluble starch (SS), resistant starch (RS), and total amylose concentration in
different a) lentil, b) common bean, and c) chickpea market classes ............................... 23
Figure 3. 1. Resistant starch (RS) and amylose concentrations of different common bean
(a and c, respectively) and chickpea (b and d, respectively) market classes after cooking,
cooling, and reheating ....................................................................................................... 56
Figure 3. 2. SEM images of starch granules of (a) cooked, (b) cooled, and (c) reheated
pinto bean cotyledon and (d) cooked, (e) cooled, and (f) reheated kabuli chickpea
cotyledon. .......................................................................................................................... 58
Figure 4. 1. Resistant starch (RS) concentrations of different lentil (1a), chickpea (1b),
and common bean (1c) market classes cooked at 90, 100, 110, and 120 ºC. ................... 88
Figure 4. 2. Amylose concentrations of different lentil (2a), chickpea (2b), and common
bean (2c) market classes cooked at 90, 100, 110, and 120 ºC.. ........................................ 89
Figure 4. 3. Proposed mechanism of increased concentration of low molecular weight
carbohydrates (LMWC) in pulses with increased processing temperature (90–120 ºC). 91
1
1. INTRODUCTION
Global populations are suffering from non-communicable diseases, overweight,
and obesity. At present, 1.9 billion people in the world are overweight, 650 million are
obese, 340 million children aged between 5–19 are overweight or obese, and 41 million
children under the age of 5 are overweight or obese (WHO, 2018). Current overweight
and obesity prevalence of adults in the USA is 33% and 38%, respectively (CDC, 2016).
Unhealthy lifestyle including sedentary work and high intake of calorie dense foods
increases obesity risk. Increase intake of vegetables, fruits, whole grains, and pulses rich
in protein, minerals, vitamins, and prebiotic carbohydrates are recommended to combat
obesity risk (CDC, 2015; WHO, 2003).
Prebiotic carbohydrates are defined as “a substrate that is selectively utilized by
host microorganisms conferring a health benefit” (Gibson et al., 2017). Prebiotic
carbohydrates fermented by beneficial gut microbiome and produce short chain fatty
acids (acetate, butyrate, and propionate), regulate intestinal movement, prevent
constipation, increase mineral absorption, and reduce obesity risk by regulating blood
glucose and cholesterol levels (Kaur and Gupta, 2002; Manning and Gibson, 2004).
Prebiotic carbohydrates include sugar alcohols (sorbitol, mannitol, xylitol, and
galactinol), raffinose family oligosaccharides (raffinose, stachyose, and verbascose),
fructooligosaccharides (kestose and nystose), resistant starch (RS), cellulose,
hemicellulose, and pectin (Gibson et al., 2017). Jerusalem artichoke, green banana, onion,
leeks, wheat bran, and pulses are rich source of prebiotic carbohydrates (Dwivedi et al.,
2014; Raigond et al., 2015; Rubel et al., 2014).

2
Pulses including lentil (Lens culinaris Medikus), common bean (Phaseolus
vulgaris L.), and chickpea (Cicer arietinum L.) are a rich source of protein and
micronutrients, low in fat, and calorie (U.S. Pulse Quality Survey, 2017; USDA, 2019). A
100 g of serving pulses provide 22–28 g of protein, 2–3 g of micronutrients and only 0.1–
5 g of fat and 300–350 kcal energy (U.S. Pulse Quality Survey, 2017; USDA, 2019).
Pulses are a rich source of prebiotic carbohydrates (Johnson et al., 2013, 2015a). Lentil
provides 1.2–1.5 g of SA, 5.5–6.1 g of RFO, 0-1 g of FOS, and 1.6–8.4 g of RS per 100 g
of serving (Johnson et al., 2013). Further, chickpea and common bean provide 0.4–5.6
and 1.2–2.9/100 g of RFO (Gangola et al., 2016; Reddy et al., 1984), 0–1 and 0–0.07
g/100 g of FOS (Biesiekierski et al., 2011) and 2.9–4.5 and 2.4–4.4 g/100 g of RS,
respectively (de Almeida Costa et al., 2006). Overall, pulses can provide 3–17 g of
prebiotic carbohydrates per 100 g of serving (Biesiekierski et al., 2011; Gangola et al.,
2016; Johnson et al., 2013; Reddy et al., 1984).
Prebiotic carbohydrate profiles change during food processing, cooking, and
storage (de Almeida Costa et al., 2006; Johnson et al., 2015b; Siva et al., 2018). Cooking
and microwave reheating of lentil reduce RFO concentration from 5.5–6.1 g/100 g to
4.3–4.9 g/100 g (Johnson et al., 2015b) and then cooling at 4 °C for 24 h increased RS
concentration by twofold (Johnson et al., 2015b; Siva et al., 2018). These changes varied
among lentil market classes, green lentil showed a higher reduction of RFO than whole
red lentil (Johnson et al., 2015). These variations in the prebiotic carbohydrates in pulses
are due to differences in chemical composition (i.e. amylose and amylopectin content)
and physical properties of the seed (size and seed coat thickness) (Varatharajan et al.,

3
2011; Wang et al., 2003). Therefore, exploring prebiotic carbohydrates changes in
different pulse market classes during processing will help to select prebiotic rich pulses to
develop healthy diets.
Thermally processed shelf-stable foods are popular among consumers due to
their conveniences. Canning reduced protein, dietary fiber, mineral concentration, and
anti-nutrients such as phytic acid and tannins than the household cooked pulses (Margier
et al., 2018). Due to low anti-nutrients in canned pulses, the bioavailability of nutrients is
higher than the household cooked pulses (Margier et al., 2018). Considering prebiotic
carbohydrates, canning beans at 118–122 ºC for 16 minutes reduced RFOs by 65%
(Słupski and Gębczyński, 2014). Also, canning faba bean, kidney bean, and chickpea at
120 ºC for 15–20 minutes shows that RS levels were significantly reduced than its raw
counterpart (Güzel and Sayar, 2012), but had more RS than ordinary boiled pulses (Güzel
and Sayar, 2012). Thermal process has different effect depending on the type of pulse.
Processing lentil at 159–161 ºC shows that raffinose level was significantly increased,
verbascose level was significantly decreased, and stachyose had no difference than raw
lentil (Morales et al., 2015), but similar processing condition increase both raffinose and
stachyose in chickpea (Berrios et al., 2010). Therefore, the overall objective of this
dissertation was to develop shelf-stable prebiotic rich pulse foods by characterizing
prebiotic carbohydrates in pulses and optimizing the food processing conditions.
Incorporating prebiotic rich pulses in the diet improve gut microbial compositions and
lower the obesity risk.

4
2. CHAPTER ONE
VARIABILITY IN PREBIOTIC CARBOHYDRATES IN DIFFERENT MARKET
CLASSES OF CHICKPEA, COMMON BEAN AND LENTIL COLLECTED
FROM THE AMERICAN LOCAL MARKET
2.1. Hypotheses
H0: Prebiotic carbohydrate profiles (simple sugars, SA, RFO, FOS, RS, cellulose,
hemicellulose, and amylose) are not different within market classes of lentil, common
bean, and chickpea.
H1: Prebiotic carbohydrate profiles [simple sugars, sugar alcohols (SA), raffinose
family oligosaccharides (RFO), fructooligosaccharides (FOS), resistant starch (RS),
cellulose, hemicellulose, and amylose] are different within market classes of lentil,
common bean, and chickpea.
2.2. Objective
Identify and quantify prebiotic carbohydrate profiles (simple sugars, SA, RFO,
FOS, RS, cellulose, hemicellulose, and amylose) in two lentil market classes (red and
green), seven common bean market classes (small red, cranberry, great northern, light red
kidney, black, navy, and pinto), and two chickpea market classes (desi and kabuli).
2.3. Abstract
Pulse crops such as lentil, common bean, and chickpea are rich in protein, low
digestible carbohydrates, and range of micronutrients. The detailed information of low
digestible carbohydrates also known as ‘prebiotic carbohydrate” profiles of commonly
5
consumed pulse market classes and their impact on human health are yet to be studied.
The objective of this study was to determine the profiles of prebiotic carbohydrates in
two commonly consumed lentil market classes, seven common bean market classes, and
two chickpea market classes. After removing fat and protein, total carbohydrates
averaged 51 g/100 g for lentil, 53 g/100g for common bean, and 54 g/100g for chickpea.
Among the portion of total carbohydrates, lentil showed 12 g/100g of prebiotic
carbohydrates (sum of sugar alcohols, raffinose family oligosaccharides,
fructooligosaccharides, hemicellulose, cellulose, and resistant starch), 15 g/100 g in
common bean, and 12 g/100 g in chickpea. Prebiotic carbohydrate concentrations within
the market classes for each crop were significantly different (P ≤ 0.05). In conclusion,
these three pulses are rich in prebiotic carbohydrates, and considering the variation in
these concentrations in the present materials, it is possible to breed appropriate market
classes of pulses with high levels of prebiotic carbohydrates.
Keywords: Pulse crops, low digestible carbohydrates, prebiotic carbohydrates, resistant
starch, amylose
2.4. Introduction
Carbohydrates are widely present in plants and animals and are used as an energy
source to fulfill metabolic requirements (Trumbo et al., 2002). Carbohydrates are
classified into three major groups, simple sugars, oligosaccharides, and polysaccharides
or complex carbohydrates, based on their chemical structure. Complex carbohydrates
have a degree of polymerization 10 or more than the simple and oligosaccharides.
Prebiotic carbohydrates, a category of oligosaccharides and complex carbohydrates also

6
known as low digestible carbohydrates, are defined as “a selectively fermented ingredient
that allows specific changes, both in the composition and/or activity in the
gastrointestinal microflora that confers benefits upon host well-being and health”
(Manning and Gibson, 2004). Despite several modifications to the definition, a prebiotic
carbohydrate is a specific colonic nutrient that acts as a biosynthetic precursor for human
microbiota activity (Hutkins et al., 2016). Classification of a food as a prebiotic
carbohydrate requires that the ingredient: (1) resists digestive processes in the upper part
of the gastrointestinal tract, (2) is fermented by intestinal microbiota, and (3) selectively
stimulates growth and activity of health-promoting bacteria (Manning and Gibson, 2004).
Simple carbohydrates are comprised of one sugar unit (monosaccharides) or two sugar
units (disaccharides) that are easily digestible, whereas oligosaccharides have 3 to 10
sugar units and complex carbohydrates feature more than ten sugar units
(polysaccharides) (Cummings and Stephen, 2007).
Oligosaccharides and complex carbohydrates provide prebiotic health benefits by
modulating healthy gut bacteria (Oku and Nakamura, 2003; Manning and Gibson, 2004).
Whole grains are rich in prebiotic carbohydrates, but most food processing techniques
remove prebiotic carbohydrates, especially in cereals, i.e., white bread and breakfast
cereal, so consumption of such foods can lead to an increased risk of obesity and related
non-communicable diseases (Hodge et al., 2004). Pulse crops, such as lentil (Lens
culinaris Medikus.), common bean (Phaseolus vulgaris L.), and chickpea (Cicer
arietinum L.) are consumed as whole foods and require minimal or no processing, and
therefore contain higher amounts of prebiotic carbohydrates than processed cereals and

7
other grains (Bhatty, 1988; Guillon and Champ, 2002; Johnson et al., 2013). Diets rich in
prebiotic carbohydrates change the gut microbial composition, lead to production of fatty
acids (acetate, butyrate, and propionate), regulate intestinal movement, and prevent
constipation (Manning and Gibson, 2004). Additionally, such diets tend to increase
mineral absorption and reduce obesity risk by regulating blood glucose and cholesterol
levels (Kaur and Gupta, 2002). However, the current daily intake of prebiotic
carbohydrates in Western populations is less than 50% of the recommended daily
allowance (RDA) (Van Loo et al., 1995), but can be increased by incorporating pulses in
the diet.
The benefits of prebiotic carbohydrates are not limited to humans, but also extend
to plant health by increasing stress tolerance to cold and drought. For example, leaf
raffinose family oligosaccharides (RFOs) enhance drought (Bartels and Sunkar, 2005),
chilling (Liu et al., 2007; Nishizawa et al., 2008), and freezing tolerance in plants
(Pennycooke et al., 2003). Further, sugar alcohols (SAs; sorbitol and mannitol) increase
tolerance to chilling (Chiang et al., 2005), drought (Pujni et al., 2007), and salinity (Tang
et al., 2005; Zhifang and Loescher, 2003). RFOs and SAs act as osmolytes to maintain
cell structure during drought and salt stress (Bartels and Sunkar, 2005; Pharr et al., 1995)
and as antioxidants to neutralize the reactive oxygen species that cause cell damage
(Keunen et al., 2013; Liu et al., 2007; Nishizawa et al., 2008). Further, SAs and RFOs act
as signaling compounds for biotic stress caused by insects and pathogens (Kim et al.,
2008; Valluru and Van den Ende, 2011).

8
Current annual lentil, common bean, and chickpea production around the world is
approximately 6, 12, and 26 million tons, respectively (FAO, 2018). With climate
change, future pulse crop production might be limited because of increased drought and
temperatures. As such, developing climate resilient and nutritionally superior cultivars
via plant breeding and selection is essential for future pulse crop improvement and global
food security (Muehlbauer et al., 2006). A 100 g serving of lentil contains 1-2 g of SA, 5-
6 g of RFO, 0-1 g of fructooligosaccharides (FOS), and 2-8 g resistant starch (RS)
(Johnson et al., 2013). However, very limited information in terms of detailed profiles of
prebiotic carbohydrates is available for other pulses, including chickpea and common
bean. The objective of this study was to identify and quantify prebiotic carbohydrate
profiles (simple sugars, SA, RFO, FOS, RS, cellulose, hemicellulose, amylose) in two
lentil market classes (red and green), seven common bean market classes (small red,
cranberry, great northern, light red kidney, black, navy, and pinto), and two chickpea
market classes (desi and kabuli).
2.5. Materials and Methods
Materials
Chemicals used for high performance anion exchange chromatography (HPAE)
and enzymatic assays were purchased from Fisher Scientific (Asheville, NC, USA),
Sigma-Aldrich (St. Louis, MO, USA), and VWR International (Satellite Blvd, Suwanee,
GA, USA). Distilled and deionized water (ddH2O) with a resistance of ≥18.2 MΩ
(NANO-pure Diamond, Barnstead, IA, USA) was used in these analyses.
9
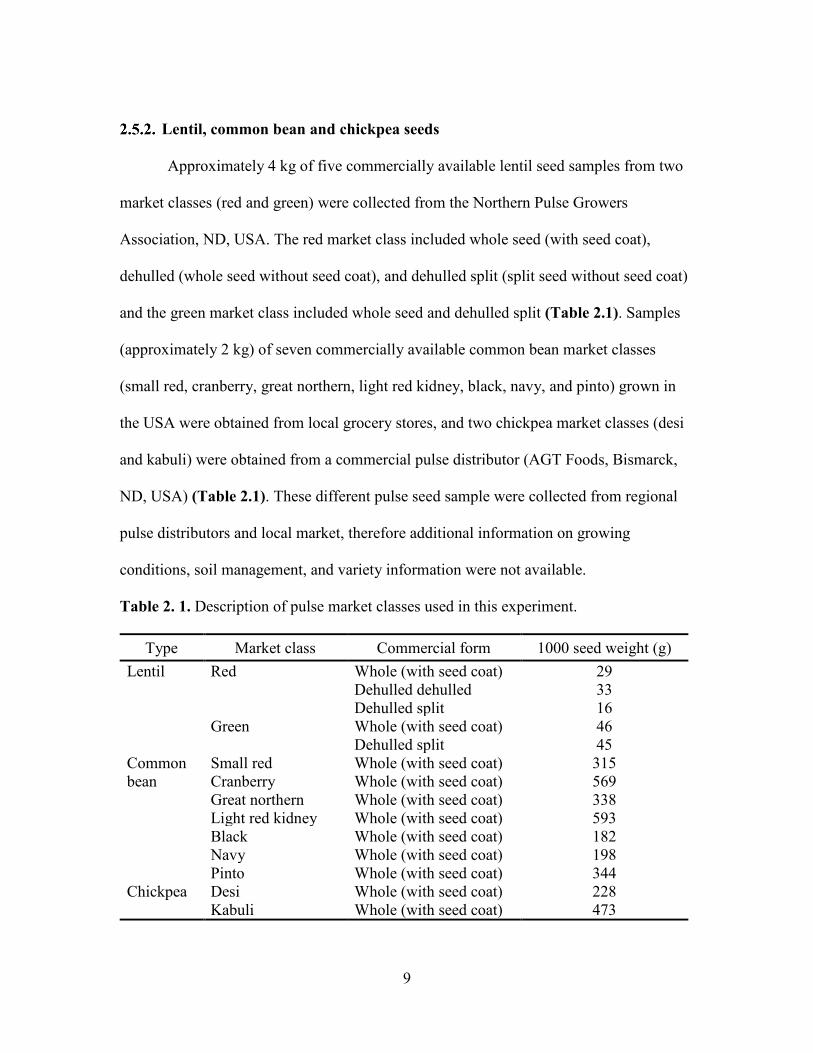
Lentil, common bean and chickpea seeds
Approximately 4 kg of five commercially available lentil seed samples from two
market classes (red and green) were collected from the Northern Pulse Growers
Association, ND, USA. The red market class included whole seed (with seed coat),
dehulled (whole seed without seed coat), and dehulled split (split seed without seed coat)
and the green market class included whole seed and dehulled split (Table 2.1). Samples
(approximately 2 kg) of seven commercially available common bean market classes
(small red, cranberry, great northern, light red kidney, black, navy, and pinto) grown in
the USA were obtained from local grocery stores, and two chickpea market classes (desi
and kabuli) were obtained from a commercial pulse distributor (AGT Foods, Bismarck,
ND, USA) (Table 2.1). These different pulse seed sample were collected from regional
pulse distributors and local market, therefore additional information on growing
conditions, soil management, and variety information were not available.
Table 2. 1. Description of pulse market classes used in this experiment.
Type Market class Commercial form 1000 seed weight (g) Lentil Red Whole (with seed coat) 29
Dehulled dehulled 33 Dehulled split 16 Green Whole (with seed coat) 46 Dehulled split 45
Common bean
Small red Whole (with seed coat) 315 Cranberry Whole (with seed coat) 569 Great northern Whole (with seed coat) 338 Light red kidney Whole (with seed coat) 593 Black Whole (with seed coat) 182 Navy Whole (with seed coat) 198 Pinto Whole (with seed coat) 344
Chickpea Desi Whole (with seed coat) 228 Kabuli Whole (with seed coat) 473

10
Samples were cleaned by hand, homogenized, subsampled, and ground to a 1-mm
particle size using a cyclone mill (CT 193 Cyclotec Sample Mill, FOSS North America,
MN, USA). The treatment design was a completely randomized design with five lentil
types, seven common bean types, and two chickpea types (n=14) and three replicates
(n=3), for a total of 42 (n=42).
Fat and protein removal
Ground seed samples were dried at 100-102 °C for 3 h. Fat was removed with
hexane at 90 °C for 2 h in an ANKOM extractor (XT15, Macedon, NY, USA). Defatted
samples were treated with 0.2% NaOH (1:6; w/v) in a water bath at 45 °C for 90 min to
remove protein (Neethirajan et al., 2012; Sivapragasam et al., 2014). Samples were then
blended for 2 min and centrifuged at 3000 x g (Fisher Scientific, Waltham, MA, USA)
for 15 min. The supernatant was discarded, and the top layer was removed. Ten mL of
ddH2O were added, the solution was mixed and centrifuged, and the supernatant and top
layer was removed. This process was repeated until the top yellow layer no longer
visible. The suspension was re-suspended with 10 mL of ddH2O and adjusted to a pH of
~7 with 50 mM HCl (Sivapragasam et al., 2014). Following centrifugation, samples were
washed three times with ddH2O and air dried at 60 °C overnight.
Low molecular weight carbohydrates (LMWC)
Ground seed samples (500 mg) were weighed into 15-mL polypropylene conical
tubes. Ten mL of ddH2O were then added to the tubes, which were incubated for 1 h at 80
°C as per Muir et al. (2009). Samples were centrifuged at 3000 x g for 10 min. An aliquot
(1 mL) of the supernatant was diluted with 9 mL of ddH2O, and the diluted supernatant

11
was filtered through a 13 mm × 0.45 µm nylon syringe filter (Fisher Scientific, Waltham,
MA, USA) prior to HPAE analysis.
Low molecular weight carbohydrate concentrations (SA, RFO, and FOS) were
measured using HPAE (Dionex, ICS-5000, Sunnyvale, CA, USA) according to a
previously published method (Feinberg et al., 2009). SA, RFO, and FOS were determined
by running the mobile phases (A: 100 mM sodium hydroxide/600 mM sodium acetate; B:
200 mM sodium hydroxide; C: ddH2O) at a flow rate of 1 mL/min through a CarboPac
PA1 column (250 × 4 mm; Dionex, CA, USA) connected to a CarboPac PA1 guard
column (50 × 4 mm; Dionex, CA, USA). The total run time was 25 min. Detection was
carried out using a pulsed amperometric detector (PAD; ICS-5000, Thermo Scientific,
Waltham, MA, USA) with a working gold electrode and a silver-silver chloride reference
electrode at 2.0 μA. Sugar alcohols (sorbitol and mannitol), RFO (raffinose, stachyose,
and verbascose), and FOS (kestose and nystose) were identified and quantified using pure
standards (>99%), and low molecular weight carbohydrate concentrations were detected
within a linear range of 3 to 1000 μg/g with a minimum detection limit of 0.2 μg/g. A lab
reference (CDC Redberry lentil) was used to ensure the accuracy and reproducibility of
detection. The peak areas of the external reference, glucose (100 ppm), SA (3-1000 ppm),
RFO (3-1000 ppm), and FOS (3-1000 ppm) were routinely analyzed for method
consistency and detector sensitivity, with an error of less than 5% (Johnson et al., 2013).
The concentration of LMWC in the samples (Cs) was calculated according to Cs= (Cf ×
V) / m, where Cf is the filtrate concentration obtained from HPAE, V is the final diluted
volume, and m is the mass of the sample (moisture corrected). Unidentified compound
12
concentrations were determined based on of those identified carbohydrate peak areas that
were very closest to retention times.
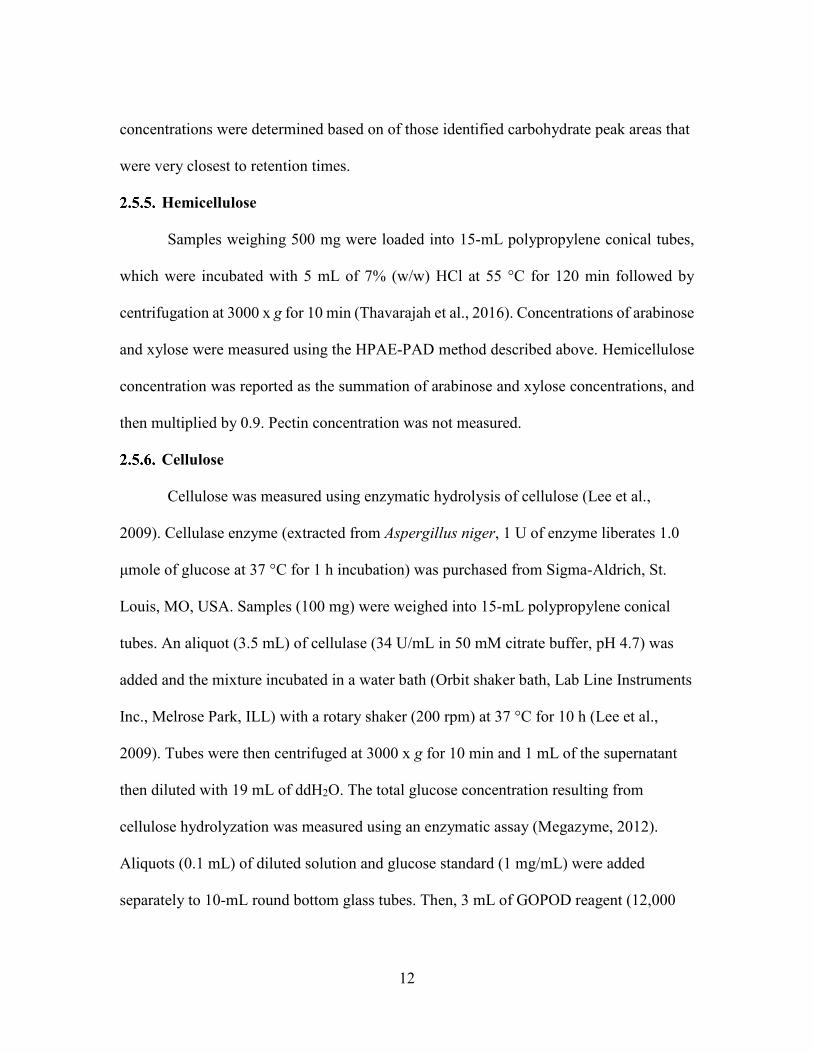
Hemicellulose
Samples weighing 500 mg were loaded into 15-mL polypropylene conical tubes,
which were incubated with 5 mL of 7% (w/w) HCl at 55 °C for 120 min followed by
centrifugation at 3000 x g for 10 min (Thavarajah et al., 2016). Concentrations of arabinose
and xylose were measured using the HPAE-PAD method described above. Hemicellulose
concentration was reported as the summation of arabinose and xylose concentrations, and
then multiplied by 0.9. Pectin concentration was not measured.
Cellulose
Cellulose was measured using enzymatic hydrolysis of cellulose (Lee et al.,
2009). Cellulase enzyme (extracted from Aspergillus niger, 1 U of enzyme liberates 1.0
μmole of glucose at 37 °C for 1 h incubation) was purchased from Sigma-Aldrich, St.
Louis, MO, USA. Samples (100 mg) were weighed into 15-mL polypropylene conical
tubes. An aliquot (3.5 mL) of cellulase (34 U/mL in 50 mM citrate buffer, pH 4.7) was
added and the mixture incubated in a water bath (Orbit shaker bath, Lab Line Instruments
Inc., Melrose Park, ILL) with a rotary shaker (200 rpm) at 37 °C for 10 h (Lee et al.,
2009). Tubes were then centrifuged at 3000 x g for 10 min and 1 mL of the supernatant
then diluted with 19 mL of ddH2O. The total glucose concentration resulting from
cellulose hydrolyzation was measured using an enzymatic assay (Megazyme, 2012).
Aliquots (0.1 mL) of diluted solution and glucose standard (1 mg/mL) were added
separately to 10-mL round bottom glass tubes. Then, 3 mL of GOPOD reagent (12,000

13
U/L glucose oxidase, 650 U/L peroxidase, and 0.4 mM 4-aminoantipyrine, pH 7.4) were
added to each tube, which were then incubated in a water bath at 50 °C for 20 min. The
absorption of the samples was measured using a spectrophotometer (Genesys 20, Thermo
Scientific, NC, USA) at 510 nm (the absorbance value of the glucose standard) to
determine the concentration of glucose in the samples. The cellulose concentration was
determined by multiplying the glucose concentration by 0.9 (the ratio of free glucose to
anhydro-glucose that occurs in cellulose).
Resistant starch
RS concentrations were determined according to McCleary and Monaghan,
(2002) and Megazyme, (2012). Ground samples (500 mg) were incubated with 4 mL of
100 mM sodium malate (pH 6) containing α-amylase (10 mg/mL) and amyloglucosidase
(3 U/mL) for 16 h in a water bath (37 °C) with 200 strokes/min vertical shaking (Orbit
shaker bath, Lab Line Instruments Inc., Melrose Park, IL, USA). After incubation, 4 mL
of 95% ethanol were added, and the samples were then centrifuged at 1500 x g for 10 min
at room temperature. The pellets were re-suspended with 6 mL of ethanol (50% v/v),
centrifuged, and decanted. The resuspension and centrifugation process were done two
times. Supernatants from the three centrifugations were pooled and brought to a volume
of 100 mL with ddH2O. The pellets were dissolved in 2 mL of potassium hydroxide (2
M) in an ice bath (~0 °C) while stirring with a magnetic stirrer for 20 min. The
suspensions were diluted with 8 mL of sodium acetate buffer (1.2 M, pH 3.8), with 0.1
mL of 3300 U/mL amyloglucosidase then immediately added followed by incubation at
50 °C for 30 min. The suspension was then centrifuged at 1500 x g for 10 min at room

14
temperature. Aliquots (0.1 ml) of both the supernatant containing the RS fractions and the
diluted washings containing the soluble starch (SS) fractions were transferred separately
to 10-mL glass tubes. A reagent blank was prepared using 0.1 mL sodium acetate buffer
(pH 4.5). An aliquot (3 mL) of GOPOD reagent was added to each tube, which were
incubated in a water bath at 50 °C for 20 min. Absorption was measured using a
spectrophotometer (Genesys 20, Thermo Scientific, NC, USA) at 510 nm. Starch
fractions were calculated as follows:
RS= X × (Abssample)(Absglucose× Wsample)
,
SS= Y × (Abssample)
(Absglucose× Wsample ,
where Abssample and Absglucose are the absorbance value of sample and glucose corrected
against reagent blank, respectively; Wsample is the moisture corrected weight of sample;
and X and Y are the dilutions factors for RS and SS, respectively. Regular corn starch
(RS concentration 1.0±0.1% (w/w)) was used to verify the data, and batches were
checked regularly to ensure an analytical error of less than 10%.
Amylose and amylopectin
Amylose levels were determined using an enzymatic assay (Gibson et al., 1997;
Magazyme, 2016). Samples (20-25 mg) of defatted and deproteinated flour were
transferred to 15-mL screw capped polypropylene conical tubes. An aliquot (1 mL) of
dimethyl sulphoxide (DMSO; 99.5% v/v) was added to each tube, which were heated for
1 min in a boiling water bath. The tube contents were then vigorously mixed in a high-
speed vortex and heated for 15 min in a boiling water bath. The tubes were cooled to

15
room temperature, and an aliquot (2 mL) of ethanol (95% v/v) added during continuous
stirring. Then 4 mL of ethanol were added to the samples, which were allowed to stand
for 15 min after thorough mixing. The tubes were centrifuged at 2000 x g for 5 min, and
the supernatant discarded. Two mL of DMSO were added, and the samples heated for 15
min in a boiling water bath with occasional mixing. Immediately after their removal, 4
mL of concanavalin A (Con A) buffer (180 mM sodium acetate buffer, pH 6.4) were
added to the samples, which were mixed thoroughly. The contents were diluted with Con
A buffer to 25 mL (Solvent A).
Aliquots (1 mL) of diluted solvent A were transferred to 2-mL microfuge tubes to
which 0.5 mL of lectin Con A solution (6 mg/mL) was added. The tubes were mixed
gently by repeated inversion and incubated for 1 h at room temperature followed by
centrifugation at 14,000 x g for 10 min. The supernatant (1 mL) was transferred to a 15-
mL centrifuge tube and 3 mL of sodium acetate buffer (100 mM, pH 4.5) then added. The
contents were mixed in a boiling water bath for 5 min and incubated at 40 °C for 5 min.
Four mL of 100 mM sodium acetate buffer were added to 0.5 mL of solvent A. An
aliquot (0.1 mL) of amyloglucosidase (333 U/ml)/ α-amylase enzyme (67 U/mL) was
added to the tubes containing either diluted solvent A or con A supernatant, which were
then incubated at 40 °C for 10 min followed by centrifugation at 2000 x g for 5 min. An
aliquot (4 mL) of GOPOD reagent was added to 1 mL of supernatant and incubated at 40
°C for 20 min. Absorbance was measured at 510 nm in a spectrophotometer, with the
percent amylose and amylopectin measured as follows:
Amylose (%)= Abs(Con A supernatant) Abs(Total starch aliquot)
× 6.159.2
×100 ,

16
Amylopectin (%)=100%-Amylose (%) ,
where 6.15 and 9.2 are dilution factors for the Con A and total starch extracts,
respectively.
Statistical analysis
Lentil, common bean, and chickpea market classes and replicates were considered
as random factors and included as class variables. Analysis of variance (ANOVA) was
performed using the General Linear Model procedure (PROC GLM) of SAS version 9.4
(SAS, 2016) and Fisher’s protected least significant difference (LSD) at P ≤ 0.05 was
used to separate means.
2.6. Results
Total carbohydrate concentrations averaged 51g/100g in lentil, 53 g/100g in
common bean, and 54 g/100g in chickpea, while total prebiotic carbohydrates averaged
12 g/100g in lentil, 15 g/100g in common bean, and 12 g/100 g in chickpea (Table 2.2).
Sugar alcohols and oligosaccharide concentrations were generally higher in lentil
whereas hemicellulose, cellulose, resistant starch, amylose, and amylopectin were
slightly higher in common bean and chickpea.
Lentil
Among simple sugars, sucrose was the most abundant (1.2-2.3 g/100 g) followed
by glucose (21-61 mg/100 g), fructose (0.2-21.9 mg/100 g), mannose (1.2-7.9 mg/100 g),
and rhamnose (0.5-1.0 mg/100 g) (Table 2.3). For SAs, lentil contained higher
concentrations of sorbitol (606-733 mg/100 g) than mannitol (9-31 mg/100 g) and xylitol

17
(14-31 mg/100 g) regardless of market class (Table 2.4). Whole red had significantly (P
< 0.05) higher levels of sorbitol than all other market classes, and whole green had
significantly higher mannitol and xylitol concentrations. For RFO, stachyose
concentrations (2.2-2.3 g/100 g) were higher than raffinose (403-646 mg/100 g) and
verbascose (581-1769 mg/100 g) concentrations (Table 2.5). Considering lentil FOS,
concentrations of kestose were considerably higher than those for nystose. Arabinose
concentrations were significantly higher in whole green compared to red split lentil
(Figure 2.1a). Among the market classes, red dehulled and red split had significantly
higher xylose concentrations (1.91-1.94 g/100 g) than the other market classes. Whole
red and whole green had significantly higher cellulose concentrations (611-640 mg/100
g) than the other market classes (Figure 2.1a). Soluble starch concentrations ranged from
37 to 44 g/100 g with levels in red dehulled and dehulled green significantly higher than
those in whole red and red split (Figure 2.2a). No significant differences were observed
for RS levels among market classes; however, amylose concentrations were significantly
higher in red dehulled, whole green, and dehulled green than in whole red (Figure 2.2a).
Common bean
Among simple sugars, sucrose was the most abundant (2.6-3.7 g/100 g) followed
by glucose (35-62 mg/100 g), fructose (1.7-16.4 mg/100 g), mannose (1.5-11.2 mg/100
g), and rhamnose (0.1-0.7 mg/100 g) (Table 2.3). Considering SAs, common beans had
higher concentrations of mannitol (3-13 mg/100 g) than sorbitol (0.1-2.3 mg/100 g) and
xylitol (1.9-8.6 mg/100 g) (Table 2.4). Among market classes, light red kidney bean had
significantly (P < 0.05) higher mannitol concentrations and black bean had higher

18
Table 2. 2. Prebiotic carbohydrate profiles of lentil, common bean, and chickpea.
Carbohydrates Lentil Common bean Chickpea Sugar alcohols (mg/100 g) 707±51 11±3 548±53 Simple sugars
Monosaccharides (mg/100 g) 44±23 66±15 34±4 Disaccharides (g/100 g) 1.7±0.4 3.1±0.4 2.2±0.4 Oligosaccharides
Raffinose family oligosaccharides (g/100 g) 4.1±0.5 3.0±0.3 2.1±0.2 Fructooligosaccharides (mg/100 g) 333±80 52±13 46±16 Polysaccharides
Hemicellulose (g/100 g) 3.8±0.2 7.9±0.5 6.1±0.5 Cellulose (g/100 g) 0.5±0.2 1.6±0.9 1.1±0.3 Soluble starch (g/100 g) 40±3 41±3 42±4 Resistant starch (g/100 g) 2.1±0.3 2.4±0.4 3.1±0.1 Amylose (g/100 g) 17±2 19±2 19±2 Amylopectin (g/100 g) 25±2 24±2 26±2 Unidentified** (mg/100 g) 426±39 151±28 183±80 Total prebiotic carbohydrates (g/100 g) 12±1 15±1 12±2 Total identified carbohydrates (g/100 g) 51±2 53±2 54±7 RDA from a 100 g serving (%) 60±6 75±5 60±8
Data represent mean value ± standard deviation. Values are presented on a wet
weight basis (10%). Recommendations for safe daily total prebiotic intake (20 g/day)
reported by Douglas & Sanders, 2008. Unidentified compound concentrations were
determined based on of those identified carbohydrate peak areas that were very closest to
retention times.

19
Table 2. 3. Concentration of simple sugars of different lentil, common bean, and
chickpea market classes.
Market class Concentration (mg/100 g)
Mannose Glucose Fructose Sucrose Rhamnose Lentil Whole red 1.5±0.7 c 60.5±7.7 a 21.9±2.6 a 1174±89 e 0.7±0.2 b Red dehulled 5.6±0.3 b 24.6±1.3 c 0.5±0.1 c 2057±94 b 0.5±0.0 b Red split 7.9±0.9 a 21.1±1.0 c 0.3±0.1 c 2288±76 a 0.7±0.2 b Whole green 1.2±0.3 c 42.2±5.4 b 4.5±2.0 b 1665±25 c 1.0±0.0 a Dehulled green 1.8±0.2 c 24.3±4.8 c 0.2±0.1 c 1376±140 d 0.5±0.0 b Mean 3.6±2.8 34.6±16.0 5.5±8.8 1712±435 0.7±0.2 Common bean
Small red 9.5±7.0 a 57.9±8.9 ab 12.6±6.6 a 3287±115 b 0.2±0.0 c Cranberry 3.6±2.0 cb 54.6±6.9 cb 5.4±5.2 cb 3710±73 a 0.7±0.1 a Great northern 10.5±1.0 a 46.5±2.9 ed 5.2±1.4 cb 3296±116 b 0.1±0.0 c Light red kidney 7.9±2.6 ab 49.9±3.9 cd 12.6±8.6 a 3188±29 b 0.3±0.0 b Black 1.5±0.1 c 62.1±4.1 a 16.4±0.9 a 2605±94 c 0.2±0.0 c Navy 11.2±0.8 a 41.8±0.4 ef 1.7±0.7 c 2637±30 c 0.2±0.0 c Pinto 1.7±0.6 c 34.7±2.4 f 10.0±0.9 ab 2660±113 c 0.1±0.0 c Mean 6.6±4.7 49.6±10.0 9.1±6.2 3055±412 0.3±0.2 Chickpea
Desi 0.8±0.2 a 29.6±6.4 a 2.2±0.2 a 1764±104 b 0.1±0.0 a Kabuli 0.5±0.1 b 31.8±0.6 a 2.5±0.3 a 2541±69 a 0.1±0.0 a Mean 0.6±0.2 31.7±4.2 2.4±0.3 2153±433 0.1±0.0
Data represent mean value ± standard deviation. Values are presented on a wet weight basis
(10% moisture). Values within each market class followed by a different letter are
significantly different at P < 0.05 (n=42).
20
Table 2. 4. Concentration of sugar alcohols (sorbitol, mannitol, and xylitol) of different
lentil, common bean, and chickpea market classes.
Market class Concentration (mg/100 g)
Sorbitol Mannitol Xylitol Lentil Whole red 733±44 a 9±1 d 14±1 d Red dehulled 606±24 c 21±1 c 24±1 c Red split 649±23 cb 22±4 c 28±1 b Whole green 631±7 cb 31±1 a 31±1 a Dehulled green 690±61 ab 27±4 b 22±2 c Mean 662±56 22±8 24±6 Common bean
Small red 0.8±0.0 c 4.1±0.3 c 3.8±0.1 c Cranberry 0.7±0.0 c 8.8±0.6 b 1.9±0.3 e Great northern 0.2±0.0 e 3.7±0.3 cd 4.9±0.3 b Light red kidney 0.1±0.1 e 12.7±0.3 a 3.1±0.1 d Black 2.3±0.2 a 3.1± 0.1 ed 8.6±0.3 a Navy 0.4±0.1 d 3.0± 0.4 e 3.5±0.4 cd Pinto 1.2±0.2 b 3.2± 0.1 ed 3.7±0.4 c Mean 0.8±0.7 5.5±3.6 4.2±2.0 Chickpea
Desi 557±16 a 19±6 a 18±1 a Kabuli 473±8 b 15±5 a 14±0 b Mean 515±48 17±6 16±2
Data represent mean value ± standard deviation. Values are presented on a wet weight basis
(10% moisture). Values within each market class followed by a different letter are
significantly different at P < 0.05 (n=42).
21
Table 2. 5. Raffinose family oligosaccharides (raffinose, stachyose, and verbascose) and fructooligosaccharides (kestose and
nystose) concentrations in different lentil, common bean, and chickpea market classes.
Market class RFO (mg/100 g) FOS (mg/100 g)
Raffinose Stachyose Verbascose Kestose Nystose Lentil Whole red 492±119 ab 2294±35 a 581±51 c 191±16 b 0.01±0.00 b Red dehulled 464±32 ab 2236±107 a 1435±74 b 349±20 a 0.01±0.00 b Red split 646±144 a 2348±198 a 1769±43 a 391±25 a 0.01±0.00 b Whole green 477±26 ab 2290±71 a 1653±68 a 382±2 a 0.01±0.00 b Dehulled green 403±96 b 2292±66 a 1333±153 b 353±61 a 0.08±0.04 a Mean 496±116 2292±100 1354±437 333±80 0.02±0.03 Common bean
Small red 721±114 a 2492±62 a 128±31 b 45±4 cb 0.01±0.00 a Cranberry 644±65 ab 2436±70 ab 187±16 a 56±4 ab 0.01±0.00 a Great northern 626±47 ab 2315±8 b 157±21 ab 43±6 cb 0.01±0.00 a Light red kidney 717±31 a 2093±30 c 181±16 a 69±4 a 0.01±0.00 a Black 754±103 a 2404±130 ab 166±24 ab 68±14 a 0.01±0.00 a Navy 642±31 ab 2011±71 c 187±31 a 45±9 cb 0.01±0.00 a Pinto 532±52 b 1774±41 d 171±15 ab 38±1 c 0.01±0.00 a Mean 662±93 2218±258 168±28 52±13 0.01±0.00 Chickpea
Desi 340±51 b 1437±58 b 113±24 a 55±10 a 2±2 a Kabuli 543±48 a 1629±6 a 127±39 a 25±6 a 9±6 a Mean 441±120 1533±112 120±30 40±18 5±6
Data represent mean value ± standard deviation. Values are presented on a wet weight basis (10% moisture). Values within each
market class followed by a different letter are significantly different at P < 0.05 (n=42).

22
Figure 2. 1. Hemicellulose (arabinose+xylose) and cellulose concentrations in different a) lentil, b) common bean, and c)
chickpea market classes. Values are presented on a wet weight basis (10% moisture). Values within each market class followed
by a different letter are significantly different at P < 0.05 (n=42).
Fig 2.1a Fig 2.1b Fig 2.1c

23
Figure 2. 2. Soluble starch (SS), resistant starch (RS), and total amylose concentration in different a) lentil, b) common bean,
and c) chickpea market classes. Values are presented on wet weight basis (10% moisture). Values within each market class
followed by a different letter are significantly different at P < 0.05 (n=42).
Fig 2.2a Fig 2.2c Fig 2.2b
24
sorbitol and xylitol concentrations. Considering common bean RFO, stachyose
concentrations were higher (1.8-2.5 g/100 g) than those for raffinose (532-754 mg/100 g)
and verbascose (128-187 mg/100 g) (Table 2.5). For FOS, kestose concentrations (38-69
mg/100 g) were higher than nystose concentrations (0.01-0.01 mg/100 g) (Table 2.5).
Common bean arabinose and xylose concentrations ranged from 5.3-6.6 g/100 g and 2.7-
3.1 g/100 g, respectively (Figure 2.1b). Among common bean market classes, small red
had significantly more (P < 0.05) arabinose and cranberry bean and light red kidney bean
had significantly more (P < 0.05) xylose. Cellulose concentrations ranged from 0.9 to 3.4
g/100 g, with navy bean having the highest concentration (Figure 2.1b). Soluble starch,
RS, and amylose concentrations ranged from 38-44, 2-3, and 18-21 g/100, respectively.
Overall, cranberry bean had higher SS, RS, and amylose concentrations (Figure 2.2b).
Chickpea
Sucrose was the most abundant simple sugar (1.8-2.5 g/100 g) in chickpea,
followed by glucose (30-32 mg/100 g), fructose (2.2-2.5 mg/100 g), mannose (0.5-0.8
mg/100 g), and rhamnose (0.1-0.1 mg/100 g) (Table 2.3). Among chickpea SAs, sorbitol
concentrations (473-557 mg/100 g) were higher than mannitol (15-19 mg/100 g) and
xylitol (14-18 mg/100 g) concentrations (Table 2.4). Overall, desi had higher sorbitol,
mannitol, and xylitol concentrations than kabuli; however, differences were only
significant for sorbitol and xylitol (P < 0.05). Among RFO in chickpea, stachyose
concentrations (1.4-1.6 g/100 g) were higher than raffinose (340-543 mg/100 g) and
verbascose (113-127 mg/100 g) concentrations (Table 2.5). Kabuli had significantly
more (P < 0.05) raffinose and stachyose than desi. Considering FOS in chickpea, kestose

25
concentration (25-55 mg/100 g) was higher than nystose concentration (2-9 mg/100 g)
(Table 2.5). Arabinose, xylose, cellulose, SS, RS, and amylose concentrations ranged
from 4.0-4.1, 2.5-3.0, 0.9-1.3, 38-45, 3.1-3.1, and 17-21 g/100 g, respectively, but none
of these were significantly different between desi and kabuli (Figures 2.1c and 2.2c).
2.7. Discussion
Pulses, including lentil, common bean, and chickpea, are traditional staple foods
that have been consumed for several centuries because of their superior nutritional profile
(Johnson et al., 2013; Sen Gupta et al., 2013; Thavarajah et al., 2011; Wang et al., 2009).
However, increasing global demand for highly processed sugar and fat-rich foods has led
to severe non-communicable disease epidemics, including obesity, overweight, and
cancer (Mitchell et al., 2009). A diet rich in prebiotic carbohydrates, low in energy and
glycemic response, moderate in protein, low in fat, and rich in micronutrients is now
recommended for weight management (WHO, 2014). Cereal-based diets can satisfy daily
caloric requirements, but do not provide daily requirements of prebiotic carbohydrates in
a single serving (Williams, 1995). The present study indicates that pulses (lentil, common
bean, and chickpea) provide 60 to 75% of the daily safe requirement of prebiotic
carbohydrates (20 g/day) in a single serving (Table 2.2; Douglas and Sanders, 2008). The
official recommendations have not been made yet for prebiotic carbohydrate
consumption, however several researches have offered suggestions for safe intake
(Douglas and Sanders, 2008). Additionally, this current work provides information on
the types and quantities of prebiotic carbohydrates in - different pulse market classes,

26
which is valuable for further enhancement of nutritional quality via plant breeding and
genetic selection.
Simple sugar concentrations in lentil, common bean, and chickpea are comparable
to previous studies (Sánchez-Mata et al., 1998). Simple sugar concentrations in common
bean were higher than in lentil and chickpea. In contrast, SA concentrations were higher
in lentil and chickpea than in common bean. Simple sugars are precursors of SA
formation in plants; however, this negative correlation between simple sugars and SA is
largely dependent on plant type and weather conditions (Krasensky and Jonak, 2012).
Simply, from 5.1 to 6.7, 1.7 to 2.6, and 2.1 to 2.8 g/100 g for RFO (Gangola et al., 2016;
Johnson et al., 2015b; Reddy et al., 1984) and 0.0 to 0.7, 0.0 to 0.5, and 0.0 to 0.07 g/100
g for FOS (Biesiekierski et al., 2011; Johnson et al., 2015a) in lentil, common bean, and
chickpea, respectively. These values are comparable to those from the current study.
Further, the present study found total polysaccharides are higher in common bean and
chickpea than in lentil, similar to previous reports (Dodevska et al., 2013; Singh, 1984).
The composition of carbohydrates depends on their localization in the seed coat or
cotyledon (Guillon and Champ, 2002). Cell walls of the cotyledon contain a range of
polysaccharides including cellulose, starch, and non-starchy non-cellulosic glucans, while
the seed coat contains large quantities of low molecular weight carbohydrates and
cellulose but is low in hemicellulose (Guillon and Champ, 2002). Lentil seeds are
generally smaller than common bean and chickpea (Table 2.1); this might explain why
increased levels of low molecular weight carbohydrates (SA, RFO, and FOS) are found

27
in lentil while common bean and chickpea contain higher levels of cellulose and
hemicellulose (Table 2.2).
Sucrose is the most abundant simple sugar found in pulses. During the
development of the endosperm in the seed, the concentration of hexose declines while
sucrose increases (Hill et al., 2003). Among lentil market classes, red lentil has higher
levels of simple sugars than green lentil. Also, whole green lentil (lentil with seed coat)
contains more sucrose, glucose, and fructose than dehulled green lentil, in accordance
with earlier studies (Wang, 2008; Wang et al., 2009) the opposite is true with respect to
mannose (Table 2.3). In common bean, cranberry, small red, and great northern bean had
higher total simple sugars while black and navy bean had the least (Table 2.3), showing
significant variation among market classes due to structural (i.e., seed size), genetic, and
environmental variations (Reddy et al., 1984). Among chickpea market classes, kabuli
had significantly more sucrose than desi due to its larger cotyledon size (Wang and Daun,
2004).
With respect to SAs, whole red lentil had higher sorbitol than dehulled lentil and
dehulled red lentil had higher mannitol and xylitol; however, the opposite is true for
green lentil, showing that SA distribution in lentil seed is influenced by both market class
(red vs. green) and processing method (whole vs. dehulled), as noted previously (Siva et
al., 2018). Common bean market classes also varied with respect to SA levels and had
more mannitol and xylitol than sorbitol. Light red kidney bean, which has the largest seed
size among studied market classes, had 50% more SA than all other market classes. In
chickpea, desi (smaller seed size, and hence more seed coat area) had more SA than
28
kabuli, which is attributed to the more SA being present in seed coat than the cotyledon.
Across all three pulse crop types, SA varied with seed size, market class, and processing
method.
Lentil RFO concentration varies with genotype and growing environment
(Johnson et al., 2013, 2015a). Moreover, dehulling generally reduces raffinose
concentrations but increases stachyose and verbascose concentrations (Johnson et al.,
2015b; Siva et al., 2018; Wang et al., 2009). In the current study, dehulling only
increased verbascose concentration in red lentil. The greater variation in stachyose vs.
raffinose and verbascose levels among common bean market classes might be due to
genetic differences. Along with variations in seed size, seed coat thickness, and surface
area, genetic makeup might affect the RFO concentration in common bean. In chickpea,
more RFOs were found in kabuli (Wang and Daun, 2004), which has a large seed size
and hence a larger seed cotyledon (Tables 2.1 and 2.5). With respect to FOS, present
data show higher levels of kestose present in the seed cotyledon than the seed coat in red
lentil, with the reverse observed in green lentil (Table 2.5). Kestose levels varied
significantly among common bean and chickpea market classes, indicating that kestose
synthesis might be influenced by market class (Patrick et al., 2013).
The seed coat contains most of the cellulose found in the seed (Bhattacharya et
al., 2005). Present data confirm that whole lentil generally had higher cellulose levels
than dehulled lentil. Similarly, arabinose and xylose were slightly higher in whole lentil
and dehulled lentil, respectively, reflecting differences in the distribution of
hemicellulose compounds in the seed. Cellulose levels are higher in common bean

29
market classes when the seed size decreases, suggesting cellulose compounds are
abundant in the seed coat. In contrast, arabinose and xylose levels are positively
correlated with seed size. In chickpea, significant differences between desi and kabuli
were not observed, which contrasts with previously reported results (Singh, 1984).
The RS levels of raw pulses were ranged from 3 to 21 g/100 g in previous studies
(García-Alonso et al., 1998; de Almeida Costa et al., 2006; Johnson et al., 2013; Johnson
et al., 2015b). High variation in the RS yield may due to differences in the RS analysis
methods, particle size of the pulse flour, and the genetic and environmental variation of
the pulses. In present study, lentil dehulling slightly increases RS and SS as dehulling
removes the starch-free seed coat, therefore concentrating starch fractions in the seed
cotyledon (Johnson et al., 2015b; Siva et al., 2018). In common bean and chickpea
market classes, RS and SS are positively correlated with seed size (Figure 2.2b, Table
2.1), which relates to where starch compounds are stored in the cotyledon. Further, data
from the current study confirm the positive correlation of amylose concentrations with
RS, SS, and total starch (sum of RS and SS), similar to previous reports (Yadav et al.,
2009). Johnson et al. (2015b) indicated that significant changes in lentil RS concentration
due to processing, cooking, and cooling. Cooling of cooked lentil increased RS
concentration approximately two-fold from 3.0 % (w/w) in cooked lentil to 5.5 % (w/w)
after cooling. Further, RS concentrations ranged from 3 - 5% (w/w) in raw lentil and the
concentrations of RS in raw and cooked lentils were not significantly different (Johnson
et al., 2015). This current study reports only dry pulse seed RS concentrations for future
breeding and selection purposes.

30
Overall, prebiotic carbohydrates represented 24, 28, and 22% of the total
carbohydrate compounds in lentil, common bean, and chickpea, respectively. Prebiotic
carbohydrate concentrations differ among pulses due to seed size, type of pulse, and
processing method, and therefore incorporation of several pulses in the diet provides a
range of different prebiotic carbohydrates needed for gut health. However, this present
study did not report several prebiotic carbohydrates including pectin, and types of
hemicellulose which does occur in most legume seeds. Further, complete profiling of
carbohydrates in pulses provides useful information for future plant breeding and genetic
studies to understand the prebiotic carbohydrate control mechanism in plants (Vinocur
and Altman, 2005).
2.8. Conclusion
This study shows the type and quantity of prebiotic carbohydrates varies with
pulse crop, market class, seed size, and processing method. Lentil, common bean, and
chickpea provide 60-75% of the suggested daily intake of prebiotic carbohydrates in a
100 g serving. Lentil is rich in low molecular weight carbohydrates including SA, RFO,
and FOS, while common bean and chickpea are rich in polysaccharides such as cellulose,
hemicellulose, and amylose. Overall, these pulses are rich in prebiotic carbohydrates, and
further nutritional breeding is possible with identifying suitable growing locations, and
genotypes producing higher levels of prebiotic carbohydrates in different pulse crop
market classes.

31
2.9. Acknowledgements
Funding support for this project was provided by the Plant Health and Production
and Plant Products: Plant Breeding for Agricultural Production program area [grant no.
2018-67014-27621/project accession no. 1015284] of the USDA National Institute of
Food and Agriculture, the International Center for Dry Land Agriculture (ICARDA,
Morocco), and the American Pulse Association.
2.10. References
Bartels, D., and Sunkar, R. (2005). Drought and salt tolerance in plants. CRC. Crit. Rev.
Plant Sci. 24, 23–58. doi:10.1080/07352680590910410
Bhattacharya, S., Narasimha, H. V., and Bhattacharya, S. (2005). The moisture dependent
physical and mechanical properties of whole lentil pulse and split cotyledon. Int. J.
Food Sci. Technol. 40, 213–221. doi:10.1111/j.1365-2621.2004.00933.x
Bhatty, R. S. (1988). Composition and quality of lentil (Lens culinaris Medik): A review.
Can. Inst. Food Sci. Technol. J. 21, 144–160. doi:10.1016/S0315-5463(88)70770-1.
Biesiekierski, J. R., Rosella, O., Rose, R., Liels, K., Barrett, J. S., Shepherd, S. J., et al.
(2011). Quantification of fructans, galacto-oligosacharides and other short-chain
carbohydrates in processed grains and cereals. J. Hum. Nutr. Diet. 24, 154–176.
doi:10.1111/j.1365-277X.2010.01139.x
Chiang, Y., Stushnoff, C., McSay, A., Jones, M., and Bohnert, H. (2005). Overexpression
of mannitol-1-phosphate dehydrogenase increases mannitol accumulation and adds
protection against chilling injury in petunia. J. Am. Soc. Hortic. Sci. 130, 605–610.
Cummings, J. H., and Stephen, A. M. (2007). Carbohydrate terminology and

32
classification. Eur J Clin Nutr. 61, S5–S18.
de Almeida Costa, G. E., da Silva Queiroz-Monici, K., Pissini Machado Reis, S. M., and
de Oliveira, A. C. (2006). Chemical composition, dietary fibre and resistant starch
contents of raw and cooked pea, common bean, chickpea and lentil legumes. Food
Chem. 94, 327–330. doi:10.1016/j.foodchem.2004.11.020.
Dodevska, M. S., Djordjevic, B. I., Sobajic, S. S., Miletic, I. D., Djordjevic, P. B., and
Dimitrijevic-Sreckovic, V. S. (2013). Characterisation of dietary fibre components in
cereals and legumes used in Serbian diet. Food Chem. 141, 1624–1629.
doi:10.1016/j.foodchem.2013.05.078
Douglas, L., and Sanders, M. (2008). Probiotics and prebiotics in dietetics practice. J. Am.
Diet. Assoc. 108, 510–521.
FAO (2018). FAOSTAT. Available at: http://faostat3.fao.org/home/E [Accessed May 20,
2018]
Feinberg, M., San-Redon, J., and Assié, A. (2009). Determination of complex
polysaccharides by HPAE-PAD in foods: Validation using accuracy profile. J.
Chromatogr. B 877, 2388–2395. doi:10.1016/j.jchromb.2008.10.004
Gangola, M. P., Jaiswal, S., Kannan, U., Gaur, P. M., Båga, M., and Chibbar, R. N.
(2016). Galactinol synthase enzyme activity influences raffinose family
oligosaccharides (RFO) accumulation in developing chickpea (Cicer arietinum L.)
seeds. Phytochemistry 125, 88–98. doi:10.1016/j.phytochem.2016.02.009
García-Alonso, A., Goñi, I., and Saura-Calixto, F. (1998). Resistant starch and potential
glycaemic index of raw and cooked legumes (lentils, chickpeas and beans).

33
Zeitschrift für Lebensmitteluntersuchung und-Forschung A. 206, 284–287.
doi:10.1007/s002170050258.
Gibson, T. S., Solah, V. A., and McCleary, B. V. (1997). A procedure to measure
amylose in cereal starches and flours with concanavalin A. J. Cereal Sci. 25, 111–
119. doi:10.1006/jcrs.1996.0086
Guillon, F., and Champ, M. M. J. (2002). Carbohydrate fractions of legumes: Uses in
human nutrition and potential for health. Br. J. Nutr. 88, 293.
doi:10.1079/bjn2002720
Hill, L. M., Morley-Smith, E. R., and Rawsthorne, S. (2003). Metabolism of sugars in the
endosperm of developing seeds of oilseed rape. Plant Physiol. 131, 228–236.
doi:10.1104/pp.010868
Hodge, A. M., English, D. R., O’Dea, K., and Giles, G. G. (2004). Glycemic index and
dietary fiber and the risk of type 2 diabetes. Diabetes Care 27, 2701–2706.
doi:10.2337/diacare.27.11.2701
Hutkins, R. W., Krumbeck, J. A., Bindels, L. B., Cani, P. D., Fahey, G., Goh, Y. J., et al.
(2016). Prebiotics: why definitions matter. Curr. Opin. Biotechnol. 37, 1–7.
doi:10.1016/J.COPBIO.2015.09.001.
Johnson, C. R., Thavarajah, D., Combs, G. F., and Thavarajah, P. (2013). Lentil (Lens
culinaris L.): A prebiotic-rich whole food legume. Food Res. Int. 51, 107–113.
doi:10.1016/j.foodres.2012.11.025
Johnson, C. R., Thavarajah, D., Thavarajah, P., Fenlason, A., McGee, R., Kumar, S., et al.
(2015a). A global survey of low-molecular weight carbohydrates in lentils. J. Food

34
Compos. Anal. 44, 178–185. doi:10.1016/j.jfca.2015.08.005
Johnson, C. R., Thavarajah, D., Thavarajah, P., Payne, S., Moore, J., and Ohm, J. B.
(2015b). Processing, cooking, and cooling affect prebiotic concentrations in lentil
(Lens culinaris Medikus). J. Food Compos. Anal. 38, 106–111.
doi:10.1016/j.jfca.2014.10.008
Kaur, N., and Gupta, A. (2002). Applications of inulin and oligofructose in health and
nutrition. J. Biosci. 27, 703–714.
Keunen, E., Peshev, D., Vangronsveld, J., Van Den Ende, W., and Cuypers, A. (2013).
Plant sugars are crucial players in the oxidative challenge during abiotic stress:
extending the traditional concept. Plant. Cell Environ. 36, 1242–1255.
doi:10.1111/pce.12061
Kim, M. S., Cho, S. M., Kang, E. Y., Im, Y. J., Hwangbo, H., Kim, Y. C., et al. (2008).
Galactinol is a signaling component of the induced systemic resistance caused by
Pseudomonas chlororaphis O6 root colonization. Mol. Plant-Microbe Interact. 21,
1643–1653. doi:10.1094/MPMI-21-12-1643
Krasensky, J., and Jonak, C. (2012). Drought, salt, and temperature stress-induced
metabolic rearrangements and regulatory networks. J. Exp. Bot. 63, 1593–1608.
doi:10.1093/jxb/err460
Lee, S. H., Doherty, T. V., Linhardt, R. J., and Dordick, J. S. (2009). Ionic liquid-
mediated selective extraction of lignin from wood leading to enhanced enzymatic
cellulose hydrolysis. Biotechnol. Bioeng. 102, 1368–1376. doi:10.1002/bit.22179
Liu, H., Dai, X., Xu, Y., and Chong, K. (2007). Over-expression of OsUGE-1 altered

35
raffinose level and tolerance to abiotic stress but not morphology in Arabidopsis. J.
Plant Physiol. 164, 1384–1390. doi:10.1016/j.jplph.2007.03.005
Manning, T. S., and Gibson, G. R. (2004). Prebiotics. Best Pract. Res. Clin.
Gastroenterol. 18, 287–298. doi:10.1016/j.bpg.2003.10.008
McCleary, B. V., and Monaghan, D. A. (2002). Measurement of Resistant Starch. J.
AOAC Int. 85, 665–675.
Megazyme (2012). Resistant starch assay procedure. RSTAR 11/02. Megazyme Int. Ltd,
Ireland.
Megazyme (2016). Amylose/amylopectine assay procedure. K-AMYL 12/16. Megazyme
International Ltd, Ireland.
Mitchell, D. C., Lawrence, F. R., Hartman, T. J., and Curran, J. M. (2009). Consumption
of dry beans, peas, and lentils could improve diet quality in the US population. J.
Am. Diet. Assoc. 109, 909–913. doi:10.1016/j.jada.2009.02.029
Muehlbauer, F. J., Cho, S., Sarker, A., McPhee, K. E., Coyne, C. J., Rajesh, P. N., et al.
(2006). Application of biotechnology in breeding lentil for resistance to biotic and
abiotic stress. Euphytica 147, 149–165. doi:10.1007/s10681-006-7108-0
Muir, J. G., Rose, R., Rosella, O., Liels, K., Barrett, J. S., Shepherd, S. J., et al. (2009).
Measurement of short-chain carbohydrates in common Australian vegetables and
fruits by high-performance liquid chromatography (HPLC). J. Agric. Food Chem.
57, 554–565.
Neethirajan, S., Tsukamoto, K., Kanahara, H., and Sugiyama, S. (2012). Ultrastructural
analysis of buckwheat starch components using atomic force microscopy. J. Food

36
Sci. 77, N2–N7. doi:10.1111/j.1750-3841.2011.02442.x
Nishizawa, A., Yabuta, Y., and Shigeoka, S. (2008). Galactinol and raffinose constitute a
novel function to protect plants from oxidative damage. Plant Physiol. 147, 1251–
63. doi:10.1104/pp.108.122465
Oku, T., and Nakamura, S. (2003). Comparison of digestibility and breath hydrogen gas
excretion of fructo-oligosaccharide, galactosyl-sucrose and isomalto-oligosaccharide
in healthy human subjects. Eur. J. Clin. Nutr. 57, 1150–1156.
doi:10.1038/sj.ejcn.1601666
Patrick, J. W., Botha, C. F., and Birch, G. R. (2013). Metabolic engineering of sugars and
simple sugar derivatives in plants. Plant Biotechnol. J. 11, 142–156.
doi:10.1111/pbi.12002
Pennycooke, J. C., Jones, M. L., and Stushnoff, C. (2003). Down-regulating alpha-
galactosidase enhances freezing tolerance in transgenic petunia. Plant Physiol. 133,
901–9. doi:10.1104/pp.103.024554
Pharr, D., Stoop, J., Williamson, J., Studer Feusi, M., Massel, M., and Conkling, M.
(1995). The dual role of mannitol as osmoprotectant and photoassimilate in celery.
HortScience 30, 1182–1188.
Pujni, D., Chaudhary, A., and Rajam, M. V. (2007). Increased tolerance to salinity and
drought in transgenic indica rice by mannitol accumulation. J. Plant Biochem.
Biotechnol. 16, 1–7. doi:10.1007/BF03321921
Reddy, N. R., Pierson, M. D., Sathe, S. K., and Salunkhe, D. K. (1984). Chemical,
nutritional and physiological aspects of dry bean carbohydrates - A review. Food
37
Chem. 13, 25–68. doi:10.1016/0308-8146(84)90026-8
Sánchez-Mata, M., Peñuela-Teruel, M., Cámara-Hurtado, M., Díez-Marqués, C., and
Torija-Isasa, M. (1998). Determination of mono-, di-, and oligosaccharides in
legumes by high-performance liquid chromatography using an amino-bonded silica
column. J. Agric. Food Chem. 46, 3648–3652. doi:10.1021/jf980127w
SAS (2016). User’s guide: Statistics SAS Institute, Version 9.4. SAS Institute Inc. Cary,
NC.
Sen Gupta, D., Thavarajah, D., Knutson, P., Thavarajah, P., McGee, R. J., Coyne, C. J., et
al. (2013). Lentils (Lens culinaris L.), a rich source of folates. J. Agric. Food Chem.
61, 7794–7799. doi:10.1021/jf401891p
Singh, U. (1984). Dietary fiber and its constituents in desi and kabuli chickpea (Cicer
arietinum L.) cultivars. Nutr. Rep. Int. 29, 419–426.
Siva, N., Thavarajah, P., and Thavarajah, D. (2018). The impact of processing and
cooking on prebiotic carbohydrates in lentil. J. Food Compos. Anal. 70, 72–77.
doi:10.1016/j.jfca.2018.04.006
Sivapragasam, N., Thavarajah, P., Ohm, J. B., and Thavarajah, D. (2014). Enzyme
resistant carbohydrate based micro-scale materials from sugar beet (Beta vulgaris L.)
pulp for food and pharmaceutical applications. Bioact. Carbohydrates Diet. Fibre 3,
115–121. doi:10.1016/j.bcdf.2014.03.004
Tang, W., Peng, X., and Newton, R. J. (2005). Enhanced tolerance to salt stress in
transgenic loblolly pine simultaneously expressing two genes encoding mannitol-1-
phosphate dehydrogenase and glucitol-6-phosphate dehydrogenase. Plant Physiol.

38
Biochem. 43, 139–146. doi:10.1016/j.plaphy.2005.01.009
Thavarajah, D., Thavarajah, P., Abare, A., Basnagala, S., Lacher, C., Smith, P., et al.
(2016). Mineral micronutrient and prebiotic carbohydrate profiles of USA-grown
kale (Brassica oleracea L. var. acephala). J. Food Compos. Anal. 52, 9–15.
doi:10.1016/j.jfca.2016.07.003
Thavarajah, D., Thavarajah, P., Wejesuriya, A., Rutzke, M., Glahn, R. P., Combs, G. F.,
et al. (2011). The potential of lentil (Lens culinaris L.) as a whole food for increased
selenium, iron, and zinc intake: preliminary results from a 3 year study. Euphytica
180, 123–128. doi:10.1007/s10681-011-0365-6
Trumbo, P., Schlicker, S., Yates, A. A., and Poos, M. (2002). Dietary reference intakes
for energy, carbohydrate, fiber, fat, fatty acids, cholesterol, protein and amino acids.
J. Am. Diet. Assoc. 102, 1621–1631.
Valluru, R., and Van den Ende, W. (2011). Myo-inositol and beyond – Emerging
networks under stress. Plant Sci. 181, 387–400. doi:10.1016/j.plantsci.2011.07.009
Van Loo, J., Coussement, P., De Leenheer, L., Hoebregs, H., and Smits, G. (1995). On
the presence of inulin and oligofructose as natural ingredients in the western diet.
Crit. Rev. Food Sci. Nutr. 35, 525–552. doi:10.1080/10408399509527714
Vinocur, B., and Altman, A. (2005). Recent advances in engineering plant tolerance to
abiotic stress: achievements and limitations. Curr. Opin. Biotechnol. 16, 123–132.
doi:10.1016/j.copbio.2005.02.001
Wang, N. (2008). Effect of variety and crude protein content on dehulling quality and on
the resulting chemical composition of red lentil (Lens culinaris). J. Sci. Food Agric.

39
88, 885–890. doi:10.1002/jsfa.3165
Wang, N., and Daun, J. K. (2004). The chemical composition and nutritive value of
Canadian pulses. Canadian Grain Commission Report. 19–29.
Wang, N., Hatcher, D. W., Toews, R., and Gawalko, E. J. (2009). Influence of cooking
and dehulling on nutritional composition of several varieties of lentils (Lens
culinaris). LWT - Food Sci. Technol. 42, 842–848. doi:10.1016/j.lwt.2008.10.007
WHO. (2014). Diet, nutrition and the prevention of chronic diseases. Report of the joint
WHO/FAO expert consultation. WHO Technical Report Series, No 916 (TRS 916).
61–70.
Williams, C. L. (1995). Importance of dietary fiber in childhood. J. Am. Diet. Assoc. 95,
1140–1149. doi:10.1016/S0002-8223(95)00307-X
Yadav, B. S., Sharma, A., and Yadav, R. B. (2009). Studies on effect of multiple
heating/cooling cycles on the resistant starch formation in cereals, legumes and
tubers. Int. J. Food Sci. Nutr. 60, 258–272. doi:10.1080/09637480902970975
Zhifang, G., and Loescher, W. H. (2003). Expression of a celery mannose 6-phosphate
reductase in Arabidopsis thaliana enhances salt tolerance and induces biosynthesis of
both mannitol and a glucosyl-mannitol dimer. Plant, Cell Environ. 26, 275–283.
doi:10.1046/j.1365-3040.2003.00958.x
This chapter was published in Frontiers in Nutrition; Siva, N., Thavarajah, P., Kumar, S.,
and Thavarajah, D. (2019). Variability in Prebiotic Carbohydrates in Different Market
Classes of Chickpea, Common Bean, and Lentil Collected From the American Local
Market. Front. Nutr. 6, 38. doi:10.3389/fnut.2019.00038.

40
3. CHAPTER TWO
PREBIOTIC CARBOHYDRATE CONCENTRATIONS OF COMMON BEAN
AND CHICKPEA CHANGE DURING COOKING, COOLING, AND
REHEATING
3.1. Hypotheses
H0: Cooking, cooling, and reheating do not change the concentrations of SA,
RFO, FOS, RS, and amylose concentration in common bean and chickpea market classes.
H1: Cooking, cooling, and reheating change the concentrations of SA, RFO, FOS,
RS, and amylose in common bean and chickpea market classes.
3.2. Objective
Determine changes of SA, RFO, FOS, RS, and amylose concentration in seven
common bean market classes (small red, cranberry, great northern, light red kidney,
black, navy, and pinto) and two chickpea market classes (desi and kabuli) in response to
cooking, cooling, and reheating.
3.3. Abstract
Thermal processing of pulse crops influences the type and levels of prebiotic
carbohydrates present. Pulses such as common bean and chickpea are rich sources of
prebiotic carbohydrates including sugar alcohols (SAs), raffinose family oligosaccharides
(RFOs), fructooligosaccharides (FOSs), resistant starch (RS), and amylose. This study
determined changes in prebiotic carbohydrate concentrations of seven common bean and
two chickpea market classes after thermal processing (cooking, cooling, reheating). A

41
100-g serving of common bean provides 0.7–10.6 mg of SAs, 3.9–5.2 g of RFOs, 57–143
mg of FOSs, 2.6–3.9 g of RS, and 25–33 g of amylose; cooling and reheating reduced
RFOs but increased SAs, FOSs, and RS in many cases. A 100-g serving of chickpea
provides 1.2–1.7 g of SAs, 2.5–3.2 g of RFOs, 26–43 mg of FOSs, 3.6–5.3 g of RS, and
24–30 g of amylose; cooling and reheating reduced SAs and RFOs but increased FOSs,
RS, and amylose concentrations. Processing methods change the nutritional quality of
pulse crops by changing the type and quantity of prebiotic carbohydrates.
Keywords: Pulse crops, food processing, sugar alcohols, raffinose family
oligosaccharides, fructooligosaccharides, resistant starch, amylose
3.4. Introduction
Pulses are becoming popular in Western diets due to increased awareness of their
nutritional benefits (Hall et al., 2017). Prebiotic carbohydrates benefit human health as
they are fermented by favorable gut microorganisms (Gibson et al., 2017); reduce
cholesterol formation, body cell inflammation, and blood pressure; and increase satiety
hormones and nutrient absorption by changing the gut pH (Joshi et al., 2018). Two types
of prebiotic carbohydrates are generally present in plant-based foods: low molecular
weight carbohydrates include sugar alcohols (SAs: sorbitol and mannitol), raffinose
family oligosaccharides (RFOs: raffinose, stachyose, and verbascose), and
fructooligosaccharides (FOSs: kestose and nystose); and high molecular weight
carbohydrates include cellulose, hemicellulose, inulin, and resistant starch (RS)
(Roberfroid et al., 2010). Common bean (Phaseolus vulgaris L.) and chickpea (Cicer
arietinum L.) respectively contain 0.4–5.6 and 1.2–2.9/100 g of RFOs (Gangola et al.,

42
2016; Reddy et al., 1984). Further, these pulse crops contain 0–1 and 0–0.07 g/100 g of
FOSs (Biesiekierski et al., 2011) and 2.9–4.5 and 2.4–4.4 g/100 g of RS, respectively (de
Almeida Costa et al., 2006).
Prebiotic carbohydrate concentrations and nutritional benefits change during
processing. Cooking and microwave reheating of lentil can reduce RFOs (from 5.5–6.1%
to 4.3–4.9%) and cooling (at 4 °C for 24 h) can cause a twofold increase in RS (Johnson
et al., 2015; Siva et al., 2018). Processing leads to structural changes of starch
molecules—e.g., amylose:amylopectin ratio, amylose retrogradation, amylose chain
length, linearization of amylopectin—in response to temperature, water content, and
pressure (Sajilata et al., 2006). These structural changes vary with the physical properties
(size and seed coat thickness) and chemical composition (protein, fat content,
amylose:amylopectin ratio, minerals, and endogenous enzymes) of the seed (Varatharajan
et al., 2011; Wang et al., 2003).
Seed physical properties influence water absorption and heat diffusion during
processing (Kumar et al., 2018; Shafaei et al., 2016; Turhan et al., 2002). The seed size of
common bean varies from 20–52 g/100 seeds (White and González, 1990). Common
bean market classes also demonstrate different seed volume, seed density, hydration, and
swelling capacity (Shimelis and Rakshit, 2005). As a result, the cooking time of common
bean ranges from 19–34 min (Shimelis and Rakshit, 2005). The seed size of chickpea
market classes varies from 14–32 g/100 seeds (Hossain et al.; Kaur et al., 2005). Kabuli
chickpea has a higher seed volume, seed density, and hydration capacity than desi
chickpea. Therefore, kabuli requires a longer cooking time (93–97 min) than the desi type
43
(62–78 min) (Kaur et al., 2005). Overall, the physical differences of pulse crops influence
the thermal processing time, which may lead to thermal degradation of inherent nutrients
including prebiotic carbohydrates.
Cooked pulse seeds have different prebiotic carbohydrate types and
concentrations than raw seeds (Chung et al., 2008; Du et al., 2014). In a pair of studies,
black, pinto, and navy bean had higher concentrations of RS than red kidney bean before
cooking, but red kidney bean had significantly higher levels of RS than all other market
classes after cooking (Du et al., 2014a; Du et al., 2014b). The authors speculated the
differences in RS concentration in red kidney bean were related to starch granule size,
amylose concentration, and water absorption. Similar results have been reported for raw
desi chickpea, which had higher RS than kabuli due to its smaller seed size and higher
amylose concentration (Chung et al., 2008; Miao et al., 2009; Wang et al., 2010). Further,
cooking can reduce the RFO levels in both common bean and chickpea (Wang et al.,
2010).
Limited data are available on corresponding changes of SAs, FOSs, and amylose
in common bean and chickpea market classes and their impact on human nutrition. Yet,
comparison of prebiotic carbohydrate types and concentrations in thermally processed
pulse seeds is vital information for making nutritional composition recommendations
towards new food product development. This study was designed to determine changes
of SAs, RFOs, FOSs, RS, and amylose concentration in seven common bean market
classes (small red, cranberry, great northern, light red kidney, black, navy, and pinto) and

44
two chickpea market classes (desi and kabuli) in response to cooking, cooling, and
reheating.
3.5. Materials and Methods
Materials
Chemicals and enzymes were purchased from Fisher Scientific (Asheville, NC,
USA), Sigma-Aldrich (St. Louis, MO, USA), and VWR International (Suwanee, GA,
USA). Water, distilled and deionized (ddH2O) to a resistance of ≥ 18.2 MΩ (NANO-pure
Diamond, Barnstead, IA, USA), was used to make solvents and dilutions.
Seed samples
Approximately 1-kg samples of seven commercially available common bean
market classes (small red, cranberry, great northern, light red kidney, black, navy, and
pinto) and two chickpea market classes (desi and kabuli) were obtained from a
commercial distributor (AGT Foods, Bismarck, ND, USA) (Table 3.1). Samples were
homogenized by mixing, subsampled, and then stored at ambient temperature (20–25
°C). The treatment design was a completely randomized design with seven common bean
types and two chickpea types (n=9), three food processing methods (cooking, cooling,
and reheating) (n=3), and three replicates (n=3). The experiment was conducted two
times for a total of 162 samples.
Seed size
One hundred (100) seeds were counted and then weighed using an electronic
balance (model B1240, American Scientific Products, Japan), with data expressed as the
weight (g) of 100 seeds.

45
Table 3. 1. Physical characteristics of pulse market classes used in this experiment.
Type Market class Seed size (g/100 seeds)
Water absorptiona
(g/100 g seeds)
Seed coat thickness (mg/cm2)
Common bean
Small red 31-33 20-24 11-12 Cranberry 56-57 10-12 21-24 Great northern 30-37 42-44 16-19 Light red kidney 59-63 28-41 20-21 Black 18-20 69-88 19-22 Navy 19-21 74-80 12-14 Pinto 34-36 27-31 19-20
Chickpea Desi 23-25 61-73 22-23 Kabuli 47-49 57-64 7-8
a over 4 h.
Water absorption
Five grams of seeds were soaked in 15 g of water at room temperature for 4 h.
Seed samples were then drained, blotted with tissue paper, and weighed, with data
expressed as the amount of water (g) absorbed per 100 g of seeds (AACC International,
2010).
Seed coat thickness
Seed coats were removed using a mortar and pestle, with data expressed as coat
weight (mg) per unit area (1 cm2) (Gil et al., 1996).
Cooking, cooling, and reheating
Three replicates of samples (6 g) were placed in 50-mL Pyrex® beakers with
ddH2O at a weight ratio of 1:3 (seeds:water). The samples were placed in a slow cooker
(Model 33156SZ, Hamilton Beach Brands, Inc., Glen Allen, VA) and cooked for 4 h.
Similar set of samples were cooked and stored at room temperature for 1 h and then
refrigerated (ROPER, Whirlpool Corporation, MI, USA) at 4 °C for 24 h. Third set of

46
samples were cooked, cooled, and reheated in a microwave oven (General Electronic Co.,
Louisville, KY, USA) at high power (950 W) for 1 min. The entire experiment was
duplicated. Cooked, cooled, and reheated samples were homogenized, and their moisture
content measured by a gravimetric method (AACC International, 2010). Data are
reported on a wet weight basis (normalized to 15% moisture).
Low molecular weight carbohydrates (LMWCs)
LMWCs were extracted from 500-mg samples as per Muir et al., 2009. SA, RFO,
and FOS concentrations were measured using high-performance anion exchange
chromatography (HPAE) (Dionex, ICS-5000, Sunnyvale, CA, USA) (Feinberg et al.,
2009) connected to a CarboPac PA1 column (250 × 4 mm; Dionex, CA, USA) and a
CarboPac PA1 guard column (50 × 4 mm; Dionex, CA, USA). The mobile phases used
were 100 mM sodium hydroxide/600 mM sodium acetate (A), 200 mM sodium
hydroxide (B), and ddH2O (C) with a flow rate of 1 mL/min as described by Johnson et
al., 2013. Detection was carried out using a pulsed amperometric detector (PAD; ICS-
5000, Thermo Scientific, USA) with a gold electrode and a silver-silver chloride
reference electrode at 2.0 μA. LMWC concentrations were detected within a linear range
of 3 to 1000 μg/g, with a minimum detection limit of 0.2 μg/g. An external reference
(CDC Redberry lentil) was used to ensure the accuracy and reproducibility of the
detection. Peak areas of the external reference, glucose (100 ppm), SAs (3–1000 ppm),
RFOs (3–1000 ppm), and FOSs (3–1000 ppm) were routinely analyzed for method
consistency and detector sensitivity with an error of less than 5% (Johnson et al., 2013).
The concentration of LMWCs in the samples (Cs) was calculated according to Cs= (Cf ×

47
V) / m, where Cf is the filtrate concentration obtained from HPAE, V is the final diluted
volume, and m is the mass of the sample (moisture corrected).
Resistant Starch (RS)
RS concentration was measured using α-amylase and amyloglucosidase enzymes
as previously described (McCleary and Monaghan, 2002). The glucose concentration
(CG) resulting from enzymatic hydrolysis of resistant starch was measured using HPAE-
PAD. RS concentration (CRS) was calculated according to CRS = (CG × 0.9 × V) / m,
where 0.9 is a factor to convert free glucose to anhydrous glucose as occurs in starch
(McCleary and Monaghan, 2002), V is the final diluted volume, and m is the mass of the
sample (moisture corrected). Regular corn starch (RS concentration 1.0±0.1% (w/w)) was
used to validate the data. Batches were checked regularly to ensure an analytical error of
less than 10%.
Amylose concentration
Seed amylose concentration was measured as previously described (Gibson et al.,
1997) using an α-amylase enzyme (67 U/mL) and amyloglucosidase (333 U/mL). The
glucose concentration resulting from enzymatic hydrolysis of amylose and total starch
fractions was measured using a glucose oxidase and peroxidase (GOPOD) method.
Absorbance was measured at 510 nm in a spectrophotometer and amylose concentration
was calculated as follows:
Amylose (%)= Abs(Con A supernatant) Abs(Total starch aliquot)
× 6.159.2
×100,
Amylose (g/100 g)= Total starch concentration − Amylose (%)
100 ,
where 6.15 and 9.2 are dilution factors.

48
Scanning electron microscopy (SEM)
Freshly cooked, cooled, and reheated pinto bean and kabuli chickpea samples
were prepared for SEM imaging. Seeds and razor blades were submerged in liquid
nitrogen until completely frozen. A fraction of the seed cotyledon was then cut with the
frozen razor blade and attached to a multi-brace holder with carbon tape. The brass
holder was inserted into a variable pressure scanning electron microscope (S-3400N,
Hitachi High-Technologies, Tokyo, Japan) under low vacuum. The samples were allowed
to stand for 10-15 min until the surface moisture sublimated. Backscattered electron
images of each sample were taken within 15 min using an accelerating voltage of 8 kV
and a chamber pressure of 30 Pa.
Statistical analysis
Common bean and chickpea market classes, processing methods, runs, and
replicates were considered as random factors and class variables. Analysis of variance
(ANOVA) was performed using the General Linear Model procedure (PROC GLM) of
SAS 9.4 (SAS Institute Inc., 2017). Fisher’s protected least significant difference (LSD)
at P < 0.05 was used to separate means.
3.6. Results
Seed size, water absorption, and seed coat thickness varied among common bean and
chickpea market classes (Table 3.1). For common bean, black had the smallest seed size
(18–20 g/100 seeds) and highest water absorption (69–88 g/100 g seeds). Cranberry had a
slightly smaller seed size (56–57 g/100 seeds) compared to light red kidney (59–63 g/100
seeds) but a greater seed coat thickness (21–24 mg/cm2) and the lowest water absorption

49
(10–12 g/100 g seeds). For chickpea, kabuli had a larger seed size (47–49 g/100 seeds)
with lower water absorption and seed coat thickness than desi (Table 3.1).
Total prebiotic carbohydrates (sum of SAs, RFOs, FOSs, and RS) in cooked
common bean ranged from 6.8 to 8.3 g/100 g (Table 3.2). The concentration of total
prebiotic carbohydrates decreased significantly (P < 0.05) after cooling and reheating in
small red and pinto bean. For chickpea, total prebiotic carbohydrates ranged from 8.0 to
9.7 g/100 g after cooking but then after reheating significantly declined in desi but
increased in kabuli (P < 0.05) (Table 3.2). Overall, common bean and chickpea
respectively provide 36–39% and 45–49% of the daily recommended safe intake of
prebiotic carbohydrates.
Total SA concentrations ranged from 0.7–10.6 mg/100 g for common bean and
1197–1709 mg/100 g for chickpea after cooking (Table 3.3). Sorbitol concentration
varied from 0.5–2.2 mg/100 g after cooking for common bean but significantly (P < 0.05)
increased after cooling and reheating in cranberry, great northern, and pinto bean.
Mannitol concentration ranged from 0.10–0.42 mg/100 g for cooked common bean but
significantly (P < 0.05) decreased after cooling and reheating in all market classes except
black bean (Table 3.3). For chickpea, sorbitol concentration after cooking ranged from
984–1358 mg/100 g and mannitol concentration ranged from 213–351 mg/100 g. Cooling
did not change sorbitol or mannitol levels in either chickpea type but reheating
significantly decreased (P < 0.05) mannitol levels (Table 3.3).
Total RFOs ranged from 3.9–5.2 g/100 g for common bean and 2.5–3.2 g/100 g
for chickpea after cooking (Table 3.4). Common bean had a higher concentration of

50
Table 3. 2. Concentrations of total prebiotic carbohydrates (g) in a 100 g serving of cooked, cooled, and reheated common
bean and chickpea market classes with percent recommended dietary allowance.
Market classes Total prebiotic carbohydrates* (g/100 g) Recommended dietary allowance (%) Cooked Cooled Reheated Cooked Cooled Reheated
Common beans Small red bean 8.2±0.3a 7.2±0.3b 5.5±0.3c 41±1a 36±1b 28±2c Cranberry bean 7.6±0.9a 7.3±0.5a 6.2±0.9b 38±4a 37±2a 31±4b Great northern bean 6.8±1.1a 7.2±0.8a 7.0±1.0a 34±5a 36±4a 35±5a Light red kidney bean 8.0±0.7a 7.4±1.0a 7.4±2.5a 40±3a 37±5a 37±12a Black bean 8.3±0.7a 8.1±0.5ab 7.6±0.9b 42±3a 41±2ab 38±4b Navy bean 8.0±0.3a 7.9±0.4a 7.7±1.5a 40±1a 40±2a 39±8a Pinto bean 6.9±0.7a 7.4±1.4b 8.3±2.1a 35±3b 37±7b 42±11a Mean 7.7±0.9a 7.5±0.8a 7.1±1.7b 39±4a 38±4a 36±8b
Chickpea Desi 8.0±0.8a 7.5±0.6ab 7.4±1.6b 40±4a 38±3ab 37±8b Kabuli 9.7±0.7b 11.8±1.8a 11.1±1.1a 49±3a 59±9a 56±6a Mean 8.9±1.2b 9.7±2.5a 9.3±2.4ab 45±6b 49±13a 47±12ab
*Total prebiotic carbohydrates were calculated by adding concentrations of sugar alcohols, raffinose family oligosaccharides,
fructooligosaccharides, and resistant starch. Recommended dietary allowance of prebiotic carbohydrates is 20 g/d (Douglas &
Sanders, 2008).

51
Table 3. 3. Sugar alcohol (SA) concentrations (mg/100 g) in common bean and chickpea market classes after cooking, cooling,
and reheating.
SAs Common bean Chickpea
srba cb gnb lrkb bb nb pb desi kabuli Sorbitol
Cooked 1.5±0.8a 1.2±0.5c 0.5±0.4c 10.2±6.9a 2.2±1.0a 0.9±0.6a 1.8±0.4b 1358±74a 984±42a Cooled 1.8±1.5a 4.2±4.1b 1.0±1.0b 9.2±4.0a 1.5±0.8b 1.5±1.6a 2.4±1.5b 1270±51a 946±37a Reheated 1.9±1.6a 5.7±5.6a 3.7±0.4a 10.1±3.6a 2.0±1.0ab 1.4±1.2a 4.3±1.4a 1319±159a 942±169a
Mannitol
Cooked 0.3±0.1a 0.18±0.04a 0.16±0.02a 0.42±0.04a 0.21±0.20ab 0.17±0.10a 0.10±0.04a 351±71a 213±21a Cooled 0.2±0.2b 0.06±0.04c 0.08±0.07c 0.33±0.11b 0.14±0.18b 0.14±0.08b 0.08±0.04b 324±73a 231±48a Reheated 0.2±0.1b 0.12±0.02b 0.12±0.09b 0.26±0.06b 0.28±0.22a 0.08±0.06c 0.06±0.04b 226±246b 135±118b Total SAs
Cooked 1.8±0.7a 1.5±0.5c 0.7±0.4c 10.6±6.9a 2.4±1.2a 1.1±0.7a 1.9±0.4b 1709±40a 1197±51a Cooled 1.9±1.4a 4.3±4.1b 1.1±0.9b 9.6±3.9a 1.6±1.0b 1.6±1.7a 2.4±1.5b 1594±108ab 1177±43a Reheated 2.0±1.4a 5.9±5.6a 3.8±0.4a 10.4±3.7a 2.2±1.2ab 1.5±1.2a 4.4±1.4a 1545±379b 1076±105b
aMean (±standard deviation) values within a column followed by a different letter are significantly different at P < 0.05 (n =
162). Values were calculated on a wet weight basis (15% moisture). Small red bean (srb), cranberry bean (cb), great northern
bean (gnb), light red kidney bean (lrkb), black bean (bb), navy bean (nb), and pinto bean (pb).

52
Table 3. 4. Raffinose family oligosaccharide (RFO) concentrations in common bean and chickpea market classes after
cooking, cooling, and reheating.
RFOs Common bean Chickpea
srba cb gnb lrkb bb nb pb desi kabuli Raffinose (g/100 g)
Cooked 1.0±0.2a 1.1±0.2a 1.0±0.2a 1.3±0.2a 1.3±0.1a 1.2±0.1a 1.1±0.1b 0.6±0.1a 0.8±0.2a Cooled 1.0±0.1ab 1.0±0.1a 0.9±0.1a 1.2±0.0b 1.3±0.1a 1.0±0.1b 1.0±0.0c 0.6±0.1a 0.7±0.2a Reheated 0.8±0.1b 1.1±0.2a 1.1±0.1a 1.0±0.1c 1.2±0.1a 1.0±0.1b 1.2±0.2a 0.6±0.1a 0.7±0.2a
Stachyose (g/100 g)
Cooked 3.2±0.4a 3.0±0.5a 2.8±0.6a 3.6±0.5a 3.8±0.4a 3.4±0.4a 3.0±0.2a 1.8±0.1a 2.3±0.2a Cooled 2.8±0.3b 2.6±0.7b 2.9±0.8a 3.4±1.0b 3.6±0.6a 3.0±0.6b 2.7±0.7b 1.6±0.2b 2.2±0.3a Reheated 2.4±0.6c 2.6±0.7b 2.9±0.6a 2.3±0.6c 2.8±0.5b 2.3±0.3c 2.8±0.8b 1.6±0.5b 1.9±0.2b
Verbascose (mg/100 g)
Cooked 69±27a 128±20a 47±4b 118±11a 78±7b 72±9a 62±12b 31±20b 49±16b Cooled 70±19a 103±18a 66±14b 96±28b 102±14a 87±23a 89±16a 42±24b 50±14b Reheated 70±19a 132±15a 101±23a 104±33ab 113±5a 83±18a 101±16a 63±22a 63±25a Total RFOs (g/100 g) Cooked 4.3±0.3a 4.2±0.5a 3.9±0.8a 4.9±0.4a 5.2±0.5a 4.8±0.4a 4.2±0.2a 2.5±0.1a 3.2±0.2a Cooled 3.9±0.2b 3.7±0.7b 3.9±0.9a 4.6±0.9b 5.0±0.6a 4.1±0.5b 3.8±0.7b 2.2±0.2b 3.0±0.1a Reheated 3.3±0.8c 3.8±0.9ab 4.1±0.7a 3.4±0.7c 4.1±0.6b 3.4±0.3c 4.1±1.0a 2.2±0.6b 2.7±0.2b

53
aMean (±standard deviation) values within a column followed by a different letter are significantly different at P < 0.05 (n =
162). Values were calculated on a wet weight basis (15% moisture). Small red bean (srb), cranberry bean (cb), great northern
bean (gnb), light red kidney bean (lrkb), black bean (bb), navy bean (nb), and pinto bean (pb).

54
stachyose (2.8–3.8 g/100 g) followed by raffinose (1.0–1.3 g/100 g) and verbascose (47–
128 mg/100 g) (Table 3.4). Raffinose and stachyose concentrations decreased
significantly (P < 0.05) after cooling and reheating in four of the six common bean
market classes. Cooked chickpea had higher levels of stachyose (1.8–2.3 g/100 g) than
raffinose (0.6–0.8 g/100 g) and verbascose (31–49 mg/100 g). A slight reduction was
observed in raffinose concentration after processing in kabuli, but the differences were
not significant. Stachyose concentration decreased and verbascose levels increased
significantly (P < 0.05) after cooling and reheating in both chickpea types (Table 3.4).
Total FOSs ranged from 57–143 mg/100 g for common bean and 26–43 mg/100 g
for chickpea market classes after cooking (Table 3.5). For common bean, kestose and
nystose concentrations ranged from 56–142 and 0.3–0.6 mg/100 g, respectively. Kestose
levels generally increased after cooling and reheating while nystose concentration
decreased (Table 3.5). In cooked chickpea, kestose and nystose concentrations ranged
from 24 to 41 and 1.0 to 2.2 mg/100 g, respectively. After cooling and reheating, a
significant increase (P < 0.05) in kestose was observed in desi chickpea and a significant
(P < 0.05) decrease in nystose was observed in kabuli chickpea (Table 3.5).
Mean RS concentration ranged from 2.6–3.9 and 3.6–5.3 g/100 g in common bean
and chickpea market classes after cooking, respectively (Figure 3.1a, b). RS
concentration generally increased after cooling and reheating for both pulse crops. Mean
amylose concentration ranged from 25–33 g/100 g for common bean and 24–30 g/100 g
for chickpea after cooking (Figure 3.1c, d). Cooling and reheating significantly (P <

55
Table 3. 5. Fructooligosaccharide (FOS) concentrations in common bean and chickpea market classes after cooking, cooling,
and reheating.
FOSs Common bean Chickpea
srba cb gnb lrkb bb nb pb desi kabuli Kestose
Cooked 66±18a 120±56a 62±11b 142±40a 94±10b 67±26a 56±16c 24±23b 41±16a Cooled 63±19a 119±67a 66±17b 86±14c 103±19ab 77±48a 77±30b 26±21b 50±26a Reheated 70±26a 150±81a 96±32a 111±80b 108±33a 73±35a 103±45a 44±12a 47±25a
Nystose
Cooked 0.3±0.3a 0.5±0.5a 0.3±0.2a 0.6±0.41a 0.6±0.2a 0.5±0.2a 0.6±0.1a 1.0±1.0a 2.2±1.7a Cooled 0.1±0.0b 0.2±0.2b 0.1±0.1a 0.1±0.1b 0.0±0.0b 0.0±0.0b 0.1±0.1b 0.2±0.6a 0.6±0.8b Reheated 0.1±0.1b 0.2±0.3b 0.2±0.3a 0.1±0.1b 0.1±0.2b 0.2±0.2b 0.1±0.1b 0.1±0.2a 0.4±0.4b Total FOSs Cooked 66±18a 120±56a 62±11b 143±40a 94±10b 68±26a 57±16c 26±23b 43±15a Cooled 63±19a 119±67a 67±17b 87±14c 103±19ab 77±48a 77±30b 26±20b 50±26a Reheated 70±26a 150±81a 96±32a 112±80b 108±33a 73±35a 103±45a 44±12a 48±25a
aMean (±standard deviation) values within a column followed by a different letter are significantly different at P < 0.05 (n =
162). Values were calculated on a wet weight basis (15% moisture). Small red bean (srb), cranberry bean (cb), great northern
bean (gnb), light red kidney bean (lrkb), black bean (bb), navy bean (nb), and pinto bean (pb).
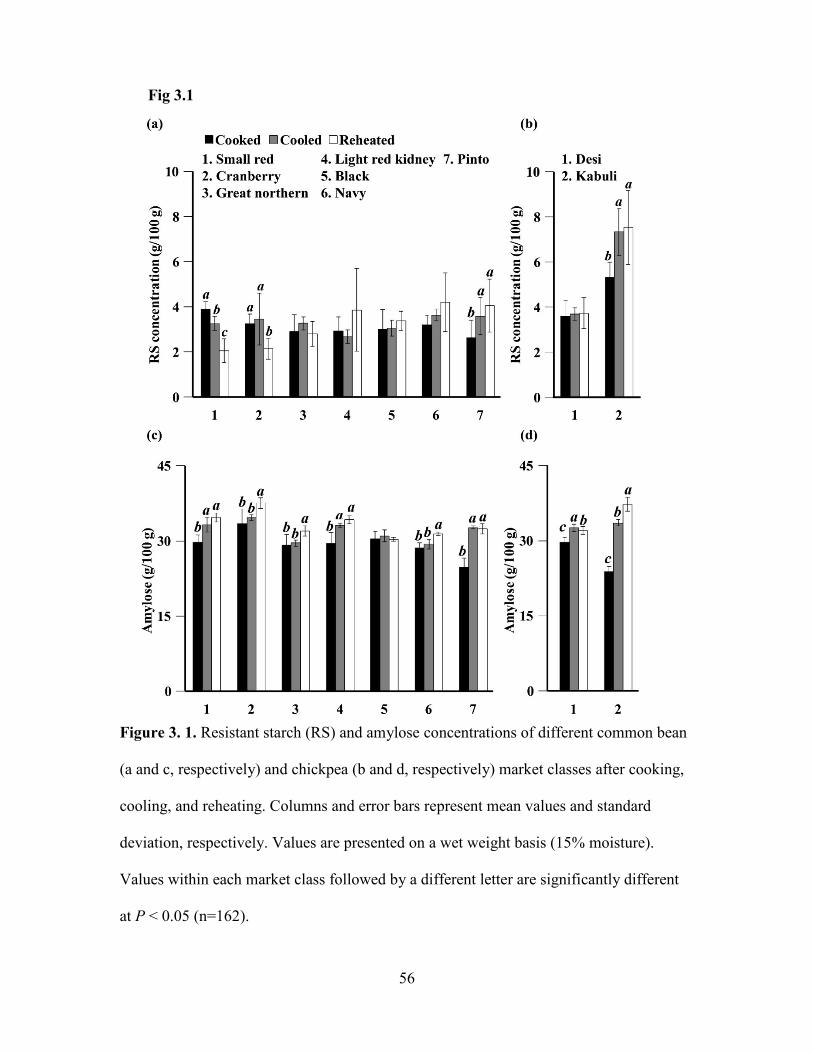
56
Figure 3. 1. Resistant starch (RS) and amylose concentrations of different common bean
(a and c, respectively) and chickpea (b and d, respectively) market classes after cooking,
cooling, and reheating. Columns and error bars represent mean values and standard
deviation, respectively. Values are presented on a wet weight basis (15% moisture).
Values within each market class followed by a different letter are significantly different
at P < 0.05 (n=162).
Fig 3.1
57
0.05) increased amylose concentration in all pulse market classes considered except black
bean (Figure 3.1c, d).
SEM images of pinto bean and kabuli chickpea show starch granules that are
oblong in shape. Granule size varied from approximately 17–20 µm in length and 13–17
µm in diameter for pinto bean (Figure 3.2a) and 17–25 µm in length and 8–17 µm in
diameter for kabuli chickpea (Figure 3.2d). Starch granules were relatively smaller and
packed in pinto bean compared to kabuli chickpea. Swelling was observed in both cooked
pulses but was more prominent in kabuli chickpea. Deformation of cell walls and starch
granules were observed after cooling (Figure 3.2b, e) and reheating (Figure 3.2c, f).
3.7. Discussion
Pulses are significant food sources of protein, minerals, vitamins, and prebiotic
carbohydrates. At the global scale, common bean and chickpea provide approximately 7–
13% of total daily protein, 1–3% of carbohydrates, and 1–2% of total energy
requirements per day (FAO, 2019). Present study shows that a 100-g serving of cooked
common bean or chickpea provides 6.8–9.7 g of prebiotic carbohydrates, i.e., 34–49% of
the safe recommended intake, with the range covering the nine markets classes
considered here. After cooling and reheating, total prebiotic carbohydrates declined by 3–
8% in common bean but increased by 5–9% in chickpea; this shows that manipulating
cooking practices can change prebiotic carbohydrate levels in pulses.
Total SA concentrations in processed pulses are a consequence of cell degradation
and thermal decomposition; the former increases while the latter decreases the SA
concentration. Cooking degrades the primary and secondary cell wall structures (Shomer

58
Figure 3. 2. SEM images of starch granules of (a) cooked, (b) cooled, and (c) reheated
pinto bean cotyledon and (d) cooked, (e) cooled, and (f) reheated kabuli chickpea
cotyledon. Scale bar for all images is 100 µm.
Fig 3.2

59
et al., 1990). As a result, cell wall compounds including SAs leach out into the cooking
medium, increasing its concentration as observed in common bean.
In contrast, the SA levels in chickpea significantly declined after reheating, which
is attributed to the higher rate of thermal degradation. Cooking at a temperature >100 °C
changes the chemical structure of SAs at different moisture levels (Matsumoto et al.,
2015; Matsumura, 2016). Therefore, the use of cooking temperatures below 100 °C and
an intermediate moisture content medium may increase SA concentrations in pulses.
Studies conducted in pulses including the present study show that thermal
treatments reduce RFO concentrations (Barampama and Simard, 1994; Bouhnik et al.,
2007; Campos-Vega et al., 2018; El-Adawy, 2002). Further, reduction in RFOs is more
prominent in steam-cooked pulses than pulses cooked by extrusion with low moisture
(Kelkar et al., 2012). Increasing the seed:water ratio to more than 1:3 causes greater RFO
reduction (Kelkar et al., 2012; Queiroz et al., 2002). During cooking, protons from water
molecules act as a catalyst and cleave the glycosidic bonds in RFOs, leaving
monosaccharides (galactose, fructose, and glucose) and a disaccharide (sucrose) as by-
products (Forgo et al., 2013). Therefore, application of low cooking temperatures and low
moisture levels may minimize RFO degradation and be used as a strategy to obtain RFO-
rich pulse products.
Similar to RFOs, cooking at high temperatures decreases FOS concentrations
(Courtin et al., 2009; L’homme et al., 2002). Glycosidic bonds in FOS molecules are
cleaved via the proton-assisted mechanism, which is catalyzed by high moisture and
acidic conditions (Courtin et al., 2009; L’homme et al., 2002). In the present study, FOS

60
levels increased after reheating in all cases except light red kidney bean. Tissue damage
caused by re-heating may have released more cell-bound FOSs due to thermal
degradation of cell tissues (Han and Baik, 2006).
Thermal treatments, i.e., cooking, cooling, and repeated heating-cooling cycles,
increase the RS concentration in cereals, tubers, and pulses by 10–400% (Johnson et al.,
2015; Mishra et al., 2008; Siva et al., 2018; Vasanthan and Bhatty, 1998; Yadav et al.,
2009). Similarly, results of this study indicate RS levels increased by 12–54% in most
common bean types and 4–42% in chickpea after cooling and reheating. At low
temperatures, starch molecules (amylose and amylopectin) re-align to create more
crystalline regions and, therefore, increase the RS concentration (Li et al., 2017; Perdon
et al., 1999). With repeated heating and cooling, the crystalline regions and therefore RS
levels are increased (Vasanthan and Bhatty, 1998). Similar to RS, amylose concentrations
noted here increased after cooling and reheating, and have been shown to be positive
correlated with RS (Yadav et al., 2009). Thermal energy during reheating breaks long
chain amylopectin into short linear chain amylose molecules (Liu et al., 2010).
SEM images show that cooking, cooling, and reheating change the internal
structure of the cell wall and starch granules (Figure 3.2). When cooking in excess water,
starch granules undergo an irreversible phase transition known as gelatinization, where
water uptake, granular swelling, loss of double helical structure, and leaching of starch
molecules can occur (Wang and Copeland, 2013). Water uptake was higher in kabuli
chickpea, where more granular swelling can be seen than in pinto bean (Table 3.1;
Figure 3.2a, d). Deformation of starch granules during cooking and cooling shows that

61
amylose leaches out, generating new amylose-amylose bonds and forming RS. As noted
in previous studies (Moza et al., 2012; Palav and Seetharaman, 2006; Xie et al., 2013),
microwave reheating completely destroys the cell and starch granule structure (Figure
3.2c, f) by breaking longer starch molecules. It facilitates the re-arrangement of starch
molecules to increase the crystalline regions, which leads to increasing RS levels in
common bean and chickpea after reheating (Figure 3.1). Present study did not provide
details of cooking-induced changes in cellulose, hemicellulose, and pectin, which are also
significant components of pulse carbohydrate profiles (Guillon and Champ, 2002).
Therefore, further studies will be required to determine complete prebiotic carbohydrate
profile changes during thermal processing before and after soaking (Fabbri and Crosby,
2016). Overall, application of a suitable temperature and seed:water ratio can increase the
final prebiotic carbohydrate concentration in pulses.
3.8. Conclusion
Understanding how prebiotic carbohydrate concentrations change in different
common bean and chickpea market classes during processing will help to improve the
nutritional quality of pulse-based food products. This study shows that thermal treatment
increases SAs and FOSs and decreases RFOs in common bean market classes. For
chickpea, processing reduces SAs and RFOs and increases FOSs. Further, cooling and
reheating increases RS and amylose in both pulse crops. As such, selecting appropriate
pulse market classes and manipulating processing conditions can be exploited to develop
prebiotic carbohydrate-rich foods.

62
3.9. Acknowledgments
The American Pulse Association provided funding support for this project.
3.10. References
AACC International. (2010). Approved Methods of the American Association of Cereal
Chemists (11th ed.). AACC International, St. Paul, MN, USA.
Alajaji, S. A., & El-Adawy, T. A. (2006). Nutritional composition of chickpea (Cicer
arietinum L.) as affected by microwave cooking and other traditional cooking
methods. Journal of Food Composition and Analysis, 19(8), 806–812.
https://doi.org/10.1016/J.JFCA.2006.03.015
Barampama, Z., and Simard, R. E. (1994). Oligosaccharides, Antinutritional Factors, and
Protein Digestibility of Dry Beans as Affected by Processing. J. Food Sci. 59, 833–
838. doi:10.1111/j.1365-2621.1994.tb08139.x.
Biesiekierski, J. R., Rosella, O., Rose, R., Liels, K., Barrett, J. S., Shepherd, S. J., et al.
(2011). Quantification of fructans, galacto-oligosacharides and other short-chain
carbohydrates in processed grains and cereals. J. Hum. Nutr. Diet. 24, 154–176.
doi:10.1111/j.1365-277X.2010.01139.x.
Bouhnik, Y., Achour, L., Paineau, D., Riottot, M., Attar, A., and Bornet, F. (2007). Four-
week short chain fructo-oligosaccharides ingestion leads to increasing fecal
bifidobacteria and cholesterol excretion in healthy elderly volunteers. Nutr. J. 6, 42.
doi:10.1186/1475-2891-6-42.
Campos-Vega, R., Bassinello, P. Z., Santiago, R. de A. C., and Oomah, B. D. (2018). Dry
Beans: Processing and Nutritional Effects. Ther. Probiotic, Unconv. Foods, 367–

63
386. doi:10.1016/B978-0-12-814625-5.00019-4.
Chung, H.-J., Liu, Q., Hoover, R., Warkentin, T. D., and Vandenberg, B. (2008). In vitro
starch digestibility, expected glycemic index, and thermal and pasting properties of
flours from pea, lentil and chickpea cultivars. Food Chem. 111, 316–321.
doi:10.1016/j.foodchem.2008.03.062.
Courtin, C. M., Swennen, K., Verjans, P., and Delcour, J. A. (2009). Heat and pH
stability of prebiotic arabinoxylooligosaccharides, xylooligosaccharides and
fructooligosaccharides. Food Chem. 112, 831–837.
doi:10.1016/j.foodchem.2008.06.039.
de Almeida Costa, G. E., da Silva Queiroz-Monici, K., Pissini Machado Reis, S. M., and
de Oliveira, A. C. (2006). Chemical composition, dietary fibre and resistant starch
contents of raw and cooked pea, common bean, chickpea and lentil legumes. Food
Chem. 94, 327–330. doi:10.1016/j.foodchem.2004.11.020.
Douglas, L., and Sanders, M. (2008). Probiotics and prebiotics in dietetics practice. J.
Am. Diet. Assoc. 108, 510–521. doi.org/10.1016/j.jada.2007.12.009
Du, S., Jiang, H., Ai, Y., Jane, J. (2014). Physicochemical properties and digestibility of
common bean (Phaseolus vulgaris L.) starches. Carbohydr. Polym. 108, 200–205.
doi.org/10.1016/j.carbpol.2014.03.004
Du, S., Jiang, H., Yu, X., and Jane, J. (2014). Physicochemical and functional properties
of whole legume flour. LWT - Food Sci. Technol. 55, 308–313.
doi:10.1016/J.LWT.2013.06.001.
El-Adawy, T. A. (2002). Nutritional composition and antinutritional factors of chickpeas

64
(Cicer arietinum L.) undergoing different cooking methods and germination. Plant
Foods Hum. Nutr. 57, 83–97. doi:10.1023/A:1013189620528.
Fabbri, A. D. T., and Crosby, G. A. (2016). A review of the impact of preparation and
cooking on the nutritional quality of vegetables and legumes. Int. J. Gastron. Food
Sci. 3, 2–11. doi:10.1016/J.IJGFS.2015.11.001.
FAO. (2019). Global trends in production and consumption of carbohydrate foods.
Available at : http://www.fao.org/3/W8079E/w8079e0g.htm#TopOfPage [Accessed
April 12, 2018]
Feinberg, M., San-Redon, J., and Assié, A. (2009). Determination of complex
polysaccharides by HPAE-PAD in foods: Validation using accuracy profile. J.
Chromatogr. B 877, 2388–2395. doi:10.1016/j.jchromb.2008.10.004.
Forgo, P., Kiss, A., Korózs, M., and Rapi, S. (2013). Thermal degradation and
consequent fragmentation of widely applied oligosaccharides. Microchem. J. 107,
37–46. doi:10.1016/J.MICROC.2012.06.017.
Gangola, M. P., Jaiswal, S., Kannan, U., Gaur, P. M., Båga, M., and Chibbar, R. N.
(2016). Galactinol synthase enzyme activity influences raffinose family
oligosaccharides (RFO) accumulation in developing chickpea (Cicer arietinum L.)
seeds. Phytochemistry 125, 88–98. doi:10.1016/J.PHYTOCHEM.2016.02.009.
Gibson, G. R., Hutkins, R., Sanders, M. E., Prescott, S. L., Reimer, R. A., Salminen, S. J.,
et al. (2017). Expert consensus document: The International Scientific Association
for Probiotics and Prebiotics (ISAPP) consensus statement on the definition and
scope of prebiotics. Nat. Rev. Gastroenterol. Hepatol. 14, 491.

65
doi:10.1038/nrgastro.2017.75.
Gibson, T. S., Solah, V. A., and McCleary, B. V. (1997). A Procedure to Measure
Amylose in Cereal Starches and Flours with Concanavalin A. J. Cereal Sci. 25,
111–119. doi:10.1006/JCRS.1996.0086.
Gil, J., Nadal, S., Luna, D., Moreno, M. T., and Haro, A. De (1996). Variability of Some
Physico-chemical Characters in Desi and Kabuli Chickpea Types. J. Sci. Food
Agric. 71, 179–184. doi:10.1002/(SICI)1097-0010(199606)71:2<179::AID-
JSFA566>3.0.CO;2-7.
Guillon, F., and Champ, M. M.-J. (2002). Carbohydrate fractions of legumes: uses in
human nutrition and potential for health. Br. J. Nutr. 88, 293.
doi:10.1079/BJN2002720.
Hall, C., Hillen, C., and Garden Robinson, J. (2017). Composition, Nutritional Value, and
Health Benefits of Pulses. Cereal Chem. J. 94, 11–31. doi:10.1094/CCHEM-03-16-
0069-FI.
Han, I. H., and Baik, B.-K. (2006). Oligosaccharide Content and Composition of
Legumes and Their Reduction by Soaking, Cooking, Ultrasound, and High
Hydrostatic Pressure. Cereal Chem. J. 83, 428–433. doi:10.1094/CC-83-0428.
Hossain, S., Ford, R., McNeil, D., Pittock, C., Panozzo, J. F. (2010). Inheritance of Seed
Size in Chickpea (Cicer arietinum L.) and Identification of QTL Based on 100-seed
Weight and Seed Size Index. AJCS. 4, 126–135.
Johnson, C. R., Thavarajah, D., Combs, G. F., and Thavarajah, P. (2013). Lentil (Lens
culinaris L.): A prebiotic-rich whole food legume. Food Res. Int. 51, 107–113.

66
doi:10.1016/j.foodres.2012.11.025.
Johnson, C. R., Thavarajah, D., Thavarajah, P., Payne, S., Moore, J., and Ohm, J.-B.
(2015). Processing, cooking, and cooling affect prebiotic concentrations in lentil
(Lens culinaris Medikus). J. Food Compos. Anal. 38, 106–111.
doi:10.1016/j.jfca.2014.10.008.
Joshi, D., Roy, S., and Banerjee, S. (2018). “Prebiotics: A Functional Food in Health and
Disease,” in Natural Products and Drug Discovery (Elsevier), 507–523.
doi:10.1016/B978-0-08-102081-4.00019-8.
Kaur, M., Singh, N., and Sodhi, N. S. (2005). Physicochemical, cooking, textural and
roasting characteristics of chickpea (Cicer arietinum L.) cultivars. J. Food Eng. 69,
511–517. doi:10.1016/J.JFOODENG.2004.09.002.
Kelkar, S., Siddiq, M., Harte, J. B., Dolan, K. D., Nyombaire, G., and Suniaga, H. (2012).
Use of low-temperature extrusion for reducing phytohemagglutinin activity (PHA)
and oligosaccharides in beans (Phaseolus vulgaris L.) cv. Navy and Pinto. Food
Chem. 133, 1636–1639. doi:10.1016/J.FOODCHEM.2012.02.044.
Kumar, M. M., Prasad, K., Sarat Chandra, T., and Debnath, S. (2018). Evaluation of
physical properties and hydration kinetics of red lentil (Lens culinaris) at different
processed levels and soaking temperatures. J. Saudi Soc. Agric. Sci. 17, 330–338.
doi:10.1016/J.JSSAS.2016.07.004.
L’homme, C., Arbelot, M., Puigserver, A., and Biagini, A. (2002). Kinetics of Hydrolysis
of Fructooligosaccharides in Mineral-Buffered Aqueous Solutions: Influence of pH
and Temperature. J. Agric. Food Chem. 51, 224–228. doi:10.1021/JF0204699.

67
Li, H., Wen, Y., Wang, J., and Sun, B. (2017). The molecular structures of leached starch
during rice cooking are controlled by thermodynamic effects, rather than kinetic
effects. Food Hydrocoll. 73, 295–299. doi:10.1016/J.FOODHYD.2017.07.015.
Liu, X., Yu, L., Xie, F., Li, M., Chen, L., and Li, X. (2010). Kinetics and mechanism of
thermal decomposition of cornstarches with different amylose/amylopectin ratios.
Starch - Stärke 62, 139–146. doi:10.1002/star.200900202.
Matsumoto, R., Aki, T., and Nakashimada, Y. (2015). Determination of Mannitol
Decomposition Rate under Hydrothermal Pretreatment Condition. J. Japan Pet. Inst.
58, 252–255.
Matsumura, Y. (2016). Kinetics of Sorbitol Decomposition under Hydrothermal
Condition. J. Japan 59, 241–241.
McCleary, B. V., and Monaghan, D. A. (2002). Measurement of Resistant Starch. J.
AOAC Int. 85, 665–675.
Miao, M., Zhang, T., and Jiang, B. (2009). Characterisations of kabuli and desi chickpea
starches cultivated in China. Food Chem. 113, 1025–1032.
doi:10.1016/J.FOODCHEM.2008.08.056.
Mishra, S., Monro, J., and Hedderley, D. (2008). Effect of Processing on Slowly
Digestible Starch and Resistant Starch in Potato. Starch - Stärke 60, 500–507.
doi:10.1002/star.200800209.
Moza, M.I., Mironescu, M. and Florea, A. (2012). Influence of physical treatments on the
potato starch granules micro-and ultrastructure. Bull Univ Agric Sci Vet Med. 69,
304–311.
68
Muir, J. G., Rose, R., Rosella, O., Liels, K., Barrett, J. S., Shepherd, S. J., et al. (2009).
Measurement of Short-Chain Carbohydrates in Common Australian Vegetables and
Fruits by High-Performance Liquid Chromatography (HPLC). J. Agric. Food Chem.
57, 554–565. doi:10.1021/jf802700e.
Palav, T., and Seetharaman, K. (2006). Mechanism of starch gelatinization and polymer
leaching during microwave heating. Carbohydr. Polym. 65, 364–370.
doi:10.1016/J.CARBPOL.2006.01.024.
Perdon, A. A., Siebenmorgen, T. J., Buescher, R. W., and Gbur, E. E. (1999). Starch
Retrogradation and Texture of Cooked Milled Rice During Storage. J. Food Sci. 64,
828–832. doi:10.1111/j.1365-2621.1999.tb15921.x.
Queiroz, K. D. S., Oliveira, A. C. D, Helbig, E., Reis, S. M. P. M., and Carraro., F.
(2002). Soaking the common bean in a domestic preparation reduced the contents of
raffinose-type oligosaccharides but did not interfere with nutritive value. J. Nutr.
Sci. Vitaminol. 48, 283–289.
Reddy, N. R., Pierson, M. D., Sathe, S. K., and Salunkhe, D. K. (1984). Chemical,
nutritional and physiological aspects of dry bean carbohydrates—A review. Food
Chem. 13, 25–68. doi:10.1016/0308-8146(84)90026-8.
Roberfroid, M., Gibson, G. R., Hoyles, L., McCartney, A. L., Rastall, R., Rowland, I., et
al. (2010). Prebiotic effects: metabolic and health benefits. Br. J. Nutr. 104, S1–S63.
doi:10.1017/S0007114510003363.
Sajilata, M. G., Singhal, R. S., and Kulkarni, P. R. (2006). Resistant Starch?A Review.
Compr. Rev. Food Sci. Food Saf. 5, 1–17. doi:10.1111/j.1541-4337.2006.tb00076.x.

69
SAS Institute Inc. (2017). User’s guide: Statistics SAS Institute, Version 9.4. Cary, NC.
Shafaei, S. M., Masoumi, A. A., and Roshan, H. (2016). Analysis of water absorption of
bean and chickpea during soaking using Peleg model. J. Saudi Soc. Agric. Sci. 15,
135–144. doi:10.1016/J.JSSAS.2014.08.003.
Shimelis, E. A., and Rakshit, S. K. (2005). Proximate composition and physico-chemical
properties of improved dry bean (Phaseolus vulgaris L.) varieties grown in Ethiopia.
LWT - Food Sci. Technol. 38, 331–338. doi:10.1016/J.LWT.2004.07.002.
Shomer, I., Paster, N., Lindner, P., and Vasiliver, R. (1990). The role of cell wall
structure in the hard-to-cook phenomenon in beans (Phaseolus vulgaris L.). Food
Struct. 9, 10.
Siva, N., Thavarajah, P., and Thavarajah, D. (2018). The impact of processing and
cooking on prebiotic carbohydrates in lentil. J. Food Compos. Anal. 70, 72–77.
doi:10.1016/j.jfca.2018.04.006.
Turhan, M., Sayar, S., and Gunasekaran, S. (2002). Application of Peleg model to study
water absorption in chickpea during soaking. J. Food Eng. 53, 153–159.
doi:10.1016/S0260-8774(01)00152-2.
Varatharajan, V., Hoover, R., Li, J., Vasanthan, T., Nantanga, K. K. M., Seetharaman, K.,
et al. (2011). Impact of structural changes due to heat-moisture treatment at different
temperatures on the susceptibility of normal and waxy potato starches towards
hydrolysis by porcine pancreatic alpha amylase. Food Res. Int. 44, 2594–2606.
doi:10.1016/J.FOODRES.2011.04.050.
Vasanthan, T., and Bhatty, R. S. (1998). Enhancement of Resistant Starch (RS3) in

70
Amylomaize, Barley, Field Pea and Lentil Starches. Starch 50, 286–291.
doi:10.1002/(SICI)1521-379X(199807)50:7<286::AID-STAR286>3.0.CO;2-O.
Wang, N., Daun, J. K., and Malcolmson, L. J. (2003). Relationship between
physicochemical and cooking properties, and effects of cooking on antinutrients, of
yellow field peas (Pisum sativum). J. Sci. Food Agric. 83, 1228–1237.
doi:10.1002/jsfa.1531.
Wang, N., Hatcher, D. W., Tyler, R. T., Toews, R., and Gawalko, E. J. (2010). Effect of
cooking on the composition of beans (Phaseolus vulgaris L.) and chickpeas (Cicer
arietinum L.). Food Res. Int. 43, 589–594. doi:10.1016/J.FOODRES.2009.07.012.
Wang, S., and Copeland, L. (2013). Molecular disassembly of starch granules during
gelatinization and its effect on starch digestibility: a review. Food Funct. 4, 1564.
doi:10.1039/c3fo60258c.
White, J. W., and González, A. (1990). Characterization of the negative association
between seed yield and seed size among genotypes of common bean. F. Crop. Res.
23, 159–175. doi:10.1016/0378-4290(90)90052-D.
Xie, Y., Yan, M., Yuan, S., Sun, S., and Huo, Q. (2013). Effect of microwave treatment
on the physicochemical properties of potato starch granules. Chem. Cent. J. 7, 113.
doi:10.1186/1752-153X-7-113.
Yadav, B. S., Sharma, A., and Yadav, R. B. (2009). Studies on effect of multiple
heating/cooling cycles on the resistant starch formation in cereals, legumes and
tubers. Int. J. Food Sci. Nutr. 60, 258–272. doi:10.1080/09637480902970975.

71
4. CHAPTER THREE
RETORT PROCESSING TEMPERATURE CHANGE PREBIOTIC
CARBOHYDRATES CONCENTRATION IN PULSES
4.1. Hypotheses
H0: Cooking temperature does not affect SA, RFO, FOS, RS, and amylose
concentration in lentils, common bean, and chickpea market classes.
H1: Cooking temperature affect SA, RFO, FOS, RS, and amylose concentration in
lentils, common bean, and chickpea market classes.
4.2. Objective
Determine changes of SA, RFO, FOS, RS, and amylose concentration in two
lentil market classes (red and green), seven common bean market classes (small red,
cranberry, great northern, light red kidney, black, navy, and pinto), and two chickpea
market classes (desi and kabuli) in response to four cooking temperature ranging from 90
to 120 ºC.
4.3. Abstract
Thermal processing alters prebiotic carbohydrates concentration, yet no prior data
on the impact of processing temperature in prebiotic carbohydrates in different pulse
market classes. This study determined the changes in prebiotic carbohydrates [sugar
alcohols (SA), raffinose family oligosaccharides (RFO), fructooligosaccharides (FOS),
resistant starch (RS), and amylose] concentration in two lentil, seven common bean, and
two chickpea market classes subjected to four cooking temperature ranging from 90 to

72
120 ºC. Seed sample of 8 g with 24 g of distilled and deionized water was sealed in a
retort pouch and retorted at 90, 100, 110, and 120 ºC for 30 minutes. Samples were then
analyzed for prebiotic carbohydrates using high-performance anion exchange
chromatography and enzymatic assays. In lentil, SA, RFO, FOS, and amylose
concentration were increased from 949 to 1181 mg/100 g, 4.7 to 6.6 g/100 g, 58 to 137
mg/100 g, and 29 to 40 g/100 g respectively with increasing processing temperature from
90 ºC to 120 ºC. In chickpea, the increase was from 1.7 to 2.4 g/100 g, 4.0 to 4.9 g/100 g,
41 to 98 mg/100 g, and 28 to 37 g/100 g. In common bean, the increase was from 18 to
26 mg/100 g, 3.3 to 6.1 g/100 g, 45 to 105 mg/100 g, and 23 to 43 g/100 g respectively.
RS concentration was reduced from 1.5 to 0.5 g/100 g in lentil, 0.9 to 0.4 g/100 g in
common bean, and 0.7 to 0.3 g/100 g in chickpea. Overall, total prebiotic carbohydrates
concentration was increased from 7.2 to 8.4 g/100 in lentil, 4.1 to 6.7 g/100 g in common
bean, and 6.5 to 7.7 g/100 g in chickpea with increasing processing temperature. This
study shows that increasing processing temperature up to 120 ºC increase prebiotic
carbohydrate concentration and can be incorporated into shelf-stable foods.
Key words: prebiotic carbohydrates, thermal processing, shelf-stable food, pulses 4.4. Introduction
Pulses including lentil, common bean, and chickpea are becoming more popular
among consumers worldwide due its nutritional quality and related health benefits (Hall
et al., 2017). Pulses are rich source of protein which provide 22–28 g of protein per 100 g
of serving (USDA, 2019). Further, pulses provide 2–3 g of micronutrients and 3–17 g of
low digestible carbohydrates (Biesiekierski et al., 2011; Gangola et al., 2016; Johnson et

73
al., 2013; Reddy et al., 1984). USA is the 7th highest pulse producer with 2.2 million
tonnes of annual production (FAO, 2019). Among the total production, 60% is used for
food purposes (FAO, 2019), providing 4.2 kg of annual per capita consumption in USA
which is 41% less than the global pulse consumption (7.2 kg/capita/year) (FAO, 2019).
Development of novel food products incorporating pulses increase pulse consumption
among USA consumers and help to gain related health benefits including reduction of
obesity risk.
Thermally processed shelf-stable foods, i.e. canned beans, are associated with
lower risk of obesity (Luhovyy et al., 2015). Canned pulse consumption increased satiety
and improve glycemic responses compared with those who consumed white bread (Wong
et al., 2009). Regular consumption of canned pulses for 8 weeks reduced waist
circumference (Mollard et al., 2012). Further, minimum of 3-week pulse consumption
reduced low density lipoprotein and total blood cholesterol (Bazzano et al., 2011). These
health benefits mainly come from low digestible carbohydrates which are often reduced
by extensive thermal process (Khattab and Arntfield, 2009). Therefore, careful
manipulation of processing conditions (temperature, moisture, and pressure) during pulse
processing will help to retain those compounds and associated health benefits.
The impact of thermal processing including boiling, extrusion, and
canning/sterilization on pulse prebiotic carbohydrates are previously reported (Berrios et
al., 2010; Kelkar et al., 2012; Morales et al., 2015; Słupski and Gębczyński, 2014).
Cooking pulses at 100ºC significantly reduces RFO and FOS due to thermal degradation
(Courtin et al., 2009; L’homme et al., 2002). The effect of high-temperature extrusion of

74
pulses had inconsistent results (Berrios et al., 2010; Morales et al., 2015). Extrusion lentil
at 159–161 ºC shows that raffinose level was significantly increased, verbascose was
significantly decreased, and stachyose had no difference than raw lentil (Morales et al.,
2015). Similar extrusion condition in another study shows that extrusion decrease
raffinose and stachyose in lentil whereas increase in chickpea (Berrios et al., 2010).
Further, low temperature extrusion (85 ºC) and steam cooking (82 ºC) reduced RFO in
beans than its raw counterpart (Kelkar et al., 2012). Canning beans at 118–122 ºC for 16
minutes reduced RFO by 65% (Słupski and Gębczyński, 2014). Considering RS,
cooking at 100 ºC did not change its concentration, but cooking with additional cooling at
4 ºC for 24 h in a refrigerator and microwaving for 1-minute increases RS by two-fold
than raw seeds (Johnson et al., 2015; Siva et al., 2018). Also, sterilization of faba bean,
kidney bean, and chickpea at 120 ºC for 15–20 minutes shows that RS levels were
significantly reduced than its raw counterpart (Güzel and Sayar, 2012), but had more RS
than ordinary boiled pulses (Güzel and Sayar, 2012).
Thermal sterilization or retort processing is a widely used technique to develop
shelf-stable food products including canned pulses (Boz and Erdoğdu, 2015). The
physical quality (color and texture) and the nutritional quality such as protein and
micronutrients content of those retorted pulses are previously studied (Margier et al.,
2018; Parmar et al., 2016). Retorted lentil, chickpea, and common bean had lower
protein, dietary fiber, and magnesium concentration than the household cooked pulses
(Margier et al., 2018). However, retorting also reduce anti-nutrients up to 38%, therefore,
increase the bioavailability of nutrients than the household boiled pulses (Margier et al.,

75
2018). Even though, there are several studies measured RFO and RS concentration in
retorted pulses, none evaluated the effect of retort temperature on prebiotic carbohydrate
concentration in a sterilization process. Knowledge regarding this helps to develop
thermally processed shelf-stable pulse food products such as canned foods with higher
prebiotic carbohydrates. The objective of this study was to determine changes of SA,
RFO, FOS, RS, and amylose concentration in two market classes of lentils (red and
green), seven common bean market classes (small red, cranberry, great northern, light red
kidney, black, navy, and pinto) and two chickpea market classes (desi and kabuli) in
response to four cooking temperature ranging from 90 to 120 ºC.
4.5. Materials and Methods
Materials
Chemicals were purchased from VWR International (Suwanee, GA, USA), Sigma-
Aldrich (St. Louis, MO, USA), and Fisher Scientific (Asheville, NC, USA). Solvents and
dilution series were prepared using distilled and deionized (ddH2O) water resistance of ≥
18.2 MΩ (NANO-pure Diamond, Barnstead, IA, USA).
Seed samples
Approximately 2 kg of commercially available lentil seeds belong to two market
classes (red and green) and three processing forms (whole seed, dehulled seed, and
dehulled-split seed) were obtained from the Northern Pulse Growers Association
(Bismarck, ND, USA). Seven common bean market classes (small red, cranberry, great
northern, light red kidney, black, navy, and pinto) and two chickpea market classes (desi
and kabuli) were purchased from a commercial distributor (AGT Foods, Bismarck, ND,

76
USA). Samples were homogenized by hand, subsampled, and stored at room temperature
(20–25 °C) until further analyses. The treatment design was a completely randomized
design with five lentil types, seven common bean types, and two chickpea types (n=16),
four cooking temperature (90, 100, 110, and 120 °C) (n=4), and three replicates (n=3);
hence total of 192 samples.
Retort cooking
Approximately 8 g of sample and 24 g of ddH2O were measured in to 12x16 cm2
retort pouch. Then, the pouches were thermally sealed and cooked at 90, 100, 110, 120ºC
for 30 minutes to in a retort (model A-142-OS, Surdry S. L., Abadiano, Bizkaia, Spain).
Pouches were allowed to reach room temperature. Cooked seeds were homogenized and
analyzed for prebiotic carbohydrates.
Determination of Moisture content
Approximately 5 g of homogenized samples were oven dried at 105ºC until it
gives a constant weight (~3 hrs). Moisture content was calculated as per AACC
International, 2010. Data were reported on a wet weight basis (normalized to 15%
moisture).
Determination of SA, RFO, and FOS
A sample of 500 mg was measured and SA, RFO, and FOS were extracted as
explained by Muir et al., 2009. Concentrations of those compounds were measured using
high-performance anion exchange chromatography (HPAE) (Dionex, ICS-5000,
Sunnyvale, CA, USA) (Feinberg et al., 2009) connected to a CarboPac PA1 column (250
× 4 mm; Dionex, CA, USA) and a CarboPac PA1 guard column (50 × 4 mm; Dionex,

77
CA, USA) as described by Johnson et al., 2013. Peak areas of an external reference (CDC
Redberry lentil), SA (3–1000 ppm), RFO (3–1000 ppm), and FOS (3–1000 ppm) were
routinely analyzed for method consistency and detector sensitivity with an error of less
than 5%. The concentration of LMWCs in the samples was calculated according to
Johnson et al., 2013.
Determination of RS
α-amylase and amyloglucosidase enzymes essay was used to measure RS
concentration as per McCleary and Monaghan, 2002. The glucose concentration (CG)
resulting from enzymatic hydrolysis of resistant starch was measured using glucose
oxidase-peroxidase method (GOPOD) (Megazyme, 2018). RS concentration (CRS) was
calculated according to CRS = (CG × 0.9 × V) / m, where m is the moisture corrected
weight of sample, V is the final diluted volume, and 0.9 is a factor to convert free glucose
to anhydrous glucose as occurs in starch (McCleary and Monaghan, 2002). Regular corn
starch (RS concentration 1.0±0.1%, w/w) was used to check the accuracy of the data and
ensured an analytical error of less than 10%.
Determination of amylose concentration
An enzymatic assay with α-amylase enzyme (67 U/mL) and amyloglucosidase
(333 U/mL) was used to measure amylose concentration (Gibson et al., 1997). The
glucose concentration resulting from enzymatic hydrolysis of amylose and total starch
fractions was measured using GOPOD method (Megazyme, 2018). Absorbance was
measured at 510 nm in a spectrophotometer and amylose concentration was calculated as
follows:
78
Amylose (%)= Abs(Con A supernatant) Abs(Total starch aliquot)
× 6.159.2
×100,
Amylose (g/100 g)= Total starch concentration (g/100 g) − Amylose (%)
100 ,
where 6.15 and 9.2 are dilution factors.
Determination of total prebiotic carbohydreates
sum of SA, RFO, FOS, and RS was expressed as total prebiotic carbohydrates.
4.6. Results
In lentil, SA, RFO, FOS, and amylose were increased from 949–1181 mg/100 g,
4.7–6.6 g/100 g, 58–137 mg/100 g, and 29–40 g/100 g respectively with increasing
processing temperature from 90 ºC to 120 ºC (Table 4.1). In chickpea, the increase was
from 1.7–2.4 g/100 g, 4.0–4.9 g/100 g, 41–98 mg/100 g, and 28–37 g/100 g. In common
bean, the increase was from 18–26 mg/100 g, 3.3–6.1 g/100 g, 45–105 mg/100 g, and 23–
43 g/100 g respectively. RS concentration was significantly reduced (P ≤ 0.05) from 1.5
to 0.5 g/100 g in lentil, 0.9 to 0.4 g/100 g in common bean, and 0.7 to 0.3 g/100 g in
chickpea (Table 4.1). Overall, total prebiotic carbohydrates concentration was increased
from 7.2 to 8.4 g/100 in lentil, 4.1 to 6.7 g/100 g in common bean, and 6.5 to 7.7 g/100 g
in chickpea with increasing processing temperature (Table 4.1).
Sugar alcohols
Sorbitol and mannitol concentration increased from 0.8–1.1 to 1.0–1.3 g/100 g and
from 26–81 to 22–83 mg/100 g in all lentil market classes respectively (Table 4.2).
Sorbitol and mannitol concentration slightly reduced at 100 ºC and significantly increased
(P ≤ 0.05) at 120ºC than 90ºC (Table 4.2). In chickpea market classes, total SA
significantly increased from 1.6–1.8 g/100 g to 2.3–2.6 g/100 g with increasing

79
Table 4. 1. Carbohydrates concentration in pulses processed at different temperatures.
Treatment SA**,╪ RFO* FOS** RS* Amylose* TPC* Lentil
90 ºC 949±138b 4.7±0.5b 58±24bc 1.5±0.3a 29±3c 7.2±0.7b 100 ºC 851±90c 3.9±0.3c 48±35c 0.7±0.2b 35±3b 5.5±0.4b 110 ºC 1006±165b 5.0±1.0b 81±40b 0.7±0.1b 38±7ab 6.8±1.2b 120 ºC 1181±127a 6.6±1.5a 137±52a 0.5±0.1c 40±2b 8.4±1.6a
Common bean
90 ºC 18±5c 3.3±0.3c 45±60b 0.9±0.4a 23±4d 4.1±0.5c 100 ºC 17±9c 2.6±0.5d 20±15b 0.8±0.3ab 34±4c 3.4±0.4d 110 ºC 30±8a 4.2±0.5b 81±45a 0.7±0.1b 38±6b 5.0±0.5b 120 ºC 26±6b 6.1±1.9a 105±80a 0.4±0.2c 43±3a 6.7±1.7a
Chickpea
90 ºC 1719±137b 4.0±0.8a 41±22b 0.7±0.1a 28±6c 6.5±0.9ab 100 ºC 1539±447b 2.3±0.4b 36±20b 0.6±0.1b 31±3bc 4.4±0.8b 110 ºC 1763±201b 2.6±0.3b 43±10b 0.4±0.1c 32±1b 4.8±0.2b 120 ºC 2416±250a 4.9±2.0a 98±59a 0.3±0.0d 37±1a 7.7±2.1a
╪Mean (±standard deviation) values within a column followed by a different letter are significantly different at P < 0.05 (n = 168). *g/100 g (wet basis; 15% moisture). **mg/100 g (wet basis; 15% moisture). SA, sugar alcohols; RFO, raffinose family oligosaccharides; FOS, fructooligosaccharides; RS, resistant starch; TPC; total prebiotic carbohydrates (sum of SA, RFO, FOS, and RS).

80
Table 4. 2. Prebiotic carbohydrates concentration in lentil market classes processed at different temperatures.
Lentil Sorbitol*,╪ Mannitol** SA* Raf+Stach* Verbascose* RFO* Kestose** Nystose** FOS** Whole red
90 ºC 1.1±0.1ab 26±3bc 1.1±0.1ab 3.5±0.2ab 1.0±0.1 4.5±0.3ab 45±2b 0.87±0.53a 45±2b 100 ºC 0.9±0.1b 39±2a 0.9±0.1b 2.9±0.1b 1.0±0.0 3.9±0.1b 115±10ab 0.04±0.01c 115±10ab 110 ºC 1.1±0.2ab 32±2ab 1.1±0.2ab 3.6±1.2ab 1.0±0.3 4.6±1.4ab 70±32ab 0.24±0.20bc 70±32ab 120 ºC 1.3±0.1a 22±6c 1.3±0.1a 4.5±0.9a 1.4±0.5 5.9±1.3a 153±104a 0.74±0.11ab 153±104a
Dehulled red
90 ºC 0.8±0.0b 40±5b 0.8±0.0b 3.0±0.1b 1.6±0.1b 4.7±0.2b 77±6b 0.57±0.40 77±5b 100 ºC 0.7±0.0b 36±3b 0.7±0.0b 2.2±0.1b 1.2±0.0b 3.5±0.1b 25±4b 0.12±0.02 25±4b 110 ºC 0.8±0.2b 53±4a 0.9±0.2b 3.5±1.3ab 1.8±0.6b 5.3±1.9ab 90±75b 0.37±0.20 91±75b 120 ºC 1.1±0.1a 63±11a 1.2±0.1a 4.8±1.2a 3.0±1.0a 7.8±2.1a 184±41a 0.62±0.38 185±41a
Split red
90 ºC 0.8±0.1ab 69±5a 0.9±0.1ab 3.2±0.1ab 1.9±0.1ab 5.1±0.2ab 72±2b 0.87±0.23a 73±2b 100 ºC 0.8±0.0b 37±2b 0.8±0.0b 2.6±0.1b 1.5±0.1b 4.1±0.1b 27±1c 0.39±0.09ab 27±1c 110 ºC 0.8±0.1b 57±8a 0.9±0.1b 3.1±0.6ab 1.7±0.3b 4.7±0.9b 69±35b 0.17±0.06b 69±35b 120 ºC 1.0±0.2a 63±10a 1.1±0.2a 4.0±0.9a 2.5±0.7a 6.6±1.6a 120±14a 0.65±0.49ab 120±14a
Whole green
90 ºC 0.8±0.2b 71±18b 0.9±0.2b 2.7±0.6b 1.6±0.4ab 4.3±1.0ab 18±3b 0.40±0.03 19±3b 100 ºC 0.8±0.1b 45±5c 0.9±0.1b 2.3±0.1b 1.4±0.1b 3.7±0.2b 35±4b 0.63±0.14 35±4b 110 ºC 1.0±0.0ab 104±6a 1.1±0.0ab 3.2±0.0ab 1.9±0.0ab 5.1±0.1ab 95±47a 0.96±1.05 96±46a 120 ºC 1.1±0.1a 92±5a 1.2±0.1a 3.8±0.8a 2.5±0.8a 6.3±1.6a 116±11a 0.37±0.17 116±11a
Dehulled green
90 ºC 1.0±0.1b 81±5a 1.0±0.1b 3.1±0.3bc 1.8±0.1ab 4.9±0.5b 77±6b 0.29±0.42 77±6b 100 ºC 0.9±0.0b 47±2b 1.0±0.0b 2.7±0.1c 1.5±0.1b 4.2±0.2b 38±8c 0.64±0.14 39±7c 110 ºC 1.0±0.1ab 93±6a 1.1±0.1ab 3.5±0.3ab 1.8±0.2ab 5.4±0.5ab 80±24b 0.42±0.30 80±24b 120 ºC 1.2±0.1a 83±8a 1.2±0.1a 4.1±0.6a 2.4±0.7a 6.6±1.3a 111±1a 0.21±0.30 111±2a

81
╪Mean (±standard deviation) values within a column followed by a different letter are significantly different at P < 0.05 (n = 168). *g/100 g (wet basis; 15% moisture). **mg/100 g (wet basis; 15% moisture). SA, sugar alcohols (sum of sorbitol and mannitol); raf, raffinose; stach, stachyose; RFO, raffinose family oligosaccharides (sum of raffinose, stachyose, and verbascose); FOS, fructooligosaccharides (sum of kestose and nystose); RS, resistant starch; SS, soluble starch; TPC; total prebiotic carbohydrates (sum of SA, RFO, FOS, and RS).

82
processing temperature from 90 ºC to 120 ºC (Table 4.3). Overall, sorbitol and mannitol
concentration were increased from 1.5–1.8 g/100 g to 2.1–2.5 g/100 g and from 88–119
mg/100 g to 97–183 mg/100 g respectively. Sorbitol and mannitol concentration were
reduced at 100–110 ºC than 90 ºC and increased at 120 ºC (Table 4.3). In common bean,
total SA was significantly increased from 14–27 mg/100 g to 22–32 mg/100 g except
black bean where the concentration reduced from 20 to 17 mg/100 g (Table 4.4). Sorbitol
concentration was significantly reduced (P ≤ 0.05) at 100 ºC than 90 ºC and increased at
110–120 ºC. Mannitol concentration was significantly higher (P ≤ 0.05) at 100 ºC in
cranberry, great northern, and light red kidney bean (Table 4.4).
Raffinose, stachyose, verbascose and total RFO
Overall, RFO concentration in lentil was significantly increased (P ≤ 0.05) from
4.3–5.1 g/100 g to 5.9–7.8 g/100 g regardless of the market classes when increase the
processing temperature from 90 to 120 ºC (Table 4.1). Raffinose+stachyose, and
verbascose concentration tend to reduce (2.2–2.9 and 1.01.5 g/100 g respectively) at 100
ºC than 90 ºC (2.7–3.5 and 1.0–1.9 g/100 respectively). Lentil processed at 120 ºC
showed a significantly higher (P ≤ 0.05) raffinose+stachyose (3.8–4.8 g/100 g) and
verbascose concentration (2.4–3.0 g/100 g) (Table 4.2). In chickpea, total RFO was
significantly increased (P ≤ 0.05) in kabuli (from 3.3 g/100 g to 6.2 g/100 g) but reduced
in desi (from 4.8 g/100 g to 3.6 g/100 g) (Table 4.3). Raffinose+Stachyose levels were
increased from 2.4 to 3.2 g/100 g in desi and from 3.1 to 5.2 g/100 g in kabuli.
Verbascose concentration was decreased from 2325 to 392 mg/100 g in desi and was
increased from 199 to 957 mg/100 g in kabuli (Table 4.3). In common bean, RFO

83
Table 4. 3. Prebiotic carbohydrates concentration in chickpea market classes processed at different temperatures.
Chickpea Sorbitol*,╪ Mannitol** SA* Raf+Stach* Verbascose** RFO* Kestose** Nystose** FOS** Desi
90 ºC 1.8±0.0b 88±0b 1.8±0.0b 2.4±0.0ab 2325±63a 4.8±0.1a 60±2 0.88±0.09a 61±2 100 ºC 1.8±0.2b 153±12a 1.9±0.2b 2.3±0.3b 287±22bc 2.6±0.2bc 53±4 0.63±0.09ab 54±4 110 ºC 1.9±0.0b 77±12b 1.9±0.1b 2.3±0.0b 90±16c 2.3±0.0c 42±1 0.27±0.09b 42±1 120 ºC 2.5±0.2a 97±28b 2.6±0.2a 3.2±0.7a 392±274b 3.6±1.0ab 117±83 0.47±0.45ab 117±82
Kabuli
90 ºC 1.5±0.0b 119±9bc 1.6±0.0b 3.1±0.0b 199±11b 3.3±0.0b 21±3b 0.49±0.02 21±3b 100 ºC 1.0±0.1c 152±6ab 1.2±0.1c 1.8±0.0b 114±11b 1.9±0.0b 18±1b 0.56±0.09 18±1b 110 ºC 1.5±0.0b 117±12c 1.6±0.0b 2.7±0.1b 165±48b 2.9±0.2b 42±16b 0.43±0.26 43±15b 120 ºC 2.1±0.2a 183±28a 2.3±0.2a 5.2±0.1a 957±664a 6.2±2.1a 78±31a 0.68±0.79 79±30a
╪Mean (±standard deviation) values within a column followed by a different letter are significantly different at P < 0.05 (n = 168). *g/100 g (wet basis; 15% moisture). **mg/100 g (wet basis; 15% moisture). SA, sugar alcohols (sum of sorbitol and mannitol); raf, raffinose; stach, stachyose; RFO, raffinose family oligosaccharides (sum of raffinose, stachyose, and verbascose); FOS, fructooligosaccharides (sum of kestose and nystose); RS, resistant starch; SS, soluble starch; TPC; total prebiotic carbohydrates (sum of SA, RFO, FOS, and RS).

84
Table 4. 4. Prebiotic carbohydrates concentration in common bean market classes processed at different temperatures.
Common bean Sorbitol** Mannitol** SA** Raf+Stach* Verbascose** RFO* Kestose** Nystose** FOS** Black bean
90 ºC 17±2a 2±0b 20±2b 3.1±0.3bc 192±21b 3.3±0.3bc 183±18a 0.08±0.03b 183±18a 100 ºC 7±1c 2±1b 10±1d 2.1±0.1c 117±11b 2.2±0.1c 14±2c 1.18±0.11a 15±2c 110 ºC 16±1a 7±1a 23±1a 3.8±0.1b 245±35ab 4.1±0.1b 75±20b 0.15±0.19b 75±20b 120 ºC 11±0b 6±1a 17±1c 5.2±1.2a 706±472a 5.9±1.7a 128±55b 0.30±0.22b 128±55b
Cranberry bean
90 ºC 18±1c 2±1c 20±1b 2.4±0.1c 231±9b 2.7±0.1c 14±1b 0.15±0.06b 14±1b 100 ºC 11±1d 17±1a 29±0a 3.0±0.1c 241±30b 3.2±0.1bc 28±4ab 0.57±0.21a 28±4ab 110 ºC 29±1a 4±0b 32±1a 4.0±0.4b 361±71ab 4.3±0.5b 74±26a 0.55±0.01a 75±26a 120 ºC 25±3b 4±1b 29±3a 5.1±0.9a 757±428a 5.8±1.3a 72±52a 0.68±0.28a 73±52a
Great northern bean
90 ºC 12±1b 1±0c 14±1b 3.2±0.0bc 234±9b 3.4±0.0b 30±20b 0.12±0.00 30±20b 100 ºC 7±1c 8±0a 15±1b 2.6±0.1c 192±8b 2.8±0.1b 11±2b 0.09±0.03 11±2b 110 ºC 22±3a 6±1b 27±4a 4.4±0.7b 321±114b 4.7±0.8b 131±92ab 0.13±0.10 131±92ab 120 ºC 19±0a 6±1ab 26±1a 6.9±1.6a 1004±688a 7.9±2.3a 173±112a 0.36±0.26 174±113a
Light red kidney bean
90 ºC 26±3b 2±3b 27±1b 3.3±0.1a 241±5 3.6±0.1ab 9±2c 0.29±0.04 9±2c 100 ºC 6±1c 25±3a 31±3ab 2.3±0.1b 345±4 2.7±0.1b 52±3b 0.31±0.32 52±3b 110 ºC 36±3a 3±0b 39±3a 3.5±0.2a 429±59 4.0±0.3a 93±27a 0.30±0.25 93±27a 120 ºC 28±7b 4±2b 32±8ab 4.1±0.8a 487±453 4.5±1.1a 10±0c 0.32±0.31 10±0c
Navy bean
90 ºC 12±1c 1±0b 12±1c 3.0±0.1bc 201±10b 3.2±0.1bc 2±0b 0.18±0.02 2±0b 100 ºC 7±0d 7±1a 13±1c 2.0±0.1c 164±18b 2.1±0.1c 5±2b 1.08±0.05 6±2b 110 ºC 36±1a 7±0a 43±1a 4.1±0.3b 277±42b 4.3±0.3b 40±27b 0.29±0.15 40±27b 120 ºC 24±2b 6±1a 30±3b 5.4±1.3a 831±525a 6.2±1.9a 189±85a 1.57±1.89 190±85a

85
Common bean Sorbitol** Mannitol** SA** Raf+Stach* Verbascose** RFO* Kestose** Nystose** FOS** Pinto bean
90 ºC 18±1a 2±1c 20±2b 3.4±0.0b 239±7b 3.7±0.0b 38±1b 0.44±0.13a 39±1b 100 ºC 2±1b 2±1c 4±2c 1.7±0.1c 116±10b 1.8±0.1c 11±2b 0.54±0.14a 12±2b 110 ºC 19±1a 5±1b 23±1a 3.5±0.3b 205±62b 3.7±0.3b 87±40a 0.23±0.11a 87±40a 120 ºC 18±0a 7±1a 24±1a 5.6±1.3a 799±548a 6.4±1.8a 96±16a 4.71±7.65a 101±18a
Small red bean
90 ºC 14±0b 1±0b 14±0c 3.0±0.1c 171±26ab 3.2±0.1bc 40±9ab 0.15±0.05a 40±9ab 100 ºC 11±2c 6±1a 17±3c 2.8±0.2c 137±13b 3.0±0.2c 18±4b 0.39±0.22a 19±4b 110 ºC 18±1a 8±2a 26±2a 3.9±0.4b 207±51ab 4.1±0.4b 69±23a 0.44±0.28a 70±23a 120 ºC 15±3ab 7±0a 22±3b 5.1±0.8a 561±418a 5.7±1.2a 61±45ab 0.66±0.50a 62±45ab
╪Mean (±standard deviation) values within a column followed by a different letter are significantly different at P < 0.05 (n = 168). *g/100 g (wet basis; 15% moisture). **mg/100 g (wet basis; 15% moisture). SA, sugar alcohols (sum of sorbitol and mannitol); raf, raffinose; stach, stachyose; RFO, raffinose family oligosaccharides (sum of raffinose, stachyose, and verbascose); FOS, fructooligosaccharides (sum of kestose and nystose); RS, resistant starch; SS, soluble starch; TPC; total prebiotic carbohydrates (sum of SA, RFO, FOS, and RS).

86
concentration was increased from 2.7–3.7 to 4.5–7.9 g/100 g when increase the
processing temperature (Table 4.4). Processing at 100 ºC significantly reduced (P ≤ 0.05)
raffinose+stachyose concentration to 1.7–2.3 g/100 g in light red kidney bean and pinto
bean than 90 ºC (2.4–3.4 g/100 g). However, the 110 and 120 ºC increased the
raffinose+stachyose concentration in all common bean market classes. Verbascose was
increased from 171–239 mg/100 g to 487–1004 mg/100 g (Table 4.4).
Kestose, nystose, and total FOS
Total FOS concentration in lentil market classes increased from 19–77 mg/100 g
to 111–185 mg/100 g with increasing retort temperature from 90 ºC to 120 ºC (Table
4.1). Lentil kestose concentration increased from 18–77 mg/100 g to 111–184 mg/100 g
(Table 4.2). Kestose concentration showed an increase in whole red and whole green at
100 ºC and decreased at 110 ºC. At 120 ºC, kestose concentration increased in all market
classes (Table 4.2). Nystose concentration decreased from 0.29–0.87 mg/100 g to 0.21–
0.74 mg/100 g. In chickpea, total FOS level was increased from 21–61 mg/100 g to 79–
117 mg/100 g. Kestose concentration increased from 21–60 mg/100 g to 78–117 mg/100
g but only significant in kabuli (Table 4.3). Nystose concentration was decreased in desi
while increased in kabuli. In common bean market classes, total FOS was increased in all
common bean market classes except black bean when increase the processing
temperature (Table 4.4). Kestose concentration in black bean significantly reduced from
183 to 128 mg/100 g while increased from 2–40 mg/100 g to 10–189 mg/100 g in all
other market classes. Nystose concentration was increased from 0.08–0.44 mg/100 g to
0.3–1.6 mg/100 g in all common bean market classes (Table 4.4).

87
RS
Resistant starch concentration in studied pulses significantly reduced (P ≤ 0.05)
when increase the processing temperature from 90 to 120 ºC (Fig 4.1). RS concentration
was reduced from 1.1–1.9 g/100 g to 0.4–0.5 g/100 g in lentil (Fig 4.1a), from 0.6–0.8
g/100 g to 0.2–0.3 g/100 g in chickpea (Fig 4.1b), and from 0.5–1.5 g/100 g to 0.3–0.37
g/100 g in common bean except light red kidney bean (Fig 4.1c).
Amylose
Amylose concentration was increased from 26–32 g/100 g to 38–43 g/100 g in
lentil (Fig 6.2a), from 23–33 g/100 g to 37–38 g/100 g in chickpea (Fig 4.2b), and from
19–31 g/100 g to 37–45 g/100 g in common bean (Fig 4.2c) with increasing retort
temperature.
4.7. Discussion
Healthy food consumption plays a major role in reducing obesity risk (Swinburn
et al., 2015). However, in the modern world, people put less effort to cook themselves–a
healthy way of eating–and look for ready to eat foods since it is convenient, cheap, and
less time consuming (Juul and Hemmingsson, 2015; Martínez Steele et al., 2016;
Moubarac et al., 2017). These ready to eat foods are often rich in fat, high in sugar, and
lack in micronutrients, protein, and prebiotic carbohydrates (Steele et al., 2016). In other
hand, majority of produced foods are spoiled before its consumption due to lack of post
after techniques including proper storage facilities (Porat et al., 2018). Therefore,
production of shelf-stable products with health benefits attain a central attention to
combat obesity risk (Luhovyy et al., 2015). This study determined the prebiotic

88
Figure 4. 1. Resistant starch (RS) concentrations of different lentil (1a), chickpea (1b), and
common bean (1c) market classes cooked at 90, 100, 110, and 120 ºC. Columns and error bars
represent mean values and standard deviation, respectively. Values are presented on a wet weight
basis (15% moisture). Values within each market class followed by a different letter are
significantly different at P < 0.05 (n=168). WR, whole red; DR, dehulled red; DSR, dehulled
split red; WG, whole green; DG, dehulled green; D, desi; K; kabuli; BB, black bean; CB,
cranberry bean; GNB, great northern bean; LRKB, light red kidney bean; NB, navy bean; PB,
pinto bean; SRB, small red bean.
Fig. 4.1a Fig. 4.1b
Fig. 4.1c

89
Figure 4. 2. Amylose concentrations of different lentil (2a), chickpea (2b), and common bean
(2c) market classes cooked at 90, 100, 110, and 120 ºC. Columns and error bars represent mean
values and standard deviation, respectively. Values are presented on a wet weight basis (15%
moisture). Values within each market class followed by a different letter are significantly
different at P < 0.05 (n=168). WR, whole red; DR, dehulled red; DSR, dehulled split red; WG,
whole green; DG, dehulled green; D, desi; K; kabuli; BB, black bean; CB, cranberry bean; GNB,
great northern bean; LRKB, light red kidney bean; NB, navy bean; PB, pinto bean; SRB, small
red bean.
Fig. 4.2a Fig. 4.2c
Fig. 4.2c

90
carbohydrate concentration changes with different processing temperature to get an optimum
processing temperature to increase the prebiotic carbohydrates in pulses.
Total prebiotic carbohydrates concentration increased by 17, 63, 18% in lentil, chickpea,
and common bean market classes when increase the retort temperature from 90ºC to 120ºC.
Increasing temperature can reduce the processing time (Boz and Erdoğdu, 2015) and therefore
reduce the thermal degradation of protein and micronutrients (Chitra et al., 1996). Therefore,
shelf-stable pulses that is processed at high temperature for a short time is an ideal food for
modern consumers to get food related health benefits.
High temperature processing causes thermal decomposition of low molecular weight
carbohydrates (LMWC) in front of excess water (Courtin et al., 2009; Forgo et al., 2013; L’homme
et al., 2002; Matsumoto et al., 2015; Matsumura, 2016). Structural changes in SA (Matsumoto et
al., 2015; Matsumura, 2016) and breaking of glycosidic bonds in RFO and FOS cause the thermal
degradation (Courtin et al., 2009; L’homme et al., 2002). However, thermal processing also
degrades the primary and secondary cell wall structures as well as disrupt the cells (Shomer et al.,
1990). Consequently, LMWC leach out to the medium, which increase those concentrations.
Therefore, the concentration of LMWC in thermally processed foods is the net result of thermal
decomposition of LMWC and cell degradation of seeds (Fig 4.3).
Concentration of LMWC showed a decreasing trend in pulses processed at 100–110 ºC
and increased at 120 ºC than pulses processed at 90 ºC. Net concentration of those compounds
may be the result of (1) thermal decomposition; decrease the LMWC concentration and (2) cell
degradation; increase the LMWC concentration (Fig 4.3). At 90–110 ºC, thermal decomposition
may higher than the cell degradation, which decreases overall LMWC concentration. At 120 ºC,

91
the cell degradation may be higher than the thermal decomposition that increases overall LMWC
concentration (Fig 4.3).
Figure 4. 3. Proposed mechanism of increased concentration of low molecular weight
carbohydrates (LMWC) in pulses with increased processing temperature (90–120 ºC). Net
concentration of LMWC in whole pulse seeds depends on the thermal degradation of LMWC
(which decrease the LMWC concentration) during thermal process and cell degradation which
release the trapped LMWC to the medium.
Present study shows that increasing processing temperature reduced RS concentration.
Similar results were observed in Indian lentil where traditional cooking at 90–100 ºC has slightly
higher RS than lentil cooked at 121 ºC (Mahadevamma and Tharanathan, 2004). Also, canning
common beans at 116 ºC for 42 minutes reduce RS content by more than 54% (Pedrosa et al.,
Fig. 4.3
92
2015). However, processing high amylose corn starch at 140–145ºC increased RS content by 25–
30% (Dundar and Gocmen, 2013). Also, autoclaved banana starch showed a higher RS content
than its raw counterpart (González-Soto et al., 2004). These different observations among pulse,
corn, and banana starch may be due to differences of starch granule’s physical characteristics
(i.e. starch granule size and relative crystallinity) and chemical composition (i.e. amylose:
amylopectin ratio)—major factors for the formation of RS (Bajaj et al., 2018).
RS concentration has positive correlation with amylose concentration (Yadav et al.,
2009) since mainly amylose molecules are responsible for the formation of RS. However, in this
study, RS concentration was decreased in pulses with increasing temperature while amylose
concentration was increased. Cooking pulses in a water medium allows starch granules of pulse
seeds to absorb water (Ai and Jane, 2015; Carlstedt et al., 2015). Beyond certain point, the starch
granules are rupture and allow amylose and amylopectin molecules to leach out to the cooking
medium increasing those concentrations (Ai and Jane, 2015; Carlstedt et al., 2015). Released
amylose and amylopectin re-align themselves making crystalline regions depending on those
chain lengths and form RS (Wang et al., 2015). However, high temperature process such as retort
processing at high pressure may fragment amylose and amylopectin molecules and make short
chain molecules, which do not have the capability to make crystalline regions to form RS
(Eerlingen and Delcour, 1995).
The present study did not measure the impact of storage time and storage temperature on
formation of RS which are two important parameters to increase the RS content in thermally
processed foods (González-Soto et al., 2007; Namratha et al., 2002). We did not measured
changes in the other high molecular weight prebiotic carbohydrates such as cellulose,
hemicellulose, and pectin with increasing temperature. Further studies will be required to
93
measure the concentration changes of those compounds and to determine the impact of seed:
water ratio and pressure effect on prebiotic carbohydrates in pulses. Overall, retorted lentil,
chickpea, and common bean can provide 28–42, 22–39, and 17–34% of recommended safe daily
intake of prebiotic carbohydrates (recommended safe daily intake of prebiotic carbohydrates
assumed as 20 g/day as per (Douglas and Sanders, 2008).
4.8. Conclusion
Understanding the impact of processing temperature on prebiotic carbohydrates in pulses
help to develop shelf-stable pulse products rich in prebiotics. Increasing retort temperature from
90 ºC to 120 ºC increased concentration of SA, RFO, and FOS, and amylose, but decreased RS
level. Overall, our study shows that 100 g of retorted pulses can provide 3.4–8.4 g of prebiotic
carbohydrates, which is 17–42% of recommended safe daily intake.
4.9. Acknowledgements
Funding support for this project was provided by the USDA National Institute of Food
and Agriculture [Plant Health and Production and Plant Products: Plant Breeding for Agricultural
Production program area (grant no. 2018-67014-27621/project accession no. 1015284)] and the
American Pulse Association.
4.10. References
AACC International. (2010). Approved Methods of the American Association of Cereal
Chemists (11th ed.). AACC International, St. Paul, MN, USA.
Ai, Y., and Jane, J. (2015). Gelatinization and rheological properties of starch. Starch - Stärke
67, 213–224. doi:10.1002/star.201400201.
Avendano, M., Glymour, M. M., Banks, J., and Mackenbach, J. P. (2009). Health disadvantage
in US adults aged 50 to 74 years: a comparison of the health of rich and poor Americans

94
with that of Europeans. Am. J. Public Health 99, 540–8. doi:10.2105/AJPH.2008.139469.
Bajaj, R., Singh, N., Kaur, A., and Inouchi, N. (2018). Structural, morphological, functional and
digestibility properties of starches from cereals, tubers and legumes: a comparative study. J.
Food Sci. Technol. 55, 3799–3808. doi:10.1007/s13197-018-3342-4.
Bazzano, L. A., Thompson, A. M., Tees, M. T., Nguyen, C. H., and Winham, D. M. (2011).
Non-soy legume consumption lowers cholesterol levels: A meta-analysis of randomized
controlled trials. Nutr. Metab. Cardiovasc. Dis. 21, 94–103.
doi:10.1016/J.NUMECD.2009.08.012.
Berrios, J. D. J., Morales, P., Cámara, M., and Sánchez-Mata, M. C. (2010). Carbohydrate
composition of raw and extruded pulse flours. Food Res. Int. 43, 531–536.
doi:10.1016/J.FOODRES.2009.09.035.
Biesiekierski, J. R., Rosella, O., Rose, R., Liels, K., Barrett, J. S., Shepherd, S. J., et al. (2011).
Quantification of fructans, galacto-oligosacharides and other short-chain carbohydrates in
processed grains and cereals. J. Hum. Nutr. Diet. 24, 154–176. doi:10.1111/j.1365-
277X.2010.01139.x.
Bleich, S. N., Vercammen, K. A., Zatz, L. Y., Frelier, J. M., Ebbeling, C. B., and Peeters, A.
(2018). Interventions to prevent global childhood overweight and obesity: a systematic
review. Lancet Diabetes Endocrinol. 6, 332–346. doi:10.1016/S2213-8587(17)30358-3.
Boz, Z., and Erdoğdu, F. (2015). “Thermal Processing: Canning and Aseptic Processing,” in
Handbook of Vegetable Preservation and Processing, eds. Y. H. Hui and E. Özgül Evranuz
(CRC Press ), 157–174.
Brown, R. E., Sharma, A. M., Ardern, C. I., Mirdamadi, P., Mirdamadi, P., and Kuk, J. L.
(2016). Secular differences in the association between caloric intake, macronutrient intake,

95
and physical activity with obesity. Obes. Res. Clin. Pract. 10, 243–255.
doi:10.1016/J.ORCP.2015.08.007.
Carlstedt, J., Wojtasz, J., Fyhr, P., and Kocherbitov, V. (2015). Understanding starch
gelatinization: The phase diagram approach. Carbohydr. Polym. 129, 62–69.
doi:10.1016/J.CARBPOL.2015.04.045.
Chitra, U., Singh, U., and Venkateswara Rao, P. (1996). Phytic acid, in vitro protein digestibility,
dietary fiber, and minerals of pulses as influenced by processing methods. Plant Foods
Hum. Nutr. 49, 307–316. doi:10.1007/BF01091980.
Chooi, Y. C., Ding, C., and Magkos, F. (2019). The epidemiology of obesity. Metabolism 92, 6–
10. doi:10.1016/j.metabol.2018.09.005.
Courtin, C. M., Swennen, K., Verjans, P., and Delcour, J. A. (2009). Heat and pH stability of
prebiotic arabinoxylooligosaccharides, xylooligosaccharides and fructooligosaccharides.
Food Chem. 112, 831–837. doi:10.1016/j.foodchem.2008.06.039.
Delzenne, N. M., Olivares, M., Neyrinck, A. M., Beaumont, M., Kjølbæk, L., Larsen, T. M., et
al. (2019). Nutritional interest of dietary fiber and prebiotics in obesity: Lessons from the
MyNewGut consortium. Clin. Nutr. doi:10.1016/J.CLNU.2019.03.002.
Douglas, L., and Sanders, M. (2008). Probiotics and prebiotics in dietetics practice. J. Am. Diet.
Assoc. 108, 510–521.
Dundar, A. N., and Gocmen, D. (2013). Effects of autoclaving temperature and storing time on
resistant starch formation and its functional and physicochemical properties. Carbohydr.
Polym. 97, 764–771. doi:10.1016/J.CARBPOL.2013.04.083.
Eerlingen, R., and Delcour, J. (1995). Formation, analysis, structure and properties of type III
enzyme resistant starch. J. Cereal Sci. 22, 129–138. doi:10.1016/0733-5210(95)90042-X.

96
FAO (2019). FAOSTAT. Available at: http://faostat3.fao.org/home/E [Accessed June 10, 2019]
Feinberg, M., San-Redon, J., and Assié, A. (2009). Determination of complex polysaccharides
by HPAE-PAD in foods: Validation using accuracy profile. J. Chromatogr. B 877, 2388–
2395. doi:10.1016/j.jchromb.2008.10.004.
Forgo, P., Kiss, A., Korózs, M., and Rapi, S. (2013). Thermal degradation and consequent
fragmentation of widely applied oligosaccharides. Microchem. J. 107, 37–46.
doi:10.1016/J.MICROC.2012.06.017.
Gangola, M. P., Jaiswal, S., Kannan, U., Gaur, P. M., Båga, M., and Chibbar, R. N. (2016).
Galactinol synthase enzyme activity influences raffinose family oligosaccharides (RFO)
accumulation in developing chickpea (Cicer arietinum L.) seeds. Phytochemistry 125, 88–
98. doi:10.1016/J.PHYTOCHEM.2016.02.009.
Gibson, G. R., Hutkins, R., Sanders, M. E., Prescott, S. L., Reimer, R. A., Salminen, S. J., et al.
(2017). Expert consensus document: The International Scientific Association for Probiotics
and Prebiotics (ISAPP) consensus statement on the definition and scope of prebiotics. Nat.
Rev. Gastroenterol. Hepatol. 14, 491. doi:10.1038/nrgastro.2017.75.
Gibson, T. S., Solah, V. A., and McCleary, B. V. (1997). A Procedure to Measure Amylose in
Cereal Starches and Flours with Concanavalin A. J. Cereal Sci. 25, 111–119.
doi:10.1006/JCRS.1996.0086.
González-Soto, R. A., Agama-Acevedo, E., Solorza-Feria, J., Rendón-Villalobos, R., and Bello-
Pérez, L. A. (2004). Resistant Starch Made from Banana Starch by Autoclaving and
Debranching. Starch - Stärke 56, 495–499. doi:10.1002/star.200400283.
González-Soto, R. A., Mora-Escobedo, R., Hernández-Sánchez, H., Sánchez-Rivera, M., and
Bello-Pérez, L. A. (2007). The influence of time and storage temperature on resistant starch

97
formation from autoclaved debranched banana starch. Food Res. Int. 40, 304–310.
doi:10.1016/J.FOODRES.2006.04.001.
Güzel, D., and Sayar, S. (2012). Effect of cooking methods on selected physicochemical and
nutritional properties of barlotto bean, chickpea, faba bean, and white kidney bean. J. Food
Sci. Technol. 49, 89–95. doi:10.1007/s13197-011-0260-0.
Hall, C., Hillen, C., and Garden Robinson, J. (2017). Composition, Nutritional Value, and Health
Benefits of Pulses. Cereal Chem. J. 94, 11–31. doi:10.1094/CCHEM-03-16-0069-FI.
Hinnig, P., Monteiro, J., de Assis, M., Levy, R., Peres, M., Perazi, F., et al. (2018). Dietary
Patterns of Children and Adolescents from High, Medium and Low Human Development
Countries and Associated Socioeconomic Factors: A Systematic Review. Nutrients 10, 436.
doi:10.3390/nu10040436.
Jaacks, L. M., Vandevijvere, S., Pan, A., McGowan, C. J., Wallace, C., Imamura, F., et al.
(2019). The obesity transition: stages of the global epidemic. Lancet Diabetes Endocrinol.
7, 231–240. doi:10.1016/S2213-8587(19)30026-9.
Johnson, C. R., Thavarajah, D., Combs, G. F., and Thavarajah, P. (2013). Lentil (Lens culinaris
L.): A prebiotic-rich whole food legume. Food Res. Int. 51, 107–113.
doi:10.1016/j.foodres.2012.11.025.
Johnson, C. R., Thavarajah, D., Thavarajah, P., Payne, S., Moore, J., and Ohm, J. B. (2015).
Processing, cooking, and cooling affect prebiotic concentrations in lentil (Lens culinaris
Medikus). J. Food Compos. Anal. 38, 106–111. doi:10.1016/j.jfca.2014.10.008.
Juul, F., and Hemmingsson, E. (2015). Trends in consumption of ultra-processed foods and
obesity in Sweden between 1960 and 2010. Public Health Nutr. 18, 3096–3107.
doi:10.1017/S1368980015000506.

98
Kelkar, S., Siddiq, M., Harte, J. B., Dolan, K. D., Nyombaire, G., and Suniaga, H. (2012). Use of
low-temperature extrusion for reducing phytohemagglutinin activity (PHA) and
oligosaccharides in beans (Phaseolus vulgaris L.) cv. Navy and Pinto. Food Chem. 133,
1636–1639. doi:10.1016/J.FOODCHEM.2012.02.044.
Khattab, R. Y., and Arntfield, S. D. (2009). Nutritional quality of legume seeds as affected by
some physical treatments 2. Antinutritional factors. LWT - Food Sci. Technol. 42, 1113–
1118. doi:10.1016/J.LWT.2009.02.004.
L’homme, C., Arbelot, M., Puigserver, A., and Biagini, A. (2002). Kinetics of Hydrolysis of
Fructooligosaccharides in Mineral-Buffered Aqueous Solutions: Influence of pH and
Temperature. J. Agric. Food Chem. 51, 224–228. doi:10.1021/JF0204699.
Luhovyy, B. L., Mollard, R. C., Panahi, S., Nunez, M. F., Cho, F., and Anderson, G. H. (2015).
Canned Navy Bean Consumption Reduces Metabolic Risk Factors Associated with Obesity.
Can. J. Diet. Pract. Res. 76, 33–37. doi:10.3148/cjdpr-2014-030.
Mahadevamma, S., and Tharanathan, R. N. (2004). Processing of legumes: resistant starch and
dietary fiber contents. J. Food Qual. 27, 289–303. doi:10.1111/j.1745-4557.2004.00620.x.
Makris, A., and Foster, G. D. (2011). Dietary approaches to the treatment of obesity. Psychiatr.
Clin. North Am. 34, 813–27. doi:10.1016/j.psc.2011.08.004.
Margier, M., Georgé, S., Hafnaoui, N., Remond, D., Nowicki, M., Du Chaffaut, L., et al. (2018).
Nutritional composition and bioactive content of legumes: characterization of pulses
frequently consumed in france and effect of the cooking method. Nutrients 10, 1668.
doi:10.3390/nu10111668.
Martínez Steele, E., Baraldi, L. G., Louzada, M. L. da C., Moubarac, J.-C., Mozaffarian, D., and
Monteiro, C. A. (2016). Ultra-processed foods and added sugars in the US diet: evidence

99
from a nationally representative cross-sectional study. BMJ Open 6, e009892.
doi:10.1136/bmjopen-2015-009892.
Matsumoto, R., Aki, T., and Nakashimada, Y. (2015). Determination of Mannitol Decomposition
Rate under Hydrothermal Pretreatment Condition. J. Japan Pet. Inst. 58, 252–255.
Matsumura, Y. (2016). Kinetics of Sorbitol Decomposition under Hydrothermal Condition. J.
JAPAN 59, 241–241.
McCleary, B. V., and Monaghan, D. A. (2002). Measurement of Resistant Starch. J. AOAC Int.
85, 665–675.
Megazyme (2018). D-glucose assay procedure (GOPOD-format). K-GLUC 08/18. Megazyme
Int. Ltd, Ireland.
Míguez, B., Gómez, B., Gullón, P., Gullón, B., and Alonso, J. L. (2016). “Pectic
oligosaccharides and other emerging prebiotics,” in Probiotics and Prebiotics in Human
Nutrition and Health, eds. V. Rao and L. Rao (IntechOpen), 301–330.
Mollard, R. C., Luhovyy, B. L., Panahi, S., Nunez, M., Hanley, A., and Anderson, G. H. (2012).
Regular consumption of pulses for 8 weeks reduces metabolic syndrome risk factors in
overweight and obese adults. Br. J. Nutr. 108, S111–S122.
doi:10.1017/S0007114512000712.
Morales, J. Berrios, J. De, A. Varela, C. Burbano, C. Cuadrado, M. Muzquiz, et al. (2015). Novel
fiber-rich lentil flours as snack-type functional foods: an extrusion cooking effect on
bioactive compounds. Food Funct. 6, 3135–3143. doi:10.1039/C5FO00729A.
Moubarac, J. C., Batal, M., Louzada, M. L., Martinez Steele, E., and Monteiro, C. A. (2017).
Consumption of ultra-processed foods predicts diet quality in Canada. Appetite 108, 512–
520. doi:10.1016/J.APPET.2016.11.006.

100
Muir, J. G., Rose, R., Rosella, O., Liels, K., Barrett, J. S., Shepherd, S. J., et al. (2009).
Measurement of Short-Chain Carbohydrates in Common Australian Vegetables and Fruits
by High-Performance Liquid Chromatography (HPLC). J. Agric. Food Chem. 57, 554–565.
doi:10.1021/jf802700e.
Namratha, J., Asna, U., and Prasad, N. (2002). Effect of storage on resistant starch content of
processed ready-to-eat foods. Food Chem. 79, 395–400. doi:10.1016/S0308-
8146(02)00210-8.
Parmar, N., Singh, N., Kaur, A., Virdi, A. S., and Thakur, S. (2016). Effect of canning on color,
protein and phenolic profile of grains from kidney bean, field pea and chickpea. Food Res.
Int. 89, 526–532. doi:10.1016/J.FOODRES.2016.07.022.
Pedrosa, M. M., Cuadrado, C., Burbano, C., Muzquiz, M., Cabellos, B., Olmedilla-Alonso, B., et
al. (2015). Effects of industrial canning on the proximate composition, bioactive compounds
contents and nutritional profile of two Spanish common dry beans (Phaseolus vulgaris L.).
Food Chem. 166, 68–75. doi:10.1016/J.FOODCHEM.2014.05.158.
Peng, W., and Berry, E. M. (2018). Global nutrition 1990–2015: A shrinking hungry, and
expanding fat world. PLoS One 13, e0194821. doi:10.1371/journal.pone.0194821.
Popkin, B. M., and Gordon-Larsen, P. (2004). The nutrition transition: worldwide obesity
dynamics and their determinants. Int. J. Obes. 28, S2–S9. doi:10.1038/sj.ijo.0802804.
Porat, R., Lichter, A., Terry, L. A., Harker, R., and Buzby, J. (2018). Postharvest losses of fruit
and vegetables during retail and in consumers’ homes: Quantifications, causes, and means
of prevention. Postharvest Biol. Technol. 139, 135–149.
doi:10.1016/J.POSTHARVBIO.2017.11.019.
Reddy, N. R., Pierson, M. D., Sathe, S. K., and Salunkhe, D. K. (1984). Chemical, nutritional

101
and physiological aspects of dry bean carbohydrates—A review. Food Chem. 13, 25–68.
doi:10.1016/0308-8146(84)90026-8.
Shomer, I., Paster, N., Lindner, P., and Vasiliver, R. (1990). The role of cell wall structure in the
hard-to-cook phenomenon in beans (Phaseolus vulgaris L.). Food Struct. 9, 10.
Siva, N., Thavarajah, P., and Thavarajah, D. (2018). The impact of processing and cooking on
prebiotic carbohydrates in lentil. J. Food Compos. Anal. 70, 72–77.
doi:10.1016/j.jfca.2018.04.006.
Słupski, J., and Gębczyński, P. (2014). Changes due to cooking and sterilization in low
molecular weight carbohydrates in immature seeds of five cultivars of common bean. Int. J.
Food Sci. Nutr. 65, 419–425. doi:10.3109/09637486.2013.869794.
Swinburn, B., Kraak, V., Rutter, H., Vandevijvere, S., Lobstein, T., Sacks, G., et al. (2015).
Strengthening of accountability systems to create healthy food environments and reduce
global obesity. Lancet 385, 2534–2545. doi:10.1016/S0140-6736(14)61747-5.
US Pulse Quality Survey. (2017). Northern Pulse Growers Association, USA Dry Pea and Lentil
Council, and NDSU North Dakota Agricultural Experiment Station. North Dakota State
University, Fargo, ND.
USDA. (2019). Food Composition Databases. Available at: https://ndb.nal.usda.gov/ndb/
[Accessed September 2, 2018].
Wang, S., Li, C., Copeland, L., Niu, Q., and Wang, S. (2015). Starch Retrogradation: A
Comprehensive Review. Compr. Rev. Food Sci. Food Saf. 14, 568–585. doi:10.1111/1541-
4337.12143.
WHO. (2019). Obesity and overweight. Available at: https://www.who.int/news-room/fact-
sheets/detail/obesity-and-overweight [Accessed June 8, 2019].

102
Wong, C. L., Mollard, R. C., Zafar, T. A., Luhovyy, B. L., and Anderson, G. H. (2009). Food
Intake and Satiety Following a Serving of Pulses in Young Men: Effect of Processing,
Recipe, and Pulse Variety. J. Am. Coll. Nutr. 28, 543–552.
doi:10.1080/07315724.2009.10719786.
Yadav, B. S., Sharma, A., and Yadav, R. B. (2009). Studies on effect of multiple heating/cooling
cycles on the resistant starch formation in cereals, legumes and tubers. Int. J. Food Sci.
Nutr. 60, 258–272. doi:10.1080/09637480902970975.
Ziraba, A. K., Fotso, J. C., and Ochako, R. (2009). Overweight and obesity in urban Africa: A
problem of the rich or the poor? BMC Public Health 9, 465. doi:10.1186/1471-2458-9-465.

103
5. GENERAL DISCUSSION
Lentil, common bean, and chickpea belong to pulse crops and had low calorie values due
to low fat and high levels of low digestible carbohydrates including SA, RFO, FOS, RS,
cellulose, hemicellulose (de Almeida Costa et al., 2006; Johnson et al., 2013). These prebiotic
carbohydrate concentrations are changed during food processing (Abdel-Gawad, 1993; Han and
Baik, 2006; Johnson et al., 2015; Siva et al., 2018; Verde et al., 1992). Therefore, the
information about the prebiotic carbohydrate profiles of pulse market classes and the effect of
cooking, cooling, and reheating on those prebiotic carbohydrates are important. Further, effect of
cooking temperature on pulse prebiotic carbohydrates is important to get optimum concentration
of prebiotic carbohydrates in pulses to produce thermally processed shelf-stable pulse foods.
Prebiotic carbohydrate profiles change among pulses market classes. The fisrt study
shows that out of 51-54 g/100 g of total carbohydrates, lentil, common bean, and chickpea
provides 12, 15, and 12 g of prebiotic carbohydrates. In lentil market classes, red lentil,
specifically red split lentil (11–13 g/100 g) had higher prebiotic carbohydrates than green lentil
(10–11 g/100 g). In common bean, navy bean had higher prebiotic carbohydrates (16 g/100 g)
than small red, cranberry, great northern, light red kidney, black, and pinto bean (14–15 g/100 g).
In chickpea, kabuli had higher prebiotic carbohydrates (13 g/100 g) than desi (11 g/100 g). These
observations highlight that plant selection and breeding of relevant pulse market classes can
increase the prebiotic carbohydrate levels in pulses and help to select relevant pulses to
incorporate into diets to increase the prebiotic carbohydrates intake.
Manipulation of food processing method can be used to increase the nutritional value of
pulses (Abdel-Gawad, 1993; Han and Baik, 2006; Johnson et al., 2015; Siva et al., 2018; Verde
et al., 1992). The second study shows that 100 g of cooked common bean and chickpea provide
104
7–8 g and 8–10 g of prebiotic carbohydrates respectively. Cooling and reheating had different
effect on pulse market classes. Cooling did not change prebiotic carbohydrate concentration in
common bean, but significantly increased in chickpea market classes. Also, reheating
significantly decreased prebiotic carbohydrates in common bean and did not change in chickpea.
Understanding the mechanisms of these changes and associated physical and chemical factors
are important to study for optimize the processing condition to each pulse market classes to
increase the prebiotic carbohydrates in processed pulses.
Consumption of thermally processed shelf-stable foods, i.e. canned beans, are becoming
more popular due to their low cost and convenience (Juul and Hemmingsson, 2015). Nutritional
quality of those foods should be considered due to increased risk of obesity upon unhealthy food
consumption (St-Onge et al., 2003). The third study evaluated the impact of retort processing
temperature on prebiotic carbohydrates of pulses. Total prebiotic carbohydrates concentration
was increased from 7 to 8 g/100 in lentil, 4 to 7 g/100 g in common bean, and 7 to 8 g/100 g in
chickpea when increase the processing temperature from 90 ºC to 120 ºC. This study shows that
increasing processing temperature up to 120 ºC increase prebiotic carbohydrate concentration.
However, the impact of moisture and processing pressure on prebiotic carbohydrates should be
further investigated.
Food based intervention is one of the effective approaches to reduce childhood obesity
(Sallis and Glanz, 2009). Food based interventions are interconnected to agriculture, industrial
food producers, and policy makers (Story et al., 2009; Verduin et al., 2005). Agriculture based
Universities and research centers should breed crops including pulses that are nutritionally
superior and adapted to harsh environmental conditions. On other hand, food industry should
provide healthy food options at low cost via optimizing the processing conditions (Verduin et al.,

105
2005). Development of processed foods using healthy ingredients including pulses rich in
prebiotic carbohydrates may be a successful food-based approach to increase healthy food
consumption.

106
6. CONCLUSIONS AND FUTURE DIRECTION
Lentil, common bean, and chickpea are rich sources of prebiotic carbohydrates including
SAs, RFOs, FOSs, RS, hemicellulose, and cellulose, which can be changed during cooking,
cooling, and reheating. Increasing cooking temperature from 90 ºC to 120 ºC increased prebiotic
carbohydrates in pulses by17–63%. However, the impact of moisture and processing pressure on
prebiotic carbohydrates during processing need to be studied. Also, the effect of processed pulse
market classes on animal/human obesity biomarkers are yet be evaluated. Therefore, the future
pulse research will include,
1. Determination of impact of moisture and pressure on lentil, common bean, and
chickpea market classes in response to thermal processing.
2. Precooked shelf-stable pulse diet on obesity biomarkers and gut microbiome using
animal/human subjects.
3. Development of pulse-based shelf-stable food products such as pulse spreads,
morning cereals, and pasta to provide optimum prebiotic carbohydrates to children.
As a conclusion, pulse can be incorporated into shelf-stable foods as a whole food or as
an ingredient to increase the nutrient quality of a diet.

107
6.1. References
Abdel-Gawad, A. S. (1993). Effect of domestic processing on oligosaccharide content of some
dry legume seeds. Food Chem. 46, 25–31. doi:10.1016/0308-8146(93)90070-V.
Berrios, J. D. J., Morales, P., Cámara, M., and Sánchez-Mata, M. C. (2010). Carbohydrate
composition of raw and extruded pulse flours. Food Res. Int. 43, 531–536.
doi:10.1016/J.FOODRES.2009.09.035.
Biesiekierski, J. R., Rosella, O., Rose, R., Liels, K., Barrett, J. S., Shepherd, S. J., et al. (2011).
Quantification of fructans, galacto-oligosacharides and other short-chain carbohydrates in
processed grains and cereals. J. Hum. Nutr. Diet. 24, 154–176. doi:10.1111/j.1365-
277X.2010.01139.x.
CDC (2015). Strategies to Prevent Overweight and Obesity. Available at:
https://www.cdc.gov/obesity/strategies/index.html [Accessed July 4, 2019].
CDC (2016). FastStats - Overweight Prevalence. Available at:
https://www.cdc.gov/nchs/fastats/obesity-overweight.htm [Accessed June 11, 2019].
Davis, M., Gance-Cleveland, B., Hassink, S., Johnson, R., Paradis, G., and Resnicow, K. (2007).
Recommendations for prevention of childhood obesity. Am Acad Pediatr. 120, S229–S253.
Available at: https://pediatrics.aappublications.org/content/120/Supplement_4/S229?eaf=
[Accessed June 12, 2019].
de Almeida Costa, G. E., da Silva Queiroz-Monici, K., Pissini Machado Reis, S. M., and de
Oliveira, A. C. (2006). Chemical composition, dietary fibre and resistant starch contents of
raw and cooked pea, common bean, chickpea and lentil legumes. Food Chem. 94, 327–330.
doi:10.1016/J.FOODCHEM.2004.11.020.
Dehghan, M., Akhtar-Danesh, N., and Merchant, A. T. (2005). Childhood obesity, prevalence
108
and prevention. Nutr. J. 4, 24. doi:10.1186/1475-2891-4-24.
Douglas, L., and Sanders, M. (2008). Probiotics and prebiotics in dietetics practice. J. Am. Diet.
Assoc. 108, 510–521. Available at:
http://www.sciencedirect.com/science/article/pii/S0002822307022109 [Accessed August
14, 2016].
Dwivedi, S., Sahrawat, K., Puppala, N., and Ortiz, R. (2014). Plant prebiotics and human health:
Biotechnology to breed prebiotic-rich nutritious food crops. Electron. J. Biotechnol. 17,
238–245. doi:10.1016/j.ejbt.2014.07.004.
Foster, G. D., Sherman, S., Borradaile, K. E., Grundy, K. M., Vander Veur, S. S., Nachmani, J.,
et al. (2008). A policy-based school intervention to prevent overweight and obesity.
Pediatrics 121, e794-802. doi:10.1542/peds.2007-1365.
Gangola, M. P., Jaiswal, S., Kannan, U., Gaur, P. M., Båga, M., and Chibbar, R. N. (2016).
Galactinol synthase enzyme activity influences raffinose family oligosaccharides (RFO)
accumulation in developing chickpea (Cicer arietinum L.) seeds. Phytochemistry 125, 88–
98. doi:10.1016/J.PHYTOCHEM.2016.02.009.
Gibson, G. R., Hutkins, R., Sanders, M. E., Prescott, S. L., Reimer, R. A., Salminen, S. J., et al.
(2017). Expert consensus document: The International Scientific Association for Probiotics
and Prebiotics (ISAPP) consensus statement on the definition and scope of prebiotics. Nat.
Rev. Gastroenterol. Hepatol. 14, 491. doi:10.1038/nrgastro.2017.75.
Güzel, D., and Sayar, S. (2012). Effect of cooking methods on selected physicochemical and
nutritional properties of barlotto bean, chickpea, faba bean, and white kidney bean. J. Food
Sci. Technol. 49, 89–95. doi:10.1007/s13197-011-0260-0.
Han, I. H., and Baik, B.-K. (2006). Oligosaccharide Content and Composition of Legumes and

109
Their Reduction by Soaking, Cooking, Ultrasound, and High Hydrostatic Pressure. Cereal
Chem. J. 83, 428–433. doi:10.1094/CC-83-0428.
Johnson, C. R., Thavarajah, D., Combs, G. F., and Thavarajah, P. (2013). Lentil (Lens culinaris
L.): A prebiotic-rich whole food legume. Food Res. Int. 51, 107–113.
doi:10.1016/j.foodres.2012.11.025.
Johnson, C. R., Thavarajah, D., Thavarajah, P., Fenlason, A., McGee, R., Kumar, S., et al.
(2015a). A global survey of low-molecular weight carbohydrates in lentils. J. Food
Compos. Anal. 44, 178–185. doi:10.1016/j.jfca.2015.08.005.
Johnson, C. R., Thavarajah, D., Thavarajah, P., Payne, S., Moore, J., and Ohm, J. B. (2015b).
Processing, cooking, and cooling affect prebiotic concentrations in lentil (Lens culinaris
Medikus). J. Food Compos. Anal. 38, 106–111. doi:10.1016/j.jfca.2014.10.008.
Johnson, J. A., and Johnson, A. M. (2015). Urban-Rural Differences in Childhood and
Adolescent Obesity in the United States: A Systematic Review and Meta-Analysis. Child.
Obes. 11, 233–241. doi:10.1089/chi.2014.0085.
Juul, F., and Hemmingsson, E. (2015). Trends in consumption of ultra-processed foods and
obesity in Sweden between 1960 and 2010. Public Health Nutr. 18, 3096–3107.
doi:10.1017/S1368980015000506.
Kaur, N., and Gupta, A. (2002). Applications of inulin and oligofructose in health and nutrition.
J. Biosci. 27, 703–714. Available at: http://www.ias.ac.in/describe/article/jbsc/027/07/0703-
0714 [Accessed June 8, 2017].
Krishnamoorthy, U., Schram, C. M. ., and Hill, S. . (2006). Maternal obesity in pregnancy: is it
time for meaningful research to inform preventive and management strategies? Wiley
Online Libr. 113, 1134–1140. Available at:

110
https://onlinelibrary.wiley.com/doi/pdf/10.1111/j.1471-0528.2006.01045.x [Accessed June
12, 2019].
Llewellyn, A., Simmonds, M., Owen, C. G., and Woolacott, N. (2016). Childhood obesity as a
predictor of morbidity in adulthood: a systematic review and meta-analysis. Obes. Rev. 17,
56–67. doi:10.1111/obr.12316.
Manning, T. S., and Gibson, G. R. (2004). Prebiotics. Best Pract. Res. Clin. Gastroenterol. 18,
287–298. doi:10.1016/j.bpg.2003.10.008.
Margier, M., Georgé, S., Hafnaoui, N., Remond, D., Nowicki, M., Du Chaffaut, L., et al. (2018).
Nutritional Composition and Bioactive Content of Legumes: Characterization of Pulses
Frequently Consumed in France and Effect of the Cooking Method. Nutrients 10, 1668.
doi:10.3390/nu10111668.
Morales, J. Berrios, J. De, A. Varela, C. Burbano, C. Cuadrado, M. Muzquiz, et al. (2015). Novel
fiber-rich lentil flours as snack-type functional foods: an extrusion cooking effect on
bioactive compounds. Food Funct. 6, 3135–3143. doi:10.1039/C5FO00729A.
Must, A., and Strauss, R. (1999). Risks and consequences of childhood and adolescent obesity.
Int. J. Obes. 23, S2–S11. doi:10.1038/sj.ijo.0800852.
Natale, R., Scott, S. H., Messiah, S. E., Schrack, M. M., Uhlhorn, S. B., and Delamater, A.
(2013). Design and methods for evaluating an early childhood obesity prevention program
in the childcare center setting. BMC Public Health 13, 78. doi:10.1186/1471-2458-13-78.
Ogden, C. L., Carroll, M. D., Kit, B. K., and Flegal, K. M. (2012). Prevalence of Obesity and
Trends in Body Mass Index Among US Children and Adolescents, 1999-2010. JAMA 307,
483. doi:10.1001/jama.2012.40.
Paeratakul, S., Lovejoy, J., Ryan, D., and Bray, G. (2002). The relation of gender, race and

111
socioeconomic status to obesity and obesity comorbidities in a sample of US adults. Int. J.
Obes. 26, 1205–1210. doi:10.1038/sj.ijo.0802026.
Raigond, P., Ezekiel, R., and Raigond, B. (2015). Resistant starch in food: a review. J. Sci. Food
Agric. 95, 1968–1978. doi:10.1002/jsfa.6966.
Reddy, N. R., Pierson, M. D., Sathe, S. K., and Salunkhe, D. K. (1984). Chemical, nutritional
and physiological aspects of dry bean carbohydrates—A review. Food Chem. 13, 25–68.
doi:10.1016/0308-8146(84)90026-8.
Rubel, I. A., Pérez, E. E., Genovese, D. B., and Manrique, G. D. (2014). In vitro prebiotic
activity of inulin-rich carbohydrates extracted from Jerusalem artichoke (Helianthus
tuberosus L.) tubers at different storage times by Lactobacillus paracasei. Food Res. Int. 62,
59–65. doi:10.1016/J.FOODRES.2014.02.024.
Sallis, J. F., and Glanz, K. (2009). Physical Activity and Food Environments: Solutions to the
Obesity Epidemic. Milbank Q. 87, 123–154. doi:10.1111/j.1468-0009.2009.00550.x.
Singh, G. K., Siahpush, M., and Kogan, M. D. (2010). Neighborhood Socioeconomic
Conditions, Built Environments, And Childhood Obesity. Health Aff. 29, 503–512.
doi:10.1377/hlthaff.2009.0730.
Siva, N., Thavarajah, P., and Thavarajah, D. (2018). The impact of processing and cooking on
prebiotic carbohydrates in lentil. J. Food Compos. Anal. 70, 72–77.
doi:10.1016/J.JFCA.2018.04.006.
Słupski, J., and Gębczyński, P. (2014). Changes due to cooking and sterilization in low
molecular weight carbohydrates in immature seeds of five cultivars of common bean. Int. J.
Food Sci. Nutr. 65, 419–425. doi:10.3109/09637486.2013.869794.
St-Onge, M.-P., Keller, K. L., and Heymsfield, S. B. (2003). Changes in childhood food

112
consumption patterns: a cause for concern in light of increasing body weights. Am. J. Clin.
Nutr. 78, 1068–1073. doi:10.1093/ajcn/78.6.1068.
Story, M., Sallis, J. F., and Orleans, C. T. (2009). Adolescent obesity: towards evidence-based
policy and environmental solutions. J. Adolesc. Health 45, S1-5.
doi:10.1016/j.jadohealth.2009.06.022.
The GBD 2015 Obesity Collaborators (2017). Health Effects of Overweight and Obesity in 195
Countries over 25 Years. N. Engl. J. Med. 377, 13–27. doi:10.1056/NEJMoa1614362.
The State of Obesity (2019). South Carolina State Obesity Data, Rates and Trends – The State of
Obesity. Available at: https://www.stateofobesity.org/states/sc/ [Accessed June 11, 2019].
U.S. Pulse Quality Survey (2017). Available at: https://www.usapulses.org/resources/245-2017-
us-pulse-quality-survey/file [Accessed June 8, 2019].
USDA (2019). USDA Food Composition Databases. Available at: https://ndb.nal.usda.gov/ndb/
[Accessed June 8, 2019].
Verde, C. V., Frías, J., and Verde, S. V. (1992). Effect of Processing on the Soluble
Carbohydrate Content of Lentils. J. Food Prot. 55, 301–303. doi:10.4315/0362-028X-
55.4.301.
Verduin, P., Agarwal, S., and Waltman, S. (2005). Solutions to obesity: perspectives from the
food industry. Am. J. Clin. Nutr. 82, 259S-261S. doi:10.1093/ajcn/82.1.259S.
WHO (2003). Diet, nutrition and the prevention of chronic diseases. Geneva: World Health
Organization Available at: https://www.who.int/dietphysicalactivity/publications/trs916/en/
[Accessed July 4, 2019]
WHO (2018). Obesity and overweight. Available at: https://www.who.int/news-room/fact-
sheets/detail/obesity-and-overweight [Accessed June 11, 2019].