PRE-QUARTERLY RESULTS EXTERNAL COMMUNICATION
19
Page 1 of 19 Pre-Quarterly Results Communication Q2 2018 Issued: Monday, 9 th July 2018 Contents New information for Q2 2018 ................................................................................................................. 2 GSK completes Consumer Healthcare buyout ................................................................................ 2 Foreign exchange ............................................................................................................................ 2 Currency impact 2018 ..................................................................................................................... 4 Basic weighted average number of shares (WANS)........................................................................ 4 Dividend .......................................................................................................................................... 5 Factors impacting recent quarterly comparisons ................................................................................... 5 Pharmaceuticals .............................................................................................................................. 5 Vaccines .......................................................................................................................................... 7 Consumer Healthcare ..................................................................................................................... 8 Corporate and other unallocated and costs ................................................................................... 9 Operating and financial performance ................................................................................................... 10 Operating performance .................................................................................................................... 10 Year-on-year annual cost savings (per Q4 2017 results presentation)......................................... 10 Research and development .......................................................................................................... 10 Royalty income.............................................................................................................................. 11 Financial performance ...................................................................................................................... 11 Net finance costs........................................................................................................................... 11 Associates and joint ventures ....................................................................................................... 11 Taxation......................................................................................................................................... 12 Profit / (loss) attributable to non-controlling interests (minority interests) ................................ 12 Free cash flow ............................................................................................................................... 13 Net debt ........................................................................................................................................ 13 Put options .................................................................................................................................... 14 Contingent consideration ............................................................................................................. 14 Historic London Stock Exchange announcements (LSE announcements) and press releases ............. 15 Acquisitions and divestments ........................................................................................................... 15 News flow on key assets during the quarter and to date ................................................................. 15 Other news flow during the quarter and to date ............................................................................. 18
Transcript of PRE-QUARTERLY RESULTS EXTERNAL COMMUNICATION

Page 1 of 19
Pre-Quarterly Results Communication Q2 2018
Issued: Monday, 9th July 2018
Contents New information for Q2 2018 ................................................................................................................. 2
GSK completes Consumer Healthcare buyout ................................................................................ 2
Foreign exchange ............................................................................................................................ 2
Currency impact 2018 ..................................................................................................................... 4
Basic weighted average number of shares (WANS) ........................................................................ 4
Dividend .......................................................................................................................................... 5
Factors impacting recent quarterly comparisons ................................................................................... 5
Pharmaceuticals .............................................................................................................................. 5
Vaccines .......................................................................................................................................... 7
Consumer Healthcare ..................................................................................................................... 8
Corporate and other unallocated and costs ................................................................................... 9
Operating and financial performance ................................................................................................... 10
Operating performance .................................................................................................................... 10
Year-on-year annual cost savings (per Q4 2017 results presentation) ......................................... 10
Research and development .......................................................................................................... 10
Royalty income .............................................................................................................................. 11
Financial performance ...................................................................................................................... 11
Net finance costs ........................................................................................................................... 11
Associates and joint ventures ....................................................................................................... 11
Taxation ......................................................................................................................................... 12
Profit / (loss) attributable to non-controlling interests (minority interests) ................................ 12
Free cash flow ............................................................................................................................... 13
Net debt ........................................................................................................................................ 13
Put options .................................................................................................................................... 14
Contingent consideration ............................................................................................................. 14
Historic London Stock Exchange announcements (LSE announcements) and press releases ............. 15
Acquisitions and divestments ........................................................................................................... 15
News flow on key assets during the quarter and to date ................................................................. 15
Other news flow during the quarter and to date ............................................................................. 18

Page 2 of 19
New information for Q2 2018
GSK completes Consumer Healthcare buyout
On 1 June GlaxoSmithKline announced that it completed the buyout of Novartis’ 36.5% stake in its
Consumer Healthcare Joint Venture for $13 billion (£9.3 billion).
At 31 March 2018, the Consumer Healthcare Joint Venture put option was recognised in Other
payables in Current liabilities at a value of £9,179 million and represented the present value of the
agreed valuation of $13 billion following the announcement on 27 March 2018 of the agreement to
buyout Novartis’ interest in the Consumer Healthcare Joint Venture. Following settlement on 1 June
2018, liability was extinguished.
The balance sheet at the end of Q2 will reflect the increased debt from the transaction.
Foreign exchange
Average rates Quarterly
Q1 2017
Q2 2017
Q3 2017
Q4 2017
Q1 2018
Q2 2018
Key currencies
US$ 1.25 1.29 1.30 1.36 1.39 1.35
€ 1.17 1.15 1.13 1.15 1.13 1.15
Yen 141 143 148 148 151 147
Other currencies
Australian dollar 1.66 1.70 1.68 1.72 1.77 1.79
Brazilian real 3.96 4.16 4.15 4.37 4.53 4.89
Canadian dollar 1.66 1.72 1.66 1.72 1.76 1.74
Chinese yuan 8.60 8.80 8.76 8.84 8.82 8.68
Indian rupee 83.2 83.4 84.8 86.2 89.5 90.5
Russian rouble 73.6 74.4 77.0 77.8 79.0 83.4
FX impact on turnover +14% +9% +2% -3% -6% -4%
FX impact on adjusted EPS +22% +14% +3% -4% -13% n/a
Average rates for the quarter ended 30 June 2018 were $1.35/£, €1.15/£ and Yen 147/£. On the
basis of these rates, it is expected that the negative impact of foreign exchange on Q2 2018 sales will
be around 4%. As a result of the mix of currency movements relative to the mix of costs, we expect
that the negative impact of foreign exchange on Q2 2018 sterling Adjusted EPS will be greater than
the negative impact on sales.

Page 3 of 19
Average rates Cumulative - YTD
3M 2017
6M 2017
9M 2017
12M 2017
3M 2018
6M 2018
Key currencies
US$ 1.25 1.27 1.28 1.30 1.39 1.37
€ 1.17 1.16 1.15 1.15 1.13 1.14
Yen 141 142 144 145 151 149
Other currencies
Australian dollar 1.66 1.68 1.68 1.69 1.77 1.78
Brazilian real 3.96 4.06 4.09 4.16 4.53 4.71
Canadian dollar 1.66 1.69 1.68 1.69 1.76 1.75
Chinese yuan 8.60 8.70 8.72 8.75 8.82 8.75
Indian rupee 83.2 83.3 83.8 84.4 89.5 90.0
Russian rouble 73.6 74.0 75.0 75.7 79.0 81.2
FX impact on turnover + 14% +11% +8% +5% -6% -5%
FX impact on adjusted EPS +22% +17% +11% +7% -13% n/a
Average rates for the six months ended 30 June 2018 were $1.37/£, €1.14/£ and Yen 149/£. On the
basis of these rates, it is expected that the negative impact of foreign exchange on H1 2018 sales will
be around 5%. We also expect that the negative impact of foreign exchange on H1 2018 sterling
Adjusted EPS will likely be greater than the negative impact on sales.
The Q2 2018 period-end rates were $1.32/£, €1.13/£ and Yen 146/£.
Period end rates
Dec 2016
Mar 2017
June 2017
Sept 2017
Dec 2017
Mar 2018
Jun 2018
Key currencies
US$ 1.24 1.25 1.30 1.34 1.35 1.40 1.32
€ 1.17 1.17 1.14 1.13 1.13 1.14 1.13
Yen 144 139 146 151 152 149 146
Foreign exchange: Exchange Gains or (Losses)
Sharp movements and volatility in currencies during a quarter can result in Exchange Gains or Losses
(EGOLs) which are recorded in SG&A. During Q2 2018 there was continued volatility in a number of
currencies relative to Sterling.
EGOLs as reported (£m) Q1 Q2 Q3 Q4 Full Year
2016 (3) 0 11 (42) (34)
2017 (12) (20) (18) (12) (62)
2018 (32)
Page 4 of 19
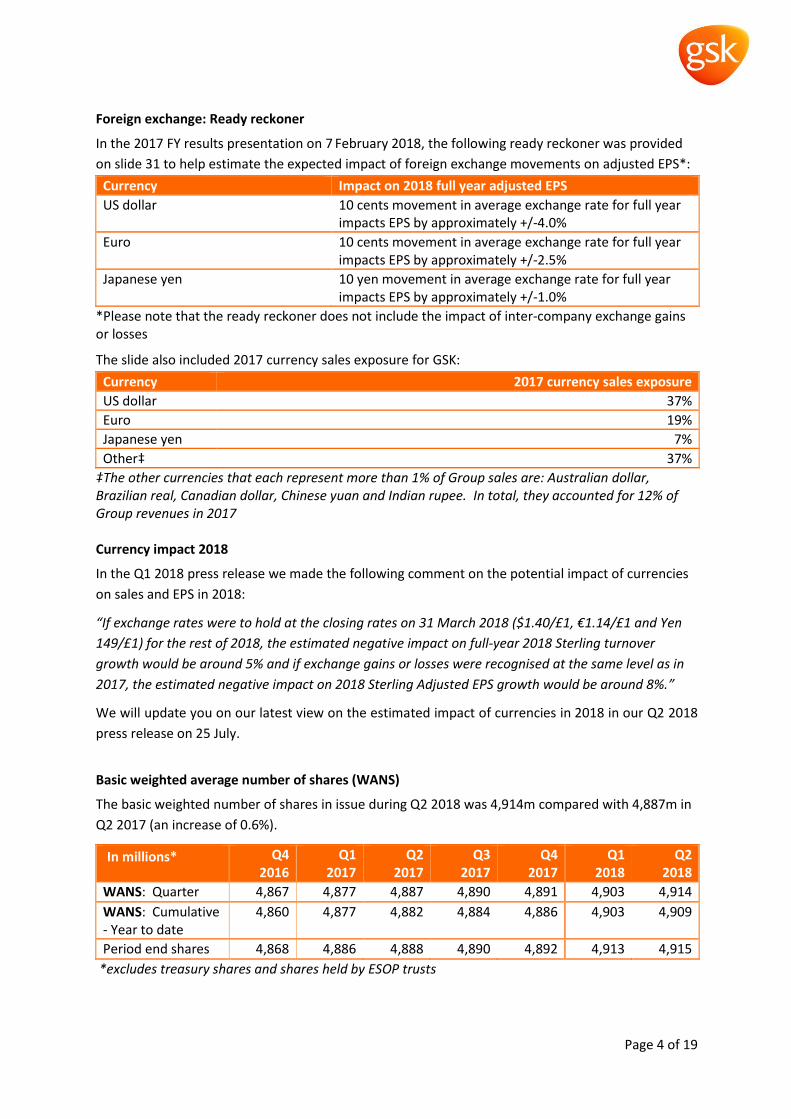
Foreign exchange: Ready reckoner
In the 2017 FY results presentation on 7 February 2018, the following ready reckoner was provided
on slide 31 to help estimate the expected impact of foreign exchange movements on adjusted EPS*:
Currency Impact on 2018 full year adjusted EPS
US dollar 10 cents movement in average exchange rate for full year impacts EPS by approximately +/-4.0%
Euro 10 cents movement in average exchange rate for full year impacts EPS by approximately +/-2.5%
Japanese yen 10 yen movement in average exchange rate for full year impacts EPS by approximately +/-1.0%
*Please note that the ready reckoner does not include the impact of inter-company exchange gains or losses
The slide also included 2017 currency sales exposure for GSK:
Currency 2017 currency sales exposure
US dollar 37%
Euro 19%
Japanese yen 7%
Other‡ 37%
‡The other currencies that each represent more than 1% of Group sales are: Australian dollar, Brazilian real, Canadian dollar, Chinese yuan and Indian rupee. In total, they accounted for 12% of Group revenues in 2017 Currency impact 2018
In the Q1 2018 press release we made the following comment on the potential impact of currencies
on sales and EPS in 2018:
“If exchange rates were to hold at the closing rates on 31 March 2018 ($1.40/£1, €1.14/£1 and Yen
149/£1) for the rest of 2018, the estimated negative impact on full-year 2018 Sterling turnover
growth would be around 5% and if exchange gains or losses were recognised at the same level as in
2017, the estimated negative impact on 2018 Sterling Adjusted EPS growth would be around 8%.”
We will update you on our latest view on the estimated impact of currencies in 2018 in our Q2 2018
press release on 25 July.
Basic weighted average number of shares (WANS)
The basic weighted number of shares in issue during Q2 2018 was 4,914m compared with 4,887m in
Q2 2017 (an increase of 0.6%).
In millions* Q4 2016
Q1 2017
Q2 2017
Q3 2017
Q4 2017
Q1 2018
Q2 2018
WANS: Quarter 4,867 4,877 4,887 4,890 4,891 4,903 4,914
WANS: Cumulative - Year to date
4,860 4,877 4,882 4,884 4,886 4,903 4,909
Period end shares 4,868 4,886 4,888 4,890 4,892 4,913 4,915
*excludes treasury shares and shares held by ESOP trusts

Page 5 of 19
Dividend
In the Q1 2018 press release we made the following comment on returns to shareholders:
“GSK recognises the importance of dividends to shareholders and aims to distribute regular dividend
payments that will be determined primarily with reference to the free cash flow generated by the
business after funding the investment necessary to support the Group’s future growth.
The Board intends to maintain the dividend for 2018 at the current level of 80p per share, subject to
any material change in the external environment or performance expectations. Over time, as free
cash flow strengthens, it intends to build free cash flow cover of the annual dividend to a target range
of 1.25-1.50x, before returning the dividend to growth”
Dividend per share (p)
Q1 Q2
Q3
Q4
Full Year
2016 19 19 19 23 80
2017 19 19 19 23 80
2018 - expected 19 80†
†The actual dividend amount is determined by the Board of Directors.
Factors impacting recent quarterly comparisons
As usual there were several events in 2018 to date and during 2017 which impact the year on year
comparisons for Q2 2018. This includes the following noteworthy items which you may wish to
consider in your modelling.
Please note that the items listed below are not intended to be a complete list of all items that may
impact the comparisons for Q2 2018 versus Q2 2017.
For further comments, please refer to quarterly press releases, presentations and transcripts.
Pharmaceuticals
Pharmaceuticals (£m)
Q1 2017
Q2 2017
Q3 2017
Q4 2017
FY 2017
Q1 2018
Total turnover 4,189 4,357 4,190 4,540 17,276 4,009
Reported growth - CER +4% +3% +2% +3% +3% +2%
Adjusted operating profit
1,440 1,464 1,426 1,597 5,927 1,329
Reported growth - CER +6% -5% +1% +4% +1% +0%
Adjusted operating margin
34.4% 33.6% 34.0% 35.2% 34.3% 33.2%
On the Q4 2017 results analyst/investor call on 7 February 2018, Simon Dingemans made the
following comments regarding pharmaceuticals:
“If we do not see a generic [Advair] in 2018, we expect the momentum in HIV and New Respiratory to
deliver low single-digit top line growth for Pharma overall, offsetting declines in older products,
Page 6 of 19
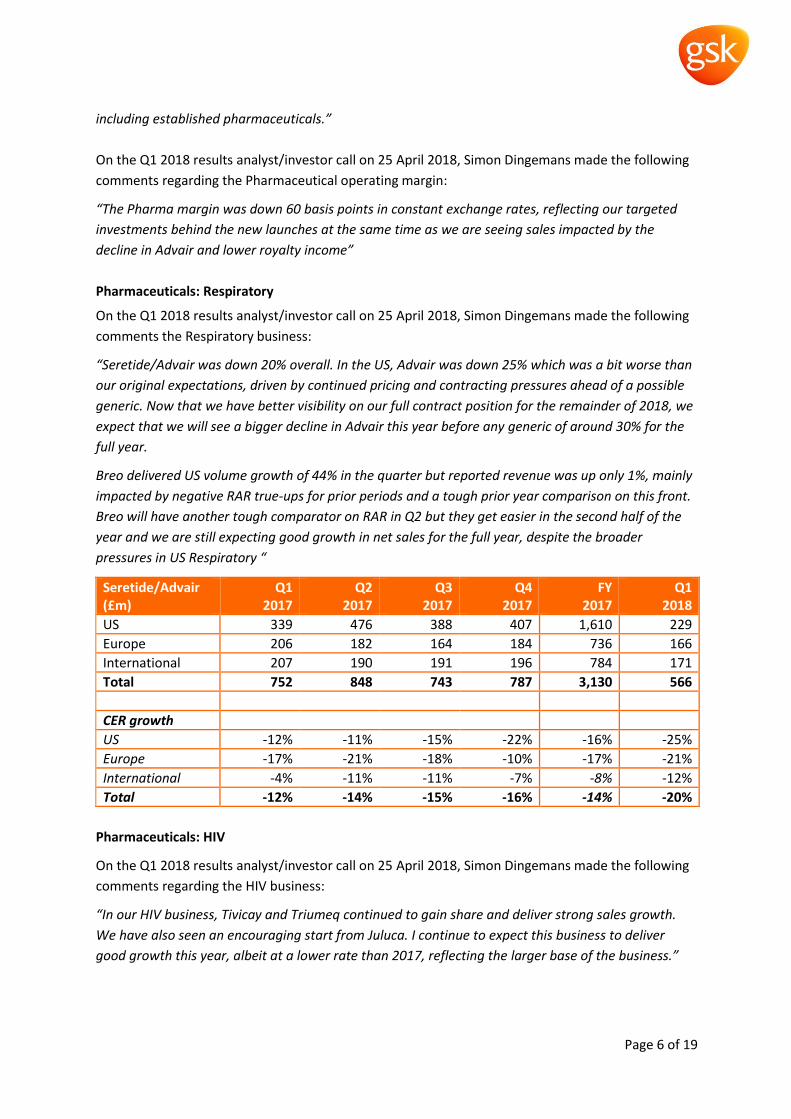
including established pharmaceuticals.”
On the Q1 2018 results analyst/investor call on 25 April 2018, Simon Dingemans made the following
comments regarding the Pharmaceutical operating margin:
“The Pharma margin was down 60 basis points in constant exchange rates, reflecting our targeted
investments behind the new launches at the same time as we are seeing sales impacted by the
decline in Advair and lower royalty income”
Pharmaceuticals: Respiratory
On the Q1 2018 results analyst/investor call on 25 April 2018, Simon Dingemans made the following
comments the Respiratory business:
“Seretide/Advair was down 20% overall. In the US, Advair was down 25% which was a bit worse than
our original expectations, driven by continued pricing and contracting pressures ahead of a possible
generic. Now that we have better visibility on our full contract position for the remainder of 2018, we
expect that we will see a bigger decline in Advair this year before any generic of around 30% for the
full year.
Breo delivered US volume growth of 44% in the quarter but reported revenue was up only 1%, mainly
impacted by negative RAR true-ups for prior periods and a tough prior year comparison on this front.
Breo will have another tough comparator on RAR in Q2 but they get easier in the second half of the
year and we are still expecting good growth in net sales for the full year, despite the broader
pressures in US Respiratory “
Seretide/Advair (£m)
Q1 2017
Q2 2017
Q3 2017
Q4 2017
FY 2017
Q1 2018
US 339 476 388 407 1,610 229
Europe 206 182 164 184 736 166
International 207 190 191 196 784 171
Total 752 848 743 787 3,130 566
CER growth
US -12% -11% -15% -22% -16% -25%
Europe -17% -21% -18% -10% -17% -21%
International -4% -11% -11% -7% -8% -12%
Total -12% -14% -15% -16% -14% -20%
Pharmaceuticals: HIV
On the Q1 2018 results analyst/investor call on 25 April 2018, Simon Dingemans made the following
comments regarding the HIV business:
“In our HIV business, Tivicay and Triumeq continued to gain share and deliver strong sales growth.
We have also seen an encouraging start from Juluca. I continue to expect this business to deliver
good growth this year, albeit at a lower rate than 2017, reflecting the larger base of the business.”
Page 7 of 19
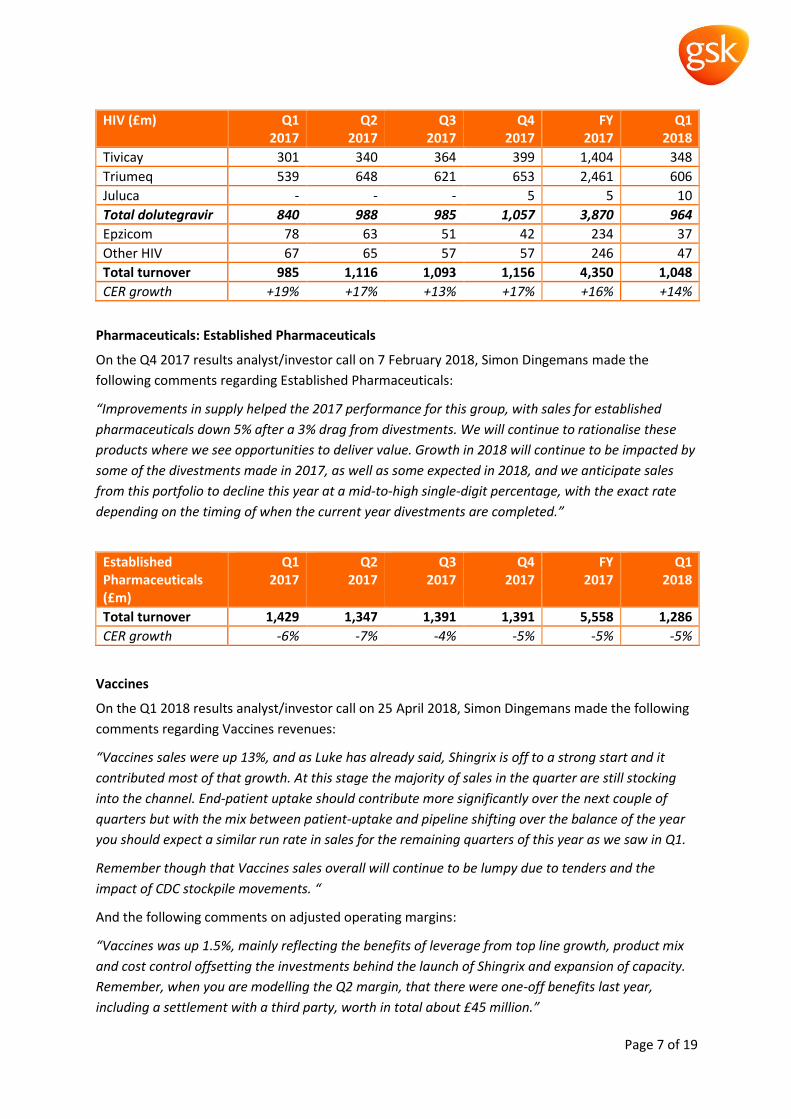
HIV (£m) Q1 2017
Q2 2017
Q3 2017
Q4 2017
FY 2017
Q1 2018
Tivicay 301 340 364 399 1,404 348
Triumeq 539 648 621 653 2,461 606
Juluca - - - 5 5 10
Total dolutegravir 840 988 985 1,057 3,870 964
Epzicom 78 63 51 42 234 37
Other HIV 67 65 57 57 246 47
Total turnover 985 1,116 1,093 1,156 4,350 1,048
CER growth +19% +17% +13% +17% +16% +14%
Pharmaceuticals: Established Pharmaceuticals
On the Q4 2017 results analyst/investor call on 7 February 2018, Simon Dingemans made the
following comments regarding Established Pharmaceuticals:
“Improvements in supply helped the 2017 performance for this group, with sales for established
pharmaceuticals down 5% after a 3% drag from divestments. We will continue to rationalise these
products where we see opportunities to deliver value. Growth in 2018 will continue to be impacted by
some of the divestments made in 2017, as well as some expected in 2018, and we anticipate sales
from this portfolio to decline this year at a mid-to-high single-digit percentage, with the exact rate
depending on the timing of when the current year divestments are completed.”
Established Pharmaceuticals (£m)
Q1 2017
Q2 2017
Q3 2017
Q4 2017
FY 2017
Q1 2018
Total turnover 1,429 1,347 1,391 1,391 5,558 1,286
CER growth -6% -7% -4% -5% -5% -5%
Vaccines
On the Q1 2018 results analyst/investor call on 25 April 2018, Simon Dingemans made the following
comments regarding Vaccines revenues:
“Vaccines sales were up 13%, and as Luke has already said, Shingrix is off to a strong start and it
contributed most of that growth. At this stage the majority of sales in the quarter are still stocking
into the channel. End-patient uptake should contribute more significantly over the next couple of
quarters but with the mix between patient-uptake and pipeline shifting over the balance of the year
you should expect a similar run rate in sales for the remaining quarters of this year as we saw in Q1.
Remember though that Vaccines sales overall will continue to be lumpy due to tenders and the
impact of CDC stockpile movements. “
And the following comments on adjusted operating margins:
“Vaccines was up 1.5%, mainly reflecting the benefits of leverage from top line growth, product mix
and cost control offsetting the investments behind the launch of Shingrix and expansion of capacity.
Remember, when you are modelling the Q2 margin, that there were one-off benefits last year,
including a settlement with a third party, worth in total about £45 million.”

Page 8 of 19
Sales of vaccines are vulnerable to volatility on a quarterly basis – particularly in emerging markets.
Since quarterly sales can be very lumpy due in part to the impact of large tenders as well as
competitor outages we highlight in the table below the 2017 and 2018 quarterly results for the
Vaccines business.
GSK Vaccines (£m)
Q1 2017
Q2 2017
Q3 2017
Q4 2017
FY 2017
Q1 2018
US 363 316 816 374 1,869 489
Europe 389 394 431 386 1,600 389
International 400 401 442 448 1,691 360
Total turnover 1,152 1,111 1,689 1,208 5,160 1, 238
Adjusted operating profit
341 374 698 231 1,644 339
Adjusted operating margin
29.6% 33.7% 41.3% 19.1% 31.9% 27.4%
CER growth
US +21% +12% +6% +16% +12% +50%
Europe +4% +10% +6% +2% +6% -3%
International +25% -5% -14% +9% +1% -6%
Total turnover +16% +5% +0% +9% +6% +13%
Adjusted operating profit
+22% +30% +5% -3% +11% +18%
Consumer Healthcare
On the Q1 2018 results analyst/investor call on 25 April 2018, Simon Dingemans made the following
comments regarding Consumer Healthcare revenues:
“Consumer reported 2% growth after a drag of 2% from the combined impact of TDS generics and
the GST in India which will also impact Q2 growth.
The global power brands again delivered high single digit growth and for the business overall we saw
about 2% volume growth with price contributing about 1%, although this was offset by the impact of
GST. For the year, we continue to expect a low single digit percentage top line growth for the
Consumer business overall.”
And the following comments on adjusted operating margins
“The Consumer margin had a particularly strong quarter, up 270 basis points, driven by sales
leverage, product mix and the phasing of some promotional spend that will impact Q2 progression,
where we are also up against a tough comparator”

Page 9 of 19
GSK Consumer Healthcare (£m)
Q1 2017
Q2 2017
Q3 2017
Q4 2017
FY 2017
Q1 2018
Turnover 2,043 1,852 1,964 1,891 7,750 1,975
CER growth +2% +0% +2% +4% +2% +2%
Adjusted operating profit 351 328 392 302 1,373 384
CER growth -2% +16% +19% +12% +11% +18%
Adjusted operating margin 17.2% 17.7% 20.0% 16.0% 17.7% 19.4%
Corporate and other unallocated and costs
Adjusted corporate and other unallocated operating profit (costs) (£m)
Q1
Q2 Q3
Q4
Full Year
2016 (168) (31) (35) (128) (362)
2017 (153) (83) (48) (92) (376)
2018 (129)

Page 10 of 19
Operating and financial performance
Operating performance
Year-on-year annual cost savings (per Q4 2017 results presentation)
Annual savings
(£bn)*
2016
December
achieved
2017
December
achieved
2018
December
expected
2019
December
expected
2020
December
expected
Annual savings at 2015 FX 2.8 3.3 3.5 3.7 4.0
Cumulative FX benefit 0.2 0.4 0.4 0.4 0.4
Total savings
delivered/expected 3.0 3.7 3.9 4.1 4.4
* Expected phasing of annual savings. All expectations and targets regarding future performance
should be read together with “Assumptions related to 2018 guidance and 2016-2020 outlook” and
“Assumptions and cautionary statement regarding forward-looking statements” on page 22 of our
Q1 2018 earnings release dated 25 April 2018.
In the Q1 2018 press release we made the following comments on restructuring:
“Cash payments made in the quarter were £104 million (Q1 2017: £213 million) including the
settlement of certain charges accrued in previous quarters. The programme delivered incremental
annual cost savings in the quarter of £0.1 billion.
Charges for the combined restructuring and integration programme to date are £4.8 billion, of which
cash charges are £3.5 billion. Cash payments of £3.2 billion have been made to date. Non-cash
charges are £1.3 billion.
Total cash charges of the programme are now expected to be approximately £4.1 billion and non-
cash charges up to £1.6 billion. The programme has now delivered approximately £3.7 billion of
annual savings, including a currency benefit of £0.4 billion. The programme is now expected to deliver
by 2020 total annual savings of £4.0 billion on a constant currency basis, together with an estimated
£0.4 billion of currency benefits on the basis of Q1 2018 average exchange rates.”
Research and development
Adjusted R&D costs (£m)
Q1 2017
Q2* 2017
Q3 2017
Q4 2017
FY 2017
Q1 2018
R&D 919 1,053 898 992 3,862 887
Reported growth - CER +8% +24% +1% +0% +8% +2%
*R&D in Q2 2017 includes £106m cost of the Priority Review Voucher.
On the Q1 2018 results analyst/investor call on 25 April 2018, Simon Dingemans made the following
comments regarding R&D costs:
“R&D was up 2% reflecting investments in advancing our priority programmes, partly offset by
savings from the refocusing in R&D that we began last year. We will see additional benefits from the
exit of a number of programmes but we intend to reallocate most of that spend elsewhere in R&D
over the balance of the year. However, the expected phasing of that investment will likely impact the

Page 11 of 19
second half more than Q2 which will also benefit as in Q1 from the comparison to investments last
year as well as for Q2 specifically the PRV that we used in the HIV business.”
Royalty income
On the Q1 2018 results analyst/investor call on 25 April 2018, Simon Dingemans made the following
comments regarding royalty income:
“Our royalties were £53 million versus £82 million in Q1 last year as payments from sales of Cialis
ended in Q4. We continue to expect total royalties to be around £200 million in 2018.”
Adjusted royalties (£m)
Q1 Q2
Q3
Q4
Full Year
2016 91 83 107 117 398
2017 82 98 107 69 356
2018 outlook 53 Around £200m
Financial performance
Net finance costs
On the Q1 2018 results analyst/investor call on 25 April 2018, Simon Dingemans made the following
comments regarding net finance costs:
“We continue to expect funding costs for the year to be broadly similar to 2017, before the additional
costs of the Novartis buy-out come in after 1 June. We continue to expect that the overall funding
costs for the Novartis transaction will be between 2% and 3%.”
Adjusted net finance costs (£m)
Q1 Q2
Q3
Q4
Full Year
2016 (159) (163) (160) (170) (652)
2017 (169) (176) (177) (135)* (657)
2018 (139)**
*includes £23m credits for interest on tax resulting from a number of settlements during the year
** includes the benefit of a one-off accounting adjustment to the amortisation of long term bond
interest charges of £20 million
Associates and joint ventures
Adjusted associates and joint ventures (£m)
Q1 Q2 Q3 Q4 Full Year
2016 0 (2) 6 1 5
2017 5 (1) 7 2 13
2018 9

Page 12 of 19
Taxation
Adjusted tax rate (%)
Q1 Q2
Q3
Q4
Full Year
2016 21.4% 21.3% 20.8% 21.9% 21.3%
2017 22.0% 21.2% 21.0% 20.0% 21.0%
2018 outlook 20.2% 19% to 20%
On the Q1 2018 results analyst/investor call on 25 April 2018, Simon Dingemans made the following
comments regarding taxation:
“On tax, due to some phasing of settlements, the adjusted rate was 20.2% in Q1, but we continue to
expect a rate of 19% to 20% for the full year. “
Profit / (loss) attributable to non-controlling interests (minority interests)
On the Q1 2018 results analyst/investor call on 25 April 2018, Simon Dingemans made the following
comments regarding minority interests:
“The charge for minorities in Q1 was £224 million, compared to £199 million a year ago, primarily
reflecting the progress in both the HIV and Consumer businesses. Clearly, after the Novartis
transaction has closed, this charge will go down substantially”
Adjusted profit/(loss) attributable to non-controlling interests (£m)
FY 2016
Q1 2017
Q2 2017
Q3 2017
Q4 2017
FY 2017
Q1 2018
ViiV 324 113 81 117 103 414 111
Novartis Consumer Healthcare
288
74 80 105 85 344
102
Other 25 12 13 6 4 35 11
Total 637 199 174 228 192 793 224
Total results
In the Q1 2018 press release we made the following comments:
“Total operating profit was £1,240 million in Q1 2018 compared with £1,718 million in Q1 2017. The
reduction in operating profit reflected the increased impact of accounting charges related to re-
measurement of the liability for the Consumer Healthcare put option and the benefit in Q1 2017 of
the gain on the disposal of the anaesthesia business, as well as continuing price pressure, particularly
in Respiratory, and supply chain investments, partly offset by tight control of ongoing costs and
reduced restructuring costs.
.… Total earnings per share was 11.2p, compared with 21.4p in Q1 2017. The reduction in earnings
per share primarily reflected the increased impact of charges arising from increases in the valuation
of the liability for the Consumer Healthcare put option and the benefit in Q1 2017 from the gain on
disposal of the anaesthesia business. This was partly offset by improved trading performance and
reduced restructuring and legal costs. “

Page 13 of 19
Free cash flow
Free cash flow (£m)
Q1 Q2
H1
Q3 9M Q4 FY
2016 (240) 303 63 1,209 1,272 1,742 3,014
2017 650 (282) 368 1,276 1,644 1,793 3,437
2018 324
On the Q1 2018 results analyst/investor call on 25 April 2018, Simon Dingemans made the following
comments regarding Cashflow:
“Turning to cash generation and net debt, we remain focused on driving greater cash discipline across
the Group. Free cash flow is down £326 million versus Q1 last year, mainly as a result of the impact of
the £317 million payment to Novartis in relation to the Vaccines business. Cash flow was also impacted
by currency, with a drag of around £200 million in the quarter as sterling strengthened. We have offset
this headwind through improved cash generation from tighter working capital control, reduced
restructuring spend and lower capex.
Similar to last year, we expect our 2018 cash flows to be weighted to the second half of the year, even
before the expected accretion from the Novartis buy-out.”
Additionally, in the Q4 2017 press release we made the following comments relating to cash
restructuring:
“Cash payments made were £555 million (2016: £1,077 million), including the settlement of certain
charges previously accrued, but also reflecting the deferral of some payments into 2018. Cash
payments of approximately £0.5 billion are expected in 2018.”
Net debt
Net debt (£m)
31 Mar 30 Jun
30 Sep
31 Dec
2016 12,495 14,910 14,663 13,804
2017 13,743 14,800 14,209 13,178
2018 13,377
In the Q1 2018 press release we made the following comments:
“At 31 March 2018, net debt was £13.4 billion, compared with £13.2 billion at 31 December 2017,
comprising gross debt of £17.5 billion and cash and liquid investments of £4.1 billion. Net debt
increased as the reduced free cash flow of £0.3 billion, reflecting the milestone payment to Novartis,
together with a £0.3 billion favourable exchange impact from the translation of non-Sterling
denominated debt, was more than offset by the dividends paid to shareholders of £0.9 billion.
At 31 March 2018, GSK had short-term borrowings (including overdrafts) repayable within 12 months
of £3.4 billion with loans of £1.3 billion repayable in the subsequent year.”

Page 14 of 19
Put options
In the Q1 2018 press release we made the following comments:
“At 31 March 2018, the Consumer Healthcare Joint Venture put option was recognised in Other
payables in Current liabilities at a value of £9,179 million and represented the present value of the
agreed valuation of $13 billion following the announcement on 27 March 2018 of the agreement to
buyout Novartis’ interest in the Consumer Healthcare Joint Venture (31 December 2017: £8,606
million). This is expected to be settled on 1 June 2018, at which point the liability will be extinguished.
The estimated present value of the potential redemption amount of the Pfizer put option related to
ViiV Healthcare, also recorded in Other payables in Current liabilities, was £1,243 million (31
December 2017: £1,304 million).“
Put options (£m)
31 Dec
2016
31 Mar
2017
30 Jun
2017
30 Sep
2017
31 Dec
2017
31 Mar
2018
Consumer Healthcare joint venture
7,420 7,541 8,271 8,243 8,606 9,179
ViiV Healthcare 1,319 1,205 1,259 1,221 1,304 1,243
Total 8,739 8,746 9,530 9,464 9,910 10,422
Contingent consideration
In the Q1 2018 press release we made the following comments:
“Contingent consideration amounted to £5,610 million at 31 March 2018 (31 December 2017: £6,172
million), of which £5,314 million (31 December 2017: £5,542 million) represented the estimated
present value of amounts payable to Shionogi relating to ViiV Healthcare and £251 million (31
December 2017: £584 million) represented the estimated present value of contingent consideration
payable to Novartis related to the Vaccines acquisition. A milestone payment of $450 million was
made to Novartis in January 2018. The liability due to Shionogi included £215 million in respect of
preferential dividends. The liability for preferential dividends due to Pfizer at 31 March 2018 was £17
million (31 December 2017: £17 million).
Contingent consideration (£m)
31 Dec
2016
31 Mar
2017
30 Jun
2017
30 Sep
2017
31 Dec
2017
31 Mar
2018
Shionogi – relating to ViiV Healthcare
5,304 5,193 5,351 5,224 5,542 5,314
Novartis – relating to Vaccines acquisition
545 554 646 648 584 251
Other 47 47 46 45 46 45
Total 5,896 5,794 6,043 5,917 6,172 5,610

Page 15 of 19
Historic London Stock Exchange announcements (LSE announcements) and press releases
Acquisitions and divestments
GSK completes Consumer Healthcare buyout
• GlaxoSmithKline plc (LSE/NYSE: GSK) today announces that it has completed the buyout of
Novartis’ 36.5% stake in its Consumer Healthcare Joint Venture for $13 billion (£9.3 billion).
The transaction, which was previously announced on 27 March 2018 and described in the circular
published on 13 April 2018, was approved by shareholders on 3 May 2018.
(LSE announcement 01 June 2018)
GSK signs strategic agreement to transfer rare disease gene therapy portfolio to Orchard
Therapeutics
• Agreement strengthens Orchard’s position as a global leader in gene therapy for rare
diseases.
• GSK takes 19.9% equity stake in Orchard and seat on board.
GSK and Orchard Therapeutics today announced a strategic agreement, under which GSK will
transfer its portfolio of approved and investigational rare disease gene therapies to Orchard,
securing the continued development of the programmes and access for patients. This acquisition
strengthens Orchard’s position as a global leader in gene therapy for rare diseases. GSK will continue
to invest in the development of its platform capabilities in cell and gene therapies, with a focus on
oncology. (Press release 12 April 2018)
News flow on key assets during the quarter and to date
Since the beginning of Q2 2018 we have issued several LSE announcements and press releases, each
of which can be accessed using the following links:
http://www.gsk.com/en-gb/media/press-releases/
http://us.gsk.com/en-us/media/press-releases/
ViiV Healthcare reports landmark phase III studies for dolutegravir and lamivudine, demonstrating
the ability to control HIV with a two-drug regimen in treatment naïve patients
• GEMINI 1&2 studies meet primary endpoint, demonstrating similar efficacy of two-drug
regimen compared to standard three-drug regimen
• Full results from the studies will be presented at an upcoming scientific meeting
ViiV Healthcare today announced positive headline results from its phase III GEMINI study
programme. The studies (GEMINI-1 and GEMINI-2) are designed to evaluate the safety and efficacy
of a two-drug regimen (2DR) of dolutegravir and lamivudine compared to a three-drug regimen of
dolutegravir and two nucleoside reverse transcriptase inhibitors, tenofovir disoproxil
fumarate/emtricitabine (TDF/FTC), in treatment naïve HIV-1 infected adults with baseline viral loads
less than 500,000 copies per ml.
The studies met their primary endpoint for non-inferiority based on plasma HIV-1 RNA <50 copies
per millilitre (c/mL), a standard measure of HIV control, at Week 48. The safety results for the 2DR of

Page 16 of 19
dolutegravir and lamivudine were consistent with the product labelling for the medicines. No
patient who experienced virologic failure in either treatment arm developed treatment-emergent
resistance. (LSE announcement 14 June 2018)
GSK submits regulatory application in Japan for once-daily single inhaler triple therapy
FF/UMEC/VI for patients with COPD
• GlaxoSmithKline plc (LSE/NYSE: GSK) and Innoviva, Inc. (NASDAQ: INVA) today announced
the submission of a regulatory application to the Japanese Ministry of Health, Labour and
Welfare (MHLW) for once-daily fluticasone furoate/umeclidinium/vilanterol (FF/UMEC/VI
100/62.5/25 mcg) under the proposed brand name of Trelegy Ellipta for the treatment of
adults with chronic obstructive pulmonary disease (COPD). This is the first regulatory filing
to be made in Japan for a triple COPD therapy in a single inhaler.
Dave Allen, Head, Respiratory Therapy Area R&D, GSK said: “COPD is a debilitating lung disease
affecting over five million people in Japan. Many patients require combination treatment with
different types of medicines to reduce both symptoms and exacerbations but there is currently no
triple therapy available in Japan delivered in a single inhaler. If approved, once-daily FF/UMEC/VI
delivered in the Ellipta would be an important innovation in the management of COPD in Japan
alongside our current range of treatments.” (LSE announcement 29 May 2018)
ViiV Healthcare receives EU marketing authorisation for Juluca (dolutegravir/rilpivirine), the first 2-
drug regimen, once-daily, single-pill for the treatment of HIV
• Juluca maintains viral suppression with two drugs in the smallest single pill regimen
ViiV Healthcare, the global specialist HIV company, majority owned by GlaxoSmithKline, with Pfizer
Inc. and Shionogi Limited as shareholders, today announced that the European Commission has
granted marketing authorisation for Juluca (dolutegravir 50mg/rilpivirine 25mg) for the treatment of
human immunodeficiency virus type 1 (HIV-1) infection in adults who are virologically suppressed
(HIV-1 RNA <50 copies/mL) on a stable antiretroviral regimen for at least six months with no history
of virological failure and no known or suspected resistance to any non-nucleoside reverse
transcriptase inhibitor or integrase inhibitor. Juluca is a 2-drug regimen of dolutegravir (ViiV
Healthcare), the most widely prescribed integrase inhibitor worldwide, and rilpivirine (Janssen
Sciences Ireland UC, part of the Janssen Pharmaceutical Companies of Johnson & Johnson).
(LSE announcement 21 May 2018)
GSK receives US approval of Arnuity Ellipta for use in children from 5 years old who suffer from
asthma
GSK today announced it has received approval from the US Food and Drug Administration (FDA) for
the use of Arnuity Ellipta (fluticasone furoate) a once-daily inhaled corticosteroid (ICS) medicine for
the maintenance treatment of asthma in children from as young as 5 years. This makes Arnuity one
of the few once-daily treatments for asthma licenced in the US in this younger age group, where
there remains a significant need for convenient and effective treatment options.
(Press release 21 May 2018)

Page 17 of 19
Nucala (mepolizumab) study reports long-term safety data, consistent exacerbation reduction and
improved asthma control
• New study showed one third of patients had no exacerbations on long-term treatment
with Nucala.
GlaxoSmithKline plc (GSK) today presented new data from the longest study of an anti-IL5 biologic
treatment in severe eosinophilic asthma to be reported. The study showed consistent reductions in
exacerbations and improvements in asthma control, with a safety profile similar to previous clinical
studies, in severe eosinophilic asthma patients treated with Nucala (mepolizumab) over the long-
term study period. One third of patients in the study treated with mepolizumab experienced no
exacerbations, despite entering the study with an average of almost two exacerbations (1.74) per
year. (Press release 21 May 2018)
GSK’s industry-leading respiratory research and scientific innovation showcased at ATS conference
GlaxoSmithKline plc (GSK) will present extensive data from across its respiratory portfolio, pipeline
and early phase research programmes at the American Thoracic Society (ATS) conference in San
Diego, USA, 19-23 May 2018. Data presented in 61 abstracts provide evidence on optimising the
treatment and understanding of lung diseases. (Press release 16 May 2018)
Once-daily Trelegy Ellipta gains expanded indication in the US for the treatment of patients with
COPD
GlaxoSmithKline plc (LSE/NYSE: GSK) and Innoviva, Inc. (NASDAQ: INVA) today announced that the
US Food and Drug Administration (FDA) has approved an expanded indication for Trelegy Ellipta
(fluticasone furoate/umeclidinium/vilanterol ‘FF/UMEC/VI’), which means this medicine can now be
used by US physicians to treat a broader population of chronic obstructive pulmonary disease
(COPD) patients with airflow limitation or who have experienced an acute worsening of respiratory
symptoms. (LSE announcement 24 April 2018)
Landmark IMPACT study published in NEJM shows significant benefits of Trelegy Ellipta for
patients with COPD
• Once-daily single inhaler triple therapy superior to Relvar/Breo Ellipta and Anoro Ellipta
across multiple endpoints including exacerbations, lung function and quality of life.
GlaxoSmithKline plc (LSE/NYSE: GSK) and Innoviva, Inc. (NASDAQ: INVA) today announced the
publication in the New England Journal of Medicine (NEJM) of the landmark IMPACT study, one of
the biggest ever conducted in patients with chronic obstructive pulmonary disease (COPD) with a
history of exacerbation.
In the study, Trelegy Ellipta (fluticasone furoate/umeclidinium/vilanterol, ‘FF/UMEC/VI’
100/62.5/25mcg) achieved superiority to members of two different classes of dual combination
therapy, Relvar/Breo (FF/VI) and Anoro (UMEC/VI), on the primary endpoint of reduction in the
annual rate of on-treatment moderate/severe exacerbations (p<0.001) and a range of other clinically
important outcomes, including lung function and health-related quality of life.
Results from additional secondary and other endpoints published today, include:

Page 18 of 19
• A statistically significant 34% reduction in COPD hospitalisations (severe exacerbations) for
Trelegy compared to Anoro (0.13 vs. 0.19 per year; p<0.001) and a reduction of 13%
compared to Relvar/Breo which was not statistically significant (0.13 vs. 0.15; p=0.064).
• A significant reduction in the risk of on-treatment all-cause mortality was observed for both
inhaled corticosteroid containing arms compared to Anoro.
• A 42.1% reduction in the risk of on-treatment all-cause mortality was observed for Trelegy
compared to Anoro (1.20% vs. 1.88%; p=0.011).
To fully understand the implications of the all-cause mortality observation, off-treatment data also
need to be considered. Work is ongoing to investigate this further and will be presented at future
scientific meetings. (LSE announcement 18 April 2018)
Other news flow during the quarter and to date
GSK announces changes to Vaccines and Global Manufacturing & Supply leadership
GlaxoSmithKline plc (LSE/NYSE: GSK) today announced that Luc Debruyne, President, Vaccines, is to
leave GSK at the end of the year. Roger Connor, currently GSK's President, Global Manufacturing &
Supply (GMS), will become President, Vaccines on 1 September.
During a 27-year career at GSK, Luc has held a number of roles including General Manager for the
Company in the Netherlands and Italy and Senior Vice President of the Pharmaceuticals business in
Europe. For the last 5 years he has been President, Vaccines overseeing the successful integration of
the Novartis vaccines business, including the R&D portfolios and manufacturing networks, aligning
resources to priority projects, preparation of the Shingrix launch and building a stronger presence in
the US.
Roger Connor has been on the Corporate Executive Team (CET) since 2012 as President, GMS and
has led the strategic transformation of GSK's supply chain to support improved quality and supply
performance. He has a proven track record of leading a complex, global organisation, developing
organisational capability and driving cultural transformation.
With effect from 1 September, Regis Simard is appointed President, Pharmaceutical Supply Chain
and will join CET. Regis is currently SVP Global Pharma Manufacturing and joined GSK in 2005 as a
site director in France, having previously worked in the electronics, medical devices and
pharmaceutical industries. (LSE announcement 12 June 2018)
Simon Dingemans, Chief Financial Officer, to retire from GSK
GlaxoSmithKline plc (LSE/NYSE: GSK) today announced that Simon Dingemans, Chief Financial Officer
(CFO), GSK, has informed the Board of his intention to retire from the Company and to step down
from the Board in May 2019.
The Board will now conduct a thorough global search both internally and externally to identify a
successor. (LSE announcement 09 May 2018)

Page 19 of 19
GSK appoints Kevin Sin as new SVP and Head of Worldwide Business Development for R&D
• Critical role appointed as part of ongoing activities to strengthen and accelerate the
Pharmaceuticals pipeline
GlaxoSmithKline plc (GSK) today announced the appointment of Kevin Sin as Senior Vice President
and Head of Worldwide Business Development for Pharmaceuticals Research & Development. In this
position, Kevin will play a critical role in strengthening GSK’s pharmaceutical pipeline and identifying
enabling technologies to enhance delivery of innovative new medicines for patients.
(Press release 18 April 2018)
In order to illustrate underlying performance, it is the Group’s practice to discuss its results in terms
of constant exchange rate (CER) growth. This represents growth calculated as if the exchange rates
used to determine the results of overseas companies in Sterling had remained unchanged from
those used in the comparative period. All commentaries are presented in terms of CER growth,
unless otherwise stated.
Analyst/Investor enquiries: Sarah Elton-Farr + 44 (0) 20 8047 5194 (London)
James Dodwell + 44 (0) 20 8047 2406 (London)
Jeff McLaughlin + 1 215 751 7002 (Philadelphia)
Danielle Smith +44 (0) 20 8047 7562 (London)