PRE-CLINICAL ASSESSMENT OF GENETIC AND …
213
i PRE-CLINICAL ASSESSMENT OF GENETIC AND NEUROBIOCHEMICAL MARKERS FOR DEPRESSIVE BEHAVIOR AND ANTIDEPRESSANT RESPONSE Cristina S. Benton A dissertation submitted to the faculty of the University of North Carolina at Chapel Hill in partial fulfillment of the requirements for the degree of Doctor of Philosophy in the School of Pharmacy Chapel Hill 2011 Approved by: Tim Wiltshire, PhD Howard McLeod, PharmD Patrick Sullivan, PhD J.Heyward Hull, PharmD Oscar Alzate, PhD
Transcript of PRE-CLINICAL ASSESSMENT OF GENETIC AND …

i
PRE-CLINICAL ASSESSMENT OF GENETIC AND NEUROBIOCHEMICAL MARKERS
FOR DEPRESSIVE BEHAVIOR AND ANTIDEPRESSANT RESPONSE
Cristina S. Benton
A dissertation submitted to the faculty of the University of North Carolina at Chapel Hill in
partial fulfillment of the requirements for the degree of Doctor of Philosophy in the School of
Pharmacy
Chapel Hill
2011
Approved by:
Tim Wiltshire, PhD
Howard McLeod, PharmD
Patrick Sullivan, PhD
J.Heyward Hull, PharmD
Oscar Alzate, PhD

ii
ABSTRACT
CRISTINA S. BENTON: Pre-clinical Assessment of Genetic and Neurobiochemical Markers for
Depressive Behavior and Antidepressant Response
(Under the direction of Dr. Tim Wiltshire)
Feeling sad and blue,
Is there a marker for you?
Tell me, am I blue?
Identification of biomarkers that can establish diagnosis or treatment response is critical
to the advancement of research and management of patients with major depressive disorder.
Biomarkers can be used objectively to evaluate clinical progression and response to
antidepressant therapy. To identify genetic and neurobiochemical biomarkers of antidepressant
response, we compared behavior, gene expression, and levels of thirty-six neurobiochemical
analytes proposed to affect anxiety and mood disorders between water and fluoxetine-treated
mice in a panel of genetically diverse mouse inbred lines. While responses in the open field (OF)
and tail suspension test (TST) contribute to baseline inter-strain differences, chronic fluoxetine
treatment predominantly affected behavior in the TST, indicating that the TST is sensitive to the
antidepressive effects of fluoxetine. We found that levels of glyoxylase1 (GLO1) and guanine
nucleotide binding protein (GNB1) account for most of the covariance in baseline anxiety-like
and depressive-like behavior. Overall difference in neurobiochemical levels were observed for
positive and negative responders. Biochemical alterations following chronic fluoxetine treatment
discriminated positive responders, while baseline neurobiochemical differences differentiated

iii
negative responders. Results show that glial fibrillary acidic protein (GFAP), S100 beta protein
(S100β), GLO1, and histone deacytelase 5 (HDAC5) contributed most to fluoxetine response.
These proteins are linked within a cellular growth/proliferation pathway, suggesting that positive
responses to antidepressants are likely due to increased cellular genesis. In addition, a candidate
genetic locus that associates with baseline depressive-like behavior contains a gene that encodes
for cellular proliferation/adhesion molecule (Cadm1), supporting a genetic basis for the role of
neuro/gliogenesis in depression. By using a multi-faceted approach that investigates connections
on genetic, neurobiochemical, and behavioral levels, we were able to identify genetic and
neurobiochemical markers that can potentially assess risk for despair and poor treatment
outcome. Importantly, our research study provides an innovative and powerful platform for pre-
clinical assessment of antidepressant drugs in depressive-like susceptible strains and non-
responsive lines.

iv
This dissertation is dedicated to Mrs. C and her family.
I still remember!

v
ACKNOWLEDGMENTS
I feel truly blessed to have met so many generous, supportive, and inspiring people over
the years. The words on this page can never fully describe the gratitude I feel for the countless
contributions many people have made towards my academic development
To my advisor Tim Wiltshire who taught me by example and through helpful discussions
how to ask the right questions, think through a problem, and imagine a better scenario. Because
of you, I learned to not just focus on finding the solution but to also remember and appreciate the
things I learned in the process
To my committee members Howard McLeod, Patrick Sullivan, Heyward Hull, and Oscar
Alzate for their thoughtful criticisms, helpful comments, and encouraging words
To Lisa Tarantino and Sheryl Moy for letting me use their behavioral equipments and for their
guidance with behavioral tests
To my professors for their challenging courseworks, interesting stories, and take-home
messages: Kim Brouwer, Gary Pollack, Herb Patterson, Roy Hawke, Dhirren Thakker, Mary
Paine, Angela Kashuba, Craig Lee, and Amanda Corbett
To the members of the Wiltshire/Tarantino lab for never making a day in the lab dull: Joe
Farrington, Emmanuel Chan, Natasha Butz, Amber Frick, Agi Cholka, Matt Duan, Camille
Kapita, Robin Ervin, Nancy Young, and Hedi Liu
To Sam Segall, Amy Eisener-Dorman, and Oscar Suzuki for their assistance with
experiments and thesis writing

vi
To my colleagues who were always enthusiastic of my work: Katie Theken, Latoya
Griffin, Tae Eun Kim, Grace Yan, Christina Won, Michael Cohen-Wolkowiez, Jasmine
Talameh, Dan Hertz, Bob Schuck, Nate Pfeiffer, Gina Song, Dan Crona, Whitney Caron, Mark
Walsh, Anand Khandoobai, Jonathan Hughes, and Julie Dumond
To the UNC ESOP staff members who assisted me in filling out the appropriate forms
required to advance and complete the doctoral program: Amber Allen, Kathy Maboll, and Arlo
Brown
To the GSO and GEC committees for their time and continued support of the graduate
program
To my very kind, loving, giving, and thoughtful support group who always told me that
things will work out and who were always there when things didn‟t: Sarah Schrieber, Trang
Nguyen, Betsy Philip, Lynda Le, Tan Hoang, Maria Lai Chang, Chris and Meredith Gowen,
Aaron and Jasmine Prebles, Paul and Kristina Brock, Brian and Michelle Sizemore, Mary
Cameron Caison, and Brett Swanson
To my family, particularly to my parents, for their sacrificial love, patience, support, and
prayers during my long educational experience
To Samuel Benton III, you are my true friend, my devoted fan, my life preserver, and my
inspiration. Thank you for making me feel special and loved beyond words
And finally, to our Heavenly Father for showering me with amazing grace that I did not deserve

vii
TABLE OF CONTENTS
LIST OF TABLES .............................................................................................................................................. X
LIST OF FIGURES ........................................................................................................................................... XI
LIST OF ABBREVIATIONS .................................................................................................................... XIII
CHAPTER 1 ....................................................................................................................................... 14
BIOLOGICAL ALTERATIONS IN DEPRESSION ....................................................................................... 14
1. INTRODUCTION .......................................................................................................................................... 2
2. GENETIC STUDIES...................................................................................................................................... 3
2.1 GENETIC PREDICTORS OF DEPRESSION AND ANTIDEPRESSANT RESPONSE ............................................ 4
3. BIOCHEMICAL ALTERATIONS .................................................................................................................... 8
6. BRAIN AND MOLECULAR CORRELATES .................................................................................................. 20
7. DEPRESSION SIGNATURES ....................................................................................................................... 25
8. OTHER MECHANISMS .............................................................................................................................. 28
9. OUR APPROACH: IDENTIFICATION OF GENETIC AND NEUROBIOCHEMICAL MARKERS FOR DEPRESSION
AND FLUOXETINE RESPONSE USING A PANEL OF GENETICALLY DIVERSE MOUSE INBRED STRAINS ........... 32
10. FIGURES ................................................................................................................................................. 34
11. REFERENCES .......................................................................................................................................... 35
OTHER RESOURCES ..................................................................................................................................... 66

viii
CHAPTER 2 ....................................................................................................................................... 67
IDENTIFICATION OF QUANTITATIVE TRAIT LOCI FOR DEPRESSION AND ANXIETY IN MULTIPLE MOUSE INBRED STRAINS .............................................................................................................................. 67
1. INTRODUCTION ........................................................................................................................................ 68
2. MATERIALS AND METHODS .................................................................................................................... 69
2.1 ANIMALS ............................................................................................................................................... 69
3. RESULTS .................................................................................................................................................. 73
4. DISCUSSION ............................................................................................................................................. 75
5. TABLES .................................................................................................................................................... 79
6. FIGURES ................................................................................................................................................... 87
7. REFERENCES ........................................................................................................................................ 90
CHAPTER 3 ....................................................................................................................................... 93
CHARACTERIZING THE ROLE OF DIPEPTIDYL PEPTIDASE 4 IN DEPRESSION.......................................... 93
1. INTRODUCTION ........................................................................................................................................ 94
2. MATERIALS AND METHODS .................................................................................................................... 97
2.1 ANIMALS ............................................................................................................................................... 97
3. RESULTS ................................................................................................................................................ 100
4. DISCUSSION ........................................................................................................................................... 103
5. TABLES .................................................................................................................................................. 106
6. FIGURES ................................................................................................................................................. 107
7. REFERENCES ..................................................................................................................................... 115
CHAPTER 4 ..................................................................................................................................... 120

ix
EVALUATING GENETIC MARKERS AND NEUROBIOCHEMICAL ANALYTES FOR FLUOXETINE RESPONSE USING A PANEL OF MOUSE INBRED STRAINS .................................................................................. 120
2. MATERIALS AND METHODS .................................................................................................................. 123
3. RESULTS ................................................................................................................................................ 133
5. TABLES .................................................................................................................................................. 149
6. FIGURES ................................................................................................................................................. 151
7. SUPPLEMENTARY TABLES ..................................................................................................................... 157
8. SUPPLEMENTARY FIGURE ..................................................................................................................... 180
10. REFERENCES ................................................................................................................................... 181
CHAPTER 5 ..................................................................................................................................... 191
TAKING THE YELLOW BRICK ROAD TO BIOMARKER VALIDATION ..................................................... 191
1. SUMMARY ............................................................................................................................................. 192
2. TRANSLATING GENETIC FINDINGS FROM MURINE TO HUMANS ........................................................... 192
3. CANDIDATE GENE VALIDATION ........................................................................................................... 194
4. BIOCHEMICAL MARKER VALIDATION .................................................................................................. 196
5. CONCLUSION ......................................................................................................................................... 199
6. REFERENCES ..................................................................................................................................... 200

x
LIST OF TABLES
Inter-strain behavioral responses in the open field test, stress-induced
hyperthermia, and tail suspension test .......................................................................................... 79
List of candidate genes within anxiety-like QTLs ........................................................................ 81
List of candidate genes within depressive QTLs .......................................................................... 85
Potential biological alterations of known DPP4 substrates ........................................................ 106
List of neurobiochemical analytes simultaneously measured across multiple
mouse inbred strains and their known functions......................................................................... 149
Supplementary Tables
Mean water intake between water and fluoxetine-treated mice ............................................ 157
Behavioral responses in the open field and tail suspension tests .......................................... 159
Serum levels of fluoxetine and its metabolite norfluoxetine following
chronic fluoxetine treatment. ........................................................................................... 161
Mean relative fluorescence intensity (RFI) values for thirty-one
neurobiochemical analytes measured in the cortex of thirty mouse inbred strains .................. 162
Pairwise comparisons of behavioral scores between treatment groups ................................. 174
Covariance of behavior and neurobiochemical levels explained by partial
least squares (PLS) latent vectors .................................................................................... 176
Informative genes used to predict treatment groups in the k-NN
leave-one-out cross-validation test ................................................................................... 177
Informative genes used to predict response groups in the k-NN
leave-one-out cross-validation test. .................................................................................. 178
Baseline genetic markers that influence variable antidepressant respo ................................. 179

xi
LIST OF FIGURES
Biological alterations in depression .............................................................................................. 34
Genome-wide association plot for anxiety-like behavior as measured by
percent time spent in the center of the open field ........................................................................ 87
Genome-wide association plot for stress-induced hyperthermia .................................................. 88
Genome-wide association plot for depressive-like behavior ........................................................ 89
Genome-wide association plot for depressive-like behavior ...................................................... 107
Haplotype structure within Dpp4 aligns with the top peak......................................................... 108
Dpp4 haplotype is associated with a difference in baseline immobility score ........................... 108
Difference in plasma Dpp4 protein levels .................................................................................. 109
Difference in brain Dpp4 protein levels...................................................................................... 109
Anxiety-like responses in the open field ..................................................................................... 110
Anxiety-like responses in the light-dark exploration test ........................................................... 110
Immobility responses in the tail suspension test. ........................................................................ 110
Measurement of plasma Dpp4 activity ....................................................................................... 112
Measurement of Dpp4 activity in the brain ................................................................................ 112
Anxiety-like responses in the open field after chronic sitagliptin treatment .............................. 113
Anxiety-like responses in the light-dark assay after chronic sitagliptin treatment ..................... 113
Depressive-like responses in the open after chronic sitagliptin treatment .................................. 114
Inter-strain difference in fluoxetine response ............................................................................. 151
Neurobiochemical markers that covary with fluoxetine response .............................................. 152
Neurobiochemical analytes that contribute most to discriminating
positive and negative responders ................................................................................................ 153
Hierarchical clustering of genes discriminating treatment from control .................................... 154

xii
Hierarchical clustering of genes discriminating positive and negative response to treatment ... 154
Genome-wide association plot for depressive-like behavior ...................................................... 156
Supplementary Figure
Cellular adhesion and proliferation pathway links candidate antidepressant
biochemical markers S100β GFAP, GSK3β, and HDAC5 ........................................................ 180

xiii
LIST OF ABBREVIATIONS
5-HT Serotonin
ACC Anterior Cingulate Cortex
B6 C57BL/6J mouse inbred strain
CBF Cerebral Blood Flow
D2 DBA/2J mouse inbred strain
DPP4 Dipeptidyl Peptidase 4
EMMA Efficient Mixed Model Association
FST Forced Swim Test
GWAS Genome Wide Association Analysis
HAM Haplotype-Associated Mapping Analysis
HPA Hypothalamic-Pituitary-Adrenal Axis
LD Light/Dark Exploration Test
MDD Major Depressive Disorder
mRNA Messenger Ribonuecleic Acid
OF Open Field Test
QTG Quantitative Trait Gene
QTL Quantitative Trait Loci
SERT Serotonin Transporter
SIH Stress Induced Hyperthermia
SSRI Selective Serotonin Reuptake Inhibitor
TST Tail Suspension Test

xiv
CHAPTER 1
BIOLOGICAL ALTERATIONS IN DEPRESSION
This work will be published in Psychiatric Disorders - Trends and Developments, Biological
Alterations in Depression, Toru Uehara (Ed.), ISBN: 978-953-307-716-1, InTech

2
1. Introduction
According to the World Health Organization, depression is among the leading cause of
disability worldwide with approximately 121 million people affected (http://www.who.int). It is
estimated that 5% of men and 9% of women will experience depression in a given year (Kessler
et al. 2005). Major Depressive Disorder (MDD) is characterized by persistent depressed mood or
loss of interest or pleasure from daily activities. Additionally, patients may experience feelings
of guilt or worthlessness, as well as psychomotor, physiological, and cognitive disturbances
(DSM IV). Given that the etiology of depression is unclear, current antidepressant treatments are
ineffective for most patients. Presently, less than 30% of patients achieve response or remission
(Trivedi et al. 2006). Depression is a clinically and genetically heterogeneous disorder, which
complicates efforts to identify causative factors of disease and replicate findings. In addition,
diagnosis and therapeutic assessment are primarily based on subjective measures, making patient
selection and outcome measures amenable to inconsistencies and irreproducibility.
Biomarkers that objectively establish diagnosis, prognosis, and antidepressant response
can facilitate research and clinical management of patients with depression. Many analytes,
including brain-derived neurotrophic factor (BDNF), serotonin transporter, and monoamines,
have been linked with depressive symptoms and response to antidepressant therapy (Manji et al.
2001; Nestler et al. 2002; Thase 2007). Although much progress has been made in identifying
neurobiological correlates of depression, it is unclear whether these alterations are causally
linked or are due to disease and/or treatment. With the goal of facilitating the search for
depression biomarkers, this chapter will discuss several key molecular and neurochemical
alterations that have been linked with depressive disorder.

3
2. Genetic Studies
The role of genetics in the development of MDD is supported by findings from family,
twin, and adoption studies. Studies that compared the prevalence of depression in monozygotic
versus dizygotic twins indicate a heritability estimate of 35-50% (Bierut et al. 1999; Kendler et
al. 1993; Sullivan et al. 2000). There is a two-to-threefold increased risk of developing MDD
among first degree relatives of depressed individuals (Kelsoe 2004; Sullivan et al. 2000),
indicating that genetic variants can be used as prognostic and diagnostic biomarkers. There are
two widely used approaches to determine genetic markers of depression. Candidate gene analysis
examines the frequency of genetic alleles between cases and controls. Hypotheses are generated
a priori based on the likelihood that the gene affects the risk of depression. Alternatively,
advances in genotyping capabilities and more recently, gene sequencing, have enabled scientists
to look for unbiased genome-wide associations between common single nucleotide
polymorphisms (SNPs) and behavior. Genes that confer risk to depression have been primarily
identified using candidate gene analysis approach, while recent efforts to uncover genetic
markers of antidepressant response include the Sequenced Treatment Alternatives to Relieve
Depression (STAR*D) trial and Genome-Based Therapeutic Drugs for Depression (GENDEP)
study, which looked at genome-wide associations of common variants with antidepressant
response. Genetic studies of depression (Levinson 2006; Lohoff 2010; Shyn and Hamilton 2010)
and antidepressant response (Crisafulli et al. 2011; Kato and Serretti 2010; Porcelli et al. 2010)
are reviewed in this chapter with a focus on several genes.

4
2.1 Genetic Predictors of Depression and Antidepressant Response
Antidepressant medications primarily work on altering neurotransmitters in the brain,
thus much attention has been given to genes within the monoaminergic pathway (Kato and
Serretti 2010). An insertion/deletion polymorphism on the 5‟ promoter region of the serotonin
transporter gene (5-HTTLPR) produces a long (L) allele or a short (S) lower-expressing allele.
The 5-HTTLPR variant alters expression of the serotonin transporter in vitro (Lesch et al. 1996)
and has been linked with MDD (Caspi et al. 2010; Goldman et al. 2010; Uher and McGuffin
2010), neuroticism (Lesch et al. 1996), affective disorder (Collier et al. 1996; Lasky-Su et al.
2005), suicidality (Anguelova et al. 2003; Lin and Tsai 2004), and anxiety related personality
traits (Schinka et al. 2004; Sen et al. 2004). Patients with the low expressing allele exhibited
increased amygdala activation in response to sad faces (Hariri et al. 2002), reduced gray matter
volume in amygdala and perigenual cingulate cortex (Pezawas et al. 2005), as well as altered
functional coupling in both regions (Pezawas et al. 2005), thus supporting the role of the
serotonin transporter in the development of the amygdala-cingulate feedback circuitry. Carriers
of the S allele who experienced stressful life events in the past were more vulnerable to
depression and suicidality (Caspi et al. 2003; Kendler et al. 2005). However, several groups did
not find an association between depression and 5-HTTLPR alone (Middeldorp et al. 2010;
Munafo and Flint 2009; Risch et al. 2009) or in interaction with stressful life events (Risch et al.
2009). Homozygous carriers of the L allele showed higher response and remission rates (Serretti
et al. 2005) and more favorable side effect profiles (Kato and Serretti 2010; Kraft et al. 2007;
Murphy et al. 2004), which did not replicate in a recent large clinical trial (Kraft et al. 2007).
Altogether, these findings indicate that environment must be taken into account when evaluating
the potential use of 5-HTTLPR as a genetic marker of depression.

5
Other genes in the monoamine pathway have been studied for their link with depressive
behavior. The serotonin-1A receptor (HTR1A) is located in the serotonergic neurons and on their
post-synaptic targets. In the pre-synaptic neuron, 5HT1A auto-inhibits raphe firing and 5-HT
synthesis. The -1019C/G variant (rs6295) found in the promoter region of HTR1A results in
higher expression of serotonin-1A auto-receptor (5-HT1A), which leads to reduction in
serotonergic neurotransmission (Stahl 1994). The -1019C/G mutation is correlated with anxiety
and depression (Gross et al. 2002; Lemonde et al. 2004; Strobel et al. 2003). In Asians, the G
allele is associated with improved treatment outcomes (Hong et al. 2006; Kato et al. 2009).
However, this finding was not observed in Caucasians (Lemonde et al. 2004; Serretti et al.
2004), suggesting a confounding effect of race. The relationship between HTR2A and
antidepressant response is unclear due to conflicting results (reviewed in Kato 2010). A recent
meta-analysis did not find any association between HTR1A and HTR2A and treatment response;
however, a polymorphism within HTR2A was correlated with tolerability (Kato and Serretti
2010). No association has been established between HTR2A and MDD (Anguelova et al. 2003).
The tryptophan hydroxylases 1 and 2 (TPH1 and TPH2) catalyze the rate-limiting step in
5-HT biosynthesis. A functional variant in TPH2 (Arg441His) results in 80% reduction of 5-HT
in the brain (Zhang et al. 2004) and was found to be more frequent in patients with MDD (Zhang
et al. 2005). However, other studies failed to replicate this finding (Delorme et al. 2006).
Furthermore, the TPH 218A allele is associated with poor antidepressant response (Serretti et al.
2001a; Serretti et al. 2001b), a finding that was supported by a meta-analysis study (Kato and
Serretti 2010). Patients with the 218 C/C genotype were more likely to respond to antidepressant
therapy (Kato and Serretti 2010). Interestingly, the significant pooled odds ratio score (OR) was
primarily influenced by the sum of the three studies that looked at the association between
6
remission rates and the 218 genotype, suggesting that the TPH gene may be important in
regulating long-term antidepressant response. Of interest is the recent correlation between TPH2
haplotype markers and suicidality (De Luca et al. 2004; Lopez et al. 2007), suggesting that TPH2
may mediate a subset of depressive symptoms like suicidal thoughts and feelings of guilt and
worthlessness.
Enzymes that mediate clearance of catecholamines, including monoamine oxidase A
(MAO-A) and catechol-O-methyl transferase (COMT) have been linked to antidepressant
response. Higher transcription efficiency is observed with the variable number tandem repeat
(VNTR) sequence located 1.2kb upstream of the MAO-A gene (Sabol et al. 1998). Alternatively,
the Val to Met substitution at codon 158 for membrane-bound COMT protein (codon 108 for
soluble COMT) has been linked to lower enzymatic activity (Mannisto and Kaakkola 1999) and
improved response to citalopram (Arias et al. 2006) and mirtazapine (Szegedi et al. 2005) but not
paroxetine (Arias et al. 2006; Szegedi et al. 2005).
A locus on Chr. 12 has been linked with MDD (Abkevich et al. 2003; McGuffin et al.
2005) and anxiety (Erhardt et al. 2007). Within this putative region lies the purinergic ATP-
binding calcium channel gene (P2X7). A non-synonymous coding SNP within P2X7
(Gln460Arg) is associated with MDD risk (Lucae et al. 2006). P2X7 protein is required for IL-1
(interleukin-1) processing and secretion (Ferrari et al. 2006), highlighting the potential role of
immune function in depressive behavior. Moreover, the FK506 binding protein 5 (FKBP5) in
complex with Hsp90 regulates glucocorticoid receptor sensitivity. A functional variant within
FKBP5 that results in increased intracellular concentration of FKBP5 has been linked with
recurrence of depressive episodes (Binder et al. 2004) and antidepressant response (Binder et al.
7
2004; Lekman et al. 2008b). FKBP5 activates glucocorticoid receptors and the hypothalamic-
pituitary-adrenal axis, which regulate response to stress (Binder et al. 2004). Additionally, the
corticotropin releasing hormone 1 (CRH1) variant is correlated with early onset of depressive
symptoms (Papiol et al. 2007). CRH activates the HPA axis, thus supporting the role of the HPA
axis in mediating depressive behavior.
Small low-powered studies were combined in a meta-analysis to clarify the associations
of several genes with depression, which were unclear due to inconsistent or non-replicated
findings. Lopez-Leon et al. found a protective effect for the APOE 2 allele (combined OR, 0.51;
95% CI, 0.27-0.97) with no evidence of between-study heterogeneity (Lopez-Leon et al. 2008).
Alternatively, an increased risk was found for the methylenetetrahydrofolate reductase MTHFR
C677T polymorphism (pooled OR, 1.36), the guanine nucleotide binding protein 3 GNB3
C825T variant (pooled OR, 1.38; 95% CI, 1.13-1.69), and the dopamine transporter SLC6A3 40
bp VNTR (pooled OR, 2.06; 95% CI, 1.25-3.40) (Lopez-Leon et al. 2008).
Pharmacogenetic studies of antidepressants in the STAR*D trial have identified genes
associated with treatment response (Hu et al. 2007; Lekman et al. 2008a; McMahon et al. 2006;
Paddock 2008), treatment resistance (Perlis et al. 2008), and treatment-emergent suicidal ideation
(Laje et al. 2009; Laje et al. 2007; Perlis et al. 2007). In addition, polymorphisms in genes that
encode drug-metabolizing enzymes and transporters have been tested for correlation with
treatment response (Peters et al. 2008). Genes that were significantly associated with response to
citalopram include FKBP5 (Lekman et al. 2008a), glutamate receptor, ionotropic kainite 1
(GRIK1), N-methyl d-aspartate 2A (GRIN2A), 5-hydrxytryptamine receptor 2A (HTR2A),
8
potassium channel, subfamily K, member 2 (KCNK2), phosphodiesterase (PDE), and solute
carrier family 6 member 4 (SLC6A4) (Lin and Chen 2008).
A link between genes and depression exists, however, putative genes identified to date do
not significantly account for the phenotypic variance observed (Mann and Currier 2006).
Although these initial results may seem disappointing, they indicate that the genetics of
depression is far from simple. It is likely that multiple genes with minor effect sizes interact with
environmental factors to affect mood, making identification of genetic biomarkers challenging.
Efforts to investigate gene by environmental effects can further delineate the contribution of each
gene on disease and treatment outcomes (Lesch 2004; Wermter et al. 2010).
3. Biochemical Alterations
Several mechanisms are altered in depression and these include neurotransmission,
neuroendocrine signaling, and neuroimmune functions. It is unclear whether these biochemical
alterations are products or causative factors of depression. This section will discuss common
biological alterations that have been observed in depression, facilitating identification of
candidate biochemical markers for depression and antidepressant response.
3.1 Monoamines
The monoamine theory of depression developed following the observation that
iproniazid, a drug that inhibits the metabolism of monoamines by blocking MAO, improved the
mood of patients who are taking the drug (Delay et al. 1952). In addition, depletion of
monoamines by agents like reserpine was found to induce depression (Goodwin and Bunney
1971). This theory led to the development of antidepressant drugs that elevate monoamine levels
9
at the synapse by blocking uptake transporters, catabolic enzymes or inhibitory pre-synaptic
auto- or hetero-receptors. The monoamines provided a biochemical basis for depression,
whereby depression was thought to result from a „chemical imbalance‟ of monoamines in the
brain (Schildkraut 1965). However, several observations have cast doubt on the major role of
monoamines in MDD. In addition to the untimely manner in which elevation of monoamines
occur with respect to symptom resolution (Baldessarini 1989), treatments that do not elevate
monoamine levels like electroconvulsive therapy (ECT) have been effectively shown to treat
depression (Pagnin et al. 2004). The monoamine theory of depression was then modified to
indicate that elevation of monoamines is the first step in a cascade of molecular events that
ultimately leads to symptom improvement (Pineyro and Blier 1999). Research focus began to
shift towards evaluating the long-term adaptive changes that result from increased monoamines
in the synapse. It was hypothesized that elevation in monoamines leads to reduction in the
sensitivity and/or number of monoamine receptors. Although desensitization and internalization
of monoamine receptors have been observed in several animal and post-mortem studies, results
were often inconsistent and conflicting (Elhwuegi 2004). Effective antidepressant agents that do
not act by inhibiting monoamine reuptake proteins or metabolizing enzymes can still facilitate
receptor internalization despite the absence of pre-synaptic input (Fishman and Finberg 1987;
Kientsch et al. 2001). More recently, it has been shown that monoamine elevation may lead to
cellular genesis. Various antidepressant agents, including specific serotonin reuptake inhibitor
(fluoxetine), monoamine oxidase inhibitor (tranylcypromine), specific norepinephrine reuptake
inhibitor (reboxetine), and serotonin/norepinephrine uptake inhibitor (tricyclic antidepressants)
have been shown to induce cell proliferation and neurogenesis (Santarelli et al. 2003), which

10
suggests that monoamine elevation leads to other downstream molecular effects that can alter
behavior.
Despite decades of research aimed to evaluate the relationship between depression and
monoamine alteration, direct evidence supporting the causative role of monoamines in MDD is
lacking (Nestler 1998), thus prompting efforts to study other pathways that may underlie
depressive behavior.
3.2 Hypothalamic Pituitary Adrenal (HPA) axis
Dysregulation in the HPA axis, which is characterized by elevated plasma cortisol and
CRH is a common finding in depressed patients (Holsboer 2000; Raison and Miller 2003). In
response to stress, the parvocellular neurons in the hypothalamus secrete CRH, stimulating the
release of adenocorticotropin releasing hormone (ACTH) from the anterior pituitary. ACTH, in
turn, activates the synthesis and release of glucocorticoids (cortisol from humans and
corticosterone in rodents) from the adrenal cortex. Glucocorticoids negatively regulate the HPA
axis by inhibiting the synthesis and release of CRH from the hypothalamus.
Activation of the HPA axis mediates physiologic adaptation to stress, however, persistent
stimulation can lead to glucocorticoid receptor (GR) desensitization (de Kloet et al. 2005).
Patients with depression typically exhibit high levels of cortisol in plasma, saliva, and urine, as
well as an increase in the size and activity of the pituitary and adrenal glands (Nemeroff and
Vale 2005). Impairment of the HPA axis, which is primarily characterized by the inability to
suppress cortisol levels following pharmacologic stimulation of GR by dexamethasone, has been
observed in depressed patients (Ising et al. 2005; Kunzel et al. 2003; Sher 2006). HPA alterations
11
normalize with antidepressant therapy (Holsboer 2000) and this is associated with less relapse
(Ising et al. 2007). Glucocorticoids not only exhibit immune and metabolic functions but they
also regulate neurogenesis, neuronal survival, hippocampal size and structure, and acquisition of
new memories (Herbert et al. 2006). Reduced maternal handling increases CRH signaling (Ladd
et al. 1996) and sustains HPA hyperactivity, inducing depressive-like behavior in the pups
(Francis et al. 1999; Meaney 2001). In humans, early stressful life event is associated with
dysregulated HPA axis (Heim et al. 2002) and development of depressive symptoms (Chapman
et al. 2004; McCauley et al. 1997). One of the mechanisms by which antidepressants induce
hippocampal neurogenesis is by activating GR (Anacker et al. 2011), thus implicating a direct
relationship between HPA axis and neural brain signaling.
3.3 Other Neuroendocrine Markers
It was discovered that hypothyroidism elicits depressive behavior and that these
symptoms can be reversed by thyroxine therapy (Asher 1949). Similar symptoms are observed in
depression and hypothyroidism, which include dysphoric mood, fatigue, anhedonia, and
alteration in weight (Jackson 1998). Low levels of thyroid hormones (T3 and T4) stimulate the
release of thyrotropin releasing hormone (TRH) from the hypothalamus to the anterior pituitary.
The pituitary, in turn, releases thyrotropin-stimulating hormone (TSH), which leads to the release
of triiodothyronine (T3) and thyroxine (T4) from the thyroid. Thyroid hormones primarily
regulate metabolism but may also be involved in neurotransmission (Dratman and Gordon 1996).
Although not all depressed patients display abnormalities in thyroid function, alterations have
been observed, including elevation in T4 (Baumgartner et al. 1988; Kirkegaard and Faber 1991),
lower TSH levels (Maes et al. 1989), as well as blunted response of TSH to TRH (Hein and

12
Jackson 1990; Maes et al. 1989). Type-II deiodinase (D-II) catalyzes deiodination of T4 to T3.
Psychotropic medications like lithium (Baumgartner et al. 1994b), desipramine (Campos-Barros
et al. 1994), carbamezapine (Baumgartner et al. 1994a), and fluoxetine (Baumgartner et al.
1994c) stimulate the activity of D-II, indicating that mood regulatory agents indirectly regulate
T3 levels. Another group, however, did not find any effects of antidepressant on thyroid function
(Brambilla et al. 1982). Interestingly, one study found that morning and nocturnal changes in
TSH may predict antidepressant response (Duval et al. 1996).
There is increasing evidence implicating the involvement of stress-responsive
neuropeptide systems in depression and anxiety. The involvement of various neuropeptides has
been reviewed (Alldredge 2010; Holmes et al. 2003) and a number of them will be described
here. Administration of neuropeptide antagonists/agonists results in altered responses in rodent
models of anxiety and depression (Rotzinger et al. 2010). Stress stimulates the release of
vasopressin, which in turn enhances the effects of CRH on ACTH (Aguilera et al. 2003;
Engelmann et al. 2004; Zhou et al. 2001). Depressed patients display altered levels of
vasopressin in the suprachiasmatic nucleus (SCN) (Zhou et al. 2001), paraventricular nucleus
(Purba et al. 1996), and supraoptic nucleus (Meynen et al. 2006). A polymorphism in the
vasopressin receptor (V1B) may be protective against MDD (Overstreet and Griebel 2005;
Salome et al. 2006). Antagonism of the V1B receptor reduced depressive-like behavior (Griebel
et al. 2002), which was comparable to treatment with antidepressant agents (Salome et al. 2006).
This effect was mainly due to inhibition of the V1B receptors in the lateral septum and amygdala
(Stremmelin 2005). Similar to vasopressin, the neuropeptide Y (NPY) is released under stress.
NPY is abundantly expressed in the brain and is co-localized with noradrenaline, somatostatin,
and GABA (γ-aminobutyric acid) (Kask et al. 2002). Reduction in NPY is associated with

13
increased sensitivity to depression and stress, indicating that NPY agonists may exhibit
antidepressive effects (Redrobe et al. 2002). A variant in the promoter region of Npy alters the
expression of NPY in vivo and is linked with anxiety behavior and neural responses to stress
(Zhou et al. 2008). Substance P (SP), a known modulator of pain signaling, has been shown to
interact with serotonergic signaling (Schwarz et al. 1999). Substance P binds to neurokinin-1
(NK1) receptors found in the brain and in the periphery. Genetic ablation or pharmacologic
antagonism of NK1 receptors promotes monoaminergic activity (Froger et al. 2001; Maubach et
al. 2002; Santarelli et al. 2001) and reduces anxiety-like behavior (Santarelli et al. 2001).
Depressed patients have higher SP levels in the serum (Bondy et al. 2003). Interestingly, NK1
antagonists activate the serotonergic system similarly to a serotonin reuptake inhibitor
(escitalopram) (Guiard et al. 2004), indicating that NK1 antagonists may have antidepressive
effects. Galanin is a 29-30 amino acid peptide that regulates various physiological responses like
metabolism and food intake. Galanin binds to several galanin receptors (GALR), which in turn
interact with different G proteins, activating various signal transduction pathways (Smith et al.
1998; Wang et al. 1998). Galanin administration in rodents produces a variety of effects,
including nerve regeneration, nociception, and alteration in sexual and feeding behavior (Wrenn
and Crawley 2001; Yoshitake et al. 2003). Galanin mediates 5-HT and norepinephrine levels
(Ogren et al. 2006) and antagonism of GALR can enhance or reduce depressive-like behavior
depending on which GALR subtype is being inhibited (Barr et al. 2006; Lu et al. 2005).
Many years of research implicate the role of the neuroendocrine system in depression.
Most neuroendocrine regulatory mechanisms occur through the bidirectional communication
between the hypothalamus and pituitary. These findings indicate that the neural circuitry,
14
neuronal signaling, and structural plasticity within this region are likely to be critical in
behavioral responses.
4. Metabolic Alterations
Metabolic syndrome is comprised of several features, including central obesity and
insulin resistance, which, in concert, increases risk for developing cardiovascular disease and
diabetes. Compared to healthy controls, depressed individuals are more likely to develop obesity,
diabetes, and hypertension (Lindley et al. 2009), indicating potential overlap between depressive
symptoms and metabolic syndrome. Independent of the criteria used to define metabolic
syndrome (Raikkonen et al. 2007), a strong bidirectional association between depression and
metabolic syndrome exists in women (Gil et al. 2006; Kinder et al. 2004; Raikkonen et al. 2007).
The correlation between depressive symptoms and metabolic syndrome is slightly higher in
monozygotic twins than dizygotic twins, suggesting that genetics play a critical role in both
disorders (McCaffery et al. 2003). Resistance to insulin, which is a risk factor for developing
metabolic syndrome, is a common occurrence in depressed patients (Koslow et al. 1982;
Okamura et al. 2000; Winokur et al. 1988), which suggests that insulin links depression with
metabolic syndrome. Insulin exerts dose-dependent effects on food intake and energy regulation.
Ablation of insulin receptors on neuronal cells leads to increased body fat disposition, suggesting
that insulin negatively regulates adiposity (Bruning et al. 2000). Additionally, insulin regulates
monoamine uptake and metabolism, phosphoinositol turnover, as well as norepinephrine and
dopamine transporter mRNA levels (Craft and Watson 2004). It has been shown that insulin can
recruit GABA receptors (Wan et al. 1997) and promote internalization of α-amino-3-hydroxy-5-
methylisoxazole-4-propionic acid (AMPA) receptors, which suggests that insulin plays a critical

15
role in neuronal signaling and synaptic plasticity (Huang et al. 1998). Interestingly, brain volume
abnormalities and neurocognitive deficits commonly found in MDD patients have been observed
in individuals with diabetes mellitus (DM), suggesting overlapping pathophysiology between
MDD and DM (McIntyre et al. 2010). Insensitivity to insulin likely develops due to HPA axis
hyperactivity (Rizza et al. 1982), impaired immune system (Fernandez-Real et al. 2001; Maes
1995; Moller 2000), and altered central serotonergic signaling (Goodnick et al. 1995; Horacek et
al. 1999), all of which are common findings in depressed patients (Belmaker 2008; Krishnan and
Nestler 2008).
Association between depression and obesity has been identified in several cross sectional
studies (de Wit et al. 2010; Faith et al. 2002; Scott et al. 2008). A recent meta-analysis looked at
the association between obesity and depression in a community-based setting and found that
obese patients have an 18% increased risk of developing depressive symptoms (overall OR,
1.18) (de Wit et al. 2010). Subsequent sub-group analyses showed that the association with
obesity holds true for depressed women but not for men, which suggests that comorbidity is
likely to be affected by sex (de Wit et al. 2010). Similarly, a meta-analysis of longitudinal
studies showed that baseline obesity increased the risk of depression (pooled OR, 1.57) and that
depression increased the odds for developing obesity (pooled OR, 1.40). Prospective analysis of
the cause-effect relationship between obesity and depression indicate reciprocal findings,
whereby obesity was found to be a predictor of depression in eight out of the ten studies
reviewed, while 53% of the studies found that depression predicts obesity (Faith et al. 2011).
Interestingly, the positive association between depression and obesity is only detected in studies
conducted in the United States but not in other European countries, indicating a strong
contributory effect of environment (Atlantis and Baker 2008). It is increasingly recognized that
16
similar neural circuitry that regulate memory, reward, mood, and emotion also controls appetite,
body weight, and energy homeostasis (Dallman 2009; Zheng et al. 2009).
Food induces olfactory and visual sensory inputs, which stimulate the orbitofrontal
cortex, where acquisition, storage, and processing of memory and experiences associated with
food is thought to occur (Verhagen 2007). Stimulation of the mu-opioid receptor in the nucleus
accumbens and ventral pallidum results in further intake of pleasurable foods (Will et al. 2003;
Zhang and Kelley 2000). The ventral tegmental area and the nucleus accumbens are part of the
mesolimbic dopaminergic system, which regulates behavioral response (motivation) towards
favorable stimuli (Berridge 1996; 2007; Pecina et al. 2006), indicating that food intake and
motivation are, at least partly, co-regulated by similar circuitry. The hypothalamus regulates
homeostatic responses to altered nutrient levels and adiposity levels (Berthoud 2002; Xue and
Kahn 2006) through various endocrine hormones, including leptin (Farooqi et al. 2002; Friedman
1999; O'Rahilly 2002) and NPY (Luquet et al. 2005). Although leptin is primarily known for its
role in appetite suppression and energy expenditure, leptin also mediates reproduction and
cognition (Chehab 2000; Farr et al. 2006). Independent of body mass, depressed patients show
lower plasma levels of leptin (Jow et al. 2006; Kraus et al. 2001) although other studies did not
find similar results (Antonijevic et al. 1998; Deuschle et al. 1996; Rubin et al. 2002). Rodents
exposed to chronic unpredictable stress showed reduction in sucrose preference and higher
depressive-like behavior, which was reversed by leptin administration, indicating that leptin
exhibits antidepressive effects likely through innervations of the limbic brain circuitry (Lu et al.
2006). In response to stressful events, leptin suppresses CRH, ACTH, and corticosterone
secretion, suggesting a direct impact of leptin on the HPA axis (Ahima et al. 1996; Heiman et al.
1997; Huang et al. 1998). In addition, leptin-deficient ob/ob mice display altered Slc6a4

17
expression (Collin et al. 2000), decreased neuronal and glial cells, and reduced brain weight and
cortical volume (Ahima 1999, Stepan 1999), further supporting the role of leptin in MDD.
A common thread between MDD, DM, and heart disease exists. The co-occurrence and
pathophysiologic overlap between metabolic syndrome, obesity, and depression may explain the
significant association between depression, diabetes, and cardiovascular disease (Frasure-Smith
et al. 1993; Goldney et al. 2004; Paile-Hyvarinen et al. 2007).
5. Neuroimmune
An interaction between behavior and the immune system was first recognized in 200 AD,
when Galen observed that melancholic women were more susceptible to cancer (Leonard 1988).
Depressed patients exhibit reduced neutrophil phagocytosis, natural killer cell activity, and
mitogen stimulated lymphocyte proliferation (Irwin et al. 1990). Furthermore, patients with
MDD show increased cytokine secretion from activated macrophages and elevated acute phase
proteins in the liver (Sluzewska et al. 1996), indicating dysregulation in immune response.
Antidepressants inhibit the ability of lipopolysaccharide (LPS) to induce the synthesis and the
release of pro-inflammatory cytokines, likely through elevation of cyclic adenosine
monophosphate (cAMP) levels (Xia et al. 1996). It has been hypothesized that abnormal
secretion of macrophage monokines leads to depressive behavior (Smith 1991). Macrophages
secrete neuroendocrine and immune modulators, including interleukins (IL), tumor necrosis
factors (TNF), ACTH, and endorphins (Nathan 1987), thus indicating a regulatory role for
macrophages in mediating the neuro-endocrine-immune interface.

18
A bidirectional relationship between the brain, neuroendocrine, and immune systems
exists, particularly in response to stress. Overactivity of the HPA axis, which is a common
finding in depressed individuals (Holsboer 2000; Raison and Miller 2003), results in
hypercortisolemia and suppression of the immune system. Conversely, persistent stress can result
in fewer B cells, T cells, and lymphocytes (Olff 1999), which can confer susceptibility to
infections and cancer (Garssen and Goodkin 1999; Kiecolt-Glaser et al. 1995; Reiche et al.
2005). Stressful events like separation or divorce are correlated with increased cancer risk, low
proportions of NK and T cells, impairment of DNA repair, and abnormal immune response
(Kiecolt-Glaser et al. 1987). The presence of reactive oxygen species has been detected in
depressed patients (Irie et al. 2005). Levels of 8-hydroxydeoxyguanosine (8-OH-dG), a
biomarker of cancer-related oxidative DNA damage, is positively correlated with depressive
symptoms (Irie et al. 2005), which suggests that depression may be associated with cancer.
In 1987, Wagner-Jauregg demonstrated that activation of the immune system can affect
various mental states (Raju 1998). Cytokines regulate growth, differentiation, and function of
many cells (Turnbull and Rivier 1999). They can be broadly classified as pro-inflammatory or
anti-inflammatory cytokines. Pro-inflammatory cytokines like interleukin-1 (IL-1), interleukin-6
(IL-6), and TNF-α stimulate immune cell production, activation, and proliferation. On the other
hand, anti-inflammatory cytokines, including interleukin-4 (IL-4), interleukin-10 (IL-10), and
interleukin-13 (IL-13) dampen the immune response. The role of cytokines in depression was
identified following observation that interferon treatment induces „sickness behavior,‟ which
mimics depressive symptoms such as dysphoric mood, fatigue, anorexia, weight loss, and altered
sleep patterns (Papanicolaou et al. 1998; Yirmiya 2000). Depression is characterized by elevation

19
of pro-inflammatory markers IL-6, c-reactive protein (CRP) (Maes 1995), IL-1, and IL-2 (Dunn
et al. 2005; Song et al. 1994). Treatment with LPS stimulated depressive-like behavior and
cytokine secretion, which were reversed by antidepressants or cytokine antagonists (Yirmiya
2000). Administration of IL-6 and IL-1 results in elevation of vasopressin, cortisol, CRH, and
ACTH (Brebner et al. 2000; Harbuz et al. 1992; Xu et al. 1999), which suggests a pivotal role of
cytokines in HPA axis activation (Dentino et al. 1999). In rodents, treatment with IL-1 resulted
in increased DA, NE, and 5-HT activity in the brain (Dunn and Swiergiel 1999; Merali et al.
1997; Song et al. 1999). Cytokines acutely stimulate 5-HT neurotransmission and reduce its
production by stimulating indoleamine 2,3-dioxygenase (IDO), an enzyme that converts the
precursor of 5-HT (tryptophan) into kynurenine (Wichers and Maes 2002). Pro-inflammatory
cytokines have been shown to up-regulate serotonin transporter (Morikawa et al. 1998; Mossner
and Lesch 1998; Wichers and Maes 2002), while anti-inflammatory cytokines like IL-4 reduces
5-HT uptake (Mossner et al. 2001). Together, these findings suggest that cytokines affect
depressive behavior likely through regulation of monoamines and the HPA axis.
The symptom heterogeneity observed in depressed patients suggests that biological
abnormalities are likely to be patient-dependent and disease-specific. Collectively, these results
indicate that biochemical mechanisms likely interact to mediate a complex behavior like mood
and anhedonia. It is therefore unlikely that a single biological marker will characterize a
heterogeneous disorder like depression. Significant benefits can be rendered in evaluating the
behavioral effects of a panel of biological markers or biochemical signatures, particularly since
reciprocal communication between nervous, endocrine, and immune systems have been noted
(Cserr and Knopf 1992; Felten 1991; Reichlin 1993). For most cases, when associations between

20
biochemical alterations and depression are detected, the causal relationship is often poorly
understood.
6. Brain and Molecular Correlates
Direct and indirect evidence from neurostructural, neurofunctional, and molecular studies
indicate impairments in neural circuitry, structural plasticity, and cellular resilience. These
abnormalities reflect the molecular neurobiological underpinnings of depression as discussed
below.
6.1 Neurostructural and Neurofunctional Studies
The cortical-limbic circuitry is implicated to mediate emotional processing in depressed
patients (Davidson et al. 2002; Dougherty and Rauch 1997; Mayberg 1997). Results from
positron emission tomography (PET) studies indicate that unmedicated patients with MDD
exhibit increased activity and cerebral blood flow (CBF) to the amygdala, orbital cortex, and
medial thalamus, as well as decreased CBF to the pre-frontal cortex (PFC) and anterior cingulate
cortex (ACC) (Drevets 2000a; Drevets et al. 1999). Meta-analyses of structural neuroimaging
studies indicate that MDD is characterized by reduction of gray matter volumes in the ACC
(Koolschijn et al. 2009), subgenual cingulate cortex (Hajek et al. 2008), and hippocampus
(McKinnon et al. 2009). Post-mortem neuropathological studies have shown that patients with
MDD exhibit reduced cortex volume, decreased number of glial cells, and/or reduced neuron
sizes (Ongur et al. 1998; Rajkowska 2000; Rajkowska et al. 1999). Given the functional roles of
specific brain regions in emotional processing, neuropathological abnormalities observed in
depression suggest that areas that mediate autonomic and neuroendocrine responses (amygdala)

21
are associated with increased activity and cerebral blood flow, while reduction in activity is
observed in brain regions that control emotional processing (cortex) (Manji et al. 2001).
Antidepressant treatment reduces CBF and metabolism in the amygadala (Drevets 2000b;
Drevets et al. 1999), attenuating hyperresponsiveness to stress (Rosenkranz et al. 2010).
Similarly, larger hippocampal volume (Frodl et al. 2008; Kronmuller et al. 2008; MacQueen et
al. 2008) and gray matter density in the ACC (Costafreda et al. 2009) were positively correlated
with antidepressant response.
Inferences regarding the structural integrity of neural tracts can be made through
diffusion tensor imaging (DTI), which measures the diffusion properties of water through brain
tissues, in vivo. Patients that did not respond to 12 weeks of escitalopram (Alexopoulos et al.
2008) or citalopram (Alexopoulos et al. 2002) treatment showed microstructural abnormalities in
white matter pathways connecting the cortex with the limbic and paralimbic areas, which
indicates that poor therapeutic outcome is related to impaired cortical-limbic connectivity
(Mayberg 2003). Patients with prior exposure to parental verbal abuse (Choi et al. 2009) or have
genetic polymorphisms (5-HTTLPR) (Alexopoulos et al. 2009) exhibit microstructural white
matter abnormalities, suggesting that neural brain structure is subject to genetic and
environmental control. Of note, impairment in brain morphology, neural circuitry, and brain
function have been linked with monoaminergic and non-monoaminergic genetic variants
(Scharinger et al. 2010). In addition to evaluating the structural integrity of neural brain circuits,
functional activity within the limbic-cortical circuitry has been investigated. Brain activity can be
evaluated by measuring blood oxygen level-dependent (BOLD) signals while patients are resting
(intrinsic activity) or when performing a task (task-related activity). BOLD signaling is
associated with changes in blood flow and tissue oxygen concentration, which are markers of

22
brain activity. Depressed individuals have reduced activity in the limbic and cortical regions
(Anand et al. 2005), which normalizes as symptoms resolve (Anand et al. 2005). Patients with
MDD show hyperactivity in the amygdala (Surguladze et al. 2005) and reduced co-activation of
the dorsal ACC (Matthews et al. 2008) when viewing negative facial expressions. These
changes in brain activity are ameliorated with chronic antidepressant treatment (Chen et al. 2008;
Fu et al. 2004; Sheline et al. 2001).
Similar to the electrocardiogram (ECG), unfiltered electrical activity generated by the
brain can be measured by an electroencephalogram (EEG). EEG signals can be converted to
show a topographical representation of the distribution of the EEG waveforms across the cortex
known as the quantitative electroencephalograph (QEEG) brain map. The QEEG image is used
to assess brain activity and metabolism in real-time, providing a global assessment of brain
activity. Brain electrical activity can be measured using cordance, low-resolution brain
electromagnetic tomography (LORETA), and antidepressant treatment (ATR) index. Cordance,
which uses QEEG measurements conducted from a full scalp electrode array, assesses perfusion
of cerebral cortex and brain activity on cortical convexities like PFC (Cook et al. 1998; Leuchter
et al. 1999). Several groups have demonstrated the usefulness of cordance in characterizing
antidepressant response (Bares et al. 2008; Cook et al. 2002). Responders and non-responders
differ in QEEG measurements at rest and during task-oriented activities (Bruder et al. 2008).
LORETA, which assesses activity of deeper cortical regions like ACC and orbitofrontal cortex
(Pizzagalli et al. 2001), identifies cortical alterations in relation to depression and antidepressant
response (Anderer et al. 2002; Saletu et al. 2010). Both cordance and LORETA require whole-
head electrode montages for data collection, which entails up to 75 minutes of QEEG recording,
limiting its clinical utility. On the other hand, the ATR only uses a five-electrode montage on the

23
frontal brain regions, which limits QEEG recording to 10 minutes (Leuchter et al. 2009a;
Leuchter et al. 2009b). The largest study that evaluated the use of ATR in predicting
antidepressant response is the Biomarkers for Rapid Identification of Treatment Effectiveness
trial in Major Depression (BRITE-MD) trial. In this study, positive ATR predicted response and
remission to escitalopram. Patients with negative ATR values were either switched to bupropion
or continued to be treated with escitalopram. In comparison to patients who stayed on
escitalopram, patients who switched to bupropion were 1.9 times more likely to respond to
treatment (Leuchter et al. 2009a; Leuchter et al. 2009b). These findings support the use of ATR
as a biomarker for monitoring treatment response and clinical progression.
6.2 Cellular and Molecular Markers
Lower hippocampal volume (Videbech and Ravnkilde 2004), which is commonly found
in post-mortem brain tissues of depressed individuals (MacQueen et al. 2003), results in reduced
hippocampal plasticity. Reduction in neurogenesis, brain volume, and thickness is likely due to
decreased neurotrophins and/or changes in neuroplasticity (Geuze et al. 2005). Neurotrophins,
including brain-derived neurotrophic factor (BDNF), have been repeatedly implicated in the
pathogenesis and treatment of MDD (Duman and Monteggia 2006). Administration of BDNF
induces cell proliferation and neurogenesis (Pencea et al. 2001; Zigova et al. 1998) and leads to
decreased depressive-like behavior (Shirayama et al. 2002; Siuciak et al. 1997). Neurogenesis,
resulting from either antidepressant treatment or cell implantation, attenuates depressive
behavior (Tfilin et al. 2009). Depressed patients show reduced BDNF levels (Sen et al. 2008),
which can result in lower number of dendrites in the synapse (Manji et al. 2003; Nestler et al.
2002). Antidepressants stimulate BDNF synthesis (Duman 2004) and normalizes reduced BDNF

24
levels in depressed patients (Brunoni et al. 2008; Sen et al. 2008). A functional variant located at
codon 66 in the BDNF promoter region, resulting in a valanine to methionine change
(Val66Met), is reported to correspond with drug response. Carriers of the Met allele were
reported to have better treatment outcomes (Gratacos et al. 2008; Kato and Serretti 2010),
however, others did not find any correlation between the Val66Met variant and treatment
response (Kato and Serretti 2010; Tsai et al. 2003; Wilkie et al. 2007). Furthermore, genetic
susceptibility to depression was not associated with the BDNF Val166Met variant (Gratacos et
al. 2007; Lopez-Leon et al. 2008). The met allele is associated with impaired intra-cellular
packaging and activity dependent secretion of BDNF, which disrupts hippocampal function
(Egan et al. 2003). Impaired suppression of the HPA axis following dexamethasone treatment
was also observed in the BDNF Met carriers (Schule et al. 2006). Of note, mouse lines that did
not express Bdnf during fetal development or post-natal development were hyperactive,
hyperaggressive, and showed higher depressive-like behavior compared to transgenic mice that
were conditioned to express Bdnf during post-natal development (Chan et al. 2006), which
suggests that the behavioral effects of BDNF are region and time-dependent. Interestingly, an
interaction between the BDNF G196A variant, the serotonin transporter gene, and stressful life
events have been observed (Aguilera et al. 2009; Pezawas et al. 2008).
BDNF is activated by cyclic-AMP response element-binding protein (CREB). The
cAMP-CREB cascade has been extensively studied for its involvement in cell survival and
neural plasticity (D'Sa and Duman 2002; Duman et al. 1997). The cAMP-CREB pathway is
upregulated following chronic antidepressant treatment (Duman et al. 1999). Activation of the
CREB pathway is thought to result in neurogenesis. Activated or phosphorylated CREB is found
in actively dividing neural progenitor cells in the hippocampal subgranular zone (SGZ)

25
(Nakagawa et al. 2002a). Mice lacking Creb show markedly reduced cell proliferation
(Nakagawa et al. 2002b) and administration of a phosphodiesterase inhibitor, which activates the
cAMP cascade, increases neurogenesis and improves depressive behavior (Takahashi et al.
1999). Although CREB plays a critical role in neurogenesis, CREB is not necessary to elicit
antidepressant effects. After antidepressant treatment, no difference in depressive-like responses
was observed between Creb deficient mice and wild-type controls, indicating that the behavioral
effects of antidepressant drugs may occur through other CREB-independent mechanisms.
Given that depressed patients exhibit reduced numbers of neuronal and glial cells,
molecular mechanisms that stimulate neurogenesis (activation of CREB and BDNF synthesis)
are likely to be critical in MDD. Presently, the clinical significance of neuro/gliogenesis in
depression is largely unknown. It is likely that cellular proliferative and survival processes
interact to facilitate remodeling of synaptic connections that can lead to altered mood. It is
noteworthy to consider, however, that in the absence of stress, the neural circuitry underlying
depression may be different (Krishnan and Nestler 2008). There is a possibility that reversal of
stress-induced neural plasticity changes is not required for antidepressive effects (Nestler et al.
2002).
7. Depression Signatures
7.1 Gene Expression Signatures
Gene expression profiling studies provide an unbiased look at the relationship between
gene expression and depressive disorder, which is useful in identifying novel targets for
antidepressant therapy (Sequeira and Turecki 2006). Bernard and colleagues collected gene

26
expression data from the locus coeruleus of healthy, depressed, and bipolar patients. In this
study, they found significant alterations in patients with MDD but not bipolar subjects. Gene
expression alterations were detected in the glutamate signaling genes (SLC1A2, SLC1A3 and
GLUL), growth factor genes (FGFR3 and TrkB), and several astroglial genes (Bernard et al.
2010). Similarly, dysregulation of fibroblast growth factor genes (FGF1, FGF2, FGFR2, and,
FGF3) were detected in cortical regions of depressed patients, irrespective of previous
antidepressant treatment (Evans et al. 2004). Consistent with previous findings, expression of
genes involved in signal transmission of glutamate and GABA were found to be dysregulated in
depressed patients (Choudary et al. 2005) and in suicide victims with and without depression
(Sequeira et al. 2009). Alteration in genes regulating oligodendrocyte function (Sequeira and
Turecki 2006) and cell-cell communication (Sequeira et al. 2009) were altered in MDD,
suggesting impairment in brain circuitry. Notably, reduced oligodendrocyte expression and
neuronal changes in amygdala were detected in both depressed individuals and in rodents
exposed to unpredictable chronic mild stress (Sibille et al. 2009), indicating a connection
between stress response and neural circuitry.
For biomarkers to be clinically useful, putative analytes must be detected in easily
accessible samples like plasma or serum. Using LPS-stimulated blood samples, Spijker et al.
compared gene expression profiles between healthy and unmedicated patients with MDD. A
significant difference in gene expression pattern was observed in a subset of genes, all of which
have not been previously associated with depression (Spijker et al. 2010). Transcriptome changes
in the leukocyte mRNA is correlated with response to antidepressant agents or lithium therapy
(Iga et al. 2008). The authors found that normalization in gene expression pattern correlates with
antidepressant response (Iga et al. 2008). In addition to analyzing global changes in the brain or

27
plasma transcriptome, genetic regulatory elements of depression or antidepressant response can
be identified using quantitative trait loci (QTL) mapping analysis. In this approach, DNA
variants that regulate gene expression locally or distally (cis or trans-regulatory elements) are
analyzed for correlation with depressive behavior, thereby facilitating analysis for regulatory
genes underlying depressive behavior. This approach has been used to detect regulatory genetic
elements for several behaviors (Bryant et al. 2009; Radcliffe et al. 2006).
7.2 Protein Signatures
Other efforts to identify depression signatures include protein expression profiling.
Plasma samples from control, depressed, and schizophrenic patients were analyzed for 79 plasma
biochemical analytes, including cytokines, neurotrophins, and chemokines (Domenici et al.
2010). Interestingly, insulin and matrix metallopeptidase 9 (MMP-9) displayed the biggest
difference between control and depressed patients (Domenici et al. 2010). Efforts to expand the
panel of protein markers to include peripheral and neuropsychological markers are currently
underway (Tadic et al. 2011). The global analysis of protein expression is still in its infancy
although several groups have performed proteomic analysis in the cerebrospinal fluid (CSF)
(Raedler and Wiedemann 2006) and in discrete brain regions collected post-mortem (Beasley et
al. 2006). In order to characterize the cause-effect relationship between biological alterations,
treatment, and behavior, protein profiling studies in human samples should be complemented
with proteomic studies in animals, which are more amenable for determination of disease and
treatment effects.
28
8. Other Mechanisms
8.1 Epigenetics
Discordance of depression between monozygotic twins suggests other non-genetic factors
are involved (Mill and Petronis 2007). Alteration in gene expression can occur without changes
in the DNA sequence through epigenetic mechanisms like histone modification and methylation
of DNA CpG islands. Deacytelation of histones results in DNA coiling, which prevents binding
of transcription factors to the DNA, suppressing gene transcription. Alternatively, methylation
alters DNA chemistry, which blocks gene transcription. Epigenetic mechanisms can explain how
genetically weak signals of risk combined with environmental factors predispose patients to
depression (Caspi and Moffitt 2006).
Adverse childhood experiences confer risk to depressive behavior (Heim and Nemeroff
2001) likely through epigenetic alteration. In animal studies, offspring who received minimal
maternal care had higher DNA methylation at the glucocorticoid receptor (GR) promoter region
and were more responsive to stress compared to control animals (Liu et al. 1997; Weaver et al.
2004). Methylation in the GR promoter region leads to reduced binding of the nerve growth
factor induced protein-A (NGF-1A), affecting GR regulation (Weaver et al. 2004; Weaver et al.
2007). Notably, low levels of maternal care led to epigenetic repression of the estrogen-alpha
receptor that resulted in transmission of maternal behavior to offspring (Champagne et al. 2006;
Champagne et al. 2003), thus indicating transgenerational phenotypic transfer through epigenetic
alterations.

29
Mice that are deficient in Hdac5 display enhanced vulnerability to stress, suggesting that
stress reduces histone deacytelase activity leading to down-regulation of gene expression
(Renthal et al. 2007). The adverse effect of stress on Hdac5 activity is reversed by chronic
antidepressant treatment (Renthal et al. 2007). Antidepressant treatment increases histone
acetylation at the Bdnf promoter region, activating Bdnf expression (Tsankova et al. 2006).
BDNF mediates formation and differentiation of new neurons, facilitating long-term potentiation
and memory development.
RNA-mediated modifications through non-coding RNAs (ncRNA) and microRNAs
(miRNA) can activate or silence gene transcription. The role of miRNA in regulating
serotonergic transmission has been reviewed (Millan 2011). MicroRNAs are short RNAs (22-24
nucleotides) that bind to complementary sequences on target mRNAs, typically leading to gene
silencing (Bartel 2009; Carthew and Sontheimer 2009; Winter et al. 2009). A recent study by
Baudry et al. shows that miR-16 negatively regulates the expression of serotonin transporter
(SERT). Fluoxetine treatment stimulates the release of S100 beta protein (S100β) in the raphe,
leading to elevation of miR-16 and reduction in SERT (Baudry et al. 2010). MiR-16 also
represses the expression of anti-apoptotic protein (B-cell lymphoma 2) Bcl-2 (Cimmino et al.
2005), indicating a critical role of miR-16 in neurotransmission as well as cell proliferation. In
addition, genetic studies using seahare (Aplysia) identified miR-124 as a translational repressor
of CREB, which suggests that microRNAs indirectly regulate secondary messenger pathways by
modulating CREB expression (Rajasethupathy et al. 2009). Overexpression of ncRNA was
found in Alzheimer‟s patients (Faghihi et al. 2010), however, an association between ncRNA and
depression is yet to be established.

30
Consistent with the notion that genes are interconnected within a network, it is
conceivable that an epigenetic regulatory network exists. Efforts to identify epigenomic
signatures are underway (Akbarian and Huang 2009) and this data should be integrated with
other data sets like the brain transcriptome and behavior to identify causative pathways in
depression. Of great interest is the assessment of epigenetic transgenerational transmission of a
trait and genomic imprinting (epigenetic alteration on gene expression is based on whether the
gene is inherited from the father or the mother). These epigenetic phenomena facilitate our
understanding of how environment and genetics interact to mediate behavior, ultimately
providing a comprehensive picture of the molecular mechanisms underlying depression.
8.2 Sleep and Circadian Rhythm
It was previously thought that insomnia is a risk factor for depression (Breslau et al.
1996; Ford and Kamerow 1989; Hohagen et al. 1993) and years of research did not clarify the
exact relationship between insomnia and depression (Riemann 2007; Riemann et al. 2001). In an
EEG, normal sleep can be partitioned into several stages. The first is progression from light sleep
(N1 stage), followed by an “intermediate” level of sleep (stage N2) that leads to the “deep” sleep,
which is characterized by slow delta waves on the EEG (stage N3). Stages N1-N3 are part of
non-rapid eye movement sleep, which alternates with rapid eye movement (REM) sleep
throughout the night (Benca and Peterson 2008). Depression is characterized by abnormal sleep
(difficulty falling asleep, nocturnal awakenings, early-morning awakenings), decreased slow-
wave sleep, shortened rapid eye movement (REM) latency, and increased REM density (Thase et
al. 1997; Tsuno et al. 2005). Interestingly, total sleep deprivation improves symptoms in 40-60%
of depressed patients (Giedke and Schwarzler 2002; Wirz-Justice and Van den Hoofdakker

31
1999), which is thought to be due to activation of the limbic dopaminergic pathways (Ebert et al.
1994; Ebert et al. 1996). Additionally, the slow-wave sleep is marginally affected by
antidepressant therapy (Sharpley and Cowen 1995; Tsuno et al. 2005), indicating partial
involvement of monoamines in sleep regulation.
In addition to disruption in sleep pattern, depressed patients also exhibit alteration in
biological rhythms, including appetite and hormone levels. Patients with seasonal affective
disorders (SAD) have depressive symptoms during the winter months when daylight is shorter.
The bright light therapy has been effectively used to treat SAD (Lam 2006) and non-seasonal
depression (Terman and Terman 2005) and is thought to work by shifting the circadian clock
(Wirz-Justice et al. 2005). Similar to 5-HT, melatonin is derived from tryptophan and is a critical
regulator of circadian rhythm. Depressed patients display altered melatonin release and abnormal
melatonin levels (Rubin et al. 1992; Wetterberg 1999), particularly in the acute phase of
depressive illness (Srinivasan et al. 2006). Antidepressant therapy increases melatonin
(Srinivasan et al. 2006; Thompson et al. 1985). Of note, a pilot study that looked at the use of
melatonin in addition to cortisol as prognostic marker for depression found promising results
(Buckley and Schatzberg 2010).
Genetic regulators of the molecular clock (Clock, Bmal1, Npas2, GSK3β, and Timeless)
have been linked with mood disorders (McClung 2007). Mutant mouse models exhibiting point
mutations on the Clock gene display anxiety-like and depressive-like behavior (Roybal et al.
2007) and increased dopamine transmission in the ventral tegmental area (VTA) (McClung et al.
2005; Nestler and Carlezon 2006), which suggests that the Clock gene regulates dopamine
signaling. Interestingly, there is circadian rhythm with regards to concentration, release, and

32
synthesis of 5-HT, norepinephrine, and dopamine (Barassin et al. 2002; Shieh et al. 1997;
Weiner et al. 1992), as well as in the expression and activity of monoamine receptors (Kafka et
al. 1983; WESEMANN and Weiner 1990; Witte and Lemmer 1991), indicating a link between
monoamine signaling and circadian rhythm.
9. Our Approach: Identification of genetic and neurobiochemical markers for depression
and fluoxetine response using a panel of genetically diverse mouse inbred strains
Based on these findings, it is unlikely that a single biomarker can describe a
multifactorial disorder like depression. Data from the last decades indicate that alterations in
MDD are inter-connected (Figure 1.1). This figure illustrates that there are neuroanatomical,
neurobiochemical, neuroimmune, neuroendocrine, genetic, and metabolic mechanisms
underlying MDD. Given the involvement of various biological systems, it is no surprise that
depression is characterized by heterogeneous molecular and clinical manifestations, which
complicate the search for biomarkers for depressive-like behavior. Therefore, a systems biology
approach that investigates connections on genetic, neurobiochemical, and behavioral levels is
critical to the identification of prognostic and treatment response biomarkers for depression.
Our laboratory has collected behavioral data for over 30 mouse inbred strains for the tail
suspension test, in both naïve mice and mice chronically-treated with the antidepressant
fluoxetine. We have also analyzed whole-genome gene expression in the same inbred strains in
multiple brain regions believed to play a role in the regulation of mood. In this application, we
propose to quantify 40 biochemical biomarkers in the same three brain regions among all 30
inbred strains in both naïve mice and mice that have been chronically-treated with the

33
antidepressant fluoxetine. The biochemical markers, which were chosen based on literature
searches and in consultation with experts in the field of psychiatry and psychiatric genetics,
assess multiple mechanisms that have been implicated in human depression, including neuronal
modulation, neurogenesis, gliogenesis, and hypothalamic-pituitary mediated immunomodulation.
By comparing biochemical and behavioral profiles in both naïve and drug-treated mice, we will
identify biomarkers that can predict predisposition to depressive-like behavior and treatment
response. Furthermore, comparison of these data with inter-strain gene expression differences
will provide information regarding the role of gene regulation on depression. Genetic and
biochemical markers that are significantly correlated with differences in behavior in the
treatment naïve group can predict predisposition to depressive-like behavior in mice that may
influence response to treatment, while genetic and biochemical markers that are significantly
different between response groups can provide a biological explanation for differences in
treatment response.

34
10. Figures
Figure 1.1 Biological alterations in depression
Figure 1.1 Biological alterations in depression. Impairment in the HPA axis, neural circuitry,
neuroendocrine, neuroimmune, neuronal signaling, neurogenesis, and metabolic functions have
been observed in depressed patients, resulting in symptom heterogeneity. As shown,
bidirectional communication among several pathways exists (i.e., crosstalk between sympathetic
nervous system and inflammatory markers). Cellular (genetic) and molecular (proteomic)
alterations in depression can be identified by performing global gene and protein expression
analyses between healthy controls and depressed individuals (bottom left), leading to
identification of depression molecular signatures.

35
REFERENCES
Abkevich, V., Camp, N.J., Hensel, C.H., Neff, C.D., Russell, D.L., Hughes, D.C., Plenk, A.M.,
Lowry, M.R., Richards, R.L., Carter, C., Frech, G.C., Stone, S., Rowe, K., Chau, C.A.,
Cortado, K., Hunt, A., Luce, K., O'Neil, G., Poarch, J., Potter, J., Poulsen, G.H., Saxton,
H., Bernat-Sestak, M., Thompson, V., Gutin, A., Skolnick, M.H., Shattuck, D. &
Cannon-Albright, L. (2003). Predisposition locus for major depression at chromosome
12q22-12q23.2. Am J Hum Genet, Vol.73, No.6, (Dec 2003), pp. 1271-1281.
Aguilera, G., Volpi, S. & Rabadan-Diehl, C. (2003). Transcriptional and post-transcriptional
mechanisms regulating the rat pituitary vasopressin V1b receptor gene. J Mol Endocrinol,
Vol.30, No.2, (Apr 2003), pp. 99-108.
Aguilera, M., Arias, B., Wichers, M., Barrantes-Vidal, N., Moya, J., Villa, H., van Os, J., Ibanez,
M.I., Ruiperez, M.A., Ortet, G. & Fananas, L. (2009). Early adversity and 5-HTT/BDNF
genes: new evidence of gene-environment interactions on depressive symptoms in a
general population. Psychol Med, Vol.39, No.9, (Sep 2009), pp. 1425-1432.
Ahima, R.S., Prabakaran, D., Mantzoros, C., Qu, D., Lowell, B., Maratos-Flier, E. & Flier, J.S.
(1996). Role of leptin in the neuroendocrine response to fasting. Nature, Vol.382,
No.6588, (Jul 18 1996), pp. 250-252.
Akbarian, S. & Huang, H.S. (2009). Epigenetic regulation in human brain-focus on histone
lysine methylation. Biol Psychiatry, Vol.65, No.3, (Feb 1 2009), pp. 198-203.
Alexopoulos, G.S., Kiosses, D.N., Choi, S.J., Murphy, C.F. & Lim, K.O. (2002). Frontal white
matter microstructure and treatment response of late-life depression: a preliminary study.
Am J Psychiatry, Vol.159, No.11, (Nov 2002), pp. 1929-1932.
Alexopoulos, G.S., Murphy, C.F., Gunning-Dixon, F.M., Glatt, C.E., Latoussakis, V., Kelly,
R.E., Jr., Kanellopoulos, D., Klimstra, S., Lim, K.O., Young, R.C. & Hoptman, M.J.
(2009). Serotonin transporter polymorphisms, microstructural white matter abnormalities
and remission of geriatric depression. J Affect Disord, Vol.119, No.1-3, (Dec 2009), pp.
132-141.
Alexopoulos, G.S., Murphy, C.F., Gunning-Dixon, F.M., Latoussakis, V., Kanellopoulos, D.,
Klimstra, S., Lim, K.O. & Hoptman, M.J. (2008). Microstructural white matter
abnormalities and remission of geriatric depression. Am J Psychiatry, Vol.165, No.2,
(Feb 2008), pp. 238-244.
Alldredge, B. (2010). Pathogenic involvement of neuropeptides in anxiety and depression.
Neuropeptides, Vol.44, No.3, (Jun 2010), pp. 215-224.
Anacker, C., Zunszain, P.A., Carvalho, L.A. & Pariante, C.M. (2011). The glucocorticoid
receptor: pivot of depression and of antidepressant treatment?
Psychoneuroendocrinology, Vol.36, No.3, (Apr 2011), pp. 415-425.

36
Anand, A., Li, Y., Wang, Y., Wu, J., Gao, S., Bukhari, L., Mathews, V.P., Kalnin, A. & Lowe,
M.J. (2005). Antidepressant effect on connectivity of the mood-regulating circuit: an
FMRI study. Neuropsychopharmacology, Vol.30, No.7, (Jul 2005), pp. 1334-1344.
Anderer, P., Saletu, B., Semlitsch, H.V. & Pascual-Marqui, R.D. (2002). Structural and energetic
processes related to P300: LORETA findings in depression and effects of antidepressant
drugs. Methods Find Exp Clin Pharmacol, Vol.24 Suppl D, 2002), pp. 85-91.
Anguelova, M., Benkelfat, C. & Turecki, G. (2003). A systematic review of association studies
investigating genes coding for serotonin receptors and the serotonin transporter: II.
Suicidal behavior. Mol Psychiatry, Vol.8, No.7, (Jul 2003), pp. 646-653.
Antonijevic, I.A., Murck, H., Frieboes, R.M., Horn, R., Brabant, G. & Steiger, A. (1998).
Elevated nocturnal profiles of serum leptin in patients with depression. J Psychiatr Res,
Vol.32, No.6, (Nov-Dec 1998), pp. 403-410.
Arias, B., Serretti, A., Lorenzi, C., Gasto, C., Catalan, R. & Fananas, L. (2006). Analysis of
COMT gene (Val 158 Met polymorphism) in the clinical response to SSRIs in depressive
patients of European origin. J Affect Disord, Vol.90, No.2-3, (Feb 2006), pp. 251-256.
Asher, R. (1949). Myxoedematous madness. Br Med J, Vol.2, No.4627, (Sep 10 1949), pp. 555-
562.
Atlantis, E. & Baker, M. (2008). Obesity effects on depression: systematic review of
epidemiological studies. Int J Obes (Lond), Vol.32, No.6, (Jun 2008), pp. 881-891.
Baldessarini, R.J. (1989). Current status of antidepressants: clinical pharmacology and therapy. J
Clin Psychiatry, Vol.50, No.4, (Apr 1989), pp. 117-126.
Barassin, S., Raison, S., Saboureau, M., Bienvenu, C., Maitre, M., Malan, A. & Pevet, P. (2002).
Circadian tryptophan hydroxylase levels and serotonin release in the suprachiasmatic
nucleus of the rat. Eur J Neurosci, Vol.15, No.5, (Mar 2002), pp. 833-840.
Bares, M., Brunovsky, M., Kopecek, M., Novak, T., Stopkova, P., Kozeny, J., Sos, P., Krajca, V.
& Hoschl, C. (2008). Early reduction in prefrontal theta QEEG cordance value predicts
response to venlafaxine treatment in patients with resistant depressive disorder. Eur
Psychiatry, Vol.23, No.5, (Aug 2008), pp. 350-355.
Barr, A.M., Kinney, J.W., Hill, M.N., Lu, X., Biros, S., Rebek, J., Jr. & Bartfai, T. (2006). A
novel, systemically active, selective galanin receptor type-3 ligand exhibits
antidepressant-like activity in preclinical tests. Neurosci Lett, Vol.405, No.1-2, (Sep 11
2006), pp. 111-115.
Bartel, D.P. (2009). MicroRNAs: target recognition and regulatory functions. Cell, Vol.136,
No.2, (Jan 23 2009), pp. 215-233.

37
Baudry, A., Mouillet-Richard, S., Schneider, B., Launay, J.M. & Kellermann, O. (2010). miR-16
targets the serotonin transporter: a new facet for adaptive responses to antidepressants.
Science, Vol.329, No.5998, (Sep 17 2010), pp. 1537-1541.
Baumgartner, A., Campos-Barros, A., Gaio, U., Hessenius, C., Flechner, A. & Meinhold, H.
(1994a). Carbamazepine affects triiodothyronine production and metabolization in rat
hippocampus. Life Sci, Vol.54, No.23, 1994a), pp. PL401-407.
Baumgartner, A., Campos-Barros, A., Gaio, U., Hessenius, C., Frege, I. & Meinhold, H. (1994b).
Effects of lithium on thyroid hormone metabolism in rat frontal cortex. Biol Psychiatry,
Vol.36, No.11, (Dec 1 1994b), pp. 771-774.
Baumgartner, A., Dubeyko, M., Campos-Barros, A., Eravci, M. & Meinhold, H. (1994c).
Subchronic administration of fluoxetine to rats affects triiodothyronine production and
deiodination in regions of the cortex and in the limbic forebrain. Brain Res, Vol.635,
No.1-2, (Jan 28 1994c), pp. 68-74.
Baumgartner, A., Graf, K.J., Kurten, I. & Meinhold, H. (1988). The hypothalamic-pituitary-
thyroid axis in psychiatric patients and healthy subjects: Parts 1-4. Psychiatry Res,
Vol.24, No.3, (Jun 1988), pp. 271-332.
Beasley, C.L., Pennington, K., Behan, A., Wait, R., Dunn, M.J. & Cotter, D. (2006). Proteomic
analysis of the anterior cingulate cortex in the major psychiatric disorders: Evidence for
disease-associated changes. Proteomics, Vol.6, No.11, (Jun 2006), pp. 3414-3425.
Belmaker, R.H. (2008). The future of depression psychopharmacology. CNS Spectr, Vol.13,
No.8, (Aug 2008), pp. 682-687.
Benca, R.M. & Peterson, M.J. (2008). Insomnia and depression. Sleep Med, Vol.9 Suppl 1, (Sep
2008), pp. S3-9.
Bernard, R., Kerman, I.A., Thompson, R.C., Jones, E.G., Bunney, W.E., Barchas, J.D.,
Schatzberg, A.F., Myers, R.M., Akil, H. & Watson, S.J. (2010). Altered expression of
glutamate signaling, growth factor, and glia genes in the locus coeruleus of patients with
major depression. Mol Psychiatry, Vol.16, No.6, (Jun 2010), pp. 634-646.
Berridge, K.C. (1996). Food reward: brain substrates of wanting and liking. Neurosci Biobehav
Rev, Vol.20, No.1, 1996), pp. 1-25.
Berridge, K.C. (2007). The debate over dopamine's role in reward: the case for incentive
salience. Psychopharmacology (Berl), Vol.191, No.3, (Apr 2007), pp. 391-431.
Berthoud, H.R. (2002). Multiple neural systems controlling food intake and body weight.
Neurosci Biobehav Rev, Vol.26, No.4, (Jun 2002), pp. 393-428.

38
Bierut, L.J., Heath, A.C., Bucholz, K.K., Dinwiddie, S.H., Madden, P.A., Statham, D.J., Dunne,
M.P. & Martin, N.G. (1999). Major depressive disorder in a community-based twin
sample: are there different genetic and environmental contributions for men and women?
Arch Gen Psychiatry, Vol.56, No.6, (Jun 1999), pp. 557-563.
Binder, E.B., Salyakina, D., Lichtner, P., Wochnik, G.M., Ising, M., Putz, B., Papiol, S., Seaman,
S., Lucae, S., Kohli, M.A., Nickel, T., Kunzel, H.E., Fuchs, B., Majer, M., Pfennig, A.,
Kern, N., Brunner, J., Modell, S., Baghai, T., Deiml, T., Zill, P., Bondy, B., Rupprecht,
R., Messer, T., Kohnlein, O., Dabitz, H., Bruckl, T., Muller, N., Pfister, H., Lieb, R.,
Mueller, J.C., Lohmussaar, E., Strom, T.M., Bettecken, T., Meitinger, T., Uhr, M., Rein,
T., Holsboer, F. & Muller-Myhsok, B. (2004). Polymorphisms in FKBP5 are associated
with increased recurrence of depressive episodes and rapid response to antidepressant
treatment. Nat Genet, Vol.36, No.12, (Dec 2004), pp. 1319-1325.
Bondy, B., Baghai, T.C., Minov, C., Schule, C., Schwarz, M.J., Zwanzger, P., Rupprecht, R. &
Moller, H.J. (2003). Substance P serum levels are increased in major depression:
preliminary results. Biol Psychiatry, Vol.53, No.6, (Mar 15 2003), pp. 538-542.
Brambilla, F., Smeraldi, E., Sacchetti, E., Bellodi, L., Genazzani, A.R., Facchinetti, F. & Muller,
E.E. (1982). Neuroendocrine abnormalities in depressive illness. Adv Biochem
Psychopharmacol, Vol.32, 1982), pp. 329-340.
Brebner, K., Hayley, S., Zacharko, R., Merali, Z. & Anisman, H. (2000). Synergistic effects of
interleukin-1beta, interleukin-6, and tumor necrosis factor-alpha: central monoamine,
corticosterone, and behavioral variations. Neuropsychopharmacology, Vol.22, No.6, (Jun
2000), pp. 566-580.
Breslau, N., Roth, T., Rosenthal, L. & Andreski, P. (1996). Sleep disturbance and psychiatric
disorders: a longitudinal epidemiological study of young adults. Biol Psychiatry, Vol.39,
No.6, (Mar 15 1996), pp. 411-418.
Bruder, G.E., Sedoruk, J.P., Stewart, J.W., McGrath, P.J., Quitkin, F.M. & Tenke, C.E. (2008).
Electroencephalographic alpha measures predict therapeutic response to a selective
serotonin reuptake inhibitor antidepressant: pre- and post-treatment findings. Biol
Psychiatry, Vol.63, No.12, (Jun 15 2008), pp. 1171-1177.
Bruning, J.C., Gautam, D., Burks, D.J., Gillette, J., Schubert, M., Orban, P.C., Klein, R., Krone,
W., Muller-Wieland, D. & Kahn, C.R. (2000). Role of brain insulin receptor in control of
body weight and reproduction. Science, Vol.289, No.5487, (Sep 22 2000), pp. 2122-
2125.
Brunoni, A.R., Lopes, M. & Fregni, F. (2008). A systematic review and meta-analysis of clinical
studies on major depression and BDNF levels: implications for the role of neuroplasticity
in depression. Int J Neuropsychopharmacol, Vol.11, No.8, (Dec 2008), pp. 1169-1180.
Bryant, C.D., Chang, H.P., Zhang, J., Wiltshire, T., Tarantino, L.M. & Palmer, A.A. (2009). A
major QTL on chromosome 11 influences psychostimulant and opioid sensitivity in mice.
Genes Brain Behav, Vol.8, No.8, (Nov 2009), pp. 795-805.

39
Buckley, T.M. & Schatzberg, A.F. (2010). A pilot study of the phase angle between cortisol and
melatonin in major depression - a potential biomarker? J Psychiatr Res, Vol.44, No.2,
(Jan 2010), pp. 69-74.
Campos-Barros, A., Meinhold, H., Stula, M., Muller, F., Kohler, R., Eravci, M., Putzien, O. &
Baumgartner, A. (1994). The influence of desipramine on thyroid hormone metabolism in
rat brain. J Pharmacol Exp Ther, Vol.268, No.3, (Mar 1994), pp. 1143-1152.
Carthew, R.W. & Sontheimer, E.J. (2009). Origins and Mechanisms of miRNAs and siRNAs.
Cell, Vol.136, No.4, (Feb 20 2009), pp. 642-655.
Caspi, A., Hariri, A.R., Holmes, A., Uher, R. & Moffitt, T.E. (2010). Genetic sensitivity to the
environment: the case of the serotonin transporter gene and its implications for studying
complex diseases and traits. Am J Psychiatry, Vol.167, No.5, (May 2010), pp. 509-527.
Caspi, A. & Moffitt, T.E. (2006). Gene-environment interactions in psychiatry: joining forces
with neuroscience. Nat Rev Neurosci, Vol.7, No.7, (Jul 2006), pp. 583-590.
Caspi, A., Sugden, K., Moffitt, T.E., Taylor, A., Craig, I.W., Harrington, H., McClay, J., Mill, J.,
Martin, J., Braithwaite, A. & Poulton, R. (2003). Influence of life stress on depression:
moderation by a polymorphism in the 5-HTT gene. Science, Vol.301, No.5631, (Jul 18
2003), pp. 386-389.
Champagne, F.A., Weaver, I.C., Diorio, J., Dymov, S., Szyf, M. & Meaney, M.J. (2006).
Maternal care associated with methylation of the estrogen receptor-alpha1b promoter and
estrogen receptor-alpha expression in the medial preoptic area of female offspring.
Endocrinology, Vol.147, No.6, (Jun 2006), pp. 2909-2915.
Champagne, F.A., Weaver, I.C., Diorio, J., Sharma, S. & Meaney, M.J. (2003). Natural
variations in maternal care are associated with estrogen receptor alpha expression and
estrogen sensitivity in the medial preoptic area. Endocrinology, Vol.144, No.11, (Nov
2003), pp. 4720-4724.
Chan, J.P., Unger, T.J., Byrnes, J. & Rios, M. (2006). Examination of behavioral deficits
triggered by targeting Bdnf in fetal or postnatal brains of mice. Neuroscience, Vol.142,
No.1, (Sep 29 2006), pp. 49-58.
Chapman, D.P., Whitfield, C.L., Felitti, V.J., Dube, S.R., Edwards, V.J. & Anda, R.F. (2004).
Adverse childhood experiences and the risk of depressive disorders in adulthood. J Affect
Disord, Vol.82, No.2, (Oct 15 2004), pp. 217-225.
Chehab, F.F. (2000). Leptin as a regulator of adipose mass and reproduction. Trends Pharmacol
Sci, Vol.21, No.8, (Aug 2000), pp. 309-314.
Chen, C.H., Suckling, J., Ooi, C., Fu, C.H., Williams, S.C., Walsh, N.D., Mitterschiffthaler,
M.T., Pich, E.M. & Bullmore, E. (2008). Functional coupling of the amygdala in
depressed patients treated with antidepressant medication. Neuropsychopharmacology,
Vol.33, No.8, (Jul 2008), pp. 1909-1918.

40
Choi, J., Jeong, B., Rohan, M.L., Polcari, A.M. & Teicher, M.H. (2009). Preliminary evidence
for white matter tract abnormalities in young adults exposed to parental verbal abuse. Biol
Psychiatry, Vol.65, No.3, (Feb 1 2009), pp. 227-234.
Choudary, P.V., Molnar, M., Evans, S.J., Tomita, H., Li, J.Z., Vawter, M.P., Myers, R.M.,
Bunney, W.E., Jr., Akil, H., Watson, S.J. & Jones, E.G. (2005). Altered cortical
glutamatergic and GABAergic signal transmission with glial involvement in depression.
Proc Natl Acad Sci U S A, Vol.102, No.43, (Oct 25 2005), pp. 15653-15658.
Cimmino, A., Calin, G.A., Fabbri, M., Iorio, M.V., Ferracin, M., Shimizu, M., Wojcik, S.E.,
Aqeilan, R.I., Zupo, S., Dono, M., Rassenti, L., Alder, H., Volinia, S., Liu, C.G., Kipps,
T.J., Negrini, M. & Croce, C.M. (2005). miR-15 and miR-16 induce apoptosis by
targeting BCL2. Proc Natl Acad Sci U S A, Vol.102, No.39, (Sep 27 2005), pp. 13944-
13949.
Collier, D.A., Stober, G., Li, T., Heils, A., Catalano, M., Di Bella, D., Arranz, M.J., Murray,
R.M., Vallada, H.P., Bengel, D., Muller, C.R., Roberts, G.W., Smeraldi, E., Kirov, G.,
Sham, P. & Lesch, K.P. (1996). A novel functional polymorphism within the promoter of
the serotonin transporter gene: possible role in susceptibility to affective disorders. Mol
Psychiatry, Vol.1, No.6, (Dec 1996), pp. 453-460.
Collin, M., Hakansson-Ovesjo, M.L., Misane, I., Ogren, S.O. & Meister, B. (2000). Decreased 5-
HT transporter mRNA in neurons of the dorsal raphe nucleus and behavioral depression
in the obese leptin-deficient ob/ob mouse. Brain Res Mol Brain Res, Vol.81, No.1-2, (Sep
30 2000), pp. 51-61.
Cook, I.A., Leuchter, A.F., Morgan, M., Witte, E., Stubbeman, W.F., Abrams, M., Rosenberg, S.
& Uijtdehaage, S.H. (2002). Early changes in prefrontal activity characterize clinical
responders to antidepressants. Neuropsychopharmacology, Vol.27, No.1, (Jul 2002), pp.
120-131.
Cook, I.A., O'Hara, R., Uijtdehaage, S.H., Mandelkern, M. & Leuchter, A.F. (1998). Assessing
the accuracy of topographic EEG mapping for determining local brain function.
Electroencephalogr Clin Neurophysiol, Vol.107, No.6, (Dec 1998), pp. 408-414.
Costafreda, S.G., Chu, C., Ashburner, J. & Fu, C.H. (2009). Prognostic and diagnostic potential
of the structural neuroanatomy of depression. PLoS One, Vol.4, No.7, 2009), pp. e6353.
Craft, S. & Watson, G.S. (2004). Insulin and neurodegenerative disease: shared and specific
mechanisms. Lancet Neurol, Vol.3, No.3, (Mar 2004), pp. 169-178.
Crisafulli, C., Fabbri, C., Porcelli, S., Drago, A., Spina, E., De Ronchi, D. & Serretti, A. (2011).
Pharmacogenetics of antidepressants. Front Pharmacol, Vol.2, 2011), pp. 6.
Cserr, H.F. & Knopf, P.M. (1992). Cervical lymphatics, the blood-brain barrier and the
immunoreactivity of the brain: a new view. Immunol Today, Vol.13, No.12, (Dec 1992),
pp. 507-512.

41
D'Sa, C. & Duman, R.S. (2002). Antidepressants and neuroplasticity. Bipolar Disord, Vol.4,
No.3, (Jun 2002), pp. 183-194.
Dallman, M.F. (2009). Stress-induced obesity and the emotional nervous system. Trends
Endocrinol Metab, Vol.21, No.3, (Mar 2009), pp. 159-165.
Davidson, R.J., Pizzagalli, D., Nitschke, J.B. & Putnam, K. (2002). Depression: perspectives
from affective neuroscience. Annu Rev Psychol, Vol.53, 2002), pp. 545-574.
de Kloet, E.R., Joels, M. & Holsboer, F. (2005). Stress and the brain: from adaptation to disease.
Nat Rev Neurosci, Vol.6, No.6, (Jun 2005), pp. 463-475.
De Luca, V., Mueller, D.J., Tharmalingam, S., King, N. & Kennedy, J.L. (2004). Analysis of the
novel TPH2 gene in bipolar disorder and suicidality. Mol Psychiatry, Vol.9, No.10, (Oct
2004), pp. 896-897.
de Wit, L., Luppino, F., van Straten, A., Penninx, B., Zitman, F. & Cuijpers, P. (2010).
Depression and obesity: a meta-analysis of community-based studies. Psychiatry Res,
Vol.178, No.2, (Jul 30 2010), pp. 230-235.
Delay, J., Laine, B. & Buisson, J.F. (1952). [The action of isonicotinyl-hydrazide used in the
treatment of depressive states]. Ann Med Psychol (Paris), Vol.110, No.2:5, (Dec 1952),
pp. 689-692.
Delorme, R., Durand, C.M., Betancur, C., Wagner, M., Ruhrmann, S., Grabe, H.-J., Nygren, G.,
Gillberg, C., Leboyer, M., Bourgeron, T., Courtet, P., Jollant, F., Buresi, C., Aubry, J.-
M., Baud, P., Bondolfi, G., Bertschy, G., Perroud, N. & Malafosse, A. (2006). No human
tryptophan hydroxylase-2 gene R441H mutation in a large cohort of psychiatric patients
and control subjects. Biological Psychiatry, Vol.60, No.2, 2006), pp. 202-203 %U
http://www.ncbi.nlm.nih.gov/pubmed/16581035.
Dentino, A.N., Pieper, C.F., Rao, M.K., Currie, M.S., Harris, T., Blazer, D.G. & Cohen, H.J.
(1999). Association of interleukin-6 and other biologic variables with depression in older
people living in the community. J Am Geriatr Soc, Vol.47, No.1, (Jan 1999), pp. 6-11.
Deuschle, M., Blum, W.F., Englaro, P., Schweiger, U., Weber, B., Pflaum, C.D. & Heuser, I.
(1996). Plasma leptin in depressed patients and healthy controls. Horm Metab Res,
Vol.28, No.12, (Dec 1996), pp. 714-717.
Domenici, E., Wille, D.R., Tozzi, F., Prokopenko, I., Miller, S., McKeown, A., Brittain, C.,
Rujescu, D., Giegling, I., Turck, C.W., Holsboer, F., Bullmore, E.T., Middleton, L.,
Merlo-Pich, E., Alexander, R.C. & Muglia, P. (2010). Plasma protein biomarkers for
depression and schizophrenia by multi analyte profiling of case-control collections. PLoS
One, Vol.5, No.2, 2010), pp. e9166.
Dougherty, D. & Rauch, S.L. (1997). Neuroimaging and neurobiological models of depression.
Harv Rev Psychiatry, Vol.5, No.3, (Sep-Oct 1997), pp. 138-159.

42
Dratman, M.B. & Gordon, J.T. (1996). Thyroid hormones as neurotransmitters. Thyroid, Vol.6,
No.6, (Dec 1996), pp. 639-647.
Drevets, W.C. (2000a). Functional anatomical abnormalities in limbic and prefrontal cortical
structures in major depression. Prog Brain Res, Vol.126, 2000a), pp. 413-431.
Drevets, W.C. (2000b). Neuroimaging studies of mood disorders. Biol Psychiatry, Vol.48, No.8,
(Oct 15 2000b), pp. 813-829.
Drevets, W.C., Frank, E., Price, J.C., Kupfer, D.J., Holt, D., Greer, P.J., Huang, Y., Gautier, C.
& Mathis, C. (1999). PET imaging of serotonin 1A receptor binding in depression. Biol
Psychiatry, Vol.46, No.10, (Nov 15 1999), pp. 1375-1387.
Duman, R.S. (2004). Role of neurotrophic factors in the etiology and treatment of mood
disorders. Neuromolecular Med, Vol.5, No.1, 2004), pp. 11-25.
Duman, R.S., Heninger, G.R. & Nestler, E.J. (1997). A molecular and cellular theory of
depression. Arch Gen Psychiatry, Vol.54, No.7, (Jul 1997), pp. 597-606.
Duman, R.S., Malberg, J. & Thome, J. (1999). Neural plasticity to stress and antidepressant
treatment. Biol Psychiatry, Vol.46, No.9, (Nov 1 1999), pp. 1181-1191.
Duman, R.S. & Monteggia, L.M. (2006). A neurotrophic model for stress-related mood
disorders. Biol Psychiatry, Vol.59, No.12, (Jun 15 2006), pp. 1116-1127.
Dunn, A.J. & Swiergiel, A.H. (1999). Behavioral responses to stress are intact in CRF-deficient
mice. Brain Res, Vol.845, No.1, (Oct 16 1999), pp. 14-20.
Dunn, A.J., Swiergiel, A.H. & de Beaurepaire, R. (2005). Cytokines as mediators of depression:
what can we learn from animal studies? Neurosci Biobehav Rev, Vol.29, No.4-5, 2005),
pp. 891-909.
Duval, F., Mokrani, M.C., Crocq, M.A., Jautz, M., Bailey, P., Diep, T.S. & Macher, J.P. (1996).
Effect of antidepressant medication on morning and evening thyroid function tests during
a major depressive episode. Arch Gen Psychiatry, Vol.53, No.9, (Sep 1996), pp. 833-
840.
Ebert, D., Feistel, H., Barocka, A. & Kaschka, W. (1994). Increased limbic blood flow and total
sleep deprivation in major depression with melancholia. Psychiatry Res, Vol.55, No.2,
(Jun 1994), pp. 101-109.
Ebert, D., Feistel, H., Loew, T. & Pirner, A. (1996). Dopamine and depression--striatal dopamine
D2 receptor SPECT before and after antidepressant therapy. Psychopharmacology (Berl),
Vol.126, No.1, (Jul 1996), pp. 91-94.
Egan, M.F., Kojima, M., Callicott, J.H., Goldberg, T.E., Kolachana, B.S., Bertolino, A., Zaitsev,
E., Gold, B., Goldman, D., Dean, M., Lu, B. & Weinberger, D.R. (2003). The BDNF

43
val66met polymorphism affects activity-dependent secretion of BDNF and human
memory and hippocampal function. Cell, Vol.112, No.2, (Jan 24 2003), pp. 257-269.
Elhwuegi, A.S. (2004). Central monoamines and their role in major depression. Prog
Neuropsychopharmacol Biol Psychiatry, Vol.28, No.3, (May 2004), pp. 435-451.
Engelmann, M., Landgraf, R. & Wotjak, C.T. (2004). The hypothalamic-neurohypophysial
system regulates the hypothalamic-pituitary-adrenal axis under stress: an old concept
revisited. Front Neuroendocrinol, Vol.25, No.3-4, (Sep-Dec 2004), pp. 132-149.
Erhardt, A., Lucae, S., Unschuld, P.G., Ising, M., Kern, N., Salyakina, D., Lieb, R., Uhr, M.,
Binder, E.B., Keck, M.E., Muller-Myhsok, B. & Holsboer, F. (2007). Association of
polymorphisms in P2RX7 and CaMKKb with anxiety disorders. J Affect Disord, Vol.101,
No.1-3, (Aug 2007), pp. 159-168.
Evans, S.J., Choudary, P.V., Neal, C.R., Li, J.Z., Vawter, M.P., Tomita, H., Lopez, J.F.,
Thompson, R.C., Meng, F., Stead, J.D., Walsh, D.M., Myers, R.M., Bunney, W.E.,
Watson, S.J., Jones, E.G. & Akil, H. (2004). Dysregulation of the fibroblast growth factor
system in major depression. Proc Natl Acad Sci U S A, Vol.101, No.43, (Oct 26 2004),
pp. 15506-15511.
Faghihi, M.A., Zhang, M., Huang, J., Modarresi, F., Van der Brug, M.P., Nalls, M.A., Cookson,
M.R., St-Laurent, G., 3rd & Wahlestedt, C. (2010). Evidence for natural antisense
transcript-mediated inhibition of microRNA function. Genome Biol, Vol.11, No.5, 2010),
pp. R56.
Faith, M.S., Butryn, M., Wadden, T.A., Fabricatore, A., Nguyen, A.M. & Heymsfield, S.B.
(2011). Evidence for prospective associations among depression and obesity in
population-based studies. Obes Rev, Vol.12, No.5, (May 2011), pp. e438-453.
Faith, M.S., Matz, P.E. & Jorge, M.A. (2002). Obesity-depression associations in the population.
J Psychosom Res, Vol.53, No.4, (Oct 2002), pp. 935-942.
Farooqi, I.S., Matarese, G., Lord, G.M., Keogh, J.M., Lawrence, E., Agwu, C., Sanna, V., Jebb,
S.A., Perna, F., Fontana, S., Lechler, R.I., DePaoli, A.M. & O'Rahilly, S. (2002).
Beneficial effects of leptin on obesity, T cell hyporesponsiveness, and
neuroendocrine/metabolic dysfunction of human congenital leptin deficiency. J Clin
Invest, Vol.110, No.8, (Oct 2002), pp. 1093-1103.
Farr, S.A., Banks, W.A. & Morley, J.E. (2006). Effects of leptin on memory processing.
Peptides, Vol.27, No.6, (Jun 2006), pp. 1420-1425.
Felten, D.L. (1991). Neurotransmitter signaling of cells of the immune system: important
progress, major gaps. Brain Behav Immun, Vol.5, No.1, (Mar 1991), pp. 2-8.
Fernandez-Real, J.M., Vayreda, M., Richart, C., Gutierrez, C., Broch, M., Vendrell, J. & Ricart,
W. (2001). Circulating interleukin 6 levels, blood pressure, and insulin sensitivity in

44
apparently healthy men and women. J Clin Endocrinol Metab, Vol.86, No.3, (Mar 2001),
pp. 1154-1159.
Ferrari, D., Pizzirani, C., Adinolfi, E., Lemoli, R.M., Curti, A., Idzko, M., Panther, E. & Di
Virgilio, F. (2006). The P2X7 receptor: a key player in IL-1 processing and release. J
Immunol, Vol.176, No.7, (Apr 1 2006), pp. 3877-3883.
Fishman, P.H. & Finberg, J.P. (1987). Effect of the tricyclic antidepressant desipramine on beta-
adrenergic receptors in cultured rat glioma C6 cells. J Neurochem, Vol.49, No.1, (Jul
1987), pp. 282-289.
Ford, D.E. & Kamerow, D.B. (1989). Epidemiologic study of sleep disturbances and psychiatric
disorders. An opportunity for prevention? JAMA, Vol.262, No.11, (Sep 15 1989), pp.
1479-1484.
Francis, D., Diorio, J., Liu, D. & Meaney, M.J. (1999). Nongenomic transmission across
generations of maternal behavior and stress responses in the rat. Science, Vol.286,
No.5442, (Nov 5 1999), pp. 1155-1158.
Frasure-Smith, N., Lesperance, F. & Talajic, M. (1993). Depression following myocardial
infarction. Impact on 6-month survival. JAMA, Vol.270, No.15, (Oct 20 1993), pp. 1819-
1825.
Friedman, J.M. (1999). Leptin and the regulation of body weight. Harvey Lect, Vol.95, 1999),
pp. 107-136.
Frodl, T., Jager, M., Smajstrlova, I., Born, C., Bottlender, R., Palladino, T., Reiser, M., Moller,
H.J. & Meisenzahl, E.M. (2008). Effect of hippocampal and amygdala volumes on
clinical outcomes in major depression: a 3-year prospective magnetic resonance imaging
study. J Psychiatry Neurosci, Vol.33, No.5, (Sep 2008), pp. 423-430.
Froger, N., Gardier, A.M., Moratalla, R., Alberti, I., Lena, I., Boni, C., De Felipe, C., Rupniak,
N.M., Hunt, S.P., Jacquot, C., Hamon, M. & Lanfumey, L. (2001). 5-hydroxytryptamine
(5-HT)1A autoreceptor adaptive changes in substance P (neurokinin 1) receptor knock-
out mice mimic antidepressant-induced desensitization. J Neurosci, Vol.21, No.20, (Oct
15 2001), pp. 8188-8197.
Fu, C.H., Williams, S.C., Cleare, A.J., Brammer, M.J., Walsh, N.D., Kim, J., Andrew, C.M.,
Pich, E.M., Williams, P.M., Reed, L.J., Mitterschiffthaler, M.T., Suckling, J. & Bullmore,
E.T. (2004). Attenuation of the neural response to sad faces in major depression by
antidepressant treatment: a prospective, event-related functional magnetic resonance
imaging study. Arch Gen Psychiatry, Vol.61, No.9, (Sep 2004), pp. 877-889.
Garssen, B. & Goodkin, K. (1999). On the role of immunological factors as mediators between
psychosocial factors and cancer progression. Psychiatry Res, Vol.85, No.1, (Jan 18
1999), pp. 51-61.

45
Geuze, E., Vermetten, E. & Bremner, J.D. (2005). MR-based in vivo hippocampal volumetrics:
2. Findings in neuropsychiatric disorders. Mol Psychiatry, Vol.10, No.2, (Feb 2005), pp.
160-184.
Giedke, H. & Schwarzler, F. (2002). Therapeutic use of sleep deprivation in depression. Sleep
Med Rev, Vol.6, No.5, (Oct 2002), pp. 361-377.
Gil, K., Radzillowicz, P., Zdrojewski, T., Pakalska-Korcala, A., Chwojnicki, K., Piwonski, J.,
Ignaszewska-Wyrzykowska, A., Zaluga, L., Mielczarek, M., Landowski, J. &
Wyrzykowski, B. (2006). Relationship between the prevalence of depressive symptoms
and metabolic syndrome. Results of the SOPKARD Project. Kardiol Pol, Vol.64, No.5,
(May 2006), pp. 464-469.
Goldman, N., Glei, D.A., Lin, Y.H. & Weinstein, M. (2010). The serotonin transporter
polymorphism (5-HTTLPR): allelic variation and links with depressive symptoms.
Depress Anxiety, Vol.27, No.3, (Mar 2010), pp. 260-269.
Goldney, R.D., Fisher, L.J. & Hawthorne, G. (2004). Depression and the CIDI. Br J Psychiatry,
Vol.185, (Dec 2004), pp. 518-519.
Goodnick, P.J., Henry, J.H. & Buki, V.M. (1995). Treatment of depression in patients with
diabetes mellitus. J Clin Psychiatry, Vol.56, No.4, (Apr 1995), pp. 128-136.
Goodwin, F.K. & Bunney, W.E., Jr. (1971). Depressions following reserpine: a reevaluation.
Semin Psychiatry, Vol.3, No.4, (Nov 1971), pp. 435-448.
Gratacos, M., Gonzalez, J.R., Mercader, J.M., de Cid, R., Urretavizcaya, M. & Estivill, X.
(2007). Brain-derived neurotrophic factor Val66Met and psychiatric disorders: meta-
analysis of case-control studies confirm association to substance-related disorders, eating
disorders, and schizophrenia. Biol Psychiatry, Vol.61, No.7, (Apr 1 2007), pp. 911-922.
Gratacos, M., Soria, V., Urretavizcaya, M., Gonzalez, J.R., Crespo, J.M., Bayes, M., de Cid, R.,
Menchon, J.M., Vallejo, J. & Estivill, X. (2008). A brain-derived neurotrophic factor
(BDNF) haplotype is associated with antidepressant treatment outcome in mood
disorders. Pharmacogenomics J, Vol.8, No.2, (Apr 2008), pp. 101-112.
Griebel, G., Simiand, J., Serradeil-Le Gal, C., Wagnon, J., Pascal, M., Scatton, B., Maffrand, J.P.
& Soubrie, P. (2002). Anxiolytic- and antidepressant-like effects of the non-peptide
vasopressin V1b receptor antagonist, SSR149415, suggest an innovative approach for the
treatment of stress-related disorders. Proc Natl Acad Sci U S A, Vol.99, No.9, (Apr 30
2002), pp. 6370-6375.
Gross, C., Zhuang, X., Stark, K., Ramboz, S., Oosting, R., Kirby, L., Santarelli, L., Beck, S. &
Hen, R. (2002). Serotonin1A receptor acts during development to establish normal
anxiety-like behaviour in the adult. Nature, Vol.416, No.6879, (Mar 28 2002), pp. 396-
400.
46
Guiard, B.P., Przybylski, C., Guilloux, J.P., Seif, I., Froger, N., De Felipe, C., Hunt, S.P.,
Lanfumey, L. & Gardier, A.M. (2004). Blockade of substance P (neurokinin 1) receptors
enhances extracellular serotonin when combined with a selective serotonin reuptake
inhibitor: an in vivo microdialysis study in mice. J Neurochem, Vol.89, No.1, (Apr 2004),
pp. 54-63.
Hajek, T., Kozeny, J., Kopecek, M., Alda, M. & Hoschl, C. (2008). Reduced subgenual cingulate
volumes in mood disorders: a meta-analysis. J Psychiatry Neurosci, Vol.33, No.2, (Mar
2008), pp. 91-99.
Harbuz, M.S., Stephanou, A., Sarlis, N. & Lightman, S.L. (1992). The effects of recombinant
human interleukin (IL)-1 alpha, IL-1 beta or IL-6 on hypothalamo-pituitary-adrenal axis
activation. J Endocrinol, Vol.133, No.3, (Jun 1992), pp. 349-355.
Hariri, A.R., Mattay, V.S., Tessitore, A., Kolachana, B., Fera, F., Goldman, D., Egan, M.F. &
Weinberger, D.R. (2002). Serotonin transporter genetic variation and the response of the
human amygdala. Science, Vol.297, No.5580, (Jul 19 2002), pp. 400-403.
Heim, C. & Nemeroff, C.B. (2001). The role of childhood trauma in the neurobiology of mood
and anxiety disorders: preclinical and clinical studies. Biol Psychiatry, Vol.49, No.12,
(Jun 15 2001), pp. 1023-1039.
Heim, C., Newport, D.J., Wagner, D., Wilcox, M.M., Miller, A.H. & Nemeroff, C.B. (2002).
The role of early adverse experience and adulthood stress in the prediction of
neuroendocrine stress reactivity in women: a multiple regression analysis. Depress
Anxiety, Vol.15, No.3, 2002), pp. 117-125.
Heiman, M.L., Ahima, R.S., Craft, L.S., Schoner, B., Stephens, T.W. & Flier, J.S. (1997). Leptin
inhibition of the hypothalamic-pituitary-adrenal axis in response to stress. Endocrinology,
Vol.138, No.9, (Sep 1997), pp. 3859-3863.
Hein, M.D. & Jackson, I.M. (1990). Review: thyroid function in psychiatric illness. Gen Hosp
Psychiatry, Vol.12, No.4, (Jul 1990), pp. 232-244.
Herbert, J., Goodyer, I.M., Grossman, A.B., Hastings, M.H., de Kloet, E.R., Lightman, S.L.,
Lupien, S.J., Roozendaal, B. & Seckl, J.R. (2006). Do corticosteroids damage the brain? J
Neuroendocrinol, Vol.18, No.6, (Jun 2006), pp. 393-411.
Hohagen, F., Rink, K., Kappler, C., Schramm, E., Riemann, D., Weyerer, S. & Berger, M.
(1993). Prevalence and treatment of insomnia in general practice. A longitudinal study.
Eur Arch Psychiatry Clin Neurosci, Vol.242, No.6, 1993), pp. 329-336.
Holmes, A., Heilig, M., Rupniak, N.M., Steckler, T. & Griebel, G. (2003). Neuropeptide systems
as novel therapeutic targets for depression and anxiety disorders. Trends Pharmacol Sci,
Vol.24, No.11, (Nov 2003), pp. 580-588.
Holsboer, F. (2000). The stress hormone system is back on the map. Curr Psychiatry Rep, Vol.2,
No.6, (Dec 2000), pp. 454-456.

47
Hong, C.J., Chen, T.J., Yu, Y.W. & Tsai, S.J. (2006). Response to fluoxetine and serotonin 1A
receptor (C-1019G) polymorphism in Taiwan Chinese major depressive disorder.
Pharmacogenomics J, Vol.6, No.1, (Jan-Feb 2006), pp. 27-33.
Horacek, J., Kuzmiakova, M., Hoschl, C., Andel, M. & Bahbonh, R. (1999). The relationship
between central serotonergic activity and insulin sensitivity in healthy volunteers.
Psychoneuroendocrinology, Vol.24, No.8, (Nov 1999), pp. 785-797.
Hu, X.Z., Rush, A.J., Charney, D., Wilson, A.F., Sorant, A.J., Papanicolaou, G.J., Fava, M.,
Trivedi, M.H., Wisniewski, S.R., Laje, G., Paddock, S., McMahon, F.J., Manji, H. &
Lipsky, R.H. (2007). Association between a functional serotonin transporter promoter
polymorphism and citalopram treatment in adult outpatients with major depression. Arch
Gen Psychiatry, Vol.64, No.7, (Jul 2007), pp. 783-792.
Huang, Q., Rivest, R. & Richard, D. (1998). Effects of leptin on corticotropin-releasing factor
(CRF) synthesis and CRF neuron activation in the paraventricular hypothalamic nucleus
of obese (ob/ob) mice. Endocrinology, Vol.139, No.4, (Apr 1998), pp. 1524-1532.
Iga, J., Ueno, S. & Ohmori, T. (2008). Molecular assessment of depression from mRNAs in the
peripheral leukocytes. Ann Med, Vol.40, No.5, 2008), pp. 336-342.
Irie, M., Miyata, M. & Kasai, H. (2005). Depression and possible cancer risk due to oxidative
DNA damage. J Psychiatr Res, Vol.39, No.6, (Nov 2005), pp. 553-560.
Irwin, M., Patterson, T., Smith, T.L., Caldwell, C., Brown, S.A., Gillin, J.C. & Grant, I. (1990).
Reduction of immune function in life stress and depression. Biol Psychiatry, Vol.27,
No.1, (Jan 1 1990), pp. 22-30.
Ising, M., Horstmann, S., Kloiber, S., Lucae, S., Binder, E.B., Kern, N., Kunzel, H.E., Pfennig,
A., Uhr, M. & Holsboer, F. (2007). Combined dexamethasone/corticotropin releasing
hormone test predicts treatment response in major depression - a potential biomarker?
Biol Psychiatry, Vol.62, No.1, (Jul 1 2007), pp. 47-54.
Ising, M., Kunzel, H.E., Binder, E.B., Nickel, T., Modell, S. & Holsboer, F. (2005). The
combined dexamethasone/CRH test as a potential surrogate marker in depression. Prog
Neuropsychopharmacol Biol Psychiatry, Vol.29, No.6, (Jul 2005), pp. 1085-1093.
Jackson, I.M. (1998). The thyroid axis and depression. Thyroid, Vol.8, No.10, (Oct 1998), pp.
951-956.
Jow, G.M., Yang, T.T. & Chen, C.L. (2006). Leptin and cholesterol levels are low in major
depressive disorder, but high in schizophrenia. J Affect Disord, Vol.90, No.1, (Jan 2006),
pp. 21-27.
Kafka, M.S., Wirz-Justice, A., Naber, D., Moore, R.Y. & Benedito, M.A. (1983). Circadian
rhythms in rat brain neurotransmitter receptors. Fed Proc, Vol.42, No.11, (Aug 1983),
pp. 2796-2801.

48
Kask, A., Harro, J., von Horsten, S., Redrobe, J.P., Dumont, Y. & Quirion, R. (2002). The
neurocircuitry and receptor subtypes mediating anxiolytic-like effects of neuropeptide Y.
Neurosci Biobehav Rev, Vol.26, No.3, (May 2002), pp. 259-283.
Kato, M., Fukuda, T., Wakeno, M., Okugawa, G., Takekita, Y., Watanabe, S., Yamashita, M.,
Hosoi, Y., Azuma, J., Kinoshita, T. & Serretti, A. (2009). Effect of 5-HT1A gene
polymorphisms on antidepressant response in major depressive disorder. Am J Med Genet
B Neuropsychiatr Genet, Vol.150B, No.1, (Jan 5 2009), pp. 115-123.
Kato, M. & Serretti, A. (2010). Review and meta-analysis of antidepressant pharmacogenetic
findings in major depressive disorder. Mol Psychiatry, Vol.15, No.5, (May 2010), pp.
473-500.
Kelsoe, J.R., (2004). Mood disorders: Genetics, in: Sadock, BJ, Sadock, VA (Eds.), Kaplan and
Sadock's Comprehensive Textbook of Psychiatry. Lippincott Williams & Wilkins, pp.
1582-1594 %@ 0781734347 %0781734347 Eighth.
Kendler, K.S., Kuhn, J.W., Vittum, J., Prescott, C.A. & Riley, B. (2005). The interaction of
stressful life events and a serotonin transporter polymorphism in the prediction of
episodes of major depression: a replication. Arch Gen Psychiatry, Vol.62, No.5, (May
2005), pp. 529-535.
Kendler, K.S., Neale, M.C., Kessler, R.C., Heath, A.C. & Eaves, L.J. (1993). A longitudinal twin
study of 1-year prevalence of major depression in women. Arch Gen Psychiatry, Vol.50,
No.11, (Nov 1993), pp. 843-852.
Kessler, R.C., Chiu, W.T., Demler, O., Merikangas, K.R. & Walters, E.E. (2005). Prevalence,
severity, and comorbidity of 12-month DSM-IV disorders in the National Comorbidity
Survey Replication. Arch Gen Psychiatry, Vol.62, No.6, (Jun 2005), pp. 617-627.
Kiecolt-Glaser, J.K., Fisher, L.D., Ogrocki, P., Stout, J.C., Speicher, C.E. & Glaser, R. (1987).
Marital quality, marital disruption, and immune function. Psychosom Med, Vol.49, No.1,
(Jan-Feb 1987), pp. 13-34.
Kiecolt-Glaser, J.K., Marucha, P.T., Malarkey, W.B., Mercado, A.M. & Glaser, R. (1995).
Slowing of wound healing by psychological stress. Lancet, Vol.346, No.8984, (Nov 4
1995), pp. 1194-1196.
Kientsch, U., Burgi, S., Ruedeberg, C., Probst, S. & Honegger, U.E. (2001). St. John's wort
extract Ze 117 (Hypericum perforatum) inhibits norepinephrine and serotonin uptake into
rat brain slices and reduces 3-adrenoceptor numbers on cultured rat brain cells.
Pharmacopsychiatry, Vol.34 Suppl 1, (Jul 2001), pp. S56-60.
Kinder, L.S., Carnethon, M.R., Palaniappan, L.P., King, A.C. & Fortmann, S.P. (2004).
Depression and the metabolic syndrome in young adults: findings from the Third
National Health and Nutrition Examination Survey. Psychosom Med, Vol.66, No.3,
(May-Jun 2004), pp. 316-322.

49
Kirkegaard, C. & Faber, J. (1991). Free thyroxine and 3,3',5'-triiodothyronine levels in
cerebrospinal fluid in patients with endogenous depression. Acta Endocrinol (Copenh),
Vol.124, No.2, (Feb 1991), pp. 166-172.
Koolschijn, P.C., van Haren, N.E., Lensvelt-Mulders, G.J., Hulshoff Pol, H.E. & Kahn, R.S.
(2009). Brain volume abnormalities in major depressive disorder: a meta-analysis of
magnetic resonance imaging studies. Hum Brain Mapp, Vol.30, No.11, (Nov 2009), pp.
3719-3735.
Koslow, S.H., Stokes, P.E., Mendels, J., Ramsey, A. & Casper, R. (1982). Insulin tolerance test:
human growth hormone response and insulin resistance in primary unipolar depressed,
bipolar depressed and control subjects. Psychol Med, Vol.12, No.1, (Feb 1982), pp. 45-
55.
Kraft, J.B., Peters, E.J., Slager, S.L., Jenkins, G.D., Reinalda, M.S., McGrath, P.J. & Hamilton,
S.P. (2007). Analysis of association between the serotonin transporter and antidepressant
response in a large clinical sample. Biol Psychiatry, Vol.61, No.6, (Mar 15 2007), pp.
734-742.
Kraus, T., Haack, M., Schuld, A., Hinze-Selch, D. & Pollmacher, T. (2001). Low leptin levels
but normal body mass indices in patients with depression or schizophrenia.
Neuroendocrinology, Vol.73, No.4, (Apr 2001), pp. 243-247.
Krishnan, V. & Nestler, E.J. (2008). The molecular neurobiology of depression. Nature, Vol.455,
No.7215, (Oct 16 2008), pp. 894-902.
Kronmuller, K.T., Pantel, J., Kohler, S., Victor, D., Giesel, F., Magnotta, V.A., Mundt, C., Essig,
M. & Schroder, J. (2008). Hippocampal volume and 2-year outcome in depression. Br J
Psychiatry, Vol.192, No.6, (Jun 2008), pp. 472-473.
Kunzel, H.E., Binder, E.B., Nickel, T., Ising, M., Fuchs, B., Majer, M., Pfennig, A., Ernst, G.,
Kern, N., Schmid, D.A., Uhr, M., Holsboer, F. & Modell, S. (2003). Pharmacological and
nonpharmacological factors influencing hypothalamic-pituitary-adrenocortical axis
reactivity in acutely depressed psychiatric in-patients, measured by the Dex-CRH test.
Neuropsychopharmacology, Vol.28, No.12, (Dec 2003), pp. 2169-2178.
Ladd, C.O., Owens, M.J. & Nemeroff, C.B. (1996). Persistent changes in corticotropin-releasing
factor neuronal systems induced by maternal deprivation. Endocrinology, Vol.137, No.4,
(Apr 1996), pp. 1212-1218.
Laje, G., Allen, A.S., Akula, N., Manji, H., John Rush, A. & McMahon, F.J. (2009). Genome-
wide association study of suicidal ideation emerging during citalopram treatment of
depressed outpatients. Pharmacogenet Genomics, Vol.19, No.9, (Sep 2009), pp. 666-
674.
Laje, G., Paddock, S., Manji, H., Rush, A.J., Wilson, A.F., Charney, D. & McMahon, F.J.
(2007). Genetic markers of suicidal ideation emerging during citalopram treatment of
major depression. Am J Psychiatry, Vol.164, No.10, (Oct 2007), pp. 1530-1538.
50
Lam, R.W. (2006). Sleep disturbances and depression: a challenge for antidepressants. Int Clin
Psychopharmacol, Vol.21 Suppl 1, (Feb 2006), pp. S25-29.
Lasky-Su, J.A., Faraone, S.V., Glatt, S.J. & Tsuang, M.T. (2005). Meta-analysis of the
association between two polymorphisms in the serotonin transporter gene and affective
disorders. Am J Med Genet B Neuropsychiatr Genet, Vol.133B, No.1, (Feb 5 2005), pp.
110-115.
Lekman, M., Laje, G., Charney, D., Rush, A.J., Wilson, A.F., Sorant, A.J., Lipsky, R.,
Wisniewski, S.R., Manji, H., McMahon, F.J. & Paddock, S. (2008a). The FKBP5-gene in
depression and treatment response--an association study in the Sequenced Treatment
Alternatives to Relieve Depression (STAR*D) Cohort. Biol Psychiatry, Vol.63, No.12,
(Jun 15 2008a), pp. 1103-1110.
Lekman, M., Paddock, S. & McMahon, F.J. (2008b). Pharmacogenetics of major depression:
insights from level 1 of the Sequenced Treatment Alternatives to Relieve Depression
(STAR*D) trial. Mol Diagn Ther, Vol.12, No.5, 2008b), pp. 321-330.
Lemonde, S., Du, L., Bakish, D., Hrdina, P. & Albert, P.R. (2004). Association of the C(-1019)G
5-HT1A functional promoter polymorphism with antidepressant response. Int J
Neuropsychopharmacol, Vol.7, No.4, (Dec 2004), pp. 501-506.
Leonard, B.E. (1988). Stress, the immune system and psychiatric illness. Stress Medicine, Vol.4,
No.4, 1988), pp. 207-213 %U
http://onlinelibrary.wiley.com/doi/210.1002/smi.2460040405/abstract.
Lesch, K.P. (2004). Gene-environment interaction and the genetics of depression. J Psychiatry
Neurosci, Vol.29, No.3, (May 2004), pp. 174-184.
Lesch, K.P., Bengel, D., Heils, A., Sabol, S.Z., Greenberg, B.D., Petri, S., Benjamin, J., Muller,
C.R., Hamer, D.H. & Murphy, D.L. (1996). Association of anxiety-related traits with a
polymorphism in the serotonin transporter gene regulatory region. Science, Vol.274,
No.5292, (Nov 29 1996), pp. 1527-1531.
Leuchter, A.F., Cook, I.A., Gilmer, W.S., Marangell, L.B., Burgoyne, K.S., Howland, R.H.,
Trivedi, M.H., Zisook, S., Jain, R., Fava, M., Iosifescu, D. & Greenwald, S. (2009a).
Effectiveness of a quantitative electroencephalographic biomarker for predicting
differential response or remission with escitalopram and bupropion in major depressive
disorder. Psychiatry Res, Vol.169, No.2, (Sep 30 2009a), pp. 132-138.
Leuchter, A.F., Cook, I.A., Marangell, L.B., Gilmer, W.S., Burgoyne, K.S., Howland, R.H.,
Trivedi, M.H., Zisook, S., Jain, R., McCracken, J.T., Fava, M., Iosifescu, D. &
Greenwald, S. (2009b). Comparative effectiveness of biomarkers and clinical indicators
for predicting outcomes of SSRI treatment in Major Depressive Disorder: results of the
BRITE-MD study. Psychiatry Res, Vol.169, No.2, (Sep 30 2009b), pp. 124-131.

51
Leuchter, A.F., Uijtdehaage, S.H., Cook, I.A., O'Hara, R. & Mandelkern, M. (1999).
Relationship between brain electrical activity and cortical perfusion in normal subjects.
Psychiatry Res, Vol.90, No.2, (Apr 26 1999), pp. 125-140.
Levinson, D.F. (2006). The genetics of depression: a review. Biol Psychiatry, Vol.60, No.2, (Jul
15 2006), pp. 84-92.
Lin, E. & Chen, P.S. (2008). Pharmacogenomics with antidepressants in the STAR*D study.
Pharmacogenomics, Vol.9, No.7, (Jul 2008), pp. 935-946.
Lin, P.Y. & Tsai, G. (2004). Association between serotonin transporter gene promoter
polymorphism and suicide: results of a meta-analysis. Biol Psychiatry, Vol.55, No.10,
(May 15 2004), pp. 1023-1030.
Lindley, T.E., Infanger, D.W., Rishniw, M., Zhou, Y., Doobay, M.F., Sharma, R.V. & Davisson,
R.L. (2009). Scavenging superoxide selectively in mouse forebrain is associated with
improved cardiac function and survival following myocardial infarction. Am J Physiol
Regul Integr Comp Physiol, Vol.296, No.1, (Jan 2009), pp. R1-8.
Liu, D., Diorio, J., Tannenbaum, B., Caldji, C., Francis, D., Freedman, A., Sharma, S., Pearson,
D., Plotsky, P.M. & Meaney, M.J. (1997). Maternal care, hippocampal glucocorticoid
receptors, and hypothalamic-pituitary-adrenal responses to stress. Science, Vol.277,
No.5332, (Sep 12 1997), pp. 1659-1662.
Lohoff, F.W. (2010). Overview of the genetics of major depressive disorder. Curr Psychiatry
Rep, Vol.12, No.6, (Dec 2010), pp. 539-546.
Lopez-Leon, S., Janssens, A.C., Gonzalez-Zuloeta Ladd, A.M., Del-Favero, J., Claes, S.J.,
Oostra, B.A. & van Duijn, C.M. (2008). Meta-analyses of genetic studies on major
depressive disorder. Mol Psychiatry, Vol.13, No.8, (Aug 2008), pp. 772-785.
Lopez, V.A., Detera-Wadleigh, S., Cardona, I., Kassem, L. & McMahon, F.J. (2007). Nested
association between genetic variation in tryptophan hydroxylase II, bipolar affective
disorder, and suicide attempts. Biol Psychiatry, Vol.61, No.2, (Jan 15 2007), pp. 181-
186.
Lu, X., Lundstrom, L., Langel, U. & Bartfai, T. (2005). Galanin receptor ligands. Neuropeptides,
Vol.39, No.3, (Jun 2005), pp. 143-146.
Lu, X.Y., Kim, C.S., Frazer, A. & Zhang, W. (2006). Leptin: a potential novel antidepressant.
Proc Natl Acad Sci U S A, Vol.103, No.5, (Jan 31 2006), pp. 1593-1598.
Lucae, S., Salyakina, D., Barden, N., Harvey, M., Gagne, B., Labbe, M., Binder, E.B., Uhr, M.,
Paez-Pereda, M., Sillaber, I., Ising, M., Bruckl, T., Lieb, R., Holsboer, F. & Muller-
Myhsok, B. (2006). P2RX7, a gene coding for a purinergic ligand-gated ion channel, is

52
associated with major depressive disorder. Hum Mol Genet, Vol.15, No.16, (Aug 15
2006), pp. 2438-2445.
Luquet, S., Perez, F.A., Hnasko, T.S. & Palmiter, R.D. (2005). NPY/AgRP neurons are essential
for feeding in adult mice but can be ablated in neonates. Science, Vol.310, No.5748, (Oct
28 2005), pp. 683-685.
MacQueen, G.M., Campbell, S., McEwen, B.S., Macdonald, K., Amano, S., Joffe, R.T.,
Nahmias, C. & Young, L.T. (2003). Course of illness, hippocampal function, and
hippocampal volume in major depression. Proc Natl Acad Sci U S A, Vol.100, No.3, (Feb
4 2003), pp. 1387-1392.
MacQueen, G.M., Yucel, K., Taylor, V.H., Macdonald, K. & Joffe, R. (2008). Posterior
hippocampal volumes are associated with remission rates in patients with major
depressive disorder. Biol Psychiatry, Vol.64, No.10, (Nov 15 2008), pp. 880-883.
Maes, M. (1995). Evidence for an immune response in major depression: a review and
hypothesis. Prog Neuropsychopharmacol Biol Psychiatry, Vol.19, No.1, (Jan 1995), pp.
11-38.
Maes, M., Vandewoude, M., Schotte, C., Martin, M., Blockx, P., Scharpe, S. & Cosyns, P.
(1989). Hypothalamic-pituitary-adrenal and -thyroid axis dysfunctions and decrements in
the availability of L-tryptophan as biological markers of suicidal ideation in major
depressed females. Acta Psychiatr Scand, Vol.80, No.1, (Jul 1989), pp. 13-17.
Manji, H.K., Drevets, W.C. & Charney, D.S. (2001). The cellular neurobiology of depression.
Nat Med, Vol.7, No.5, (May 2001), pp. 541-547.
Manji, H.K., Quiroz, J.A., Sporn, J., Payne, J.L., Denicoff, K., N, A.G., Zarate, C.A., Jr. &
Charney, D.S. (2003). Enhancing neuronal plasticity and cellular resilience to develop
novel, improved therapeutics for difficult-to-treat depression. Biol Psychiatry, Vol.53,
No.8, (Apr 15 2003), pp. 707-742.
Mann, J.J. & Currier, D. (2006). Effects of genes and stress on the neurobiology of depression.
Int Rev Neurobiol, Vol.73, 2006), pp. 153-189.
Mannisto, P.T. & Kaakkola, S. (1999). Catechol-O-methyltransferase (COMT): biochemistry,
molecular biology, pharmacology, and clinical efficacy of the new selective COMT
inhibitors. Pharmacol Rev, Vol.51, No.4, (Dec 1999), pp. 593-628.
Matthews, S.C., Strigo, I.A., Simmons, A.N., Yang, T.T. & Paulus, M.P. (2008). Decreased
functional coupling of the amygdala and supragenual cingulate is related to increased
depression in unmedicated individuals with current major depressive disorder. J Affect
Disord, Vol.111, No.1, (Nov 2008), pp. 13-20.

53
Maubach, K.A., Martin, K., Chicchi, G., Harrison, T., Wheeldon, A., Swain, C.J., Cumberbatch,
M.J., Rupniak, N.M. & Seabrook, G.R. (2002). Chronic substance P (NK1) receptor
antagonist and conventional antidepressant treatment increases burst firing of monoamine
neurones in the locus coeruleus. Neuroscience, Vol.109, No.3, 2002), pp. 609-617.
Mayberg, H.S. (1997). Limbic-cortical dysregulation: a proposed model of depression. J
Neuropsychiatry Clin Neurosci, Vol.9, No.3, (Summer 1997), pp. 471-481.
Mayberg, H.S. (2003). Modulating dysfunctional limbic-cortical circuits in depression: towards
development of brain-based algorithms for diagnosis and optimised treatment. Br Med
Bull, Vol.65, 2003), pp. 193-207.
McCaffery, J.M., Niaura, R., Todaro, J.F., Swan, G.E. & Carmelli, D. (2003). Depressive
symptoms and metabolic risk in adult male twins enrolled in the National Heart, Lung,
and Blood Institute twin study. Psychosom Med, Vol.65, No.3, (May-Jun 2003), pp. 490-
497.
McCauley, J., Kern, D.E., Kolodner, K., Dill, L., Schroeder, A.F., DeChant, H.K., Ryden, J.,
Derogatis, L.R. & Bass, E.B. (1997). Clinical characteristics of women with a history of
childhood abuse: unhealed wounds. JAMA, Vol.277, No.17, (May 7 1997), pp. 1362-
1368.
McClung, C.A. (2007). Circadian genes, rhythms and the biology of mood disorders. Pharmacol
Ther, Vol.114, No.2, (May 2007), pp. 222-232.
McClung, C.A., Sidiropoulou, K., Vitaterna, M., Takahashi, J.S., White, F.J., Cooper, D.C. &
Nestler, E.J. (2005). Regulation of dopaminergic transmission and cocaine reward by the
Clock gene. Proc Natl Acad Sci U S A, Vol.102, No.26, (Jun 28 2005), pp. 9377-9381.
McGuffin, P., Knight, J., Breen, G., Brewster, S., Boyd, P.R., Craddock, N., Gill, M., Korszun,
A., Maier, W., Middleton, L., Mors, O., Owen, M.J., Perry, J., Preisig, M., Reich, T.,
Rice, J., Rietschel, M., Jones, L., Sham, P. & Farmer, A.E. (2005). Whole genome
linkage scan of recurrent depressive disorder from the depression network study. Hum
Mol Genet, Vol.14, No.22, (Nov 15 2005), pp. 3337-3345.
McIntyre, R.S., Park, K.Y., Law, C.W., Sultan, F., Adams, A., Lourenco, M.T., Lo, A.K.,
Soczynska, J.K., Woldeyohannes, H., Alsuwaidan, M., Yoon, J. & Kennedy, S.H. (2010).
The association between conventional antidepressants and the metabolic syndrome: a
review of the evidence and clinical implications. CNS Drugs, Vol.24, No.9, (Sep 1 2010),
pp. 741-753.
McKinnon, M.C., Yucel, K., Nazarov, A. & MacQueen, G.M. (2009). A meta-analysis
examining clinical predictors of hippocampal volume in patients with major depressive
disorder. J Psychiatry Neurosci, Vol.34, No.1, (Jan 2009), pp. 41-54.
McMahon, F.J., Buervenich, S., Charney, D., Lipsky, R., Rush, A.J., Wilson, A.F., Sorant, A.J.,
Papanicolaou, G.J., Laje, G., Fava, M., Trivedi, M.H., Wisniewski, S.R. & Manji, H.
(2006). Variation in the gene encoding the serotonin 2A receptor is associated with

54
outcome of antidepressant treatment. Am J Hum Genet, Vol.78, No.5, (May 2006), pp.
804-814.
Meaney, M.J. (2001). Maternal care, gene expression, and the transmission of individual
differences in stress reactivity across generations. Annu Rev Neurosci, Vol.24, 2001), pp.
1161-1192.
Merali, Z., Lacosta, S. & Anisman, H. (1997). Effects of interleukin-1beta and mild stress on
alterations of norepinephrine, dopamine and serotonin neurotransmission: a regional
microdialysis study. Brain Res, Vol.761, No.2, (Jul 4 1997), pp. 225-235.
Meynen, G., Unmehopa, U.A., van Heerikhuize, J.J., Hofman, M.A., Swaab, D.F. &
Hoogendijk, W.J. (2006). Increased arginine vasopressin mRNA expression in the human
hypothalamus in depression: A preliminary report. Biol Psychiatry, Vol.60, No.8, (Oct 15
2006), pp. 892-895.
Middeldorp, C.M., de Geus, E.J., Willemsen, G., Hottenga, J.J., Slagboom, P.E. & Boomsma,
D.I. (2010). The serotonin transporter gene length polymorphism (5-HTTLPR) and life
events: no evidence for an interaction effect on neuroticism and anxious depressive
symptoms. Twin Res Hum Genet, Vol.13, No.6, (Dec 2010), pp. 544-549.
Mill, J. & Petronis, A. (2007). Molecular studies of major depressive disorder: the epigenetic
perspective. Mol Psychiatry, Vol.12, No.9, (Sep 2007), pp. 799-814.
Millan, M.J. (2011). MicroRNA in the regulation and expression of serotonergic transmission in
the brain and other tissues. Curr Opin Pharmacol, Vol.11, No.1, (Feb 2011), pp. 11-22.
Moller, D.E. (2000). Potential role of TNF-alpha in the pathogenesis of insulin resistance and
type 2 diabetes. Trends Endocrinol Metab, Vol.11, No.6, (Aug 2000), pp. 212-217.
Morikawa, O., Sakai, N., Obara, H. & Saito, N. (1998). Effects of interferon-alpha, interferon-
gamma and cAMP on the transcriptional regulation of the serotonin transporter. Eur J
Pharmacol, Vol.349, No.2-3, (May 22 1998), pp. 317-324.
Mossner, R., Daniel, S., Schmitt, A., Albert, D. & Lesch, K.P. (2001). Modulation of serotonin
transporter function by interleukin-4. Life Sci, Vol.68, No.8, (Jan 12 2001), pp. 873-880.
Mossner, R. & Lesch, K.P. (1998). Role of serotonin in the immune system and in neuroimmune
interactions. Brain Behav Immun, Vol.12, No.4, (Dec 1998), pp. 249-271.
Munafo, M.R. & Flint, J. (2009). Replication and heterogeneity in gene x environment
interaction studies. Int J Neuropsychopharmacol, Vol.12, No.6, (Jul 2009), pp. 727-729.

55
Murphy, G.M., Jr., Hollander, S.B., Rodrigues, H.E., Kremer, C. & Schatzberg, A.F. (2004).
Effects of the serotonin transporter gene promoter polymorphism on mirtazapine and
paroxetine efficacy and adverse events in geriatric major depression. Arch Gen
Psychiatry, Vol.61, No.11, (Nov 2004), pp. 1163-1169.
Nakagawa, S., Kim, J.E., Lee, R., Chen, J., Fujioka, T., Malberg, J., Tsuji, S. & Duman, R.S.
(2002a). Localization of phosphorylated cAMP response element-binding protein in
immature neurons of adult hippocampus. J Neurosci, Vol.22, No.22, (Nov 15 2002a), pp.
9868-9876.
Nakagawa, S., Kim, J.E., Lee, R., Malberg, J.E., Chen, J., Steffen, C., Zhang, Y.J., Nestler, E.J.
& Duman, R.S. (2002b). Regulation of neurogenesis in adult mouse hippocampus by
cAMP and the cAMP response element-binding protein. J Neurosci, Vol.22, No.9, (May
1 2002b), pp. 3673-3682.
Nathan, C.F. (1987). Secretory products of macrophages. J Clin Invest, Vol.79, No.2, (Feb
1987), pp. 319-326.
Nemeroff, C.B. & Vale, W.W. (2005). The neurobiology of depression: inroads to treatment and
new drug discovery. J Clin Psychiatry, Vol.66 Suppl 7, 2005), pp. 5-13.
Nestler, E.J. (1998). Antidepressant treatments in the 21st century. Biol Psychiatry, Vol.44,
No.7, (Oct 1 1998), pp. 526-533.
Nestler, E.J., Barrot, M., DiLeone, R.J., Eisch, A.J., Gold, S.J. & Monteggia, L.M. (2002).
Neurobiology of depression. Neuron, Vol.34, No.1, (Mar 28 2002), pp. 13-25.
Nestler, E.J. & Carlezon, W.A., Jr. (2006). The mesolimbic dopamine reward circuit in
depression. Biol Psychiatry, Vol.59, No.12, (Jun 15 2006), pp. 1151-1159.
Nestler, E.J. & Hyman, S.E. (2010). Animal models of neuropsychiatric disorders. Nat Neurosci,
Vol.13, No.10, (Oct 2010), pp. 1161-1169.
O'Rahilly, S. (2002). Leptin: defining its role in humans by the clinical study of genetic
disorders. Nutr Rev, Vol.60, No.10 Pt 2, (Oct 2002), pp. S30-34; discussion S68-84, 85-
37.
Ogren, S.O., Kuteeva, E., Hokfelt, T. & Kehr, J. (2006). Galanin receptor antagonists : a
potential novel pharmacological treatment for mood disorders. CNS Drugs, Vol.20, No.8,
2006), pp. 633-654.
Okamura, F., Tashiro, A., Utumi, A., Imai, T., Suchi, T., Tamura, D., Sato, Y., Suzuki, S. &
Hongo, M. (2000). Insulin resistance in patients with depression and its changes during
the clinical course of depression: minimal model analysis. Metabolism, Vol.49, No.10,
(Oct 2000), pp. 1255-1260.
Olff, M. (1999). Stress, depression and immunity: the role of defense and coping styles.
Psychiatry Res, Vol.85, No.1, (Jan 18 1999), pp. 7-15.
56
Ongur, D., Drevets, W.C. & Price, J.L. (1998). Glial reduction in the subgenual prefrontal cortex
in mood disorders. Proc Natl Acad Sci U S A, Vol.95, No.22, (Oct 27 1998), pp. 13290-
13295.
Overstreet, D.H. & Griebel, G. (2005). Antidepressant-like effects of the vasopressin V1b
receptor antagonist SSR149415 in the Flinders Sensitive Line rat. Pharmacol Biochem
Behav, Vol.82, No.1, (Sep 2005), pp. 223-227.
Paddock, S. (2008). Genetic variation in GRIK4 and the implications for antidepressant
treatment. Pharmacogenomics, Vol.9, No.2, (Feb 2008), pp. 133-135.
Pagnin, D., de Queiroz, V., Pini, S. & Cassano, G.B. (2004). Efficacy of ECT in depression: a
meta-analytic review. J ECT, Vol.20, No.1, (Mar 2004), pp. 13-20.
Paile-Hyvarinen, M., Raikkonen, K., Forsen, T., Kajantie, E., Yliharsila, H., Salonen, M.K.,
Osmond, C. & Eriksson, J.G. (2007). Depression and its association with diabetes,
cardiovascular disease, and birth weight. Ann Med, Vol.39, No.8, 2007), pp. 634-640.
Papanicolaou, D.A., Wilder, R.L., Manolagas, S.C. & Chrousos, G.P. (1998). The
pathophysiologic roles of interleukin-6 in human disease. Ann Intern Med, Vol.128, No.2,
(Jan 15 1998), pp. 127-137.
Papiol, S., Arias, B., Gasto, C., Gutierrez, B., Catalan, R. & Fananas, L. (2007). Genetic
variability at HPA axis in major depression and clinical response to antidepressant
treatment. J Affect Disord, Vol.104, No.1-3, (Dec 2007), pp. 83-90.
Pecina, S., Smith, K.S. & Berridge, K.C. (2006). Hedonic hot spots in the brain. Neuroscientist,
Vol.12, No.6, (Dec 2006), pp. 500-511.
Pencea, V., Bingaman, K.D., Wiegand, S.J. & Luskin, M.B. (2001). Infusion of brain-derived
neurotrophic factor into the lateral ventricle of the adult rat leads to new neurons in the
parenchyma of the striatum, septum, thalamus, and hypothalamus. J Neurosci, Vol.21,
No.17, (Sep 1 2001), pp. 6706-6717.
Perlis, R.H., Moorjani, P., Fagerness, J., Purcell, S., Trivedi, M.H., Fava, M., Rush, A.J. &
Smoller, J.W. (2008). Pharmacogenetic analysis of genes implicated in rodent models of
antidepressant response: association of TREK1 and treatment resistance in the STAR(*)D
study. Neuropsychopharmacology, Vol.33, No.12, (Nov 2008), pp. 2810-2819.
Perlis, R.H., Purcell, S., Fava, M., Fagerness, J., Rush, A.J., Trivedi, M.H. & Smoller, J.W.
(2007). Association between treatment-emergent suicidal ideation with citalopram and
polymorphisms near cyclic adenosine monophosphate response element binding protein
in the STAR*D study. Arch Gen Psychiatry, Vol.64, No.6, (Jun 2007), pp. 689-697.
Peters, E.J., Slager, S.L., Kraft, J.B., Jenkins, G.D., Reinalda, M.S., McGrath, P.J. & Hamilton,
S.P. (2008). Pharmacokinetic genes do not influence response or tolerance to citalopram
in the STAR*D sample. PLoS One, Vol.3, No.4, 2008), pp. e1872.

57
Pezawas, L., Meyer-Lindenberg, A., Drabant, E.M., Verchinski, B.A., Munoz, K.E., Kolachana,
B.S., Egan, M.F., Mattay, V.S., Hariri, A.R. & Weinberger, D.R. (2005). 5-HTTLPR
polymorphism impacts human cingulate-amygdala interactions: a genetic susceptibility
mechanism for depression. Nat Neurosci, Vol.8, No.6, (Jun 2005), pp. 828-834.
Pezawas, L., Meyer-Lindenberg, A., Goldman, A.L., Verchinski, B.A., Chen, G., Kolachana,
B.S., Egan, M.F., Mattay, V.S., Hariri, A.R. & Weinberger, D.R. (2008). Evidence of
biologic epistasis between BDNF and SLC6A4 and implications for depression. Mol
Psychiatry, Vol.13, No.7, (Jul 2008), pp. 709-716.
Pineyro, G. & Blier, P. (1999). Autoregulation of serotonin neurons: role in antidepressant drug
action. Pharmacol Rev, Vol.51, No.3, (Sep 1999), pp. 533-591.
Pizzagalli, D., Pascual-Marqui, R.D., Nitschke, J.B., Oakes, T.R., Larson, C.L., Abercrombie,
H.C., Schaefer, S.M., Koger, J.V., Benca, R.M. & Davidson, R.J. (2001). Anterior
cingulate activity as a predictor of degree of treatment response in major depression:
evidence from brain electrical tomography analysis. Am J Psychiatry, Vol.158, No.3,
(Mar 2001), pp. 405-415.
Porcelli, S., Drago, A., Fabbri, C., Gibiino, S., Calati, R. & Serretti, A. (2010). Pharmacogenetics
of antidepressant response. J Psychiatry Neurosci, Vol.36, No.2, (Mar 2010), pp. 87-113.
Purba, J.S., Hoogendijk, W.J., Hofman, M.A. & Swaab, D.F. (1996). Increased number of
vasopressin- and oxytocin-expressing neurons in the paraventricular nucleus of the
hypothalamus in depression. Arch Gen Psychiatry, Vol.53, No.2, (Feb 1996), pp. 137-
143.
Radcliffe, R.A., Lee, M.J. & Williams, R.W. (2006). Prediction of cis-QTLs in a pair of inbred
mouse strains with the use of expression and haplotype data from public databases.
Mamm Genome, Vol.17, No.6, (Jun 2006), pp. 629-642.
Raedler, T.J. & Wiedemann, K. (2006). CSF-studies in neuropsychiatric disorders. Neuro
Endocrinol Lett, Vol.27, No.3, (Jun 2006), pp. 297-305.
Raikkonen, K., Matthews, K.A. & Kuller, L.H. (2007). Depressive symptoms and stressful life
events predict metabolic syndrome among middle-aged women: a comparison of World
Health Organization, Adult Treatment Panel III, and International Diabetes Foundation
definitions. Diabetes Care, Vol.30, No.4, (Apr 2007), pp. 872-877.
Raison, C.L. & Miller, A.H. (2003). When not enough is too much: the role of insufficient
glucocorticoid signaling in the pathophysiology of stress-related disorders. Am J
Psychiatry, Vol.160, No.9, (Sep 2003), pp. 1554-1565.
Rajasethupathy, P., Fiumara, F., Sheridan, R., Betel, D., Puthanveettil, S.V., Russo, J.J., Sander,
C., Tuschl, T. & Kandel, E. (2009). Characterization of small RNAs in Aplysia reveals a
role for miR-124 in constraining synaptic plasticity through CREB. Neuron, Vol.63,
No.6, (Sep 24 2009), pp. 803-817.

58
Rajkowska, G. (2000). Postmortem studies in mood disorders indicate altered numbers of
neurons and glial cells. Biol Psychiatry, Vol.48, No.8, (Oct 15 2000), pp. 766-777.
Rajkowska, G., Miguel-Hidalgo, J.J., Wei, J., Dilley, G., Pittman, S.D., Meltzer, H.Y.,
Overholser, J.C., Roth, B.L. & Stockmeier, C.A. (1999). Morphometric evidence for
neuronal and glial prefrontal cell pathology in major depression. Biol Psychiatry, Vol.45,
No.9, (May 1 1999), pp. 1085-1098.
Raju, T.N. (1998). The Nobel chronicles. 1927: Julius Wagner-Jauregg (1857-1940). Lancet,
Vol.352, No.9141, (Nov 21 1998), pp. 1714.
Redrobe, J.P., Dumont, Y., Fournier, A. & Quirion, R. (2002). The neuropeptide Y (NPY) Y1
receptor subtype mediates NPY-induced antidepressant-like activity in the mouse forced
swimming test. Neuropsychopharmacology, Vol.26, No.5, (May 2002), pp. 615-624.
Reiche, E.M., Morimoto, H.K. & Nunes, S.M. (2005). Stress and depression-induced immune
dysfunction: implications for the development and progression of cancer. Int Rev
Psychiatry, Vol.17, No.6, (Dec 2005), pp. 515-527.
Reichlin, S. (1993). Neuroendocrine-immune interactions. N Engl J Med, Vol.329, No.17, (Oct
21 1993), pp. 1246-1253.
Renthal, W., Maze, I., Krishnan, V., Covington, H.E., 3rd, Xiao, G., Kumar, A., Russo, S.J.,
Graham, A., Tsankova, N., Kippin, T.E., Kerstetter, K.A., Neve, R.L., Haggarty, S.J.,
McKinsey, T.A., Bassel-Duby, R., Olson, E.N. & Nestler, E.J. (2007). Histone
deacetylase 5 epigenetically controls behavioral adaptations to chronic emotional stimuli.
Neuron, Vol.56, No.3, (Nov 8 2007), pp. 517-529.
Riemann, D. (2007). Insomnia and comorbid psychiatric disorders. Sleep Med, Vol.8 Suppl 4,
(Dec 2007), pp. S15-20.
Riemann, D., Berger, M. & Voderholzer, U. (2001). Sleep and depression--results from
psychobiological studies: an overview. Biol Psychol, Vol.57, No.1-3, (Jul-Aug 2001),
pp. 67-103.
Risch, N., Herrell, R., Lehner, T., Liang, K.Y., Eaves, L., Hoh, J., Griem, A., Kovacs, M., Ott, J.
& Merikangas, K.R. (2009). Interaction between the serotonin transporter gene (5-
HTTLPR), stressful life events, and risk of depression: a meta-analysis. JAMA, Vol.301,
No.23, (Jun 17 2009), pp. 2462-2471.
Rizza, R.A., Mandarino, L.J. & Gerich, J.E. (1982). Cortisol-induced insulin resistance in man:
impaired suppression of glucose production and stimulation of glucose utilization due to
a postreceptor detect of insulin action. J Clin Endocrinol Metab, Vol.54, No.1, (Jan
1982), pp. 131-138.
Rosenkranz, J.A., Venheim, E.R. & Padival, M. (2010). Chronic stress causes amygdala
hyperexcitability in rodents. Biol Psychiatry, Vol.67, No.12, (Jun 15 2010), pp. 1128-
1136.

59
Rotzinger, S., Lovejoy, D.A. & Tan, L.A. (2010). Behavioral effects of neuropeptides in rodent
models of depression and anxiety. Peptides, Vol.31, No.4, (Apr 2010), pp. 736-756.
Roybal, K., Theobold, D., Graham, A., DiNieri, J.A., Russo, S.J., Krishnan, V., Chakravarty, S.,
Peevey, J., Oehrlein, N., Birnbaum, S., Vitaterna, M.H., Orsulak, P., Takahashi, J.S.,
Nestler, E.J., Carlezon, W.A., Jr. & McClung, C.A. (2007). Mania-like behavior induced
by disruption of CLOCK. Proc Natl Acad Sci U S A, Vol.104, No.15, (Apr 10 2007), pp.
6406-6411.
Rubin, R.T., Heist, E.K., McGeoy, S.S., Hanada, K. & Lesser, I.M. (1992). Neuroendocrine
aspects of primary endogenous depression. XI. Serum melatonin measures in patients and
matched control subjects. Arch Gen Psychiatry, Vol.49, No.7, (Jul 1992), pp. 558-567.
Rubin, R.T., Rhodes, M.E. & Czambel, R.K. (2002). Sexual diergism of baseline plasma leptin
and leptin suppression by arginine vasopressin in major depressives and matched
controls. Psychiatry Res, Vol.113, No.3, (Dec 30 2002), pp. 255-268.
Sabol, S.Z., Hu, S. & Hamer, D. (1998). A functional polymorphism in the monoamine oxidase
A gene promoter. Hum Genet, Vol.103, No.3, (Sep 1998), pp. 273-279.
Saletu, B., Anderer, P. & Saletu-Zyhlarz, G.M. (2010). EEG topography and tomography
(LORETA) in diagnosis and pharmacotherapy of depression. Clin EEG Neurosci, Vol.41,
No.4, (Oct 2010), pp. 203-210.
Salome, N., Stemmelin, J., Cohen, C. & Griebel, G. (2006). Differential roles of amygdaloid
nuclei in the anxiolytic- and antidepressant-like effects of the V1b receptor antagonist,
SSR149415, in rats. Psychopharmacology (Berl), Vol.187, No.2, (Aug 2006), pp. 237-
244.
Santarelli, L., Gobbi, G., Debs, P.C., Sibille, E.T., Blier, P., Hen, R. & Heath, M.J. (2001).
Genetic and pharmacological disruption of neurokinin 1 receptor function decreases
anxiety-related behaviors and increases serotonergic function. Proc Natl Acad Sci U S A,
Vol.98, No.4, (Feb 13 2001), pp. 1912-1917.
Santarelli, L., Saxe, M., Gross, C., Surget, A., Battaglia, F., Dulawa, S., Weisstaub, N., Lee, J.,
Duman, R., Arancio, O., Belzung, C. & Hen, R. (2003). Requirement of hippocampal
neurogenesis for the behavioral effects of antidepressants. Science, Vol.301, No.5634,
(Aug 8 2003), pp. 805-809.
Scharinger, C., Rabl, U., Sitte, H.H. & Pezawas, L. (2010). Imaging genetics of mood disorders.
Neuroimage, Vol.53, No.3, (Nov 15 2010), pp. 810-821.
Schildkraut, J.J. (1965). The catecholamine hypothesis of affective disorders: a review of
supporting evidence. Am J Psychiatry, Vol.122, No.5, (Nov 1965), pp. 509-522.
Schinka, J.A., Busch, R.M. & Robichaux-Keene, N. (2004). A meta-analysis of the association
between the serotonin transporter gene polymorphism (5-HTTLPR) and trait anxiety. Mol
Psychiatry, Vol.9, No.2, (Feb 2004), pp. 197-202.

60
Schule, C., Zill, P., Baghai, T.C., Eser, D., Zwanzger, P., Wenig, N., Rupprecht, R. & Bondy, B.
(2006). Brain-derived neurotrophic factor Val66Met polymorphism and
dexamethasone/CRH test results in depressed patients. Psychoneuroendocrinology,
Vol.31, No.8, (Sep 2006), pp. 1019-1025.
Schwarz, M.J., Spath, M., Muller-Bardorff, H., Pongratz, D.E., Bondy, B. & Ackenheil, M.
(1999). Relationship of substance P, 5-hydroxyindole acetic acid and tryptophan in serum
of fibromyalgia patients. Neurosci Lett, Vol.259, No.3, (Jan 15 1999), pp. 196-198.
Scott, K.M., McGee, M.A., Wells, J.E. & Oakley Browne, M.A. (2008). Obesity and mental
disorders in the adult general population. J Psychosom Res, Vol.64, No.1, (Jan 2008), pp.
97-105.
Sen, S., Burmeister, M. & Ghosh, D. (2004). Meta-analysis of the association between a
serotonin transporter promoter polymorphism (5-HTTLPR) and anxiety-related
personality traits. Am J Med Genet B Neuropsychiatr Genet, Vol.127B, No.1, (May 15
2004), pp. 85-89.
Sen, S., Duman, R. & Sanacora, G. (2008). Serum brain-derived neurotrophic factor, depression,
and antidepressant medications: meta-analyses and implications. Biol Psychiatry, Vol.64,
No.6, (Sep 15 2008), pp. 527-532.
Sequeira, A., Mamdani, F., Ernst, C., Vawter, M.P., Bunney, W.E., Lebel, V., Rehal, S.,
Klempan, T., Gratton, A., Benkelfat, C., Rouleau, G.A., Mechawar, N. & Turecki, G.
(2009). Global brain gene expression analysis links glutamatergic and GABAergic
alterations to suicide and major depression. PLoS One, Vol.4, No.8, 2009), pp. e6585.
Sequeira, A. & Turecki, G. (2006). Genome wide gene expression studies in mood disorders.
OMICS, Vol.10, No.4, (Winter 2006), pp. 444-454.
Serretti, A., Artioli, P., Lorenzi, C., Pirovano, A., Tubazio, V. & Zanardi, R. (2004). The C(-
1019)G polymorphism of the 5-HT1A gene promoter and antidepressant response in
mood disorders: preliminary findings. Int J Neuropsychopharmacol, Vol.7, No.4, (Dec
2004), pp. 453-460.
Serretti, A., Benedetti, F., Zanardi, R. & Smeraldi, E. (2005). The influence of Serotonin
Transporter Promoter Polymorphism (SERTPR) and other polymorphisms of the
serotonin pathway on the efficacy of antidepressant treatments. Prog
Neuropsychopharmacol Biol Psychiatry, Vol.29, No.6, (Jul 2005), pp. 1074-1084.
Serretti, A., Zanardi, R., Cusin, C., Rossini, D., Lorenzi, C. & Smeraldi, E. (2001a). Tryptophan
hydroxylase gene associated with paroxetine antidepressant activity. Eur
Neuropsychopharmacol, Vol.11, No.5, (Oct 2001a), pp. 375-380.
Serretti, A., Zanardi, R., Rossini, D., Cusin, C., Lilli, R. & Smeraldi, E. (2001b). Influence of
tryptophan hydroxylase and serotonin transporter genes on fluvoxamine antidepressant
activity. Mol Psychiatry, Vol.6, No.5, (Sep 2001b), pp. 586-592.

61
Sharpley, A.L. & Cowen, P.J. (1995). Effect of pharmacologic treatments on the sleep of
depressed patients. Biol Psychiatry, Vol.37, No.2, (Jan 15 1995), pp. 85-98.
Sheline, Y.I., Barch, D.M., Donnelly, J.M., Ollinger, J.M., Snyder, A.Z. & Mintun, M.A. (2001).
Increased amygdala response to masked emotional faces in depressed subjects resolves
with antidepressant treatment: an fMRI study. Biol Psychiatry, Vol.50, No.9, (Nov 1
2001), pp. 651-658.
Sher, L. (2006). Combined dexamethasone suppression-corticotropin-releasing hormone
stimulation test in studies of depression, alcoholism, and suicidal behavior.
ScientificWorldJournal, Vol.6, 2006), pp. 1398-1404.
Shieh, K.R., Chu, Y.S. & Pan, J.T. (1997). Circadian change of dopaminergic neuron activity:
effects of constant light and melatonin. Neuroreport, Vol.8, No.9-10, (Jul 7 1997), pp.
2283-2287.
Shirayama, Y., Chen, A.C., Nakagawa, S., Russell, D.S. & Duman, R.S. (2002). Brain-derived
neurotrophic factor produces antidepressant effects in behavioral models of depression. J
Neurosci, Vol.22, No.8, (Apr 15 2002), pp. 3251-3261.
Shyn, S.I. & Hamilton, S.P. (2010). The genetics of major depression: moving beyond the
monoamine hypothesis. Psychiatr Clin North Am, Vol.33, No.1, (Mar 2010), pp. 125-
140.
Sibille, E., Wang, Y., Joeyen-Waldorf, J., Gaiteri, C., Surget, A., Oh, S., Belzung, C., Tseng,
G.C. & Lewis, D.A. (2009). A molecular signature of depression in the amygdala. Am J
Psychiatry, Vol.166, No.9, (Sep 2009), pp. 1011-1024.
Siuciak, J.A., Lewis, D.R., Wiegand, S.J. & Lindsay, R.M. (1997). Antidepressant-like effect of
brain-derived neurotrophic factor (BDNF). Pharmacol Biochem Behav, Vol.56, No.1,
(Jan 1997), pp. 131-137.
Sluzewska, A., Rybakowski, J., Bosmans, E., Sobieska, M., Berghmans, R., Maes, M. &
Wiktorowicz, K. (1996). Indicators of immune activation in major depression. Psychiatry
Res, Vol.64, No.3, (Oct 16 1996), pp. 161-167.
Smith, K.E., Walker, M.W., Artymyshyn, R., Bard, J., Borowsky, B., Tamm, J.A., Yao, W.J.,
Vaysse, P.J., Branchek, T.A., Gerald, C. & Jones, K.A. (1998). Cloned human and rat
galanin GALR3 receptors. Pharmacology and activation of G-protein inwardly rectifying
K+ channels. J Biol Chem, Vol.273, No.36, (Sep 4 1998), pp. 23321-23326.
Smith, R.S. (1991). The macrophage theory of depression. Med Hypotheses, Vol.35, No.4, (Aug
1991), pp. 298-306.
Song, C., Dinan, T. & Leonard, B.E. (1994). Changes in immunoglobulin, complement and acute
phase protein levels in the depressed patients and normal controls. J Affect Disord,
Vol.30, No.4, (Apr 1994), pp. 283-288.

62
Song, C., Merali, Z. & Anisman, H. (1999). Variations of nucleus accumbens dopamine and
serotonin following systemic interleukin-1, interleukin-2 or interleukin-6 treatment.
Neuroscience, Vol.88, No.3, 1999), pp. 823-836.
Spijker, S., Van Zanten, J.S., De Jong, S., Penninx, B.W., van Dyck, R., Zitman, F.G., Smit,
J.H., Ylstra, B., Smit, A.B. & Hoogendijk, W.J. (2010). Stimulated gene expression
profiles as a blood marker of major depressive disorder. Biol Psychiatry, Vol.68, No.2,
(Jul 15 2010), pp. 179-186.
Srinivasan, V., Smits, M., Spence, W., Lowe, A.D., Kayumov, L., Pandi-Perumal, S.R., Parry, B.
& Cardinali, D.P. (2006). Melatonin in mood disorders. World J Biol Psychiatry, Vol.7,
No.3, 2006), pp. 138-151.
Stahl, S. (1994). 5HT1A receptors and pharmacotherapy. Is serotonin receptor down-regulation
linked to the mechanism of action of antidepressant drugs? Psychopharmacol Bull,
Vol.30, No.1, 1994), pp. 39-43.
Strobel, A., Gutknecht, L., Rothe, C., Reif, A., Mossner, R., Zeng, Y., Brocke, B. & Lesch, K.P.
(2003). Allelic variation in 5-HT1A receptor expression is associated with anxiety- and
depression-related personality traits. J Neural Transm, Vol.110, No.12, (Dec 2003), pp.
1445-1453.
Sullivan, P.F., Neale, M.C. & Kendler, K.S. (2000). Genetic epidemiology of major depression:
review and meta-analysis. Am J Psychiatry, Vol.157, No.10, (Oct 2000), pp. 1552-1562.
Surguladze, S., Brammer, M.J., Keedwell, P., Giampietro, V., Young, A.W., Travis, M.J.,
Williams, S.C. & Phillips, M.L. (2005). A differential pattern of neural response toward
sad versus happy facial expressions in major depressive disorder. Biol Psychiatry, Vol.57,
No.3, (Feb 1 2005), pp. 201-209.
Szegedi, A., Rujescu, D., Tadic, A., Muller, M.J., Kohnen, R., Stassen, H.H. & Dahmen, N.
(2005). The catechol-O-methyltransferase Val108/158Met polymorphism affects short-
term treatment response to mirtazapine, but not to paroxetine in major depression.
Pharmacogenomics J, Vol.5, No.1, 2005), pp. 49-53.
Tadic, A., Wagner, S., Schlicht, K.F., Peetz, D., Borysenko, L., Dreimuller, N., Hiemke, C. &
Lieb, K. (2011). The early non-increase of serum BDNF predicts failure of antidepressant
treatment in patients with major depression: a pilot study. Prog Neuropsychopharmacol
Biol Psychiatry, Vol.35, No.2, (Mar 30 2011), pp. 415-420.
Takahashi, M., Terwilliger, R., Lane, C., Mezes, P.S., Conti, M. & Duman, R.S. (1999). Chronic
antidepressant administration increases the expression of cAMP-specific
phosphodiesterase 4A and 4B isoforms. J Neurosci, Vol.19, No.2, (Jan 15 1999), pp.
610-618.
Terman, M. & Terman, J.S. (2005). Light therapy for seasonal and nonseasonal depression:
efficacy, protocol, safety, and side effects. CNS Spectr, Vol.10, No.8, (Aug 2005), pp.
647-663; quiz 672.
63
Tfilin, M., Sudai, E., Merenlender, A., Gispan, I., Yadid, G. & Turgeman, G. (2009).
Mesenchymal stem cells increase hippocampal neurogenesis and counteract depressive-
like behavior. Mol Psychiatry, Vol.15, No.12, (Dec 2009), pp. 1164-1175.
Thase, M.E. (2007). Molecules that mediate mood. N Engl J Med, Vol.357, No.23, (Dec 6 2007),
pp. 2400-2402.
Thase, M.E., Kupfer, D.J., Fasiczka, A.J., Buysse, D.J., Simons, A.D. & Frank, E. (1997).
Identifying an abnormal electroencephalographic sleep profile to characterize major
depressive disorder. Biol Psychiatry, Vol.41, No.9, (May 1 1997), pp. 964-973.
Thompson, C., Mezey, G., Corn, T., Franey, C., English, J., Arendt, J. & Checkley, S.A. (1985).
The effect of desipramine upon melatonin and cortisol secretion in depressed and normal
subjects. Br J Psychiatry, Vol.147, (Oct 1985), pp. 389-393.
Trivedi, M.H., Rush, A.J., Wisniewski, S.R., Nierenberg, A.A., Warden, D., Ritz, L., Norquist,
G., Howland, R.H., Lebowitz, B., McGrath, P.J., Shores-Wilson, K., Biggs, M.M.,
Balasubramani, G.K. & Fava, M. (2006). Evaluation of outcomes with citalopram for
depression using measurement-based care in STAR*D: implications for clinical practice.
Am J Psychiatry, Vol.163, No.1, (Jan 2006), pp. 28-40.
Tsai, S.J., Cheng, C.Y., Yu, Y.W., Chen, T.J. & Hong, C.J. (2003). Association study of a brain-
derived neurotrophic-factor genetic polymorphism and major depressive disorders,
symptomatology, and antidepressant response. Am J Med Genet B Neuropsychiatr Genet,
Vol.123B, No.1, (Nov 15 2003), pp. 19-22.
Tsankova, N.M., Berton, O., Renthal, W., Kumar, A., Neve, R.L. & Nestler, E.J. (2006).
Sustained hippocampal chromatin regulation in a mouse model of depression and
antidepressant action. Nat Neurosci, Vol.9, No.4, (Apr 2006), pp. 519-525.
Tsuno, N., Besset, A. & Ritchie, K. (2005). Sleep and depression. J Clin Psychiatry, Vol.66,
No.10, (Oct 2005), pp. 1254-1269.
Turnbull, A.V. & Rivier, C.L. (1999). Regulation of the hypothalamic-pituitary-adrenal axis by
cytokines: actions and mechanisms of action. Physiol Rev, Vol.79, No.1, (Jan 1999), pp.
1-71.
Uher, R. & McGuffin, P. (2010). The moderation by the serotonin transporter gene of
environmental adversity in the etiology of depression: 2009 update. Mol Psychiatry,
Vol.15, No.1, (Jan 2010), pp. 18-22.
Verhagen, J.V. (2007). The neurocognitive bases of human multimodal food perception:
consciousness. Brain Res Rev, Vol.53, No.2, (Feb 2007), pp. 271-286.
Videbech, P. & Ravnkilde, B. (2004). Hippocampal volume and depression: a meta-analysis of
MRI studies. Am J Psychiatry, Vol.161, No.11, (Nov 2004), pp. 1957-1966.

64
Wan, Q., Xiong, Z.G., Man, H.Y., Ackerley, C.A., Braunton, J., Lu, W.Y., Becker, L.E.,
MacDonald, J.F. & Wang, Y.T. (1997). Recruitment of functional GABA(A) receptors to
postsynaptic domains by insulin. Nature, Vol.388, No.6643, (Aug 14 1997), pp. 686-
690.
Wang, S., Hashemi, T., Fried, S., Clemmons, A.L. & Hawes, B.E. (1998). Differential
intracellular signaling of the GalR1 and GalR2 galanin receptor subtypes. Biochemistry,
Vol.37, No.19, (May 12 1998), pp. 6711-6717.
Weaver, I.C., Cervoni, N., Champagne, F.A., D'Alessio, A.C., Sharma, S., Seckl, J.R., Dymov,
S., Szyf, M. & Meaney, M.J. (2004). Epigenetic programming by maternal behavior. Nat
Neurosci, Vol.7, No.8, (Aug 2004), pp. 847-854.
Weaver, I.C., D'Alessio, A.C., Brown, S.E., Hellstrom, I.C., Dymov, S., Sharma, S., Szyf, M. &
Meaney, M.J. (2007). The transcription factor nerve growth factor-inducible protein a
mediates epigenetic programming: altering epigenetic marks by immediate-early genes. J
Neurosci, Vol.27, No.7, (Feb 14 2007), pp. 1756-1768.
Weiner, N., Clement, H.W., Gemsa, D. & Wesemann, W. (1992). Circadian and seasonal
rhythms of 5-HT receptor subtypes, membrane anisotropy and 5-HT release in
hippocampus and cortex of the rat. Neurochem Int, Vol.21, No.1, (Jul 1992), pp. 7-14.
Wermter, A.K., Laucht, M., Schimmelmann, B.G., Banaschweski, T., Sonuga-Barke, E.J.,
Rietschel, M. & Becker, K. (2010). From nature versus nurture, via nature and nurture, to
gene x environment interaction in mental disorders. Eur Child Adolesc Psychiatry,
Vol.19, No.3, (Mar 2010), pp. 199-210.
Wesemann, W. & Weiner, N. (1990). Circadian rhythm of serotonin binding in rat brain. Prog
Neurobiol, Vol.35, No.6, 1990), pp. 405-428.
Wetterberg, L. (1999). Melatonin and clinical application. Reprod Nutr Dev, Vol.39, No.3,
(May-Jun 1999), pp. 367-382.
Wichers, M. & Maes, M. (2002). The psychoneuroimmuno-pathophysiology of cytokine-induced
depression in humans. Int J Neuropsychopharmacol, Vol.5, No.4, (Dec 2002), pp. 375-
388.
Wilkie, M.J., Smith, D., Reid, I.C., Day, R.K., Matthews, K., Wolf, C.R., Blackwood, D. &
Smith, G. (2007). A splice site polymorphism in the G-protein beta subunit influences
antidepressant efficacy in depression. Pharmacogenet Genomics, Vol.17, No.3, (Mar
2007), pp. 207-215.
Will, M.J., Franzblau, E.B. & Kelley, A.E. (2003). Nucleus accumbens mu-opioids regulate
intake of a high-fat diet via activation of a distributed brain network. J Neurosci, Vol.23,
No.7, (Apr 1 2003), pp. 2882-2888.

65
Winokur, A., Maislin, G., Phillips, J.L. & Amsterdam, J.D. (1988). Insulin resistance after oral
glucose tolerance testing in patients with major depression. Am J Psychiatry, Vol.145,
No.3, (Mar 1988), pp. 325-330.
Winter, J., Jung, S., Keller, S., Gregory, R.I. & Diederichs, S. (2009). Many roads to maturity:
microRNA biogenesis pathways and their regulation. Nat Cell Biol, Vol.11, No.3, (Mar
2009), pp. 228-234.
Wirz-Justice, A., Benedetti, F., Berger, M., Lam, R.W., Martiny, K., Terman, M. & Wu, J.C.
(2005). Chronotherapeutics (light and wake therapy) in affective disorders. Psychol Med,
Vol.35, No.7, (Jul 2005), pp. 939-944.
Wirz-Justice, A. & Van den Hoofdakker, R.H. (1999). Sleep deprivation in depression: what do
we know, where do we go? Biol Psychiatry, Vol.46, No.4, (Aug 15 1999), pp. 445-453.
Witte, K. & Lemmer, B. (1991). Rhythms in second messenger mechanisms. Pharmacol Ther,
Vol.51, No.2, 1991), pp. 231-237.
Wrenn, C.C. & Crawley, J.N. (2001). Pharmacological evidence supporting a role for galanin in
cognition and affect. Prog Neuropsychopharmacol Biol Psychiatry, Vol.25, No.1, (Jan
2001), pp. 283-299.
Xia, Z., DePierre, J.W. & Nassberger, L. (1996). Tricyclic antidepressants inhibit IL-6, IL-1 beta
and TNF-alpha release in human blood monocytes and IL-2 and interferon-gamma in T
cells. Immunopharmacology, Vol.34, No.1, (Aug 1996), pp. 27-37.
Xu, Y., Day, T.A. & Buller, K.M. (1999). The central amygdala modulates hypothalamic-
pituitary-adrenal axis responses to systemic interleukin-1beta administration.
Neuroscience, Vol.94, No.1, 1999), pp. 175-183.
Xue, B. & Kahn, B.B. (2006). AMPK integrates nutrient and hormonal signals to regulate food
intake and energy balance through effects in the hypothalamus and peripheral tissues. J
Physiol, Vol.574, No.Pt 1, (Jul 1 2006), pp. 73-83.
Yirmiya, R. (2000). Depression in medical illness: the role of the immune system. West J Med,
Vol.173, No.5, (Nov 2000), pp. 333-336.
Yoshitake, T., Reenila, I., Ogren, S.O., Hokfelt, T. & Kehr, J. (2003). Galanin attenuates basal
and antidepressant drug-induced increase of extracellular serotonin and noradrenaline
levels in the rat hippocampus. Neurosci Lett, Vol.339, No.3, (Mar 27 2003), pp. 239-242.
Zhang, M. & Kelley, A.E. (2000). Enhanced intake of high-fat food following striatal mu-opioid
stimulation: microinjection mapping and fos expression. Neuroscience, Vol.99, No.2,
2000), pp. 267-277.
Zhang, X., Beaulieu, J.M., Sotnikova, T.D., Gainetdinov, R.R. & Caron, M.G. (2004).
Tryptophan hydroxylase-2 controls brain serotonin synthesis. Science, Vol.305, No.5681,
(Jul 9 2004), pp. 217.
66
Zhang, X., Gainetdinov, R.R., Beaulieu, J.M., Sotnikova, T.D., Burch, L.H., Williams, R.B.,
Schwartz, D.A., Krishnan, K.R. & Caron, M.G. (2005). Loss-of-function mutation in
tryptophan hydroxylase-2 identified in unipolar major depression. Neuron, Vol.45, No.1,
(Jan 6 2005), pp. 11-16.
Zheng, H., Lenard, N.R., Shin, A.C. & Berthoud, H.R. (2009). Appetite control and energy
balance regulation in the modern world: reward-driven brain overrides repletion signals.
Int J Obes (Lond), Vol.33 Suppl 2, (Jun 2009), pp. S8-13.
Zhou, J.N., Riemersma, R.F., Unmehopa, U.A., Hoogendijk, W.J., van Heerikhuize, J.J.,
Hofman, M.A. & Swaab, D.F. (2001). Alterations in arginine vasopressin neurons in the
suprachiasmatic nucleus in depression. Arch Gen Psychiatry, Vol.58, No.7, (Jul 2001),
pp. 655-662.
Zhou, Z., Zhu, G., Hariri, A.R., Enoch, M.A., Scott, D., Sinha, R., Virkkunen, M., Mash, D.C.,
Lipsky, R.H., Hu, X.Z., Hodgkinson, C.A., Xu, K., Buzas, B., Yuan, Q., Shen, P.H.,
Ferrell, R.E., Manuck, S.B., Brown, S.M., Hauger, R.L., Stohler, C.S., Zubieta, J.K. &
Goldman, D. (2008). Genetic variation in human NPY expression affects stress response
and emotion. Nature, Vol.452, No.7190, (Apr 24 2008), pp. 997-1001.
Zigova, T., Pencea, V., Wiegand, S.J. & Luskin, M.B. (1998). Intraventricular administration of
BDNF increases the number of newly generated neurons in the adult olfactory bulb. Mol
Cell Neurosci, Vol.11, No.4, (Jul 1998), pp. 234-245.
OTHER RESOURCES
World Health Organization. Mental Health, Depression. Available at http://www.who.int/.
Accessed on July 1, 2011.
67
CHAPTER 2
IDENTIFICATION OF QUANTITATIVE TRAIT LOCI FOR DEPRESSION AND
ANXIETY IN MULTIPLE MOUSE INBRED STRAINS

68
1. Introduction
Anxiety and depression have a significant socioeconomic impact. In the United States,
the lifetime prevalence rates for anxiety and mood disorder are 31% and 21.4%, respectively
(Kessler et al. 2007). A strong comorbidity exists between anxiety and major depressive
disorder. Patients with comorbid anxiety and depression are more likely to experience slower
recovery, greater psychosocial disability, more chronicity, and increased rates of recurrence and
medication use (Hirschfeld 2001). There are minimal studies that have examined treatment
efficacy in anxious depressive patients (Hirschfeld 2001). As a result, evidence-based rationale
for treatment selection, dose requirement, and duration of therapy in this patient population is
lacking.
Evidence from twin studies indicates a strong genetic correlation between anxiety and
major depression with minimal to modest shared environmental effects on both disorders
(Kendler 1996; Kendler et al. 2007; Roy et al. 1995). It appears that numerous small-effect genes
affect both illnesses and that genetic influence on anxiety and depression is independent of age
(Demirkan et al. 2011). To elucidate common genetic mechanisms shared between both
disorders, we performed genome-wide mapping analysis across multiple mouse inbred strains.
The use of mouse inbred strains to investigate genetic variants for behavior offers several
advantages, including lower cost, availability of relevant population, ease in sample accessibility,
and reduced genomic complexity.
In this study, we have measured baseline anxiety-like and depressive-like responses and
performed genome-wide association analysis to identify quantitative trait loci (QTL) or genomic
regions associated with anxiety-like and depressive-like behaviors. By conducting a QTL

69
mapping analysis for both anxiety-like and depressive-like responses, we aim to: 1) identify
genetic risk variants for both disorders and 2) propose a molecular pathway that is potentially
shared between major depression and anxiety.
2. Materials and Methods
2.1 Animals
Thirty-five mouse inbred strains (129S1/SvImJ, A/J, AKR/J, BALB/cByJ, BTBRT<t>tf/J,
BUB/BnJ, C3H/HeJ, C57BL/6J, C57BR/cdJ, C58/J, CBA/J, CE/J, CZECHII/EiJ, DBA/2J,
DDY/Jc1SidSeyFrkJ, FVB/NJ, I/LnJ, KK/HIJ, LG/J, LP/J, MA/MyJ, MRL/MpJ, NOD/LtJ,
NON/LtJ, NOR/LtJ, NZB/BlNJ, NZO/HILtJ, PERA/EiJ, PL/J, PWD/PhJ, RIIIS/J, SJL/J, SM/J,
SWR/J, and WSB/EiJ) aged 8-9 weeks old were obtained from The Jackson Laboratory (Bar
Harbor, ME). Male mice were housed four per cage in polycarbonate cages on a 12-hour
light/dark cycle (lights on at 0700h) with access to food and water ad libitum. The number of
animals in each treatment group ranged from 7 to 18 animals per strain. Following one week of
habituation, mice were subjected to a behavioral test battery in the order of the least to the most
stressful test. Mice were tested every two days for a maximum of three behavioral tests to
minimize carryover effects between tests. All procedures were approved by the Institutional
Animal Care and Use Committee and followed the guidelines set forth by the National Institutes
of Health (NIH) Guide for the Care and Use of Laboratory Animals. Mean behavioral scores are
reported in Table 2.1.

70
2.2 Open Field Test (OF)
The OF test was conducted using a 27.3 cm x 27.3 cm open field apparatus (MED-OFA-MS,
Med Associates, St. Albans, VT), which was surrounded by infrared detection beams on the x-,
y- and z-axes that automatically recorded the animals' position and activity over the course of the
experiment. The OF is commonly used to measure exploratory and locomotor behavior in mice.
This test exploits the rodent‟s innate aversion to well-lit open spaces. Based on previous
observations that showed increased exploration towards illuminated open areas following
administration of anxiolytics (Choleris et al. 2001; Crawley 1985), anxiety-like behavior was
measured as percent time spent in the center of the open field. Activity in the open field was
recorded for ten minutes.
2.3 Tail Suspension Test (TST)
Mice were tested in a tail-suspension apparatus (PHM-300 TST Cubicle, Med Associates, St.
Albans, VT) between 1300h and 1600h. In this test, the mouse is subjected to short-term
inescapable stress by being suspended by its tail. Following failed attempts to escape, the mouse
becomes immobile, a response generally considered as behavioral despair, a depressive-like
behavior that is proposed to model “hopelessness” (Steru et al. 1987; Steru et al. 1985).
Immobility was recorded for 6 min in 60-sec blocks. Mice that climbed up their tail during
testing were excluded from data analysis.
2.4 Stress-Induced Hyperthermia (SIH)
Mammals, including humans, show an elevation in core body temperature after exposure
to stress (stress-induced hyperthermia). Previous studies have shown that mice removed last
71
from their cage develop hyperthermia compared to mice removed first (Borsini 1989), indicating
that SIH response is an index for anticipatory anxiety in mice. Using a modified SIH protocol,
rectal temperatures were obtained sequentially, with a 1-min interval between the first and the
last mouse in the cage. After 10 min, a second rectal measurement was performed for all mice
using the same procedure. For each mouse, the SIH was calculated as the difference in
temperature (ΔT) between the first rectal measurement (basal) and the last rectal temperature
(after 10 min).
2.5 QTL Mapping
Since mice within the same strain are genetically identical, genetic mechanisms
underlying complex diseases like anxiety and depression can be identified by mapping genomic
regions associated with inter-strain phenotypic variation. Behavioral measures collected from
multiple inbred strains were analyzed on SNPster version 3.3.1 and EMMA R package 1.1.2 to
infer genomic regions significantly correlated with inter-strain differences in anxiety-like and
depressive-like behavior.
Haplotype Associated Mapping (HAM) analysis and Efficient Mixed-Model Association
(EMMA) have been well-described elsewhere (Kang et al. 2008; McClurg et al. 2007; Pletcher et
al. 2004) and thus will be only briefly summarized here. Experimental SNP genotypes
encompassing over seven million polymorphic loci across 49 commonly-used laboratory strains
were obtained from the Center for Genome Dynamics at http://cgd.jax.org (Szatkiewicz et al.
2008). Over 190,000 SNPs were informative for the 37 mouse inbred lines, which provided the
basis for inferring genotype or haplotype structure at every 3-SNP window. Associations
between genotype (1-SNP or 3-SNP window) and phenotype were calculated by an F-statistic

72
corrected for genome-wide significance and plotted using SpotFire software (TIBCO Palo Alto,
CA). Genomic loci that were associated with behavioral phenotypes at an FDR ≤0.05 were
considered significant. We also examined if QTLs have been previously linked with behavioral
responses related to anxiety and depression. Candidate genes within anxiety-like and depressive-
like QTLs are listed in Tables 2.2 and 2.3.
2.6 Criteria for depressive-like gene marker characterization
Because our focus is to identify genetic markers for depression, we extensively examined
all QTLs significant for depressive-like phenotype as measured by the TST. For candidate gene
identification to be effective and efficient, we focused our attention on the top three loci
associated with depressive behavior and eliminated any QTLs that were similar to background
peaks. This decision was based on previous mapping simulations which showed that the locus
most significantly associated with the phenotype is 95% likely to be found within the top peak
given that the phenotype has an effect size of 30% (unpublished data).
Genes were prioritized based on the following criteria: a) similar haplotype structure
between SNPs within candidate genes and depressive QTLs, b) correlation of candidate gene
expression with behavior, c) association between candidate gene expression with levels of
neurobiochemical molecules, d) role of genes in behavior based on previous findings, and e)
association of genes with major depressive disorder. In addition, we searched for mouse models
and experimental assays that can be used for gene validation experiments.
73
3. Results
3.1 Behavioral QTLs
Baseline behavioral responses were measured in the open field test, stress-induced
hyperthermia test, and tail suspension test. Analysis of anxiety-like and depressive-like responses
revealed significant effects of strain (percent time spent in the center OF: F = 37.25, p< 0.0001;
change in temperature following stress: F = 4.86, p< 0.0001; percent time immobile in the TST:
F = 16.37, p< 0.0001). Genetic analysis can be performed using inbred-strain phenotype data to
identify genetic loci associated with behavioral phenotypes (Miller et al. 2010; Williams et al.
2009). Loci on Chrs 2 (Chr 2: 161.1 - 162.8; -logP = 5.52, FDR≤ 0.059), 3 (Chr 3: 82.0 - 86.9; -
logP = 5.69, FDR≤ 0.059), 6 (Chr 6: 102.7 - 106.7, -logP = 5.52, FDR≤ 0.059), and 17 (Chr 17:
18.7 - 23.7; -logP = 5.70, FDR≤ 0.069) correlated with percent time spent in the center of the
OF. The anxiety-like QTL on Chr 17 (Figure 2.1) has been previously linked with circadian
photosensitivity (Chr 17: 17.9 - 43.3, LOD = 3.7) (Yoshimura et al. 2002), which suggests that
similar genetic mechanisms underlie anxiety behavior and circadian rhythm. Fpr1, a gene within
anxiety-like QTL on Chr 17, has been previously associated with anxiety behavior in rodents
(Gao et al. 2011).
We discovered three loci with genome-wide significance for SIH (Chr 1: 64.8 - 65.2, -
logP = 5.68, FDR≤ 0.039; Chr 4: 134.8 - 135. 5 -logP = 5.69, FDR≤ 0.039; Chr 5: 108.2 - 110.9,
-logP = 6.49, FDR≤ 0.013; Chr 10: 121.3 - 123.6, -logP = 5.88, FDR≤ 0.039). Results from F2
mapping analyses between two phenotypically divergent strains (CBA/J and A/J) reveal two loci
on Chr 5 (Chr 5: 107.6 - 123.9, LOD = 16.4 and Chr 5: 130.7 - 142.5, LOD = 30.9) that have
been previously linked with preference for entering the open arms, a behavior that indicates less

74
anxious responses in the elevated plus maze (EPM). The EPM QTLs on Chr 5 account for 30%
of the variance in arm preference (Cohen et al. 2001). Additionally, a QTL on Chr 5 has been
detected for nurturing ability (Chr 5: 127.7 - 133.5, LOD = 4.5) (Suto et al. 2002). Two out of
the thirty-seven genes within the SIH QTL on Chr 5 (Pde6b and Pxmp2) were previously linked
with anxiety or depression (Aston et al. 2005; Cohen et al. 2001; Cook et al. 2001) (Figure 2.2).
Independent QTL mapping analysis for depressive-like phenotype identified significant
loci on Chrs 2, 4, 9, and 18. Genomic regions on Chrs 2 (Chr 2: 179.5 - 179.6, -logP = 8.52,
FDR≤ 0.0006 and Chr 2: 60.1 - 63.3, -logP = 4.92, FDR≤ 0.10), 4 (Chr 4: 129.8 - 132.5, -logP =
4.27, FDR≤ 0.10), 9 (Chr 9: 46.7- 47.6 Mb, -logP = 6.17, FDR≤ 0.059), and 18 (Chr 18: 16.6 -
18.1, -logP = 5.39, FDR≤ 0.074) associated with baseline depressive-like behavior. Although a
QTL for depressive-like behavior has not been reported previously at any of the loci we found, a
region on Chr 4 has been linked with anxiety-like responses as measured by the EPM (Chr 4:
78.3 - 125.3, LOD = 3.2) (Nakamura et al. 2003) and thermal pain responses in male mice (Chr
4: 115.1 - 139.5, r = 0.34 - 0.42) (Mogil et al. 1997). Interestingly, association with anxiety
and/or depression has been reported for two genes (Hcrtr1 and Oprd1) within the despair locus
on Chr 4 (Filliol et al. 2000; Scott et al. 2011; van Rijn et al. 2010) (Figure 2.3).
3.2 Identifying a candidate genetic marker for depression
Although all candidate genes were found within behavioral loci, only thirty-six out of
seventy candidate genes showed similar haplotype structure with the putative depressive QTLs.
This information is critical in delineating which genes are likely to drive association between
genomic and behavioral differences observed in mice. Convergence of gene expression with
behavioral and biochemical data narrowed our list from 36 to 20 priority genes. Using

75
Spearman‟s rank correlation coefficient, 20 genes were significantly correlated with behavior
and levels of neurobiochemical markers (p<0.05). From the list of 20 candidate genes, Dpp4 is
the only gene that has been previously associated with major depression in humans (see Chapter
3 for more details regarding Dpp4). A reduction in DPP4 enzymatic activity is common in
patients with mood disorder and treatment resistant depression (Maes et al. 1996; Maes et al.
1991; Maes et al. 1997). Animal studies have also found an association between DPP4 and
behavioral despair. Mice deficient in CD26/DPP4 exhibit lower immobility scores on both
forced swim and tail-suspension tests, which suggests that absence of Dpp4 produced anti-
depressive effects (El Yacoubi et al. 2006). Contradictory results between studies are likely due
to biological alterations that occur specifically from activation of DPP4 enzyme, such as change
in structural conformations that would otherwise be absent and thus undetected in Dpp4
knockout studies. Alternative explanations include secondary mechanisms that may arise from
genetic ablation of Dpp4. Despite ambiguous findings, evidence from human and animal studies
suggests that Dpp4 plays a significant role in depression. This information, in addition to the
availability of powerful research tools, led us to investigate the link between DPP4 and
depression. To further clarify the connection between Dpp4 and depressive behavior, we
compared DPP4 protein levels as well as enzymatic activity in behaviorally dissimilar strains
(Details of the study are found in Chapter 3).
4. Discussion
Given the significant pathophysiologic overlap between anxiety and depression, it is
thought that there are common neurogenetic mechanisms underlying these disorders. Findings
from genetic twin studies conducted in patients with comorbid anxiety and depression (Kendler

76
1996; Kendler et al. 2007; Roy et al. 1995) indicate a strong genetic correlation between both
disease states. To identify genomic regions shared between these illnesses, we conducted QTL
mapping analysis for anxiety-like and depressive-like responses in 35 mouse inbred strains.
Two of the anxiety-like QTLs we identified, Chr 5: 108.2 - 110.9 and Chr 17: 18.7 - 23.7,
have been previously associated with anxiety-related responses and circadian photosensitivity,
respectively (Cohen et al. 2001; Yoshimura et al. 2002). Three genes within these regions have
been previously associated with anxiety or depression. The Fpr1 gene encodes for N-
formylpeptide receptor, a G-protein coupled receptor that stimulates the release of pro-
inflammatory cytokines by phagocytic cells and negatively mediates the action of
glucocorticoids. Mice lacking Fpr1 exhibit reduced anxiety-like responses, increased exploratory
behavior, and impaired fear memory (Gao et al. 2011). Transcription profiling analysis of cortex
samples from depressed individuals and healthy control subjects revealed significant differences
in the expression of 17 genes involved in oligodendrocyte function; included in that list is
Pxmp2. The Pxmp2 gene encodes for a peroxisomal membrane channel, which is critical for
myelination. Compared to control subjects, patients with depression show reduced mRNA levels
for genes associated with cell communication and neurodevelopment (Aston et al. 2005). This
finding indicates that depression may be affected by impairment in synaptic function and cell
communication. It is thought that light affects alertness, mood, and anxiety behavior. In
mammals, retinal photoreceptors, including rods, cones, and intrinsically photosensitive retinal
ganglion cells (ipRGCs), mediate both image-forming and non-image-forming responses to light.
The Pde6b gene encodes for an enzyme that mediates phototransduction in rods and cones
known as the rod phosphodiesterase subunit beta protein. Mutation in Pde6b results in visual
impairment and age-related degeneration of rods and cones. The SIH locus on Chr 5 where

77
Pde6b resides has been correlated with anxiety-like behavior (Cohen et al. 2001; Cook et al.
2001), which suggests that similar genetic mechanisms may underlie responses to light and
anxiety behavior. Notably, the anxiety-like locus on Chr 17 for time spent in the center OF has
been previously linked with circadian photosensitivity. Collectively, our anxiety-like QTL
findings indicate that genes affecting circadian rhythm may also influence anxiety responses.
Further characterization of candidate anxiety-like genes can help to elucidate molecular
pathways linking light responses with anxiety, thus facilitating new avenues for anxiolytic drug
research.
We identified five regions that were significantly linked with depressive-like behavior.
Of particular interest is the region on Chr 4. This locus has been previously reported to be
associated with anxiety behavior and responses to thermal pain (Mogil et al. 1997; Nakamura et
al. 2003). Two genes within the despair locus on Chr 4, Hcrtr1 and Oprd1, were previously
correlated with depressive and/or anxiety behavior (Filliol et al. 2000; Scott et al. 2011; van Rijn
et al. 2010). Orexins are excitatory neuropeptide neurons primarily located in the hypothalamus.
Orexin neurons bind to orexin receptors 1 and 2, which are encoded by Hcrtr1 and Hcrtr2,
respectively. Reduction in Hcrtr1 through either pharmacologic intervention or genetic ablation
results in decreased depressive-like behavior (Scott et al. 2011). The Oprd1 gene encodes for the
delta1 opioid receptor, which when activated elicits analgesic effects. The Oprd1 null mice
display increased behavioral despair and anxious-like behavior, indicating that delta1 opioid
receptor activity is critical for mediating both anxiety and mood disorders (Filliol et al. 2000).
Similarly, activation of the OPRD1 receptor reduces depressive-like behavior (Torregrossa et al.
2006) and anxiety-like behavior in ethanol-withdrawn mice (Kraft et al. 2009). Additional
studies are needed to identify the molecular pathway underlying opioid effects on anxiety and

78
depressive behavior. Whether administration of a delta opioid receptor agonist attenuates anxiety
and depressive symptoms remain to be seen.
All genes within putative QTLs associated with variable depressive-like behavior were
analyzed for its potential role in major depression. Comprehensive analysis of gene expression,
neurobiochemical, and behavioral data that were obtained from two independent studies
narrowed the list of putative depressive-like genes to 20 promising candidates. Only Dpp4 has
been previously linked with clinical depression and other disorders, including anxiety (Emanuele
et al. 2006), depression (Maes et al. 1996; Maes et al. 1991), anorexia (van West et al. 2000), and
bulimia (van West et al. 2000). Additionally, availability of research tools, which included
commercially-available drugs that target the protein product, ELISA kits, and qPCR primers and
probes, made Dpp4 a good candidate gene to validate. The details of the candidate gene
validation study are described in Chapter 3.
Taken together, results from our QTL mapping analyses generated several good
candidate genes for anxiety and depression. Importantly, these results indicate that similar
genetic mechanisms underlie anxiety and major depression. This study also demonstrates the use
of QTL mapping analysis for detection of genetic loci that influence complex phenotypes.
Although causative genes for anxiety and MDD are yet to be identified, the road to gene
identification is promising. New approaches, such as next-generation sequencing and epigenetic
tools (DNA methylation, chromatin, and non-coding RNA analysis) can advance gene mapping
analyses, facilitating the identification of genes underlying anxiety and major depression.

79
5. Tables
Table 2.1 Inter-strain behavioral responses in the open field test, stress-induced hyperthermia,
and tail suspension test
Table 2.1. Inter-strain Behavioral Responses in the Open Field Test, Stress-Induced Hyperthermia,
and Tail Suspension Test
Strain
Number
of
Animals
(n)
Mean
Percent
Time
Spent in
the
Center
OF SEM
Mean
Change in
Temperature
(ºC) SEM
Mean
Percent
Time Spent
Immobile SEM
129S1/SvImJ 14 2.98 1 1.68 0.18 41.85 2.52
A/J 14 0.91 0.26 1.24 0.11 28.95 2.92
AKR/J 14 10.51 1.22 2.14 0.2 36.41 3.61
BALB/cByJ 14 5.99 1.12 1.79 0.15 33.92 3.08
BTBRT<t>tf/J 16 14.68 1.33 1.49 0.11 35.73 2.85
BUB/BnJ 7 11.91 1.16 2.76 0.16 34.64 5.76
C3H/HeJ 15 12.59 1.18 2.26 0.14 22.58 2.17
C57BL/6J 16 19.72 1.35 1.83 0.14 36.03 7.1
C57BR/cdJ 14 23.88 1.77 2.04 0.1 20.06 2.23
C58/J 16 15.4 1.48 1.63 0.17 22.54 1.58
CBA/J 15 9.95 0.93 2.34 0.14 40.89 2.97
CE/J 8 9.54 1.23 1.84 0.11 27.1 3.32
CZECHII/Ei 9 2.02 0.35 0.99 0.42 59.25 7.17
DBA/2J 14 6.86 1.08 2.56 0.19 21.75 1.74
DDY/Jc1SidSeyFrkJ 8 14.54 2.15 1.8 0.26 73.93 2.25
FVB/NJ 14 14.92 1.12 2.14 0.17 34.94 2.8
I/LnJ 8 10.39 1.33 1.39 0.23 39.11 7.78
KK/HlJ 18 5.43 0.84 1.25 0.12 46.66 4.4
LG/J 12 7.44 1.24 1.93 0.15 25.63 2.53
LP/J 10 4.09 1.25 1.57 0.22 34.45 4.81
MA/MyJ 9 13.24 1.08 1.8 0.26 39.25 5.83
MRL/MpJ 14 9.34 1.38 1.84 0.28 26.98 2.12
NOD/LtJ 17 25.38 2.1 1.88 0.18 41.19 2.54
NON/LtJ 16 13.75 0.95 2.2 0.15 18.87 2.19
NOR/LtJ 10 22.14 1.26 1.78 0.11 35.59 4.1
NZB/BlNJ 14 9.88 0.97 2.14 0.18 48.64 4.15
NZO/HILtJ 11 4.82 0.95 1.61 0.17 33.86 4.49
PERA/Ei 8 15.35 2.21 1.81 0.23 57.99 11.65
PL/J 18 11.72 0.76 2.58 0.18 37.59 2.64
PWD/Ph 10 7.01 1.07 0.79 0.18 Not tested
RIIIS/J 15 7.54 0.66 2.31 0.21 30.03 1.6
SJL/J 16 10.81 1 2.23 0.25 59.35 2.8
SM/J 14 8.67 0.71 2.1 0.13 41.73 4.79

80
SWR/J 17 12.71 0.7 2.29 0.17 25.58 1.67
WSB/EiJ 10 14.32 0.74 1.1 0.45 29.61 3.44

81
Table 2.2 List of candidate genes within anxiety-like QTLs
Table 2.2. List of candidate genes within anxiety-like QTLs
Gene symbol Gene Name
1010001B22Rik RIKEN cDNA 1010001B22 gene
1700007G11Rik RIKEN cDNA 1700007G11 gene
1700013N18Rik ubiquitin-conjugating enzyme E2D 2 pseudogene
1700029M20Rik RIKEN cDNA 1700029M20 gene
2610011I18Rik RIKEN cDNA 2610011I18 gene
2810408I11Rik RIKEN cDNA 2810408I11 gene
3110052M02Rik RIKEN cDNA 3110052M02 gene
4930432H08Rik RIKEN cDNA 4930432H08 gene
4930432O21Rik RIKEN cDNA 4930428O21 gene
4930515G13Rik RIKEN cDNA 4930515G13 gene
4930555I21Rik RIKEN cDNA 4930555I21 gene
4930564K09Rik RIKEN cDNA 4930564K09 gene
4930565D16Rik RIKEN cDNA 4930565D16 gene
4933425M03Rik RIKEN cDNA 4933425M03 gene
5830490A12Rik RIKEN cDNA 5830490A12 gene
6330415G19Rik RIKEN cDNA 6330415G19 gene
6820402A03Rik RIKEN cDNA 6820402A03 gene
9030218A15Rik RIKEN cDNA 9030218A15 gene
9130219A07Rik RIKEN cDNA 9130219A07 gene
9330198I05Rik RIKEN cDNA 9330198I05 gene
9430021M05Rik RIKEN cDNA 9430021M05 gene
9430099H24Rik 9430099H24Rik Description: RIKEN cDNA 9430099H24 gene
A330049M08Rik RIKEN cDNA A330049M08 gene
A430028G04Rik RIKEN cDNA A430028G04 gene
A830010M20Rik RIKEN cDNA A830010M20 gene
Acadl acyl-CoA dehydrogenase, long chain
Akr1cl aldo-keto reductase family 1, member C-like
Ankle2 ankyrin repeat and LEM domain containing 2
Arfip1 ADP-ribosylation factor interacting protein 1
Atp5k ATP synthase, H+ transporting, mitochondrial F1F0 complex, subunit e
AU019157 expressed sequence AU019157
AU021001 expressed sequence AU021001
Avpr1a arginine vasopressin receptor 1A
Barhl2 BarH-like 2
Brdt bromodomain, testis-specific
C1qtnf6 C1q and tumor necrosis factor related protein 6
C630001G18Rik RIKEN cDNA C630001G18 gene
C77068 expressed sequence C77068
Card10 caspase recruitment domain family, member 10
Ccdc18 coiled-coil domain containing 18
Ccnyl1 cyclin Y-like 1
Cd1d2 CD1d2 antigen
Cdc7 cell division cycle 7 homolog
Chfr checkpoint with forkhead and ring finger domains

82
Chl1 cell adhesion molecule with homology to L1CAM
Clic4 chloride intracellular channel 4 (mitochondrial)
Cnr2 cannabinoid receptor 2 (macrophage)
Cntn4 contactin 4
Cntn6 contactin 6
Creb1 cAMP responsive element binding protein 1
Cryga crystallin, gamma A
Crygb crystallin, gamma B
Crygd crystallin, gamma D
Crygf crystallin, gamma F
Cyth4 cytohesin 4
D4Ertd264e DNA segment, Chr 4, ERATO Doi 264, expressed
D530037H12Rik RIKEN cDNA D530037H12 gene
D630023F18Rik RIKEN cDNA D630023F18 gene
D630033A02Rik RIKEN cDNA D630033A02 gene
D930015E06Rik RIKEN cDNA D930015E06 gene
Dclk2 doublecortin-like kinase 2
Dr1 down-regulator of transcription 1
Elfn2 leucine rich repeat and fibronectin type III, extracellular 2
Ephx4 epoxide hydrolase 4
Evi5 ecotropic viral integration site 5
Fam160a1 family with sequence similarity 160, member A1
Fam19a2 family with sequence similarity 19, member A2
Fam69a family with sequence similarity 69, member A
Fbrsl1 fibrosin-like 1
Fbxw7 F-box and WD-40 domain protein 7
Fga fibrinogen alpha chain
Fgb fibrinogen beta chain
Fgg fibrinogen gamma chain
Fhdc1 FH2 domain containing 1
Fpr1 formyl peptide receptor 1
Fpr2 formyl peptide receptor 2
Fpr3 formyl peptide receptor 3
Fpr-rs3 formyl peptide receptor, related sequence 3
Fpr-rs4 formyl peptide receptor, related sequence 4
Fuca1 fucosidase, alpha-L- 1, tissue
Fzd5 frizzled homolog 5
Gfi1 growth factor independent 1
Glmn glomulin, FKBP associated protein
Glt28d2 glycosyltransferase 28 domain containing 2
Golga3 golgi autoantigen, golgin subfamily a, 3
Grhl3 grainyhead-like 3
Gtpbp6 GTP binding protein 6 (putative)
Has1 hyaluronan synthase1
Hmgcl 3-hydroxy-3-methylglutaryl-Coenzyme A lyase
Idh1 isocitrate dehydrogenase 1 (NADP+), soluble
Il28ra interleukin 28 receptor alpha
Il2rb interleukin 2 receptor, beta chain
Il5ra interleukin 5 receptor, alpha
Kirrel kin of IRRE like

83
Klf7 Kruppel-like factor 7 (ubiquitous)
Lpcat2b lysophosphatidylcholine acyltransferase 2B
Lrat lecithin-retinol acyltransferase (phosphatidylcholine-retinol-O-acyltransferase)
Lrba LPS-responsive beige-like anchor
Mab21l2 mab-21-like 2
Mettl21a methyltransferase like 21A
Mllt4
myeloid/lymphoid or mixed lineage-leukemia translocation to 4 homolog
pseudogene
Mnd1 meiotic nuclear divisions 1 homolog
Mon2 MON2 homolog
Mtap2 microtubule-associated protein 2
Mtap9 microtubule-associated protein 9
Mtf2 metal response element binding transcription factor 2
Myom3 myomesin family, member 3
Ncaph2 non-SMC condensin II complex, subunit H2
Ncrna00085 non-protein coding RNA 85
Nipal3 NIPA-like domain containing 3
Npy2r neuropeptide Y receptor Y2
P2rx2 purinergic receptor P2X, ligand-gated ion channel, 2
Pde6b phosphodiesterase 6B, cGMP, rod receptor, beta polypeptide
Pet112l PET112-like
Pgam5 phosphoglycerate mutase family member 5
Pigg phosphatidylinositol glycan anchor biosynthesis, class G
Pikfyve phosphoinositide kinase, FYVE finger containing
Pknox2 Pbx/knotted 1 homeobox 2
Plcxd1 phosphatidylinositol-specific phospholipase C, X domain containing 1
Plekhm3 pleckstrin homology domain containing, family M, member 3
Plrg1 pleiotropic regulator 1, PRL1 homolog
Pnrc2 proline-rich nuclear receptor coactivator 2
Pole polymerase (DNA directed), epsilon
Ppm1h protein phosphatase 1H (PP2C domain containing)
Ppp2r1a protein phosphatase 2 (formerly 2A), regulatory subunit A (PR 65), alpha isoform
Pth2r parathyroid hormone 2 receptor
Ptpla protein tyrosine phosphatase-like (proline instead of catalytic arginine), member a
Ptprt protein tyrosine phosphatase, receptor type, T
Pxmp2 peroxisomal membrane protein 2
Rac2 RAS-related C3 botulinum substrate 2
Rad23b RAD23b homolog
Rcan3 regulator of calcineurin 3
Rpap2 RNA polymerase II associated protein 2
Rpe ribulose-5-phosphate-3-epimerase
Rpl5 ribosomal protein L5 pseudogene
Rps3a ribosomal protein S3A
Sfrp2 secreted frizzled-related protein 2
Sfrs6 serine/arginine-rich splicing factor 6
Sh3d19 SH3 domain protein D19
Srrm1 serine/arginine repetitive matrix 1
Srsf10 serine/arginine-rich splicing factor 10
Sstr3 somatostatin receptor 3
Tgfbr3 transforming growth factor, beta receptor III

84
Tlr2 toll-like receptor 2
Tmed5 transmembrane emp24 protein transport domain containing 5
Tmem154 transmembrane protein 154
Tmem5 transmembrane protein 5
Trim2 tripartite motif-containing 2
Unc80 unc-80 homolog
Usp15 ubiquitin specific peptidase 15
Vmn2r-ps129 vomeronasal 2, receptor, pseudogene 129
Zfp160 zinc finger protein 160
Zfp213 zinc finger protein 213
Zfp229 zinc finger protein 229
Zfp40 zinc finger protein 40
Zfp51 zinc finger protein 51
Zfp52 zinc finger protein 52
Zfp53 zinc finger protein 53
Zfp54 zinc finger protein 54
Zfp605 zinc finger protein 605
Zfp644 zinc finger protein 644
Zfp677 zinc finger protein 677
Zfp758 zinc finger protein 758
Zfp820 zinc finger protein 820
Zfp944 zinc finger protein 944
Zfp945 zinc finger protein 945

85
Table 2.3 List of candidate genes within depressive QTLs
Table 2.3. List of candidate genes within depressive QTLs
Gene symbol Gene Name
2300010F08Rik RIKEN cDNA 2300010F08 gene
2900052N01Rik RIKEN cDNA 2900052N01 gene
3100003M19Rik RIKEN cDNA 3100003M19 gene
4733401A01Rik RIKEN cDNA 4733401A01 gene
4930451E06Rik RIKEN cDNA 4930451E06 gene
5830409B07Rik RIKEN cDNA 5830409B07 gene
9430011C21Rik RIKEN cDNA 9430011C21 gene
A930004J17Rik RIKEN cDNA A930004J17 gene
Atpif1 ATPase inhibitory factor 1
C530007A02Rik RIKEN cDNA C530007A02 gene
Cdh2 neural cadherin
Cdh4 retinal cadherin
Col16a1 collagen, type XVI, alpha 1
Dnajc8 DnaJ (Hsp40) homolog, subfamily C, member 8
Dpp4 dipeptidyl-peptidase 4
Epb4.1 erythrocyte protein band 4.1
Epha7 Ephrin receptor A7
Eya3 eyes absent homolog 3
Fabp3 fatty acid binding protein 3, muscle and heart (mammary-derived growth inhibitor)
Fam76a family with sequence similarity 76, member A
Fap fibroblast activation protein, alpha
Gca grancalcin, EF-hand calcium binding protein
Gcg Glucagon
Gmeb1 glucocorticoid modulatory element binding protein 1
Hcrtr1 hypocretin (orexin) receptor 1
Ifih1 interferon induced with helicase C domain 1
Itgb6 integrin, alpha 11
Kcnh7 potassium voltage-gated channel, subfamiliy H (eag-related), member 7
Laptm5 lysosomal protein transmembrane 5
Ly75 lymphocyte antigen 75
Matn1 matrilin 1, cartilage matrix protein
Mecr mitochondrial trans-2-enoyl-CoA reductase
Med18 mediator complex subunit 18
Nkain1 Na+/K+ transporting ATPase interacting 1
Oprd1 opioid receptor, delta 1
Pef1 penta-EF-hand domain containing 1
Phactr4 phosphatase and actin regulator 4
Pla2r1 phospholipase A2 receptor 1, 180kDa

86
Ppp1r8 protein phosphatase 1, regulatory (inhibitor) subunit 8
Psmd14 proteasome (prosome, macropain) 26S subunit, non-ATPase, 14
Ptafr platelet-activating factor receptor
Ptpru protein tyrosine phosphatase, receptor type, U
Pum1 pumilio homolog 1
Rab42 RAB42, member RAS oncogene family
Rbms1 RNA binding motif, single stranded interacting protein 1
Rcc1 regulator of chromosome condensation 1
Rpa2 replication protein A2, 32kDa
Sdc3 syndecan 3
Serinc2 serine incorporator 2
Sesn2 sestrin 2
Sfrs4 serine/arginine-rich splicing factor 4
Slc4a10 solute carrier family 4 sodium bicarbonate transporter, member 10
Smpdl3b sphingomyelin phosphodiesterase, acid-like 3B
Snhg12 small nucleolar RNA host gene 12
Snhg3 small nucleolar RNA host gene (non-protein coding) 3
Snrnp40 small nuclear ribonucleoprotein 40kDa (U5)
Stx12 syntaxin 12
Taf12
TAF12 RNA polymerase II, TATA box binding protein (TBP)-associated factor,
20kDa
Tank TRAF family member-associated NF-kappa-B activator
Tbr1 T-box, brain, 1
Tinagl1 tubulointerstitial nephritis antigen-like 1
Trnau1ap tRNA selenocysteine 1 associated protein 1
Xkr8 XK, Kell blood group complex subunit-related family, member 8
Ythdf2 YTH domain family, member 2
Zcchc17 zinc finger, CCHC domain containing 17
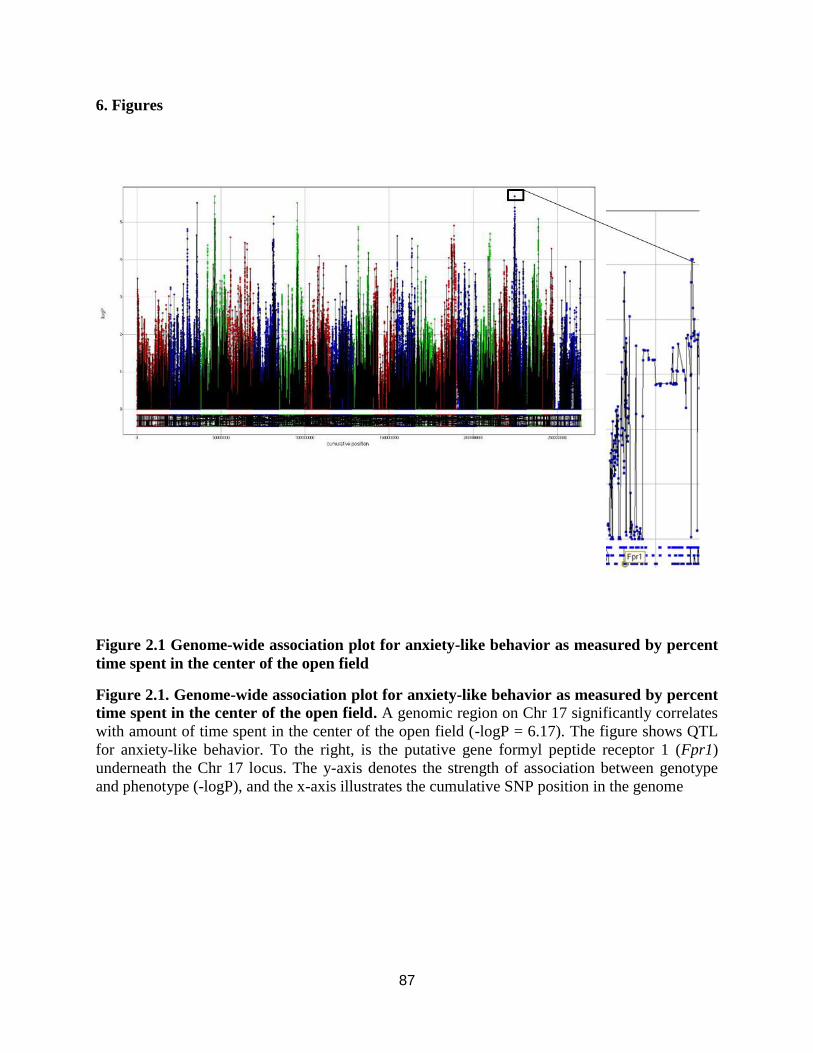
87
6. Figures
Figure 2.1 Genome-wide association plot for anxiety-like behavior as measured by percent
time spent in the center of the open field
Figure 2.1. Genome-wide association plot for anxiety-like behavior as measured by percent
time spent in the center of the open field. A genomic region on Chr 17 significantly correlates
with amount of time spent in the center of the open field (-logP = 6.17). The figure shows QTL
for anxiety-like behavior. To the right, is the putative gene formyl peptide receptor 1 (Fpr1)
underneath the Chr 17 locus. The y-axis denotes the strength of association between genotype
and phenotype (-logP), and the x-axis illustrates the cumulative SNP position in the genome

88
Figure 2.2 Genome-wide association plot for stress-induced hyperthermia
Figure 2.2. Genome-wide association plot for stress-induced hyperthermia. A locus on Chr.
5 significantly associates with changes in temperature following exposure to acute stress (-logP =
6.17). This assay is a measure of anticipatory anxiety. To the right are the putative genes, Pde6b
(phosphodiesterase 6B) and Pxmp2 (peroxisomal membrane protein 2) underneath the Chr 5
locus for anxiety-like behavior. The y-axis denotes the strength of association between genotype
and phenotype (-logP), and the x-axis illustrates the cumulative SNP position in the genome.

89
Figure 2.3 Genome-wide association plot for depressive-like behavior
Figure 2.3. Genome-wide association plot for depressive-like behavior. We observed a
significant association between a locus on Chr 4 and time spent immobile in the tail suspension
test (-logP = 6.17). To the right are the putative genes, hypocretin (orexin) receptor 1 (Hcrtr1)
and opioid receptor delta 1 (Oprd1) underneath the Chr 4 locus for depressive-like behavior. The
y-axis denotes the strength of association between genotype and phenotype (-logP), and the x-
axis illustrates the cumulative SNP position in the genome.

90
REFERENCES
Aston C, Jiang L, Sokolov BP (2005) Transcriptional profiling reveals evidence for signaling
and oligodendroglial abnormalities in the temporal cortex from patients with major
depressive disorder. Mol Psychiatry 10: 309-22
Choleris E, Thomas AW, Kavaliers M, Prato FS (2001) A detailed ethological analysis of the
mouse open field test: effects of diazepam, chlordiazepoxide and an extremely low
frequency pulsed magnetic field. Neurosci Biobehav Rev 25: 235-60
Cohen RM, Kang A, Gulick C (2001) Quantitative trait loci affecting the behavior of A/J and
CBA/J intercross mice in the elevated plus maze. Mamm Genome 12: 501-7
Cook MN, Williams RW, Flaherty L (2001) Anxiety-related behaviors in the elevated zero-maze
are affected by genetic factors and retinal degeneration. Behav Neurosci 115: 468-76
Crawley JN (1985) Exploratory behavior models of anxiety in mice. Neurosci Biobehav Rev 9:
37-44
Demirkan A, Penninx BW, Hek K, Wray NR, Amin N, Aulchenko YS, van Dyck R, de Geus EJ,
Hofman A, Uitterlinden AG, Hottenga JJ, Nolen WA, Oostra BA, Sullivan PF,
Willemsen G, Zitman FG, Tiemeier H, Janssens AC, Boomsma DI, van Duijn CM,
Middeldorp CM (2011) Genetic risk profiles for depression and anxiety in adult and
elderly cohorts. Mol Psychiatry 16: 773-83
El Yacoubi M, Vaugeois JM, Marguet D, Sauze N, Guieu R, Costentin J, Fenouillet E (2006)
Behavioral characterization of CD26 deficient mice in animal tests of anxiety and
antidepressant-like activity. Behav Brain Res 171: 279-85
Filliol D, Ghozland S, Chluba J, Martin M, Matthes HW, Simonin F, Befort K, Gaveriaux-Ruff
C, Dierich A, LeMeur M, Valverde O, Maldonado R, Kieffer BL (2000) Mice deficient
for delta- and mu-opioid receptors exhibit opposing alterations of emotional responses.
Nat Genet 25: 195-200
Gao JL, Schneider EH, Dimitrov EL, Haun F, Pham TM, Mohammed AH, Usdin TB, Murphy
PM (2011) Reduced Fear Memory and Anxiety-like Behavior in Mice Lacking
Formylpeptide Receptor 1. Behav Genet 41: 724-33
Hirschfeld RM (2001) The Comorbidity of Major Depression and Anxiety Disorders:
Recognition and Management in Primary Care. Prim Care Companion J Clin Psychiatry
3: 244-254
Kang HM, Zaitlen NA, Wade CM, Kirby A, Heckerman D, Daly MJ, Eskin E (2008) Efficient
control of population structure in model organism association mapping. Genetics 178:
1709-23

91
Kendler KS (1996) Major depression and generalised anxiety disorder. Same genes,
(partly)different environments--revisited. Br J Psychiatry Suppl: 68-75
Kendler KS, Gardner CO, Gatz M, Pedersen NL (2007) The sources of co-morbidity between
major depression and generalized anxiety disorder in a Swedish national twin sample.
Psychol Med 37: 453-62
Kessler RC, Angermeyer M, Anthony JC, R DEG, Demyttenaere K, Gasquet I, G DEG,
Gluzman S, Gureje O, Haro JM, Kawakami N, Karam A, Levinson D, Medina Mora ME,
Oakley Browne MA, Posada-Villa J, Stein DJ, Adley Tsang CH, Aguilar-Gaxiola S,
Alonso J, Lee S, Heeringa S, Pennell BE, Berglund P, Gruber MJ, Petukhova M,
Chatterji S, Ustun TB (2007) Lifetime prevalence and age-of-onset distributions of
mental disorders in the World Health Organization's World Mental Health Survey
Initiative. World Psychiatry 6: 168-76
Kraft P, Wacholder S, Cornelis MC, Hu FB, Hayes RB, Thomas G, Hoover R, Hunter DJ,
Chanock S (2009) Beyond odds ratios--communicating disease risk based on genetic
profiles. Nat Rev Genet 10: 264-9
Krupina NA, Kushnareva EY, Khlebnikova NN, Zolotov NN, Kryzhanovskii GN (2009)
Behavioral changes in rats induced by a dipeptidyl peptidase IV inhibitor methionyl-2(S)-
cyanopyrrolidine: experimental model of anxiety-depression disorder. Bull Exp Biol Med
147: 285-90
Maes M, De Meester I, Scharpe S, Desnyder R, Ranjan R, Meltzer HY (1996) Alterations in
plasma dipeptidyl peptidase IV enzyme activity in depression and schizophrenia: effects
of antidepressants and antipsychotic drugs. Acta Psychiatr Scand 93: 1-8
Maes M, De Meester I, Vanhoof G, Scharpe S, Bosmans E, Vandervorst C, Verkerk R, Minner
B, Suy E, Raus J (1991) Decreased serum dipeptidyl peptidase IV activity in major
depression. Biol Psychiatry 30: 577-86
Maes M, De Meester I, Verkerk R, De Medts P, Wauters A, Vanhoof G, Vandoolaeghe E, Neels
H, Scharpe S (1997) Lower serum dipeptidyl peptidase IV activity in treatment resistant
major depression: relationships with immune-inflammatory markers.
Psychoneuroendocrinology 22: 65-78
McClurg P, Janes J, Wu C, Delano DL, Walker JR, Batalov S, Takahashi JS, Shimomura K,
Kohsaka A, Bass J, Wiltshire T, Su AI (2007) Genomewide association analysis in
diverse inbred mice: power and population structure. Genetics 176: 675-83
Miller BH, Schultz LE, Gulati A, Su AI, Pletcher MT (2010) Phenotypic characterization of a
genetically diverse panel of mice for behavioral despair and anxiety. PLoS One 5: e14458
Mogil JS, Richards SP, O'Toole LA, Helms ML, Mitchell SR, Belknap JK (1997) Genetic
sensitivity to hot-plate nociception in DBA/2J and C57BL/6J inbred mouse strains:
possible sex-specific mediation by delta2-opioid receptors. Pain 70: 267-77

92
Nakamura K, Xiu Y, Ohtsuji M, Sugita G, Abe M, Ohtsuji N, Hamano Y, Jiang Y, Takahashi N,
Shirai T, Nishimura H, Hirose S (2003) Genetic dissection of anxiety in autoimmune
disease. Hum Mol Genet 12: 1079-86
Pletcher MT, McClurg P, Batalov S, Su AI, Barnes SW, Lagler E, Korstanje R, Wang X,
Nusskern D, Bogue MA, Mural RJ, Paigen B, Wiltshire T (2004) Use of a dense single
nucleotide polymorphism map for in silico mapping in the mouse. PLoS Biol 2: e393
Roy MA, Neale MC, Pedersen NL, Mathe AA, Kendler KS (1995) A twin study of generalized
anxiety disorder and major depression. Psychol Med 25: 1037-49
Scott MM, Marcus JN, Pettersen A, Birnbaum SG, Mochizuki T, Scammell TE, Nestler EJ,
Elmquist JK, Lutter M (2011) Hcrtr1 and 2 signaling differentially regulates depression-
like behaviors. Behav Brain Res 222: 289-94
Steru L, Chermat R, Thierry B, Mico JA, Lenegre A, Steru M, Simon P, Porsolt RD (1987) The
automated Tail Suspension Test: a computerized device which differentiates psychotropic
drugs. Prog Neuropsychopharmacol Biol Psychiatry 11: 659-71
Steru L, Chermat R, Thierry B, Simon P (1985) The tail suspension test: a new method for
screening antidepressants in mice. Psychopharmacology (Berl) 85: 367-70
Suto J, Yamanaka H, Sekikawa K (2002) Genetic analysis of inferior nurturing ability in RR
mice. Reproduction 123: 52-8
Szatkiewicz JP, Beane GL, Ding Y, Hutchins L, Pardo-Manuel de Villena F, Churchill GA
(2008) An imputed genotype resource for the laboratory mouse. Mamm Genome 19: 199-
208
Torregrossa MM, Jutkiewicz EM, Mosberg HI, Balboni G, Watson SJ, Woods JH (2006)
Peptidic delta opioid receptor agonists produce antidepressant-like effects in the forced
swim test and regulate BDNF mRNA expression in rats. Brain Res 1069: 172-81
van Rijn RM, Brissett DI, Whistler JL (2010) Dual efficacy of delta opioid receptor-selective
ligands for ethanol drinking and anxiety. J Pharmacol Exp Ther 335: 133-9
Williams Rt, Lim JE, Harr B, Wing C, Walters R, Distler MG, Teschke M, Wu C, Wiltshire T,
Su AI, Sokoloff G, Tarantino LM, Borevitz JO, Palmer AA (2009) A common and
unstable copy number variant is associated with differences in Glo1 expression and
anxiety-like behavior. PLoS One 4: e4649
Yoshimura T, Yokota Y, Ishikawa A, Yasuo S, Hayashi N, Suzuki T, Okabayashi N, Namikawa
T, Ebihara S (2002) Mapping quantitative trait loci affecting circadian photosensitivity in
retinally degenerate mice. J Biol Rhythms 17: 512-9

93
CHAPTER 3
CHARACTERIZING THE ROLE OF DIPEPTIDYL PEPTIDASE 4 IN DEPRESSION

94
1. Introduction
Results from family, twin, and adoption studies indicate that there is a link between
genetics and development of major depression. Family and twin studies have estimated the
heritability of depression at 35-50% (Kendler et al. 2001; Sullivan et al. 2000), suggesting the
potential utility of genetic variants as diagnostic and prognostic markers. An unbiased analysis
for genetic regions linked to depression can be performed by investigating genome-wide
associations between genetic variants and behavior. Depression is a clinically and genetically
heterogeneous disorder, which complicates the identification of causative genes in human
populations. Besides ease in accessibility, mice within the same strain are homogeneous at each
locus, facilitating gene mapping studies by reducing genetic complexity. Furthermore, the effects
of environment and diet can be controlled in mouse populations, thus genetic effects on behavior
are more readily discernible compared to human populations.
Using QTL mapping analysis, we identified an association between dipeptidyl peptidase
4 (Dpp4) and depressive-like responses (-logP >5.0) (Figure 3.1). DPP4 is an ectoenzyme that
cleaves polypeptides with proline and alanine, to a lesser extent, at the penultimate position.
DPP4 is highly conserved across species and displays considerable sequence homology between
the mouse and human DPP4 protein. The crystal structure of this protein contains a catalytic
domain found in the internal cavity and a protein binding region located on the external surface
(Abbott et al. 1999; Bjelke et al. 2004; Rasmussen et al. 2003). The catalytic domain is involved
primarily in cleaving dipeptides with proline residues at the penultimate position, which typically
renders molecules less active (Table 3.1).

95
Enzymatic cleavage of peptides that regulate the immune and endocrine processes
indicate that DPP4 may mediate the neuroendocrine-immune interface. Although DPP4 is not the
only enzyme that can cleave neuropeptide Y, it is the primary peptidase that breaks down plasma
NPY levels making DPP4 a major contributory factor in mediating movement of NPY across the
blood-brain barrier. Neuropeptide Y (NPY) modulates circadian rhythm (Otori et al. 1993;
Weber and Rea 1997), food intake (Levine and Morley 1984; Morley 1987; Morley et al. 1987;
Stanley et al. 1985; Stanley and Leibowitz 1985), and learning and memory (Flood et al. 1989;
Morley and Flood 1990). N-terminal truncation of NPY by dipeptidyl peptidase IV leads to
structural alterations that may influence function and receptor binding (Frerker et al. 2007).
Reduction in NPY is associated with depressive behavior and altered response to stress (Redrobe
et al. 2002). Additionally, Dpp4-/-
mice exhibit higher levels of substance P, which corresponds
to a decreased in latency in response on the tail pinch and hot plate tests (Guieu et al. 2006).
Treatment with DPP4 inhibitor reduced nociceptive response but only on wild type mice
suggesting that elevation of substance P is due to lower enzymatic cleavage by DPP4 (Guieu et
al. 2006). Substance P (SP) is a potent neuromodulator of pain that can alter behavioral response
to stress and serotonergic signaling (Jessop et al. 2000; Malendowicz et al. 1996a; Malendowicz
et al. 1996b, Schwarz et al. 1999). Both endocrine mediators, NPY and SP, have been shown to
be involved in major depression (see Chapter 1 for details).
DPP4 is a glycoprotein molecule that associates with other immune cell surface markers,
including CD3 and CD45 (Ishii et al. 2001; Tanaka et al. 1992). DPP4 functions as a co-
stimulatory mediator of T-cell activation, which initiates downstream processes such as
interleukin-2 production (Ishii et al. 2001), T-cell proliferation (Ishii et al. 2001), and T-cell

96
migration (Ikushima et al. 2002). Although its involvement in T-cell activation and proliferation
is mainly attributed on its protein binding domain, cleavage of several cytokines by DPP4 may
have an indirect effect on immune regulation (Table 3.1). Its enzymatic activity may influence
its co-stimulatory effects on T-cell activation (Tanaka et al. 1993).
The neuro-endocrine-immune integrated system is critical for many psychiatric disorders
including depression, anxiety, and pain as reviewed in (Kopp 2001; Leonard and Song 1996;
Miller 1998). The involvement of dipeptidyl peptidase IV in regulating both neuroendocrine and
immune processes is suggestive of a DPP4-mediated bidirectional modulation along the
neuroendocrine-immune circuitry. Interestingly, DPP4 has been implicated in various mental
disorders, including anxiety (Emanuele et al. 2006), depression (Maes et al. 1996; Maes et al.
1991), anorexia (van West et al. 2000), and bulimia (van West et al. 2000). DPP4 enzymatic
activity has been associated with depressive symptoms in both clinical and pre-clinical studies
(El Yacoubi et al. 2006; Krupina et al. 2009; Maes et al. 2001; Maes et al. 1996; Maes et al.
1991). We hypothesize that Dpp4 is important for depression due to its role in inflammation and
neuropeptide catabolism (Table 3.1). The goal of this study is two-fold: first, is to validate our
QTL result that showed an association between Dpp4 haplotype and depressive-like responses
and second, we will examine whether behavioral responses to chronic DPP4 inhibition differ
between haplotype groups, which will assess functional DPP4 activity between strains.

97
2. Materials and Methods
2.1 Animals
Twenty-four male mice of the C57BL/6J (B6) and DBA/2J (D2) strains aged 8-9 weeks
old were obtained from The Jackson Laboratory (Bar Harbor, ME). Mice were housed four per
cage in polycarbonate cages on a 12-hour light/dark cycle (lights on at 0700h) with access to
food and water ad libitum. Following one week of habituation, mice were randomized to either
control or treatment group. All procedures were approved by the Institutional Animal Care and
Use Committee and followed the guidelines set forth by the National Institutes of Health (NIH)
Guide for the Care and Use of Laboratory Animals.
2.2 Drug Treatment
Sitagliptin is a selective reversible inhibitor of DPP4 that, in addition to diet and exercise,
is the currently approved treatment for type 2 diabetes. Sitagliptin was purchased from BioVision
(Mountain View, CA) and was administered via oral gavage. Mice were randomized to receive
either water or 100 mg/kg of sitagliptin for 14 days (n = 12 mice per strain per treatment group).
This dosing regimen was selected based on previous enzymatic and toxicity studies. Treatment
with 10 mg/kg of sitagliptin resulted in 90% inhibition after 1 hr and more than 70% inhibition
after 8 hr (Davis et al. 2010). Administration of 125 mg/kg of sitagliptin in mice (dose is 12
times higher than the recommended daily dose of 100 mg in humans) did not result in
hepatotoxicity and carcinogenicity (Sitagliptin [package insert], 2010). Mice were treated daily
with water or sitagliptin throughout the end of the study and were sacrificed by cervical
dislocation1 hr after the last dose, which was two days after the last behavioral test.

98
2.3 Open Field Test (OF)
To minimize potential carryover effects between tests, behavioral tests were conducted
every other day, in order from the least to the most stressful test. All behavioral tests were
performed between 1300 h and 1600 h. After chronic administration of 0 or 100 mg/kg of
sitagliptin for 14 days, mice were tested in the OF. This assay was conducted using a 27.3 cm x
27.3 cm OF apparatus (MED-OFA-MS, Med Associates, St. Albans, VT), which has infrared
detection beams that automatically recorded the animals' position and activity on the x-, y- and z-
axes over the course of the experiment. The OF is commonly used to measure exploratory and
locomotor behavior in rodents. This test exploits the rodent‟s innate aversion to well-lit, open
spaces. Based on previous observations that showed increased exploration in illuminated, open
areas following administration of anxiolytics (Choleris et al. 2001; Crawley 1985), we measured
anxiety-like behavior as percent time (sec) spent in the center of the OF. Activity in the OF was
recorded for 10 min.
2.4 Light-Dark Exploration Test (LD)
The LD test was performed following the OF test. The LD assay is commonly used to
detect anxiogenic effects of compounds. Similar to the OF, the LD test is based on the inherent
aversion of mice to well-lit open areas and on their spontaneous responses to novel stimuli like
light. Half of the LD apparatus was open and brightly illuminated, while the remaining half of
the arena was occupied by a small black plexiglass compartment that was dark. Entry between
the two compartments was through a small open doorway. Mice were permitted to freely explore
the light and dark areas for 10 min. The number of transitions between compartments and the
time spent in the light compartment are measures of anti-anxiety-like response.

99
2.5 Tail Suspension Test (TST)
Following the LD test, mice were tested in a TST apparatus (PHM-300 TST Cubicle,
Med Associates, St. Albans, VT). In this test, the mouse is subjected to the short-term,
inescapable stress of being suspended by its tail. Following repeated escape attempts, the mouse
becomes immobile. This response is generally considered behavioral despair, a depressive-like
behavior that is proposed to model “hopelessness” (Steru et al. 1987; Steru et al. 1985).
Immobility was recorded for 6 min in 60 sec blocks using the Actimetrics FreezeFrame software
version 2.0 (Wilmetter, IL). Since all strains were uniformly active for the first 2 min, percent
time spent immobile was calculated for the last 4 min of the test. Mice that climbed up their tail
during testing were excluded from analysis.
2.6 Measurement of DPP4 levels
Brain and plasma CD26/DPP4 levels were quantified using Mouse DPP4 ELISA kit
(Wuhan EIAab Sciences Co., Wuhan, China) according to the manufacturer‟s recommendation.
In brief, standards ranging from 15.6 ng/mL to 1000 ng/mL were prepared by performing serial
two-fold dilutions with sample diluent, which was provided in the kit. Brain and plasma samples
were diluted 1:10 and 1:100, respectively. A total of 100 µL of standard, sample or blank were
added onto wells that were pre-coated with a specific antibody to DPP4. Optical density of each
well was determined using a microplate reader (BioTek Instruments, Winooski, VT) set to 450
nm. Unknown DPP4 sample concentrations were determined from the standard curve, which was
generated by plotting the optical densities of the standards against known DPP4 concentrations.

100
2.7 Assessment of DPP4 activity
DPP4 activity was quantified by measuring the amount of fluorescence generated
following enzymatic hydrolysis of the flourogenic substrate H-Gly-Pro-AMC. Recombinant
human DPP4 (0.26 mU per well) was added to the appropriate wells, followed by the addition of
samples and blanks. DPP4 inhibitor (P32/98; 10 µM per well) was added to the appropriate wells
as a negative control. Following a 30-min incubation at 25ºC, 10 µL of H-Gly-Pro-AMC was
added to each well. The plate was read at excitation and emission wavelengths of 380 nm and
460 nm, respectively. DPP4 activity was normalized for total protein concentration, as measured
by Pierce Coomasie (Bradford) Protein Assay (Thermo Fisher Scientific, Rockford, IL).
2.8 Statistical Analysis
Given the uneven number of strains between haplotypes 1 and 2, behavioral difference
between haplotype groups was calculated using a Mann-Whitney U-test. Mean behavioral and
biological measurements for C57BL/6J and DBA/2J were calculated and analyzed using
Student‟s t-tests. Statistical analysis was performed using SAS 9.2 (Cary, NC) and Graphpad
Prism 5.0 (La Jolla, CA).
3. Results
3.1 Strain distribution pattern within Dpp4 locus
Our study shows that inter-strain difference in baseline depressive-like responses associate
with polymorphic variants within Dpp4. As seen in figure 3.2, the haplotype structure within
Dpp4 perfectly aligns with the strain distribution pattern across the behavioral locus on
101
Chromosome 2 (-logP >5.0). Difference in depressive-like behavior was found to be significant
between haplotype groups 1 and 2 (U = 6.0, p<0.007) (Figure 3.3). It is important to note that
the region where Dpp4 resides has been previously associated with high density lipoprotein
(HDL) levels, hepatic lipase activity, and insulin levels (Mehrabian et al. 1998), which indicates
a potential role of Dpp4 in diabetes and metabolic syndrome. Both disorders co-occur and
exhibit pathophysiologic overlap with major depression (Chapter 1).
3.2 Higher baseline immobility score is linked with higher DPP4 protein levels
A significant difference in plasma (t = 2.96, p<0.01) and brain DPP4 (t = 2.44, p<0.04) levels
was observed between B6 and D2 mice at baseline. Compared to B6, D2 mice have lower DPP4
levels in plasma and brain (Figures 3.4 and 3.5). Results from our microarray studies did not
show significant difference in Dpp4 mRNA expression between strains. The expression of one
probe set for Dpp4 (1441342_at) was higher in D2 than B6 mice, while the remaining three
probe sets did not show a difference in Dpp4 mRNA expression between both strains. To
determine whether difference in DPP4 protein levels can be attributed to DNA variants that
affect amino acid sequence, imputed and experimental SNP genotypes were obtained from the
Center for Genome Dynamics (http://cgd.jax.org) for comparison of Dpp4 sequence across
mouse inbred strains (Szatkiewicz et al. 2008). Polymorphic SNPs across 30 strains were all
synonymous and were found in the intron, exons, and untranslated regions (UTR). Interestingly,
data from Ensembl indicate that six different Dpp4 transcript variants have been reported for B6.
One isoforms leads to an alternative protein product, which may explain the difference in DPP4
protein levels between B6 and D2. Additionally, two Dpp4 mRNA transcripts with different
3‟UTR sequences have been reported in C57BL/10 ScNJ mice, which are closely related to B6

102
(Bernard et al. 1994). Due to low expression of Dpp4 in the brain, expression QTL analyses were
not performed on Dpp4, which limits our ability to predict if Dpp4 expression is regulated by
local or distal QTLs.
No difference in enzymatic activity was observed between strains under control and
sitagliptin conditions (Figures 3.9 and 3.10), which suggests that inter-strain behavioral
differences are likely due to differences in DPP4 protein levels. B6 mice had higher baseline
immobility scores (t = 11.04, p<0.0001) (Figure 3.8) and lower DPP4 protein levels than D2
mice (Figures 3.4 and 3.5), which suggests that reduced DPP4 protein levels correspond with
higher depressive-like behavior. Interestingly, B6 mice displayed lower anxiety-like behavior
compared to D2. B6 mice spent more time in the center of the open field (t = 6.58, p<0.0001)
and more time in the light compartment of the LD apparatus (t = 2.77, p<0.008) (Figures 3.6
and 3.7).
3.3 Inter-strain sensitivity to DPP4 inhibition
Plasma DPP4 activity was significantly inhibited for both B6 (t = 9.03, p<0.0008) and D2 (t
= 15.77, p<0.0001) mice. After chronic treatment with sitagliptin, there was an 88.5% and 84.9%
reduction in DPP4 activity for B6 and D2 mice, respectively (Figure 3.9). However, treatment
with sitagliptin did not alter DPP4 activity in the brain in either strain (Figure 3.10). Although
no significant strain-specific differences were observed between vehicle and sitagliptin-treated
mice in our behavioral tests, B6 mice show a trend of increased sensitivity to DPP4 inhibition
(Figures 3.11 - 3.13).

103
4. Discussion
To facilitate the application of pharmacogenetics in drug development and therapeutic
selection, research efforts towards gene validation are warranted. Identification of genes
underlying depression is challenging to perform in human populations due to limitations of cost,
disease heterogeneity, and sample size requirements. However, these limitations can be mitigated
through the use of mouse models. The genetic diversity among inbred mouse strains, the
availability of murine genetic sequence information, and the development of numerous genetic
resources are additional benefits to using mouse models to study the genetic basis of depressive
behavior.
This study confirms our initial findings that showed an association between Dpp4
haplotype and inter-strain baseline depressive-like behavior (Chapter 2). We found that DPP4
protein levels correlate with basal behavioral despair and anxiety-like responses. Higher levels of
DPP4 were associated with higher TST immobility scores and lower anxiety-like behavior, as
measured by the OF and LD tests. This result is consistent with previous findings that have
shown lower depressive-like responses in Dpp4 null mice. Rodents deficient in Dpp4 exhibited
lower immobility scores for both animal models of behavioral despair (TST and forced swim
test), indicating that the absence of Dpp4 yielded anti-depressive effects (El Yacoubi et al. 2006).
No differences in anxiety-like behavior were observed between wild-type and Dpp4-/-
mice in the
light/dark test (El Yacoubi et al. 2006).
We did not observe a significant difference in behavior between vehicle- and sitagliptin-
treated B6 and D2 mice. Contradictory to clinical findings that show reduction in plasma DPP4
enzymatic activity is common in patients with mood disorder and treatment-resistant depression

104
(Maes et al. 1996; Maes et al. 1991; Maes et al. 1997), inhibition of plasma DPP4 activity by
sitagliptin did not significantly alter behavior in B6 and D2 mice. This conflicting result may be
due to inadequate duration of DPP4-inhibition. It has been shown that 12-week treatment with 20
mg/kg of sitagliptin in mice susceptible to the development of Alzheimer‟s disease resulted in
reduced memory impairment and decreased brain inflammatory markers and amyloid-β protein
(D'Amico et al. 2010), suggesting that long-term inhibition may be required to elicit behavioral
changes. Additional studies are required to examine whether prolonged DPP4 inhibition alters
depressive-like behavior. The results of this study are important, given that sitagliptin is used for
long-term management of type 2 diabetes.
The direction of the association between Dpp4 and depressive behavior remains unclear.
Clinical studies indicate that lower DPP4 activity correlates with depressive symptoms, while
results from our study and previous Dpp4 knockout study suggest that increased behavioral
despair is linked with higher levels of DPP4 protein and absence of Dpp4, respectively.
However, because DPP4 protein levels were not quantified in human serum samples, it is unclear
whether reduction in DPP4 activity is due to lower DPP4 protein concentration, low or/and
altered DPP4 enzymatic activity, or both. Thus, pre-clinical and clinical assessment of DPP4
transcript levels, protein expression, and enzyme activity along with behavior is required to
assess the direction of the correlation between Dpp4 and depression. Furthermore, the
relationship between major depression and DPP4 activity in the brain remains unknown. No
previous studies have examined DPP4 activity in post-mortem brain tissues of depressed
individuals. Additionally, we could not inhibit DPP4 activity in the brain because the ratio of
brain to plasma concentration for sitagliptin is fairly low (< 0.06 - 0.1) (Chu et al. 2007).
Conseqently, further studies are required to examine if reduction in brain DPP4 activity

105
influences depressive behavior. It is important to note that the TST is primarily used to evaluate
antidepressant activity of novel compounds and does not itself elicit depressive behavior.
Behavioral paradigms like chronic social defeat stress and reduced sucrose preference, which
assess other aspects of depressive behavior (e.g. anhedonia) (Nestler and Hyman 2010), can be
used to further evaluate the role of Dpp4 in depression.
Given the likelihood of false positive results from genome-wide association studies, it is
critical to conduct independent studies for gene validation. Our initial findings indicate that
DPP4 mediates baseline depressive-like behavior, which suggests that Dpp4 may be used as a
genetic prognostic or diagnostic marker for depression.

106
5. Tables
Table 3.1 Potential biological alterations of known DPP4 substrates
Table 3.1. Potential biological alterations of known DPP4 substrates
Substrate Significance Reference
Neuropeptides
β-Casomorphin Inactivation
(Heymann and Mentlein 1986; Nausch
et al. 1990)
Endomorphins Inactivation (Shane et al. 1999)
Gastric inhibitory peptide Inactivation
(Ahren and Hughes 2005; Mentlein et
al. 1993b; Nausch et al. 1990)
Gastrin-releasing peptide Inactivation
(Ahren and Hughes 2005; Nausch et al.
1990)
Glucagon-like-peptides
(GLP1, GLP2) Inactivation
(Baggio and Drucker 2007; Drucker et
al. 1997)
Growth hormone releasing
factor Inactivation (Martin et al. 1993)
Neuropeptide Y
Inactivation/ altered
receptor specificity
(Frerker et al. 2007; Mentlein et al.
1993a)
Peptide YY
Inactivation/ altered
receptor specificity
(Mentlein et al. 1993a; Unniappan et
al. 2006)
Pituitary adenylate-cyclase-
activating polypeptide Inactivation (Lambeir et al. 2001a)
Prolactin Inactivation (Nausch et al. 1990)
Tyr-melanostatin Inactivation (Shane et al. 1999)
Substance P Inactivation (Guieu et al. 2006)
Vasoactive intestinal peptide Inactivation (Lambeir et al. 2001a)
Inflammatory mediators
Eotaxin (CCL11) Altered receptor specificity (Forssmann et al. 2008)
IP10 (CXCL10) Altered receptor specificity
(Ajami et al. 2008; Oravecz et al.
1997)
ITAC(CXCL11) Altered receptor specificity (Ajami et al. 2008)
Macrophage derived
chemokines (CCL2) Altered receptor specificity
(Lambeir et al. 2001b; Proost et al.
1999)
Mig (CXCL9) Reduced activity
(Lambeir et al. 2001b; Proost et al.
2001)
Monocyte chemotactic
proteins Inactivation (Van Coillie et al. 1998)
RANTES Altered receptor specificity (Oravecz et al. 1997)
Stromal-cell-derived-factor
(CXCL12) Altered receptor specificity (Ajami et al. 2008)
TNF-α Inactivation (Bauvois et al. 1992)

107
6. Figures
Figure 3.1 Genome-wide association plot for depressive-like behavior
Figure 3.1 Genome-wide association plot for depressive-like behavior. Genomic region on Chr 2
significantly correlates with immobility scores in the tail suspension test (-logP = 5.0). The
figure shows the baseline behavioral despair QTL. To the right is the putative gene, dipeptidyl
peptidase 4 (Dpp4), underneath behavioral locus on Chr 2. The y-axis denotes the strength of
association between genotype and phenotype (-logP scores), and the x-axis illustrates the
cumulative SNP position in the genome.

108
Figure 3.2 Haplotype structure within Dpp4 aligns with the top peak
Figure 3.3 Dpp4 haplotype is associated with a difference in baseline immobility score
Figure 3.2. Haplotype structure within Dpp4 aligns with the top peak. The figure illustrates
the strain distribution pattern for Dpp4 (bottom) and for the despair locus on Chr 2 (-logP >5.0,
top 3-SNP window). SNP positions are on the y-axis. The x-axis denotes strain. 3.3. Dpp4
haplotype is associated with a difference in baseline immobility score. Strains in haplotype
group 2 (GGG) exhibit lower depressive-like behavior. Percent time spent immobile in the TST
is a measure of depressive-like behavior (p<0.005).
3.2
3.3

109
Figure 3.4 Difference in plasma Dpp4 protein levels
Figure 3.5 Difference in brain Dpp4 protein levels
Figure 3.4. Difference in plasma Dpp4 protein levels. C57BL/6J have higher plasma Dpp4
protein levels in at baseline (p<0.05). 3.5. Difference in brain Dpp4 protein levels.
Comparison to DBA/2J, C57BL/6J exhibit higher Dpp4 protein levels in the brain (p<0.05).
3.5
3.6

110
Figure 3.6 Anxiety-like responses in the open field
Figure 3.7 Anxiety-like responses in the light-dark exploration test
Figure 3.8 Immobility responses in the tail suspension test.
3.6
3.7
3.8

111
Figure 3.6. Anxiety-like responses in the open field. In comparison to DBA/2J, C57BL/6J
mice spent more time in the center of the open field (p<0.0005). 3.7. Anxiety-like responses in
the light-dark exploration test. During the 10 min light-dark test, C57BL/6J mice spent more
time in the light compared to DBA/2J (p<0.005). 3.8. Immobility responses in the tail
suspension test. C57BL/6J mice exhibited greater immobilility, indicative of “depressive-like”
behavior, compared to DBA/2J mice (p<0.0005).

112
Figure 3.9 Measurement of plasma Dpp4 activity
Figure 3.10 Measurement of Dpp4 activity in the brain
Figure 3.9. Measurement of plasma Dpp4 activity. Baseline plasma DPP4 activity did not
differ between C57BL/6J and DBA/2J (white bars). Treatment with DPP4 inhibitor (sitagliptin),
resulted in greater than 80% reduction of plasma DPP4 activity in both strains (black and white
bars) 3.10. Measurement of Dpp4 activity in the brain. No difference in plasma DPP4 activity
was observed between C57BL/6J and DBA/2J (white bars). For both strains, 14-day treatment
with sitagliptin did not alter brain DPP4 activity.
3.9
3.10

113
Figure 3.11 Anxiety-like responses in the open field after chronic sitagliptin treatment
Figure 3.12 Anxiety-like responses in the light-dark assay after chronic sitagliptin
treatment
3.11
3.12

114
Figure 3.13 Depressive-like responses in the open after chronic sitagliptin treatment
Figure 3.11. Anxiety-like responses in the open field after chronic sitagliptin treatment. For
both C57BL/6J and DBA/2J strains, we found no significant difference between treatment
groups in the amount of time spent in the center of the open field. 3.12. Anxiety-like responses
in the light-dark assay after chronic sitagliptin treatment. Fourteen-day treatment with
sitagliptin did not alter anxiety-like responses in the light dark test for C57BL/6J and DBA/2J
strains. 3.13. Depressive-like responses in the open after chronic sitagliptin treatment. No
difference in immobility was observed between water and sitagliptin-treated mice. White bars
denote behavioral scores for control group. Black and white bars indicate mean behavioral
responses for the sitagliptin group.
3.13

115
REFERENCES
Abbott CA, McCaughan GW, Gorrell MD (1999) Two highly conserved glutamic acid residues
in the predicted beta propeller domain of dipeptidyl peptidase IV are required for its
enzyme activity. FEBS Lett 458: 278-84
Ahren B, Hughes TE (2005) Inhibition of dipeptidyl peptidase-4 augments insulin secretion in
response to exogenously administered glucagon-like peptide-1, glucose-dependent
insulinotropic polypeptide, pituitary adenylate cyclase-activating polypeptide, and
gastrin-releasing peptide in mice. Endocrinology 146: 2055-9
Ajami K, Pitman MR, Wilson CH, Park J, Menz RI, Starr AE, Cox JH, Abbott CA, Overall CM,
Gorrell MD (2008) Stromal cell-derived factors 1alpha and 1beta, inflammatory protein-
10 and interferon-inducible T cell chemo-attractant are novel substrates of dipeptidyl
peptidase 8. FEBS Lett 582: 819-25
Baggio LL, Drucker DJ (2007) Biology of incretins: GLP-1 and GIP. Gastroenterology 132:
2131-57
Bauvois B, Sanceau J, Wietzerbin J (1992) Human U937 cell surface peptidase activities:
characterization and degradative effect on tumor necrosis factor-alpha. Eur J Immunol
22: 923-30
Bernard AM, Mattei MG, Pierres M, Marguet D (1994) Structure of the mouse dipeptidyl
peptidase IV (CD26) gene. Biochemistry 33: 15204-14
Bjelke JR, Christensen J, Branner S, Wagtmann N, Olsen C, Kanstrup AB, Rasmussen HB
(2004) Tyrosine 547 constitutes an essential part of the catalytic mechanism of dipeptidyl
peptidase IV. J Biol Chem 279: 34691-7
Choleris E, Thomas AW, Kavaliers M, Prato FS (2001) A detailed ethological analysis of the
mouse open field test: effects of diazepam, chlordiazepoxide and an extremely low
frequency pulsed magnetic field. Neurosci Biobehav Rev 25: 235-60
Chu XY, Bleasby K, Yabut J, Cai X, Chan GH, Hafey MJ, Xu S, Bergman AJ, Braun MP, Dean
DC, Evers R (2007) Transport of the dipeptidyl peptidase-4 inhibitor sitagliptin by
human organic anion transporter 3, organic anion transporting polypeptide 4C1, and
multidrug resistance P-glycoprotein. J Pharmacol Exp Ther 321: 673-83
Crawley JN (1985) Exploratory behavior models of anxiety in mice. Neurosci Biobehav Rev 9:
37-44
D'Amico M, Di Filippo C, Marfella R, Abbatecola AM, Ferraraccio F, Rossi F, Paolisso G
(2010) Long-term inhibition of dipeptidyl peptidase-4 in Alzheimer's prone mice. Exp
Gerontol 45: 202-7
116
Davis JA, Singh S, Sethi S, Roy S, Mittra S, Rayasam G, Bansal V, Sattigeri J, Ray A (2010)
Nature of action of Sitagliptin, the dipeptidyl peptidase-IV inhibitor in diabetic animals.
Indian J Pharmacol 42: 229-33
Drucker DJ, Shi Q, Crivici A, Sumner-Smith M, Tavares W, Hill M, DeForest L, Cooper S,
Brubaker PL (1997) Regulation of the biological activity of glucagon-like peptide 2 in
vivo by dipeptidyl peptidase IV. Nat Biotechnol 15: 673-7
El Yacoubi M, Vaugeois JM, Marguet D, Sauze N, Guieu R, Costentin J, Fenouillet E (2006)
Behavioral characterization of CD26 deficient mice in animal tests of anxiety and
antidepressant-like activity. Behav Brain Res 171: 279-85
Emanuele E, Minoretti P, Martinelli V, Pesenti S, Olivieri V, Aldeghi A, Politi P (2006)
Circulating levels of soluble CD26 are associated with phobic anxiety in women. Prog
Neuropsychopharmacol Biol Psychiatry 30: 1334-6
Forssmann U, Stoetzer C, Stephan M, Kruschinski C, Skripuletz T, Schade J, Schmiedl A, Pabst
R, Wagner L, Hoffmann T, Kehlen A, Escher SE, Forssmann WG, Elsner J, von Horsten
S (2008) Inhibition of CD26/dipeptidyl peptidase IV enhances CCL11/eotaxin-mediated
recruitment of eosinophils in vivo. J Immunol 181: 1120-7
Frerker N, Wagner L, Wolf R, Heiser U, Hoffmann T, Rahfeld JU, Schade J, Karl T, Naim HY,
Alfalah M, Demuth HU, von Horsten S (2007) Neuropeptide Y (NPY) cleaving enzymes:
structural and functional homologues of dipeptidyl peptidase 4. Peptides 28: 257-68
Guieu R, Fenouillet E, Devaux C, Fajloun Z, Carrega L, Sabatier JM, Sauze N, Marguet D
(2006) CD26 modulates nociception in mice via its dipeptidyl-peptidase IV activity.
Behav Brain Res 166: 230-5
Heymann E, Mentlein R (1986) Complementary action of dipeptidyl peptidase IV and
aminopeptidase M in the digestion of beta-casein. J Dairy Res 53: 229-36
Ikushima H, Munakata Y, Iwata S, Ohnuma K, Kobayashi S, Dang NH, Morimoto C (2002)
Soluble CD26/dipeptidyl peptidase IV enhances transendothelial migration via its
interaction with mannose 6-phosphate/insulin-like growth factor II receptor. Cell
Immunol 215: 106-10
Ishii T, Ohnuma K, Murakami A, Takasawa N, Kobayashi S, Dang NH, Schlossman SF,
Morimoto C (2001) CD26-mediated signaling for T cell activation occurs in lipid rafts
through its association with CD45RO. Proc Natl Acad Sci U S A 98: 12138-43
Kendler KS, Gardner CO, Neale MC, Prescott CA (2001) Genetic risk factors for major
depression in men and women: similar or different heritabilities and same or partly
distinct genes? Psychol Med 31: 605-16
Krupina NA, Kushnareva EY, Khlebnikova NN, Zolotov NN, Kryzhanovskii GN (2009)
Behavioral changes in rats induced by a dipeptidyl peptidase IV inhibitor methionyl-2(S)-

117
cyanopyrrolidine: experimental model of anxiety-depression disorder. Bull Exp Biol Med
147: 285-90
Lambeir AM, Durinx C, Proost P, Van Damme J, Scharpe S, De Meester I (2001a) Kinetic study
of the processing by dipeptidyl-peptidase IV/CD26 of neuropeptides involved in
pancreatic insulin secretion. FEBS Lett 507: 327-30
Lambeir AM, Proost P, Durinx C, Bal G, Senten K, Augustyns K, Scharpe S, Van Damme J, De
Meester I (2001b) Kinetic investigation of chemokine truncation by CD26/dipeptidyl
peptidase IV reveals a striking selectivity within the chemokine family. J Biol Chem 276:
29839-45
Maes M, Capuron L, Ravaud A, Gualde N, Bosmans E, Egyed B, Dantzer R, Neveu PJ (2001)
Lowered serum dipeptidyl peptidase IV activity is associated with depressive symptoms
and cytokine production in cancer patients receiving interleukin-2-based immunotherapy.
Neuropsychopharmacology 24: 130-40
Maes M, De Meester I, Scharpe S, Desnyder R, Ranjan R, Meltzer HY (1996) Alterations in
plasma dipeptidyl peptidase IV enzyme activity in depression and schizophrenia: effects
of antidepressants and antipsychotic drugs. Acta Psychiatr Scand 93: 1-8
Maes M, De Meester I, Vanhoof G, Scharpe S, Bosmans E, Vandervorst C, Verkerk R, Minner
B, Suy E, Raus J (1991) Decreased serum dipeptidyl peptidase IV activity in major
depression. Biol Psychiatry 30: 577-86
Maes M, De Meester I, Verkerk R, De Medts P, Wauters A, Vanhoof G, Vandoolaeghe E, Neels
H, Scharpe S (1997) Lower serum dipeptidyl peptidase IV activity in treatment resistant
major depression: relationships with immune-inflammatory markers.
Psychoneuroendocrinology 22: 65-78
Martin RA, Cleary DL, Guido DM, Zurcher-Neely HA, Kubiak TM (1993) Dipeptidyl peptidase
IV (DPP-IV) from pig kidney cleaves analogs of bovine growth hormone-releasing factor
(bGRF) modified at position 2 with Ser, Thr or Val. Extended DPP-IV substrate
specificity? Biochim Biophys Acta 1164: 252-60
Mehrabian M, Wen PZ, Fisler J, Davis RC, Lusis AJ (1998) Genetic loci controlling body fat,
lipoprotein metabolism, and insulin levels in a multifactorial mouse model. J Clin Invest
101: 2485-96
Mentlein R, Dahms P, Grandt D, Kruger R (1993a) Proteolytic processing of neuropeptide Y and
peptide YY by dipeptidyl peptidase IV. Regul Pept 49: 133-44
Mentlein R, Gallwitz B, Schmidt WE (1993b) Dipeptidyl-peptidase IV hydrolyses gastric
inhibitory polypeptide, glucagon-like peptide-1(7-36)amide, peptide histidine methionine
and is responsible for their degradation in human serum. Eur J Biochem 214: 829-35
Nausch I, Mentlein R, Heymann E (1990) The degradation of bioactive peptides and proteins by
dipeptidyl peptidase IV from human placenta. Biol Chem Hoppe Seyler 371: 1113-8

118
Nestler EJ, Hyman SE (2010) Animal models of neuropsychiatric disorders. Nat Neurosci 13:
1161-9
Oravecz T, Pall M, Roderiquez G, Gorrell MD, Ditto M, Nguyen NY, Boykins R, Unsworth E,
Norcross MA (1997) Regulation of the receptor specificity and function of the chemokine
RANTES (regulated on activation, normal T cell expressed and secreted) by dipeptidyl
peptidase IV (CD26)-mediated cleavage. J Exp Med 186: 1865-72
Proost P, Schutyser E, Menten P, Struyf S, Wuyts A, Opdenakker G, Detheux M, Parmentier M,
Durinx C, Lambeir AM, Neyts J, Liekens S, Maudgal PC, Billiau A, Van Damme J
(2001) Amino-terminal truncation of CXCR3 agonists impairs receptor signaling and
lymphocyte chemotaxis, while preserving antiangiogenic properties. Blood 98: 3554-61
Proost P, Struyf S, Schols D, Opdenakker G, Sozzani S, Allavena P, Mantovani A, Augustyns K,
Bal G, Haemers A, Lambeir AM, Scharpe S, Van Damme J, De Meester I (1999)
Truncation of macrophage-derived chemokine by CD26/ dipeptidyl-peptidase IV beyond
its predicted cleavage site affects chemotactic activity and CC chemokine receptor 4
interaction. J Biol Chem 274: 3988-93
Rasmussen HB, Branner S, Wiberg FC, Wagtmann N (2003) Crystal structure of human
dipeptidyl peptidase IV/CD26 in complex with a substrate analog. Nat Struct Biol 10: 19-
25
Shane R, Wilk S, Bodnar RJ (1999) Modulation of endomorphin-2-induced analgesia by
dipeptidyl peptidase IV. Brain Res 815: 278-86
Steru L, Chermat R, Thierry B, Mico JA, Lenegre A, Steru M, Simon P, Porsolt RD (1987) The
automated Tail Suspension Test: a computerized device which differentiates psychotropic
drugs. Prog Neuropsychopharmacol Biol Psychiatry 11: 659-71
Steru L, Chermat R, Thierry B, Simon P (1985) The tail suspension test: a new method for
screening antidepressants in mice. Psychopharmacology (Berl) 85: 367-70
Sullivan PF, Neale MC, Kendler KS (2000) Genetic epidemiology of major depression: review
and meta-analysis. Am J Psychiatry 157: 1552-62
Szatkiewicz JP, Beane GL, Ding Y, Hutchins L, Pardo-Manuel de Villena F, Churchill GA
(2008) An imputed genotype resource for the laboratory mouse. Mamm Genome 19: 199-
208
Tanaka T, Camerini D, Seed B, Torimoto Y, Dang NH, Kameoka J, Dahlberg HN, Schlossman
SF, Morimoto C (1992) Cloning and functional expression of the T cell activation antigen
CD26. J Immunol 149: 481-6
Unniappan S, McIntosh CH, Demuth HU, Heiser U, Wolf R, Kieffer TJ (2006) Effects of
dipeptidyl peptidase IV on the satiety actions of peptide YY. Diabetologia 49: 1915-23

119
Van Coillie E, Proost P, Van Aelst I, Struyf S, Polfliet M, De Meester I, Harvey DJ, Van Damme
J, Opdenakker G (1998) Functional comparison of two human monocyte chemotactic
protein-2 isoforms, role of the amino-terminal pyroglutamic acid and processing by
CD26/dipeptidyl peptidase IV. Biochemistry 37: 12672-80
van West D, Monteleone P, Di Lieto A, De Meester I, Durinx C, Scharpe S, Lin A, Maj M, Maes
M (2000) Lowered serum dipeptidyl peptidase IV activity in patients with anorexia and
bulimia nervosa. Eur Arch Psychiatry Clin Neurosci 250: 86-92
OTHER RESOURCES
Sitgliptin [package insert], Whitehouse Station, NJ: Merck Sharp & Dohme Corporation; 2010

120
CHAPTER 4
EVALUATING GENETIC MARKERS AND NEUROBIOCHEMICAL ANALYTES FOR
FLUOXETINE RESPONSE USING A PANEL OF MOUSE INBRED STRAINS
This work has been accepted for publication in Psychopharmacology

121
1. Introduction
The social and economic burden of major depressive disorder (MDD) is substantial. Despite the
significant cost associated with depression, less than 30% of patients achieve adequate response to a
selective serotonin reuptake inhibitor (SSRI) (Trivedi et al. 2006). There are several factors that
contribute to poor treatment outcome including gender, disease onset, and presence of comorbid
psychiatric disorders (Kornstein and Schneider 2001). Presently, the therapeutic management of
patients who relapse or fail to respond is poorly defined. Partial responders or non-remitters typically
undergo a series of antidepressant treatment modifications that are largely based on trial and error,
leading to delay in symptom resolution and treatment discontinuation (Olfson et al. 2006; Warden et al.
2007). A set of biomarkers that can prospectively identify patients who will respond to a specific
medication can provide an evidence-based rationale for selecting an appropriate course of
antidepressant therapy.
Several large studies have been undertaken to identify genetic biomarkers of antidepressant
response (Garriock et al. 2010; Ising et al. 2009; Uher et al. 2010). Pharmacogenetic studies of
antidepressants in the Sequenced Treatment Alternatives for Depression (STAR*D) trial have led to the
identification of genes associated with treatment response (Hu et al. 2007; Kraft et al. 2007; Lekman et
al. 2008a; McMahon et al. 2006; Paddock 2008), treatment resistance (Perlis et al. 2008), and
treatment-emergent suicidal ideation (Laje et al. 2009; Laje et al. 2007; Perlis et al. 2007). In addition,
polymorphisms in genes that encode drug-metabolizing enzymes and transporters have been tested for
correlation with treatment response (Peters et al. 2008). Although several studies have yielded notable
findings, none meet currently accepted standards in human genetics for replication (Chanock et al.
2007).

122
The search for antidepressant biochemical markers is complicated by multiple neurobiological
abnormalities that have been observed in depression, indicating that it is unlikely for a single biological
marker to characterize a multifactorial disease like MDD. Many analytes, including brain-derived
neurotrophic factor (BDNF), serotonin transporter, and monoamines, have been linked with depressive
symptoms and response to antidepressant therapy (Manji et al. 2001; Nestler et al. 2002; Thase 2007).
A few studies have looked at biochemical markers that can be used as diagnostic (Domenici et al.
2010; Jehn et al. 2006) or treatment markers (Ising et al. 2007; Schule et al. 2009) for depression. Other
physiologic markers including neurostructural and neurofunctional measures have shown promise as
potential markers of antidepressant response (Leuchter et al. 2010; Leuchter et al. 2009b). It is yet to be
determined if these biomarkers can prospectively predict response prior to treatment.
A major limitation in evaluating the relationship between antidepressant response and
biochemical alterations in human subjects is sample accessibility, whereby analysis is typically
restricted to human serum and post-mortem brain samples. The assessment of post-mortem brain
tissues is limited by the inability to distinguish if neurobiochemical abnormalities are causal or a
consequence of disease or treatment, while serum samples are more accessible but provide a relatively
myopic view of the neurobehavioral mechanisms that occur in the brain. Importantly, these limitations
can be mitigated through the use of inbred mouse strains, which are easily maintained and manipulated
for research purposes. Besides ease in accessibility, mice within the same strain are homogeneous at
each genomic locus, which makes identification of genetic variants of drug response more feasible due
to reduced genomic complexity.
In order to understand how biochemical and genetic differences correlate with treatment
response, we measured depressive-like behavior, anxiety-like behavior, gene expression, and the levels

123
of thirty-six neurobiochemical analytes across a panel of genetically-diverse mouse inbred lines after
chronic treatment with vehicle or fluoxetine. Neurobiochemical markers were chosen based on their
putative molecular function within pathways proposed to underlie depression and anxiety, which
include neuronal transmission, HPA-axis regulation, and neuroimmune processes. To our knowledge,
this is the first study that simultaneously measured and examined the role of thirty-six putative
neurobiochemical markers across thirty mouse inbred strains. In this study, we examined how baseline
and treatment-induced biochemical differences affect depressive-like and anxiety-like responses. Our
goal was to establish genetic and biochemical biomarkers that can predict fluoxetine response and to
propose a molecular pathway that is critical in mediating response to SSRIs. In addition, we examined
baseline neurobiological differences that affect depressive-like and anxiety-like behaviors in an effort
to identify biomarkers that contribute to risk for poor treatment outcomes.
2. Materials and Methods
2.1 Animals
Thirty mouse inbred strains (129S1/SvImJ, A/J, AKR/J, BALB/cJ, BTBRT<t>tf/J, BUB/BnJ,
C3H/HeJ, C57BL/6J, C57BLKS/J, C57BR/cdJ, C58/J, CBA/J, CE/J, DBA/2J, FVB/NJ, I/LnJ, LG/J,
LP/J, MA/MyJ, MRL/MpJ, NOD/LtJ, NOR/LtJ, NZB/BlNJ, NZW/LacJ, P/J, PL/J, RIIIS/J, SJL/J,
SM/J, and SWR/J) aged 5-6 weeks old were obtained from The Jackson Laboratory (Bar Harbor, ME).
Male mice were housed four per cage in polycarbonate cages on a 12-hour light/dark cycle (lights on at
0700h) with access to food and water ad libitum. Following one week of habituation, mice were
randomized to either control or treatment group. Depending on cost, availability, and estimated intra-
strain response variability, the number of animals treated per treatment group ranged from 9 to 21
animals per strain. All procedures were approved by the Institutional Animal Care and Use Committee

124
and followed the guidelines set forth by the National Institutes of Health (NIH) Guide for the Care and
Use of Laboratory Animals.
2.2 Drug Treatment
Fluoxetine is an SSRI that has been extensively studied for its effect on depressive behavior
(Cipriani et al. 2005; Rossi et al. 2004). Fluoxetine HCl was purchased from Spectrum Chemicals
(Gardena, CA). Mean water intake for each strain was determined previously by measuring daily water
consumption for three weeks. This information, along with average weight measurements for each
strain, was used to determine the amount of fluoxetine required to provide a daily oral dose of 0 or 18
mg/kg per mouse. A chronic fluoxetine regimen of 18 mg/kg for 21 days was selected based on results
of a previous dose-response study which investigated the behavioral effects of fluoxetine
administration at 0, 5, 10, 14, or 18 mg/kg for 1, 6, or 21 days (Miller et al. 2008). In each strain,
comparison of mean daily water intake between vehicle and fluoxetine-treated animals indicates
minimal effect of fluoxetine on water consumption (Supplementary Table 4.1). Mice were treated
daily with fluoxetine or water throughout the end of the study and were sacrificed one week after the
open field test between 1300 and 1600H.
2.3 Tail Suspension Test (TST)
Strains were randomly tested across day, time of testing, and equipment. At any given time,
only four to eight animals per strain were tested. Each animal was tested only once in each procedure.
After chronic administration of 0 or 18 mg/kg of fluoxetine for 21 days, mice aged 9-10 weeks were
tested in a tail-suspension apparatus (PHM-300 TST Cubicle, Med Associates, St. Albans, VT)
between 1300h and 1600h. In this test, the mouse is subjected to short-term inescapable stress by
125
having its tail suspended. Following failed attempts to escape, the mouse becomes immobile, a
response generally considered as behavioral despair, a depressive-like behavior that is proposed to
model “hopelessness” (Steru et al. 1987; Steru et al. 1985). Immobility was recorded for 7 min in 60
sec blocks using the following parameters: threshold = 3, gain = 8 and resolution = 200ms. Since all
strains were uniformly active for the first min, percent time spent immobile was calculated for the last
6 min of the test. This procedure has been used previously to determine TST responses to
antidepressants (Fujishiro et al. 2002; Ukai et al. 1998). Mice that climbed up their tail during testing
were excluded from analysis (number of animals excluded = 104 out of 721 mice). Mean depressive-
like behavior is reported in Supplementary Table 4.2.
2.4 Open Field Test (OF)
To minimize potential carryover effects between tests, behavior in the open field was recorded a
week following TST. The OF test was conducted between 1300h and 1600h using a 27.3 cm x 27.3
open field apparatus (MED-OFA-MS, Med Associates, St. Albans, VT), which was surrounded by
infrared detection beams on the x-, y- and z-axes that automatically recorded the animals' position and
activity over the course of the experiment. Activity in the open field was recorded for ten minutes
within an environmental chamber that provided white noise (60-64 dB) and low, indirect lighting
(Supplementary Table 4.2). The OF is commonly used to measure exploratory and locomotive
behavior in mice. This test exploits the rodent‟s innate aversion to well-lit open spaces. Based on
previous observations that showed increased exploration towards illuminated open areas following
administration of anxiolytics (Choleris et al. 2001; Crawley 1985), anxiety-like behavior was measured
as percent time spent in the center 25% of the open field. In addition, locomotor activity was recorded

126
by calculating the total distance traveled in the open field. This behavior was measured to assess if
general locomotor activity confounded response in the TST.
2.5 Tissue Collection
Upon completion of the study, mice were sacrificed by cervical dislocation and decapitation
between 0900h and 1300h. Trunk blood was quickly collected and allowed to clot on ice. Following
centrifugation, serum samples were collected and stored at -20ºC for determination of fluoxetine and
norfluoxetine levels using liquid chromatography-mass spectrometry/mass spectrometry (LC-MS/MS).
Micro-dissections of individual regions were performed on serial coronal brain sections that were
placed on a cold metal block. Cortex was taken from the same section for each animal and immediately
snap frozen on dry ice and stored at -80ºC for gene expression and neurobiochemical analysis. Other
brain regions were used for RNA isolation and subsequent gene expression analysis. Given that the
neurobiochemical markers we examined were primarily expressed in the brain (Table 4.1), we
measured the levels of these analytes in brain tissue.
2.6 Fluoxetine/norfluoxetine quantification
A solution with 10 µL of serum and 150 µL of acetonitrile was spiked with 5 µg/mL of each
internal standard (fluoxetine- D6 and norfluoxetine-D6). Following sample filtration with 0.45 µm filter
plate, 50 µL of the filtrate were diluted with 0.1% formic acid and injected into a Sciex 4000 LC
MS/MS (Sciex Inc., Concord ON) equipped with a Waters YMC Cyano HPLC column (2.0 x 23 mm)
(Milford, MA). The mobile phase consisted of water/acetonitrile/formic acid (75:25:0.1). A standard
curve with concentrations from 20 to 10, 000 ng/mL was used to extrapolate amounts of fluoxetine and
norfluoxetine in each sample (n = 8-19 mice per strain per treatment group). Peak areas were detected

127
for ions with the following mass to charge (m/z) ratios: m/z 31044 (fluoxetine), m/z 296 134
(norfluoxetine), m/z 316 44 (fluoxetine- D6), and m/z 302 140 (norfluoxetine-D6). This information
was used to quantify serum fluoxetine and norfluoxetine levels (Supplementary Table 4.3).
2.7 Neurobiochemical analyte quantification
Prior to ELISA experiments, all antibodies were tested for specificity by performing western
blot experiments in pooled brain samples acquired from three mouse inbred strains. Abundance of
neurobiochemical markers was measured using a parallelized reverse ELISA methodology (Zeptosens
– a division of Bayer (Schweiz) AG, Witterswil, Switzerland). From each strain, cortex tissues were
taken from three animals in each treatment group and homogenized in CLB1 buffer (Zeptosens) with
zirconium oxide beads for 30 sec using QIAgen TissueLyser II (QIAgen, Valencia, CA). Semi-solid
brain tissues were mixed gently on a tumbling shaker for 30 min at room temperature. Following
centrifugation (2 min at 10,000 x g), supernatants were transferred and stored at -80ºC until further
analysis. Total protein concentrations for each sample were determined using a modified Bradford
assay (Coomassie Protein Plus Assay, Pierce Biotechnology, Rockford, IL). All samples were adjusted
with CLB1 buffer to obtain a uniform concentration of 2 mg/mL. Immediately after dilution, each
sample was spotted twice at concentrations of 0.05, 0.10, 0.15, and 0.2 mg/mL of total protein.
Reference signals were obtained from simultaneous spotting of assay buffer and labeled antibodies on
the array chip. Following overnight incubation with primary antibodies, arrays were washed and
incubated with fluorescence-labeled anti-species secondary antibody for 2.5 h in the dark. Arrays were
imaged simultaneously using ZeptoREADER (Zeptosens) at excitation/emission wavelengths of
635/670 nm with exposure times of 0.3, 1, 5, and 10 sec.

128
All images were analyzed using ZeptoVIEW 3.0 (version 3.0.1.17). Background intensities for
each individual spot were determined by taking the mean signals of four additional spots equidistant
from the sample spot. Net fluorescence intensities (NFI) were calculated by subtracting background
signal from each sample spot signaling. Following NFI determination, each NFI value was normalized
to the mean intensity of the reference spots. Using least-squares method, eight normalized NFI values
obtained from each sample were fitted linearly against tissue lysate protein concentrations. The
extrapolated signal intensity that corresponds in the mid-point of the concentration range (0.125
mg/mL) is defined as the reference fluorescence intensity (RFI). Relative abundance for each
neurobiochemical marker was obtained by comparing inter-strain RFI values. All neurobiochemical
markers measured in this study are listed in Table 1. Mean RFI scores for each analyte are listed in
Supplementary Table 4.4.
Behavioral, neurobiochemical, and drug (fluoxetine and norfluoxetine) concentration data for
each animal were deposited at The Jackson Laboratory Phenome Database (http://phenome.jax.org/)
under the name Wiltshire 2 and Wiltshire 3.
2.8 Statistical analysis
Response to treatment was calculated by taking the ratio of fluoxetine behavioral scores to
vehicle behavioral scores. Percent change in immobility was calculated by multiplying the ratio of
fluoxetine immobility scores to vehicle immobility scores by 100 and then subtracting the product from
100. We defined positive and negative responders as having at least 20% decreased or increased in
immobility scores, respectively. Given that the criterion was defined subjectively, we also investigated
difference in response using more stringent criteria, which were 30% and 40% change in immobility
scores. Strain and treatment effects on immobility scores and percent time spent in the center of the OF
129
were obtained using a two-way analysis of variance (ANOVA). Post-hoc pairwise comparisons of
behavioral scores between control and fluoxetine groups were performed using a Mann-Whitney U
test. False discovery rate is controlled at the 0.10 level using the Benjamini-Hochberg method.
Because both baseline neurobiochemical levels and fluoxetine-induced biochemical alterations
can affect SSRI response, we wanted to identify the relationship between behavior and
neurobiochemical alterations at baseline and after fluoxetine treatment. Partial least squares (PLS)
regression analysis was used to extract latent vectors that account for most of the covariance between
biochemical analytes and behavior in each treatment group. Once the vector was extracted, we
determined the biochemical analytes that covary most with behavioral response by assessing the PLS
loading score for each analyte onto the vector.
To identify biochemical markers that discriminate positive or negative responders, we used a
Distance Weighted Discrimination (DWD) analysis. Unlike traditional multivariate analysis, this
approach was intended for analysis of high dimension, low sample size data sets (Marron et al. 2007;
Qiao et al. 2010). The DWD method was used to identify a hyperplane that best distinguishes the
positive or the negative response groups. Following identification of a DWD hyperplane, the DWD
loading vector (orthonormal to the hyperplane) was calculated, indicating the contribution of each
neurobiochemical marker in discriminating negative or positive responders. The Direction Projection
Permutation based hypothesis test (DiProPerm) with DWD was used to test for an overall
neurobiochemical mean difference in each response group. In this procedure, the neurobiochemical
scores were projected onto the DWD vector and the two sample t-statistic was computed. The t-statistic
obtained from the real data set was compared to the t-statistics obtained from 1,000 relabeled group

130
pairs with recomputed DWD vector to determine if the overall difference in neurobiochemical levels
was significant (p<0.05).
We performed Pearson‟s correlation analysis to determine if neurobiochemical levels
correspond with fluoxetine, norfluoxetine, or mRNA expression levels. Molecular connections between
candidate treatment biomarkers were evaluated using Ingenuity Pathway Analysis (IPA) software
(Ingenuity Systems, Inc. Redwood, CA). Statistical analyses were performed using SAS 9.2 (SAS
Institute, Cary, NC), R Package version 2.13 (http://www.r-project.org/), and MATLAB 7 (The
MathWorks, Natwick, MA).
2.9 Transcriptome gene expression analysis
Brain regions were homogenized in 500 µL of Trizol using a QIAgen TissueLyser at 30 Hz
(QIAgen, Valencia, CA). RNA for each animal was isolated by guanidinium thiocyanate-phenol-
chloroform extraction and was further purified using the RNAeasy miniprep kit (QIAgen, Valencia,
CA) according to the manufacturer‟s directions. For each strain, RNA samples for three animals from
each treatment group were pooled and converted to cDNA and biotinylated cRNA (Enzo kit,
Affymetrix, Santa Clara, CA). The resulting cRNA was hybridized to Affymetrix GeneChip Mouse
Genome 430 2.0 arrays.
Following normalization with the gcRMA algorithm, expression data were analyzed using
ArrayAssist software (Stratagene, La Jolla, CA). To identify genetic alterations associated with
fluoxetine administration and treatment response, we analyzed gene expression profiles between
control and fluoxetine treated mice as well as profiles between negative and positive responders as
defined by the tail-suspension phenotype. Microarray data were preprocessed to identify genes with

131
expression levels greater than background levels (intensity >50). Gene expression profiles for each
treatment group (control vs. fluoxetine) were filtered by calculating fold change difference between
probes with minimum and maximum intensity values. In each treatment group, genes that were
significantly variable between strains (fold change ≥3 between minimum and maximum values) were
analyzed. Alternatively, expression data between response groups (negative vs. positive) were filtered
by taking the ratio of fluorescence intensities between fluoxetine and control mice within each strain.
Probe sets that were significantly affected by fluoxetine treatment (intensity ratios of fluoxetine to
vehicle ≥2 for at least one strain) were selected. Following filtration, genes were prioritized based on
their signal-to-noise ratio (SNR), which is the difference in median gene expression values divided by
the standard deviation. The p-value for each observed SNR was determined from the empirical null
distribution of SNRs, which was obtained by permuting the sample labels and recalculating the SNRs
1,000 times (Gould et al. 2006). Genes with a false discovery rate (FDR) of ≤ 0.05 were considered
significant.
SNR rank scores were used to identify genes that were differentially expressed in either
treatment (control vs. fluoxetine) or response (negative vs. positive responders) groups. These genes
were then tested for their ability to assign samples in each response or treatment category using a k-
nearest-neighbors (k-NN) classification with leave-one-out cross-validation test previously described in
(Cover T.M. and Hart 1967; Golub et al. 1999). Briefly, the k-NN algorithm assigned a treatment or
response label on the unknown sample based on the class assignment most frequently represented
among its closest neighbors. Class assignments were determined based on the expression profiles of
genes deemed to be informative. The validity of the model was tested using a leave-one-out cross-
validation test, in which the algorithm withheld a sample, built a class predictor model using the
remaining samples, and then predicted the class label of the withheld test sample. Using a distance
132
function, the model determined which members of the training set were closest to the test sample and
then weighted each “vote” according to the distance of the unknown test sample from its neighbors,
giving the closest neighbor the biggest “vote.” This process was iteratively performed for each sample,
and the cumulative error rate was calculated (Cover T.M. and Hart, 1967; Golub et al., 1999) (Golub et
al. 1999). An unsupervised hierarchical clustering analysis was used to evaluate the expression pattern
of the informative genes for each treatment and response group. Moreover, we performed eQTL
analysis on genes with significant SNR values (FDR≤ 0.05) as described in (Wu et al. 2008) to
determine if changes in gene expression following fluoxetine treatment were under cis-regulation.
Gene expression analyses were performed using GenePattern 2.0 (Reich et al. 2006) and R Package
version 2.13. Gene expression data were deposited into NCBI Gene Expression Omnibus (GEO)
database (GSE28644).
A logistic regression analysis was used to identify baseline genetic markers that can account for
variable fluoxetine response. Probe sets that were variable in the control group (fold change ≥3
between minimum and maximum values) were selected and evaluated for their influence on fluoxetine
response. By using these analyses, we can identify baseline genetic markers that may be predictive of
SSRI response. Statistical analyses were performed using R Package version 2.13.
2.10 QTL Mapping
Efficient Mixed-Model Association (EMMA) has been well-described elsewhere (Kang et al.
2008) and will be summarized here. Experimental SNP genotypes encompassing over 500,000
polymorphic loci across 72 commonly-used laboratory strains were obtained from the Center for
Genome Dynamics at http://cgd.jax.org (Szatkiewicz et al. 2008; Yang et al. 2009). Over 190,000
SNPs were informative for the 30 mouse inbred lines, which provided the basis for inferring genotype.

133
SNPs used in these analyses were fully genotyped, not imputed, and had been specifically selected to
discriminate Mus musculus sub-species. This set of SNPs avoids some of the previous biases in
genome-wide analyses and enables an accurate ascertainment of population substructure. Associations
between genotype (1-SNP) and phenotype were calculated by an F-statistic corrected for population
structure and genetic relatedness. Results were plotted using SpotFire software (TIBCO Palo Alto,
CA). Genomic loci that were associated with behavioral or biochemical phenotypes at an FDR ≤0.05
were considered significant.
3. Results
3.1 Behavioral measurements
Behavioral responses were measured in the open field test and tail suspension test following
chronic treatment with vehicle (water) or fluoxetine. Analysis of immobility scores across the 30
mouse inbred strains revealed significant strain (F = 29.83, p< 0.0001) and treatment (F = 39.14, p<
0.0001), as well as significant strain by treatment effects (F = 3.83, p< 0.0001). Similarly, significant
strain (F = 23.16, p< 0.0001), treatment (F = 20.41, p< 0.0001), and strain by treatment effects (F =
1.63, p< 0.02) were observed for percent time spent in the center of the OF. Compared to the control
group, an overall reduction in mean immobility was observed in mice treated with fluoxetine (t =
3.253, p<0.003). However, change in immobility scores (fluoxetine response) was variable between
strains. Thirteen strains exhibited 20% reduction in immobility (positive responders) while five inbred
strains exhibited 20% increased in immobility (negative responders) (Figure 4.1). Post-hoc pairwise
comparisons of behavioral scores between treatment groups revealed significant difference in
immobility scores for BALB/cByJ, BUB/BnJ, C57BL/6J, C57BR/cdJ, CBA/J, MA/MyJ, P/J, PL/J, and

134
SM/J. Significant difference in anxiety-like responses between vehicle and fluoxetine treated mice
were observed for DBA/2J, MA/MyJ, SJL/J, and SM/J (Supplementary Table 5).
Mean fluoxetine and norfluoxetine levels were variable across the strains, concentration ranges
are (470.3 ng/mL - 1274.8 ng/mL) for fluoxetine and (578.6 ng/mL - 1612.2 ng/mL) for norfluoxetine.
No significant correlation was observed between mean depressive-like behavior and mean serum levels
of fluoxetine (r2
= 0.036) or its metabolite norfluoxetine (r2
= 0.047). This finding is similar to human
studies, which do not find significant association with antidepressant response and serum levels of
fluoxetine or norfluoxetine (Amsterdam et al. 1997; Beasley et al. 1990; Norman et al. 1993). With the
exception of a few markers, no significant correlation was detected between neurobiochemical levels
and drug concentration. Fluoxetine level was minimally correlated with GSK3β (r2
= 0.213), HDAC5
(r2
= 0.131), and VEGF (r2
= 0.155). Minimal correlation between MCH protein levels and
norfluoxetine levels (r2
=0.135) was also detected. There was no correlation between mean percent
immobility in the TST and total distance traveled in the OF for control (r2
= 0.013) and treated animals
(r2
= 0.083), indicating that depressive-like behavior was not affected by locomotor activity. We
observed a modest correlation between baseline and fluoxetine-induced immobility scores (r2
= 0.628),
which suggests that baseline TST behavior is linked with drug response. Genetic analysis can be
performed using inbred-strain phenotype data to identify genetic loci associated with behavioral
phenotypes (Miller et al. 2010; Williams et al. 2009). Independent QTL mapping analysis for
behavioral phenotypes identified significant loci for anxiety, treatment response (data not shown), and
baseline behavioral despair. A locus on Chromosome 9 (9: 46.7- 47.6 Mb) associated with baseline
depressive-like behavior (-logP = 6.17, FDR≤ 0.059) and this was of particular interest because of its
co-localization with genome-wide association analysis for neurobiochemical markers.

135
3.2 Levels of S100β, GSK3β, HDAC5, and GFAP contribute most to treatment response
Levels of thirty-six neurobiochemical markers proposed to be involved in depression and
anxiety were measured in cortex (Table 4.1). Dopamine transporter (DAT), interleukin-6 (IL-6),
FK506-binding protein 51 (FKBP51), glucocorticoid receptor (NR3C1), and neuron specific family
gene member 2 (NSG2) were excluded from the analysis due to weak intensities, irregular staining, or
non-linear dose-response signals. In the control group, correlation between protein levels and mRNA
expression levels was detected for c-Fos (r2
= 0.269, 1423100_at), GFAP (r2
= 0.222, 1426508_at; r2
=
0.184, 1426509_at; r2
= 0.187, 1440142_s_at), GLO1 (r2
= 0.244, 1424108_at; r2
= 0.274,
1424109_a_at), and PAQR8 (r2
= 0.1796, 1431042_at). In the fluoxetine group, correlation between
protein levels and mRNA expression levels were detected for GFAP (r2
= 0.183, 1440142_s_at; r2
=
0.623, 1426508_at; r2
= 0.692, 1426509_s_at;), GNB1 (r2
= 0.144, 1454696_at; r2
= 0.161,
1417432_at), and NPY (r2
=0.154, 1419127_at). The lack of strong correlation between
neurobiochemical levels and corresponding transcript levels indicates an indirect relationship between
mRNA and protein expression. Partial least squares analysis of the data indicated that the first vector
accounted for 56% and 59% of the covariance in neurobiochemical and behavioral differences in the
fluoxetine and control groups, respectively (Supplementary Table 4.6). Behaviors in the OF and TST
accounted for baseline behavior (PLS loading score onto vector 1, percent time spent in the center OF:
75.1% and immobility TST: 56.4%). However, behavioral differences observed after chronic fluoxetine
treatment were mainly due to inter-strain responses in the TST (PLS loading score onto vector 1,
percent time spent in the center OF: 17.2% and immobility TST: 72.6%). Levels of glyoxylase 1
(GLO1) and guanine nucleotide binding protein 1 (GNB1) account for most of the covariance in
anxiety-like and depressive-like behavior in the control group. Higher levels of GLO1 and GNB1
associated with higher baseline anxiety-like and depressive-like behavior. Alternatively, fluoxetine-
136
induced immobility behavior was mostly affected by glial fibrillary acidic protein (GFAP), S100 beta
protein (S100β), GLO1, and histone deacytelase 5 (HDAC5) (Figure 4.2). Lower immobility scores
following fluoxetine treatment were linked with higher levels of GFAP, S100β, GLO1, and HDAC5.
In order to identify biomarkers of fluoxetine response, we examined which biochemical
analytes were most effective in discriminating positive or negative responders. An overall
neurobiochemical difference was observed in positive and negative responders. Neurobiochemical
alterations following fluoxetine treatment discriminate positive responders, while baseline biological
differences distinguish negative responders. This finding was observed irrespective of the stringency in
defining positive or negative response, defined as 20-40% reduction or increased in immobility,
respectively (Figure 4.3). DWD analysis show levels of S100β, GSK3β, HDAC5, GFAP, and GNB1
account for most of the variance in treatment response (Figure 4.2). Baseline levels of S100β, GSK3β,
HDAC5, GFAP, and GNB1 can discriminate negative responders. Chronic fluoxetine treatment affects
these analytes and the levels of S100β, GSK3β, HDAC5, GFAP, and GNB1 post-treatment indicate
positive response to fluoxetine. The direction of the vectors was the same for GSK3β and HDAC5 but
opposite for S100β and GNB1 when discriminating positive or negative responders. Negative
responders had lower levels of S100β and higher levels of GNB1, HDAC5, and GSK3β at baseline,
while positive responders had lower levels of GNB1 and higher levels of S100β, GSK3β, and HDAC5
after fluoxetine treatment (Figure 4.2). GSK3β and HDAC5 can discriminate negative or positive
response but have poor specificity in identifying negative and positive response groups from each
other, while the opposing direction of the S100β and GNB1 vectors indicates that both analytes can
discriminate negative and positive response groups from each other. Interestingly, we observed
minimal influence of GFAP on positive response relative to its affect on negative response, which
suggests that elevation in GFAP is mainly indicative of negative fluoxetine response.

137
In both analyses, response to fluoxetine was associated with alteration in candidate
neurobiochemical levels (Figure 4.2). Results from different methods of analysis (PLS and DWD)
show that levels of GFAP, S100β, HDAC5, and GSK3β contribute to differential TST responses after
fluoxetine treatment. In order to address whether fluoxetine mediates levels of candidate treatment
markers S100β, GFAP, HDAC5, and GSK3β through a common pathway, we looked for molecular
connections between them. Using IPA software, we discovered that all candidate treatment markers are
linked either directly or indirectly. S100β, GFAP, HDAC5, and GSK3β connect within a common
cellular growth and proliferation network, indicating the importance of cellular genesis in mediating
response to chronic fluoxetine treatment (Supplementary Figure 4.1).
3.3 Gene expression profiles for treatment and response groups
Gene expression data collected from cortex were preprocessed to eliminate invariable probe
sets, reducing the number of probes from 45,101 to 4,818. From genome-wide gene expression
analysis, we first identified genes that were strongly correlated with control or fluoxetine treatment by
computing the SNR ratio for 4,818 probe sets. We found 203 probe sets that were differentially
expressed in either treatment group (FDR ≤ 0.10). Based on the SNR rank scores, twelve genes were
significantly up-regulated in control or fluoxetine group, indicating that these genes are likely to be
informative for assigning treatment category (Supplementary Table 4.7). To evaluate whether the
expression profiles of the informative genes can be used to predict treatment classifications, we
performed the k-NN leave-one-out cross-validation test. The twelve informative genes correctly
predicted treatment class for 38 out of the 60 samples (absolute error of 36.6%), indicating that the
overall expression patterns of the informative genes do not effectively predict treatment class. Because
it is likely that gene expression differences between vehicle and fluoxetine-treated mice may be
138
confounded by inter-strain difference in response, we then analyzed gene expression profiles in
negative and positive response groups. There were over 171 genes with variable expression patterns in
each response group (FDR≤ 0.05). Based on SNR rank scores, eight genes were significantly up-
regulated in either positive or negative responders, which make them likely to be genetic predictors of
fluoxetine response (Supplementary Table 4.9). Using the k-NN leave-one-out cross-validation
algorithm, we tested to see if responders can be correctly assigned (negative or positive) based on the
expression patterns of the eight informative genes. Sixteen out of the eighteen samples were correctly
assigned to the appropriate response groups, providing an absolute error rate of 11.1%. Results from
the regression analysis indicate that several baseline genetic markers affect inter-strain variability in
fluoxetine response (Supplementary Table 4.10). Using previously described eQTL analysis (Wu et
al. 2008), we found that changes in gene expression for the 171 genes were not likely due to cis-
regulation. Gene expression changes as measured by the log ratios of fluorescence intensities
(fluoxetine/vehicle) did not significantly associate with polymorphic variants found within 25-500 kb
of the putative genes. A heat map was generated following hierarchical clustering analysis, wherein the
expression patterns of the informative genes were used to cluster each treatment and response group
(Figure 4.4). Apart from a few specific strain divergences the gene sets indicate clusters of treatment
and response groups. Our results show that gene expression differences were more apparent between
response groups (positive vs. negative) compared to treatment groups (control vs. fluoxetine) with the
gene set for response groups being able to reasonably predict SSRI response (Figure 4.5).

139
3.4 Quantitative trait loci associated with baseline depressive-like behavior and variable
neurobiochemical levels
We also investigated whether differences in neurobiochemical analytes, which have been
previously linked to anxiety and/or depression, are subject to a common genetic regulatory mechanism.
Of particular interest, convergence of neurobiochemical and behavioral data revealed significant loci
co-localization on Chr 9 (9: 46.7 - 47.6 Mb) (Figure 4.6). The Chr 9 QTL associated with baseline
depressive-like behavior as well as baseline levels of cyclic AMP response element binding protein
(CREB) (-logP = 4.46, FDR≤ 0.05) and vascular endothelial growth factor (VEGF) (-logP = 5.56,
FDR≤ 0.05). Genes at this locus include Cadm1 and 2900052N01Rik. Cadm1 is involved in neural cell
adhesion processes, facilitating cellular and molecular communication between cells and has been
linked with social impairments and anxiety-like behavior in mice (Takayanagi et al. 2010; Zhiling et al.
2008).
4. Discussion
Identification of biomarkers that can establish diagnosis, prognosis, and response to treatment is
critical to the advancement of research and management of patients with mood disorder. Biomarkers
can be used to objectively assess clinical progression and response to antidepressant therapy. Relative
to human studies, the use of mouse inbred strains can be an effective method for investigating
biomarkers of drug response due to lower cost, greater tissue accessibility, reduced genomic
complexity, and subject availability. However, the use of animal models to parallel subsets of
behaviors that typify human disorders is challenging, and many of the symptoms used to establish
psychiatric diagnoses in humans cannot be replicated in animals (Nestler and Hyman 2010). Here, we
assess limited sets of specific behaviors that are relatively robust and have been previously validated as

140
responsive to antidepressive drug treatment (Cryan et al. 2005; Kulkarni and Dhir 2007) in a panel of
genetically-diverse inbred mouse strains (Liu and Gershenfeld 2003; Ripoll et al. 2003; Trullas et al.
1989). The TST is primarily used to evaluate antidepressant activity of novel compounds and does not
itself elicit depressive behavior, hence evaluation of treatment responses following exposure to chronic
stress, an animal model of clinical depression that has both face and predictive validity (Nestler and
Hyman 2010; Willner 1997; 2005), is needed for independent validation of treatment biomarkers.
Early studies from the STAR*D trial found a high co-occurrence of anxiety and depression.
Over 49% and 42% of patients in the primary care and secondary care setting, respectively exhibited
“anxious depressive” symptoms (Fava et al. 2006). Compared to patients with depression alone,
patients with comorbid anxiety and depressive disorders are more likely to have prolonged, severe, and
recurrent symptoms (Andreescu et al. 2007; Fava et al. 2004) and are less responsive to treatment
(Emmanuel et al. 1998; Fava et al. 2008). In this study, we examined how baseline and treatment-
induced biochemical differences affect depressive-like and anxiety-like responses. While anxiety-like
and depressive-like behavior both contribute to baseline behavioral differences, anxiety-like behavior
as measured by percent time spent in the center of the OF was only minimally affected by fluoxetine
treatment. This result supports previous findings, which have demonstrated that responses in the TST is
more sensitive to antidepressant drugs as opposed to other psychotropic agents like anxiolytics,
antipsychotics, and stimulants (Cryan et al. 2005). Levels of GLO1 and GNB1 mostly account for
anxiety-like and depressive-like behavior in the control group, suggesting that alterations in GLO1 and
GNB1 may be common in both depression and anxiety disorders. GLO1 is an antioxidant enzyme that
catalyzes the detoxification of methylglyoxal and has been linked with various psychiatric disorders
including depression (Fujimoto et al. 2008), panic disorder without agoraphobia (Politi et al. 2006),
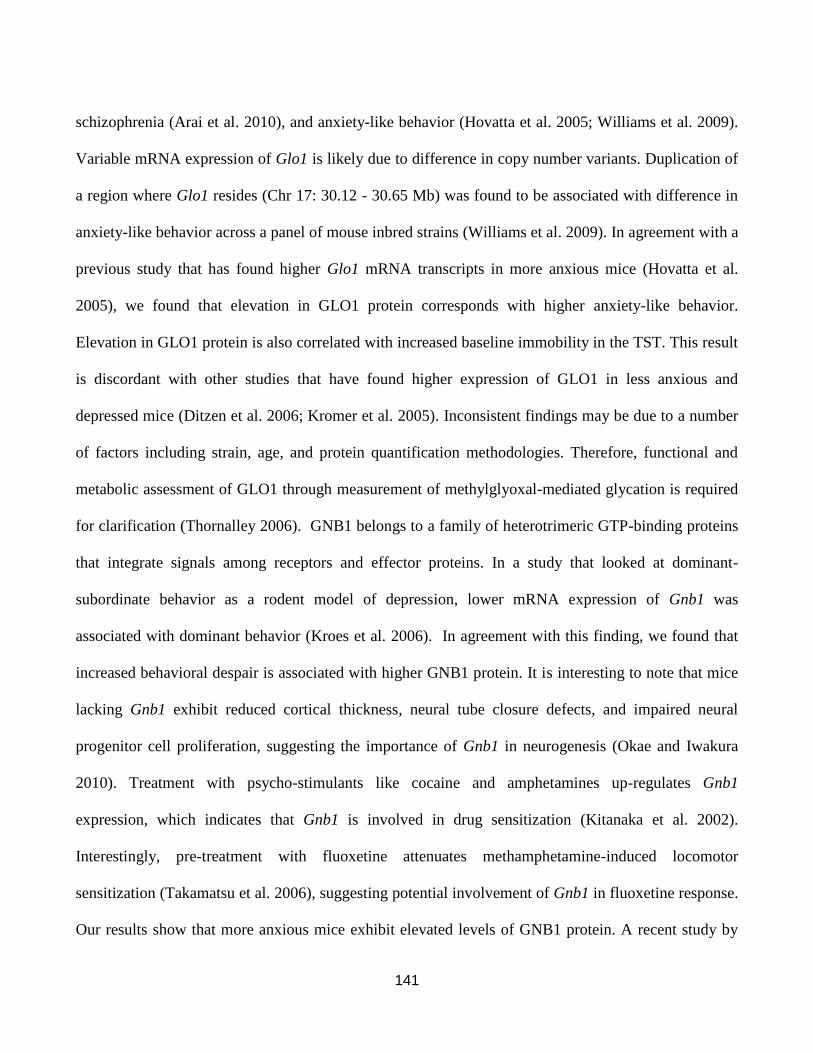
141
schizophrenia (Arai et al. 2010), and anxiety-like behavior (Hovatta et al. 2005; Williams et al. 2009).
Variable mRNA expression of Glo1 is likely due to difference in copy number variants. Duplication of
a region where Glo1 resides (Chr 17: 30.12 - 30.65 Mb) was found to be associated with difference in
anxiety-like behavior across a panel of mouse inbred strains (Williams et al. 2009). In agreement with a
previous study that has found higher Glo1 mRNA transcripts in more anxious mice (Hovatta et al.
2005), we found that elevation in GLO1 protein corresponds with higher anxiety-like behavior.
Elevation in GLO1 protein is also correlated with increased baseline immobility in the TST. This result
is discordant with other studies that have found higher expression of GLO1 in less anxious and
depressed mice (Ditzen et al. 2006; Kromer et al. 2005). Inconsistent findings may be due to a number
of factors including strain, age, and protein quantification methodologies. Therefore, functional and
metabolic assessment of GLO1 through measurement of methylglyoxal-mediated glycation is required
for clarification (Thornalley 2006). GNB1 belongs to a family of heterotrimeric GTP-binding proteins
that integrate signals among receptors and effector proteins. In a study that looked at dominant-
subordinate behavior as a rodent model of depression, lower mRNA expression of Gnb1 was
associated with dominant behavior (Kroes et al. 2006). In agreement with this finding, we found that
increased behavioral despair is associated with higher GNB1 protein. It is interesting to note that mice
lacking Gnb1 exhibit reduced cortical thickness, neural tube closure defects, and impaired neural
progenitor cell proliferation, suggesting the importance of Gnb1 in neurogenesis (Okae and Iwakura
2010). Treatment with psycho-stimulants like cocaine and amphetamines up-regulates Gnb1
expression, which indicates that Gnb1 is involved in drug sensitization (Kitanaka et al. 2002).
Interestingly, pre-treatment with fluoxetine attenuates methamphetamine-induced locomotor
sensitization (Takamatsu et al. 2006), suggesting potential involvement of Gnb1 in fluoxetine response.
Our results show that more anxious mice exhibit elevated levels of GNB1 protein. A recent study by

142
Benekareddy et al. found that early stress induced by maternal separation up-regulates Gnb1
expression, implicating the involvement of Gnb1 in mediating risk to anxiety and mood disorder
(Benekareddy et al. 2010). Taken together, the association of GLO1 and GNB1 with baseline
behavioral despair and anxiety-like behavior offers a novel possibility in which these proteins can be
targeted to modulate both disorders and improve treatment outcomes in patients who suffer with
comorbid anxious depressive symptoms.
To date, analysis of biochemical alterations has only been performed for a handful of markers
in a few inbred strains despite inter-strain differences in response to antidepressants (Crowley et al.
2006; Miller et al. 2008; Ripoll et al. 2003; Vaugeois et al. 1997). In this study, we show that response
to fluoxetine treatment mirrors responses seen in human fluoxetine treatment with a subset of strains
exhibiting an “expected response” of reduced immobility as a phenotype of depressive-like behavior.
Additionally, a few inbred strains exhibited no significant response while the remaining strains
responded with increased immobility. Similar to previous reports, we observed a strong effect of strain
and SSRI treatment on TST responses (Crowley et al. 2006; Ripoll et al. 2003; Trullas et al. 1989).
Although the TST immobility scores we measured after chronic fluoxetine treatment were slightly
different from what others have reported, our findings are in agreement with a previous study that
examined TST responses in multiple inbred strains after fluoxetine treatment (Lucki et al. 2001).
Following acute administration of fluoxetine, Lucki and colleagues observed reduced immobility
responses for BALB/cJ and DBA/2J but not for C57BL/6J, A/J, and C3H/HeJ (Lucki et al. 2001). With
the exception of the data for C57BL/6J, these results are consistent with our findings.
Little correlation was observed between change in immobility scores (treatment response) and
serum fluoxetine and norfluoxetine levels, indicating that, at least in the mouse, pharmacokinetics does

143
not significantly modulate behavior and other factors like pharmacodynamics and pharmacogenetics
may contribute to differential responses to fluoxetine treatment. Of note, negative and positive
responses to fluoxetine can be distinguished based on neurobiochemical variability. Baseline biological
differences discriminate negative responders, while biochemical alterations following fluoxetine
treatment delineate positive responders. This result suggests that positive response to fluoxetine is
mostly due to treatment-induced biochemical alterations, and negative response to fluoxetine is mainly
attributed to baseline differences between mouse strains. Therefore, we propose that patients who fail
to respond or remit from antidepressant therapy may have baseline biological abnormalities
predisposing them to poor therapeutic outcomes.
Results from both DWD and PLS analyses suggest that levels of S100β, GSK3β, HDAC5, and
GFAP influence differential TST responses following SSRI treatment (Figure 2). Chronic fluoxetine
treatment results in higher levels of S100β, which triggers expression of serotonin transporters (SERT)
and activates de novo serotonin synthesis (Baudry et al. 2010). Similarly, increased levels of GSK3β
have been observed following chronic fluoxetine administration in vivo (Fatemi et al. 2009; Li et al.
2004). Inhibition of GSK3β blocked fluoxetine-mediated down-regulation of SERT through over-
expression of miR 16 (Baudry et al. 2010), thus linking serotonin regulation with GSK3β
phosphorylation (Li et al. 2004). Tsankanova et al found that treatment with tricyclic antidepressants
results in lower mRNA levels of Hdac5 and that overexpression of Hdac5 in the hippocampus blocks
the antidepressant effects of imipramine in the chronic social defeat stress paradigm (Tsankova et al.
2006). Consistent with previous studies (Baudry et al. 2010), higher levels of S100β following
fluoxetine treatment were observed in positive responders. Interestingly, both negative and positive
responders displayed higher levels of GSK3β and HDAC5. GSK3β phosphorylates various molecules
typically leading to substrate inhibition, while chromatin remodeling by HDAC5 can prevent
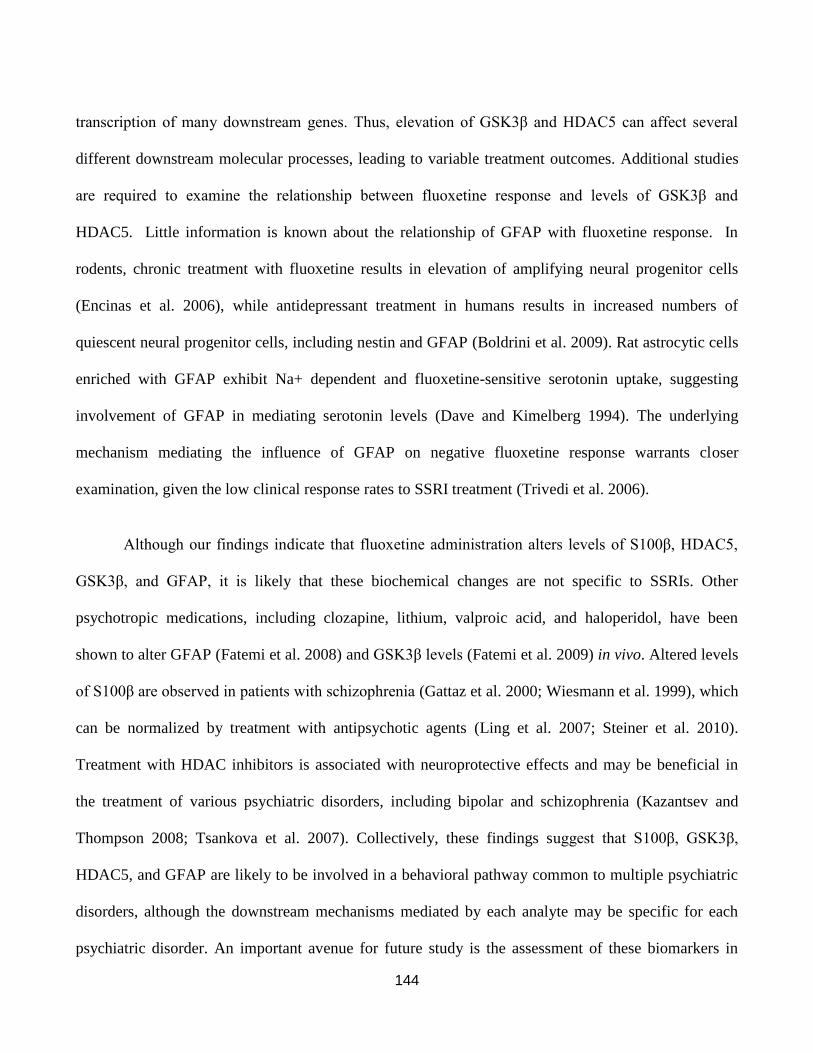
144
transcription of many downstream genes. Thus, elevation of GSK3β and HDAC5 can affect several
different downstream molecular processes, leading to variable treatment outcomes. Additional studies
are required to examine the relationship between fluoxetine response and levels of GSK3β and
HDAC5. Little information is known about the relationship of GFAP with fluoxetine response. In
rodents, chronic treatment with fluoxetine results in elevation of amplifying neural progenitor cells
(Encinas et al. 2006), while antidepressant treatment in humans results in increased numbers of
quiescent neural progenitor cells, including nestin and GFAP (Boldrini et al. 2009). Rat astrocytic cells
enriched with GFAP exhibit Na+ dependent and fluoxetine-sensitive serotonin uptake, suggesting
involvement of GFAP in mediating serotonin levels (Dave and Kimelberg 1994). The underlying
mechanism mediating the influence of GFAP on negative fluoxetine response warrants closer
examination, given the low clinical response rates to SSRI treatment (Trivedi et al. 2006).
Although our findings indicate that fluoxetine administration alters levels of S100β, HDAC5,
GSK3β, and GFAP, it is likely that these biochemical changes are not specific to SSRIs. Other
psychotropic medications, including clozapine, lithium, valproic acid, and haloperidol, have been
shown to alter GFAP (Fatemi et al. 2008) and GSK3β levels (Fatemi et al. 2009) in vivo. Altered levels
of S100β are observed in patients with schizophrenia (Gattaz et al. 2000; Wiesmann et al. 1999), which
can be normalized by treatment with antipsychotic agents (Ling et al. 2007; Steiner et al. 2010).
Treatment with HDAC inhibitors is associated with neuroprotective effects and may be beneficial in
the treatment of various psychiatric disorders, including bipolar and schizophrenia (Kazantsev and
Thompson 2008; Tsankova et al. 2007). Collectively, these findings suggest that S100β, GSK3β,
HDAC5, and GFAP are likely to be involved in a behavioral pathway common to multiple psychiatric
disorders, although the downstream mechanisms mediated by each analyte may be specific for each
psychiatric disorder. An important avenue for future study is the assessment of these biomarkers in

145
easily accessible samples like plasma or serum, thus facilitating translation of pre-clinical findings to
human studies. Current work in the lab aims to evaluate the relationship between behavioral responses
and serum levels of neurobiochemical markers across multiple inbred strains. Additionally, sex
differences in the metabolism of fluoxetine (Hodes et al. 2010) necessitate further investigation of these
biomarkers in females.
Overall, we observed minimal difference (203 probe sets with variable expression patterns) in
gene expression profiles between vehicle and fluoxetine-treated mice. This result is consistent with
what others have found when performing global transcriptome analyses between control and
antidepressant treatment groups (Bohm et al. 2006; Lee et al. 2010; Miller et al. 2008; Takahashi et al.
2006). Although other groups have found more genes that were up- or down-regulated following
fluoxetine treatment, the filtering criteria we used to preprocess our microarray data are generally more
stringent in comparison. We only analyzed genes with a minimum 3-fold difference between strains
and had statistically significant SNR values. In addition, other factors including fluoxetine dosing
regimen, microarray methodology, and time of tissue collection can influence gene expression results.
When we compared gene expression profiles between negative and positive responders, we found that
we can accurately assign samples as either negative or positive responders (absolute error rate 11.1%)
based on the expression patterns of Copg2S2, Prcp, Gpr115, Gxylt2, Plb1, Txndc9, Mum1/1, and
Gm1642, making these genes potential predictors of SSRI response. Although none of these genes have
been directly linked to antidepressant response or major depressive disorder, several are involved in
molecular processes that may be critical in mediating behavior or neuronal function, such as
neuropeptide signaling and lysosomal serine carboxypeptidase activity. For six of the genetic markers
of fluoxetine response, there are commercially available ELISA kits and antibodies that can be used to
evaluate the relationship between protein levels and SSRI response. Additionally, we identified

146
baseline genetic markers that affect inter-strain despair responses to fluoxetine treatment, suggesting its
use as a potential prognostic treatment biomarker. Interestingly, one candidate gene is poly (A) binding
protein, cytoplasmic 1 (Pabpc1), a gene that was significantly associated with SSRI response in a
genome-wide association study, which evaluated over 1,800 patients from the STAR*D trial (Shyn et
al. 2011). Pabpc1 encodes for a poly (A) binding protein that binds to the poly (A) tail of mRNA,
facilitating ribosome recruitment and translation initiation. Given that the association between Pabpc1
and antidepressant response was observed in both pre-clinical and human studies, the mechanism
underlying this association warrants further investigation.
To identify genetic markers for depressive disorder, we focused on genomic regions that are
associated with both behavioral and neurobiochemical phenotypes. We identified a behavioral despair
QTL on Chr 9 that correlated with inter-strain neurobiochemical variability. A QTL for depressive-like
behavior has not been reported previously at this locus, which contains only two genes - Cadm1 and
2900052N01Rik. Cadm1 encodes for neural cell adhesion molecules that mediate cell-to-cell
communication. Further, Cadm1 is involved in synaptic function and neuronal differentiation (Watabe
et al. 2003) and has been linked with anxiety-like and social behavior in mice (Takayanagi et al. 2010;
Zhiling et al. 2008). A recent study by Takayanagi et al showed that mice lacking Cadm1 displayed
higher anxiety-like phenotype and impairment in motor coordination and social behavior compared to
wild-type mice (Takayanagi et al. 2010). However, no significant difference in depressive-like
behavior as measured by the TST was observed between groups (Takayanagi et al. 2010). Other
behavioral paradigms like chronic social defeat stress and reduced sucrose preference, which assess
other features of depressive behavior (e.g. anhedonia) (Nestler and Hyman 2010) can be used to further
evaluate the role of Cadm1 in depression. Since CADM1 act as synaptic adhesive molecule, functional
disruption of Cadm1 may lead to impaired neural plasticity and neurogenesis, both of which have been
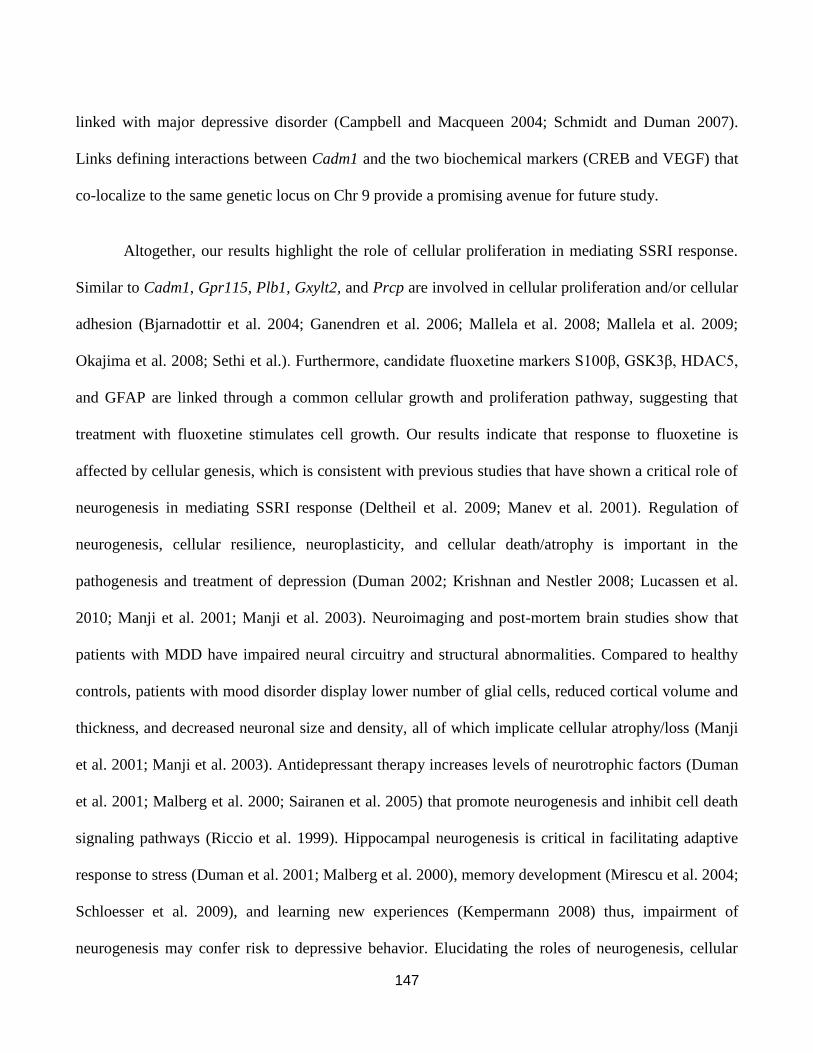
147
linked with major depressive disorder (Campbell and Macqueen 2004; Schmidt and Duman 2007).
Links defining interactions between Cadm1 and the two biochemical markers (CREB and VEGF) that
co-localize to the same genetic locus on Chr 9 provide a promising avenue for future study.
Altogether, our results highlight the role of cellular proliferation in mediating SSRI response.
Similar to Cadm1, Gpr115, Plb1, Gxylt2, and Prcp are involved in cellular proliferation and/or cellular
adhesion (Bjarnadottir et al. 2004; Ganendren et al. 2006; Mallela et al. 2008; Mallela et al. 2009;
Okajima et al. 2008; Sethi et al.). Furthermore, candidate fluoxetine markers S100β, GSK3β, HDAC5,
and GFAP are linked through a common cellular growth and proliferation pathway, suggesting that
treatment with fluoxetine stimulates cell growth. Our results indicate that response to fluoxetine is
affected by cellular genesis, which is consistent with previous studies that have shown a critical role of
neurogenesis in mediating SSRI response (Deltheil et al. 2009; Manev et al. 2001). Regulation of
neurogenesis, cellular resilience, neuroplasticity, and cellular death/atrophy is important in the
pathogenesis and treatment of depression (Duman 2002; Krishnan and Nestler 2008; Lucassen et al.
2010; Manji et al. 2001; Manji et al. 2003). Neuroimaging and post-mortem brain studies show that
patients with MDD have impaired neural circuitry and structural abnormalities. Compared to healthy
controls, patients with mood disorder display lower number of glial cells, reduced cortical volume and
thickness, and decreased neuronal size and density, all of which implicate cellular atrophy/loss (Manji
et al. 2001; Manji et al. 2003). Antidepressant therapy increases levels of neurotrophic factors (Duman
et al. 2001; Malberg et al. 2000; Sairanen et al. 2005) that promote neurogenesis and inhibit cell death
signaling pathways (Riccio et al. 1999). Hippocampal neurogenesis is critical in facilitating adaptive
response to stress (Duman et al. 2001; Malberg et al. 2000), memory development (Mirescu et al. 2004;
Schloesser et al. 2009), and learning new experiences (Kempermann 2008) thus, impairment of
neurogenesis may confer risk to depressive behavior. Elucidating the roles of neurogenesis, cellular

148
resilience, neural plasticity, and cell death in the development of depressive behavior requires a
systems level exploration of these processes. Whether interplay between cellular proliferative and
survival processes facilitates synaptic remodeling and leads to altered mood remains to be seen.
In the absence of biological markers, therapeutic outcomes are defined based on reduction of
baseline symptoms, which can lead to inconsistencies and irreproducibility. Genetic and
neurobiochemical markers can provide an objective means to measure prognosis and treatment
response. We identified genetic and biochemical markers of fluoxetine response that are involved in
cellular genesis, highlighting the role of neurogenesis and neuroplasticity in major depressive disorder.
Since neurogenesis is not specific to antidepressant treatment, it is critical for future studies to identify
how psychotropic medications differentially affect neurogenesis and which downstream
neurobiological pathways are affected. Such studies may illuminate differences between closely related
psychiatric disorders including depression and anxiety.

149
5. Tables
Table 4.1 List of neurobiochemical analytes simultaneously measured across multiple mouse
inbred strains and their known functions
Biomarker Name Function GO category
ACTH Adrenocorticotropin releasing
hormone Neuroimmune
(GO:0005179),
(GO:0007218)
APOD Apolipoprotein D Neuroimmune
(GO:0006629),
(GO:0005215)
BAG1 BCL2-associated athanogene 1 Apoptosis
(GO:0006916),
(GO:0006950)
BDNF Brain-derived neurotrophic factor Neurogenesis
(GO:0006916)
(GO:0048167)
c-fos FBJ osteosarcoma oncogene Transcription
(GO:0007399),
(GO:0045941)
CREB cAMP response element-binding Signal Transduction
(GO:0007165),
(GO:0007202)
PPP1R1B Protein phosphatase 1 subunit 1B Modulation of phosphatase1
(GO:0007165) ,
(GO:0004864)
DAT Dopamine Transporter Regulation of dopamine levels
(GO:0005329),
(GO:0007268)
FKBP51 FK506-Binding Protein 51 Signal Transduction
(GO:0005528),
(GO:0031072)
GAD67 Glutamic Acid Decarboxylase-67
Decarboxylation of glutamate to
GABA
(GO:0004351),
(GO:0006915)
Galanin Galanin Neuronal modulation
GO:0005184),
(GO:0006950)
GFAP Glial fibrillary acidic protein Maintenance of astrocytes
(GO:0005200),
(GO:0005882)
Ghrelin Ghrelin
Neurotrophy and appetite
regulation
(GO:0006916),
(GO:0008343)
GLO1 Glyoxylase1 Neuroprotection
(GO:0006916),
(GO:0006749)
GNB1 Guanine nucleotide-binding protein
subunit beta-1 Signal Transduction
(GO:0006112),
(GO:0007200)
GSK3β Glycogen synthase kinase 3 beta Phosphorylation
(GO:0035255) ,
(GO:0006916)
GSR Glutathione Reductase Neuroprotection
(GO:0006749),
(GO:0016491)
HDAC5 Histone deacetylase 5 Transcription
(GO:0004407),
(GO:0000122)
IL-6 Interleukin6 Neuroimmune
(GO:0001781),
(GO:0006954)
KCNJ9 Potassium inwardly-rectifying
channel, subfamily J, member 9 Regulation of K+ levels
(GO:0015467),
(GO:0006813)
MCH Melanin Concentrating Hormone Sleep and circadian rhythm
(GO:0007218),
(GO:0046005)
NET Norepinephrine Transporter Regulation of norepinephrine (GO:0006836),
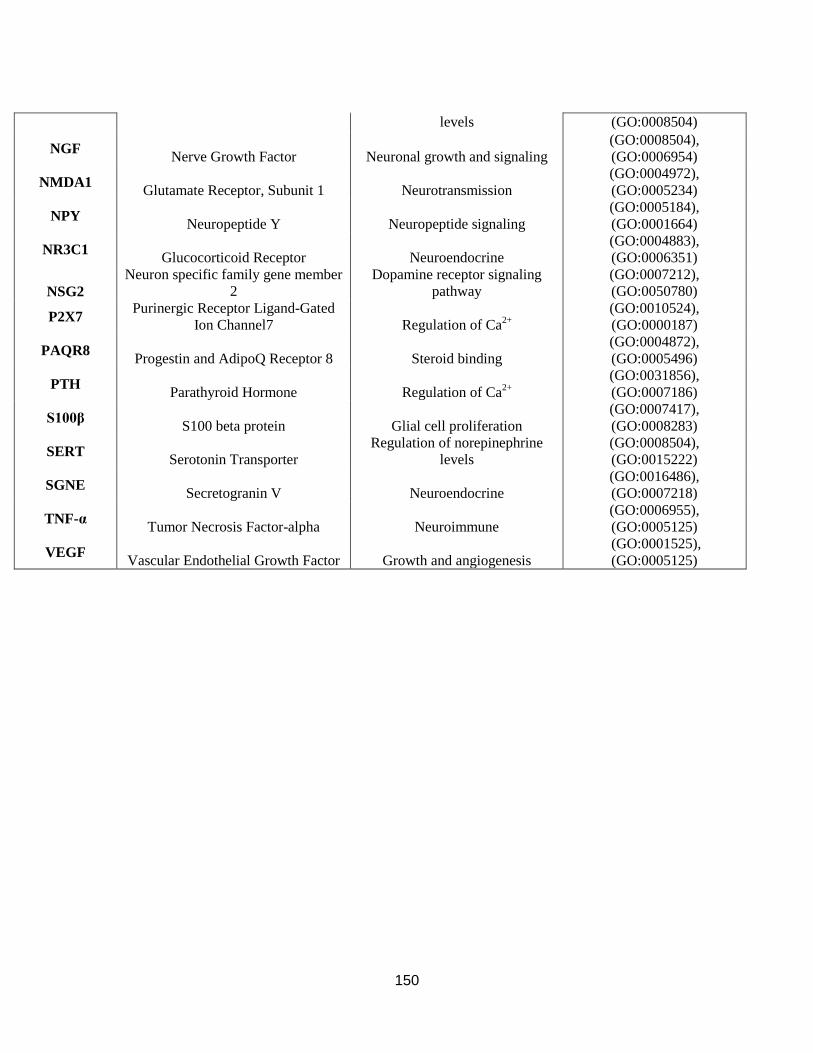
150
levels (GO:0008504)
NGF Nerve Growth Factor Neuronal growth and signaling
(GO:0008504),
(GO:0006954)
NMDA1 Glutamate Receptor, Subunit 1 Neurotransmission
(GO:0004972),
(GO:0005234)
NPY Neuropeptide Y Neuropeptide signaling
(GO:0005184),
(GO:0001664)
NR3C1 Glucocorticoid Receptor Neuroendocrine
(GO:0004883),
(GO:0006351)
NSG2
Neuron specific family gene member
2
Dopamine receptor signaling
pathway
(GO:0007212),
(GO:0050780)
P2X7 Purinergic Receptor Ligand-Gated
Ion Channel7 Regulation of Ca2+
(GO:0010524),
(GO:0000187)
PAQR8 Progestin and AdipoQ Receptor 8 Steroid binding
(GO:0004872),
(GO:0005496)
PTH Parathyroid Hormone Regulation of Ca
2+
(GO:0031856),
(GO:0007186)
S100β S100 beta protein Glial cell proliferation
(GO:0007417),
(GO:0008283)
SERT Serotonin Transporter
Regulation of norepinephrine
levels
(GO:0008504),
(GO:0015222)
SGNE Secretogranin V Neuroendocrine
(GO:0016486),
(GO:0007218)
TNF-α Tumor Necrosis Factor-alpha Neuroimmune
(GO:0006955),
(GO:0005125)
VEGF Vascular Endothelial Growth Factor Growth and angiogenesis
(GO:0001525),
(GO:0005125)
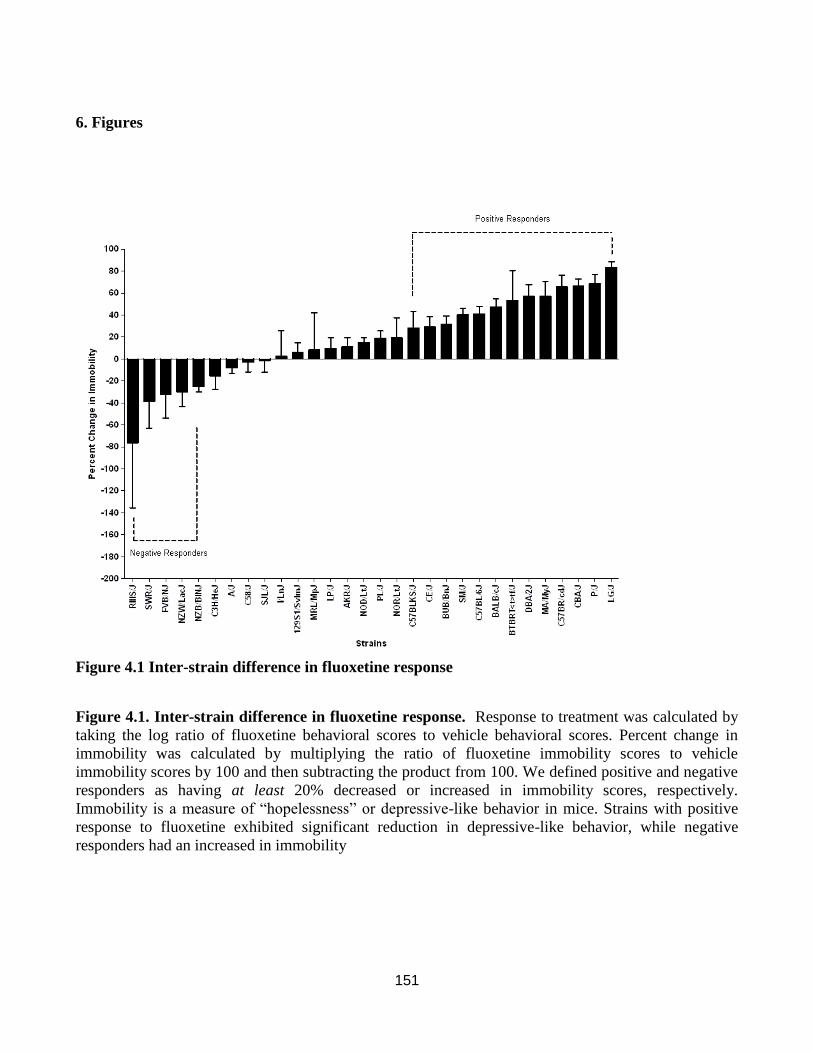
151
6. Figures
Figure 4.1 Inter-strain difference in fluoxetine response
Figure 4.1. Inter-strain difference in fluoxetine response. Response to treatment was calculated by
taking the log ratio of fluoxetine behavioral scores to vehicle behavioral scores. Percent change in
immobility was calculated by multiplying the ratio of fluoxetine immobility scores to vehicle
immobility scores by 100 and then subtracting the product from 100. We defined positive and negative
responders as having at least 20% decreased or increased in immobility scores, respectively.
Immobility is a measure of “hopelessness” or depressive-like behavior in mice. Strains with positive
response to fluoxetine exhibited significant reduction in depressive-like behavior, while negative
responders had an increased in immobility

152
Figure 4.2 Neurobiochemical markers that covary with fluoxetine response
4.2
2

153
Figure 4.3 Neurobiochemical analytes that contribute most to discriminating positive and
negative responders
Figure 4.2. Neurobiochemical markers that covary with fluoxetine response. PLS analysis show
levels of GNB1, GLO1, S100β, GAD67, GFAP, and galanin covary most with response to open field
and tail suspension tests (white bars). Levels of GFAP, S100β, GLO1, HDAC5, GAD67, P2X7, and
GSK3β covary most with depressive-like response following chronic fluoxetine treatment (black bars).
4.3. Neurobiochemical analytes that contribute most to discriminating positive and negative
responders. DWD analysis shows that S100β, GSK3β, HDAC5, and GNB1 discriminate positive
responses (black bars) or negative response (white bars). The opposing direction of the S100β and
GNB1 vectors indicates that both markers can discriminate negative and positive response groups from
each other. Neurobiochemical differences induced by chronic fluoxetine treatment discriminate
positive responders while baseline neurobiological differences discriminate negative responders.
Overall neurobiochemical difference is observed when we defined positive response as 20% (p<0.006),
30% (p<0.014) or 40% (p<0.026) reduction in immobility or when we defined negative response as
20% (p<0.006), 30% (p<0.036) or 40% (p<0.016) increased in immobility. Data are shown when
response is defined as 20% decreased or increased in immobility scores
4.3
2

154
Figure 4.4 Hierarchical clustering of genes discriminating treatment from control
Figure 4.5 Hierarchical clustering of genes discriminating positive and negative response to
treatment
Figure 4.4. Hierarchical clustering of genes discriminating treatment from control. Gene
expression patterns of the twelve most informative genes on each treatment group. 4.5. Hierarchical
4.4
4.5

155
clustering of genes discriminating positive and negative response to treatment. Gene expression
profile of the eight most informative genes on each response group. Only strains deemed to have a
response to treatment are shown. In both figures, color denotes direction of gene expression changes
(red = up-regulated, blue = down-regulated). Intensity illustrates the magnitude of change in gene
expression

156
Figure 4.6 Genome-wide association plot for depressive-like behavior
Figure 4.6. Genome-wide association plot for depressive-like behavior. Genomic region on Chr. 9
significantly correlates with depressive-like behavior (-logP = 6.17) and baseline levels of VEGF (-log
= 5.56) and CREB (-logP = 4.46). The figure shows baseline behavioral despair QTL. To the right, are
the putative genes underneath behavioral locus on Chr 9. The y-axis denotes the strength of association
between genotype and phenotype (-logP) and the x-axis illustrates the cumulative SNP position on the
genome
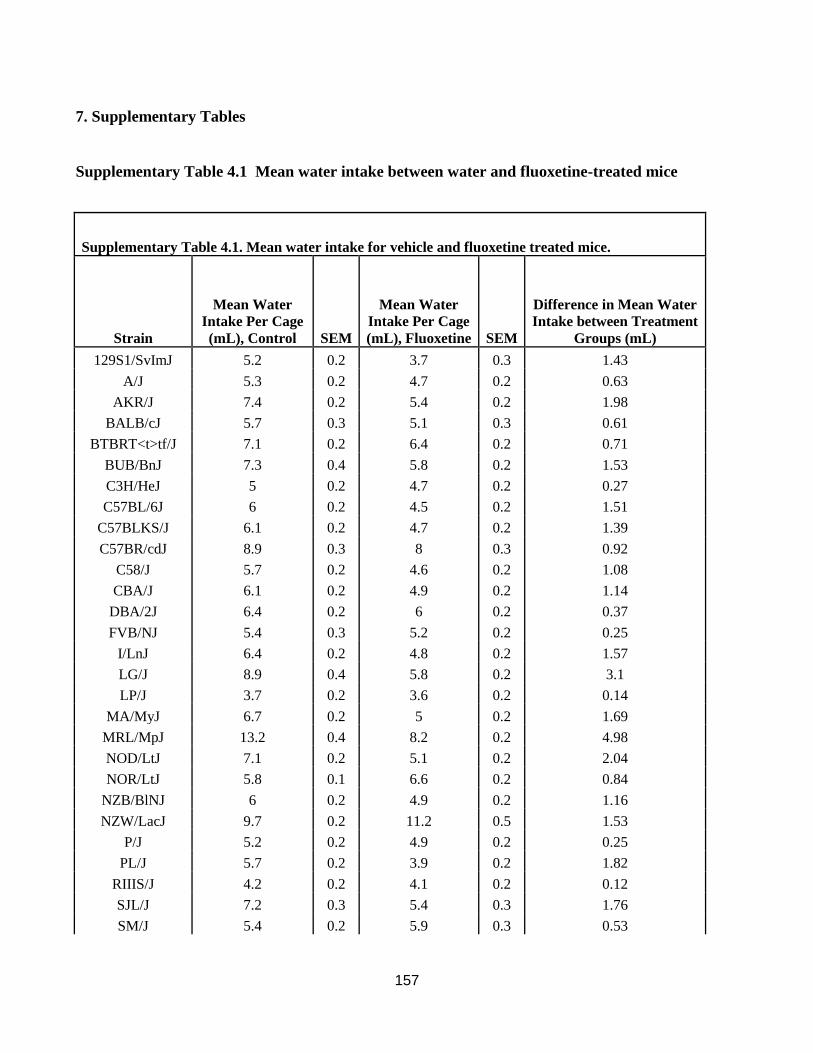
157
7. Supplementary Tables
Supplementary Table 4.1 Mean water intake between water and fluoxetine-treated mice
Supplementary Table 4.1. Mean water intake for vehicle and fluoxetine treated mice.
Strain
Mean Water
Intake Per Cage
(mL), Control SEM
Mean Water
Intake Per Cage
(mL), Fluoxetine SEM
Difference in Mean Water
Intake between Treatment
Groups (mL)
129S1/SvImJ 5.2 0.2 3.7 0.3 1.43
A/J 5.3 0.2 4.7 0.2 0.63
AKR/J 7.4 0.2 5.4 0.2 1.98
BALB/cJ 5.7 0.3 5.1 0.3 0.61
BTBRT<t>tf/J 7.1 0.2 6.4 0.2 0.71
BUB/BnJ 7.3 0.4 5.8 0.2 1.53
C3H/HeJ 5 0.2 4.7 0.2 0.27
C57BL/6J 6 0.2 4.5 0.2 1.51
C57BLKS/J 6.1 0.2 4.7 0.2 1.39
C57BR/cdJ 8.9 0.3 8 0.3 0.92
C58/J 5.7 0.2 4.6 0.2 1.08
CBA/J 6.1 0.2 4.9 0.2 1.14
DBA/2J 6.4 0.2 6 0.2 0.37
FVB/NJ 5.4 0.3 5.2 0.2 0.25
I/LnJ 6.4 0.2 4.8 0.2 1.57
LG/J 8.9 0.4 5.8 0.2 3.1
LP/J 3.7 0.2 3.6 0.2 0.14
MA/MyJ 6.7 0.2 5 0.2 1.69
MRL/MpJ 13.2 0.4 8.2 0.2 4.98
NOD/LtJ 7.1 0.2 5.1 0.2 2.04
NOR/LtJ 5.8 0.1 6.6 0.2 0.84
NZB/BlNJ 6 0.2 4.9 0.2 1.16
NZW/LacJ 9.7 0.2 11.2 0.5 1.53
P/J 5.2 0.2 4.9 0.2 0.25
PL/J 5.7 0.2 3.9 0.2 1.82
RIIIS/J 4.2 0.2 4.1 0.2 0.12
SJL/J 7.2 0.3 5.4 0.3 1.76
SM/J 5.4 0.2 5.9 0.3 0.53

158
SWR/J 6.9 0.3 5 0.1 1.92
SEM = standard error of the mean

159
Supplementary Table 4.2 Behavioral responses in the open field and tail suspension tests
Supplementary Table 4.2. Behavioral responses in the open field and tail suspension tests between control and
fluoxetine treatment groups
Strain
Total number
of animals
tested per
strain
Number of
animals excluded
from the TST
analysis
Mean TST
Immobility
Scores (secs),
Control SEM
Mean TST
Immobility
Scores (secs),
Fluoxetine SEM
129S1/SvImJ 28 2 122.5 11.87 115.32 10.78
A/J 30 3 106.87 11.66 115.44 5.35
AKR/J 18 2 192.57 10.27 171.21 15.63
BALB/cJ 39 4 107.22 10.64 56.57 7.87
BTBRT<t>tf/J 21 4 15.71 8.83 7.34 4.27
BUB/BnJ 18 1 142.32 10.15 97.28 10.46
C3H/HeJ 30 2 97.34 8.79 112.25 12.32
C57BL/6J 21 5 175.7 18.64 103.5 11.7
C57BLKS/J 24 3 101.31 13.59 72.65 14.84
C57BR/cdJ 27 5 97.51 19.6 33.28 10.39
C58/J 18 0 80.92 13.1 83.22 7.18
CBA/J 30 2 134.98 8.78 44.93 8.53
CE/J 24 3 108.83 16.46 76.9 9.93
DBA/2J 36 9 44.35 9.99 19.06 4.75
FVB/NJ 18 2 53.29 13.63 70.42 11.52
I/LnJ 24 8 79.2 28.57 77.19 18.43
LG/J 21 3 27.25 13.39 4.5 1.42
LP/J 28 9 196.7 13.47 177.73 19.51
MA/MyJ 18 0 79.07 18.01 33.92 10.53
MRL/MpJ 21 4 16.02 5.15 14.65 5.39
NOD/LtJ 24 3 165.4 8.65 141.18 7.44
NOR/LtJ 24 7 104.95 9.85 84.58 18.89
NZB/BlNJ 24 6 161.27 31.01 201.34 8.47
NZW/LacJ 21 4 124.69 19.72 161.92 17.14
P/J 23 3 130.34 17.48 40.71 10.13
PL/J 24 2 169.98 11.91 137.62 11.04
RIIIS/J 21 0 18.58 4.63 32.78 10.98
SJL/J 24 4 143.67 13.13 145.7 15.44
SM/J 18 4 229.53 6.38 137.22 13.29
SWR/J 24 0 50.3 9.91 69.65 12.38
TST = tail suspension test; OF = open field; SEM = standard error of the mean

160
Supplementary Table 4.2. Behavioral responses in the open field and tail suspension tests between control and
fluoxetine treatment groups
Strain
Mean
OF
Center
Time
(secs),
Control SEM
Mean OF
Center Tme
(secs),
Fluoxetine SEM
Mean Total
Distance
Traveled in
the OF,
Control
(cm) SEM
Mean Total
Distance
Traveled in
the OF,
Fluoxetine
(cm) SEM
129S1/SvImJ 23 17.68 2.33 1.57 450.21 98.51 360.18 87.55
A/J 1.2 1.08 6.6 5.9 257.54 59.18 293.36 76.43
AKR/J 70.89 10.84 71 15.52 1905.12 173.29 1824.08 119.5
BALB/cJ 46.89 23.32 30.82 10.52 968.82 268.46 1018.54 211.55
BTBRT<t>tf/J 56.22 11.15 48.25 9.33 1909.67 192.62 2131.04 237.36
BUB/BnJ 111.88 13.99 147.78 14.61 1606.96 145.31 2392.91 272.73
C3H/HeJ 65 6.84 63.73 5.89 1104.1 60.65 1079.79 42.79
C57BL/6J 77.17 10.82 65.78 9 1128.44 74.57 1174.74 105.63
C57BLKS/J 38.8 6.06 37.25 6.74 775.09 77.77 1004.9 190.83
C57BR/cdJ 193 15.77 156 15.22 2134.34 109.86 2712.47 206.62
C58/J 124.33 15.88 105.56 15.98 1998.07 240 2972.77 583.85
CBA/J 70.47 11.5 56.38 12.35 1051.15 106.42 1506.63 103.85
CE/J 79.22 11.95 89.5 7.62 1546.18 118.34 1518.35 140.48
DBA/2J 33.83 5.84 15.59 3.36 1085.46 84.39 1824.32 255.39
FVB/NJ 136 6.8 112.78 7.29 2209.28 148.26 1869.78 107.35
I/LnJ 60.82 8.54 40.5 12.17 2065.28 124.35 2040.47 284.61
LG/J 85.91 15.99 44.44 21.99 1677.07 97.9 1271.03 63.31
LP/J 56.11 27.35 28.71 8.21 1011 195.36 611.74 90.84
MA/MyJ 131.56 12.53 76.78 14.96 2349.18 182.85 3511.82 395.18
MRL/MpJ 107.91 11.43 85.75 18.27 1471.85 67.62 1395.69 137.08
NOD/LtJ 164.55 18.7 146.64 12.53 2669.31 229.64 2555.08 172.98
NOR/LtJ 145.13 12.13 157.21 14.98 2410.6 180.58 2282.15 94.59
NZB/BlNJ 33.55 6.97 13.55 4.06 1070.27 63.04 942.25 123.13
NZW/LacJ 76.33 7.65 80.56 16.65 1078.48 54.64 1350.67 162.1
P/J 114.67 20.32 59.8 13.12 1807.26 56.44 2445.75 300.53
PL/J 71.33 4.71 57.17 4.46 1840.41 106.79 1770.16 113.83
RIIIS/J 69.22 4.09 79.92 6.57 2050.63 100.38 1824.96 84.83
SJL/J 109.18 37.19 27 17.67 945.1 106.2 853.45 78.73
SM/J 70.63 5.86 38.44 7.68 1999.52 71.84 3180.84 641
SWR/J 91.25 5.4 105.17 11.02 1393.46 83.01 1499.29 67.56
TST = tail suspension test; OF = open field; SEM = standard error of the mean

161
Supplementary Table 4.3 Serum levels of fluoxetine and its metabolite norfluoxetine following
chronic fluoxetine treatment.
Supplementary Table 4.3. Serum Levels of Fluoxetine and its Metabolite Norfluoxetine Following
Chronic Fluoxetine Treatment
Strain Number of Animals (N) Fluoxetine (ng/ml) SEM Norfluoxetine (ng/ml) SEM
129S1/SvImJ 13 1152.92 58.03 1079.77 45.23
A/J 15 937.87 47.72 1222.60 47.96
AKR/J 9 988.11 53.38 1119.22 49.29
BALB/cJ 12 800.17 40.53 930.75 49.93
BTBR T+
tf/J 12 912.08 51.43 1238.50 79.22
BUB/BnJ 9 1396.89 143.39 1391.67 148.09
C3H/HeJ 15 763.07 66.41 949.53 65.12
C57BL/6J 7 1327.57 220.88 1509.00 186.31
C57BLKS/J 12 1243.50 96.14 1195.00 47.55
C57BR/J 10 988.90 151.01 1260.40 153.66
C58/J 9 987.22 116.45 1335.56 105.95
CBA/J 11 1103.91 108.33 1093.27 108.89
CE/J 12 1084.42 73.17 1401.17 74.04
DBA/2J 16 956.50 95.73 1026.69 56.39
FVB/NJ 9 595.19 81.39 798.28 120.00
I/LnJ 8 1606.50 318.33 1438.25 130.94
LG/J 9 1540.00 116.96 1612.22 134.95
LP/J 19 719.63 67.32 783.37 73.67
MA/MyJ 9 1905.56 223.93 1314.33 120.01
MRL/MpJ 9 1066.67 183.54 1047.44 143.05
NOD/LtJ 12 775.50 81.93 912.00 80.58
NOR/LtJ 15 483.33 48.37 746.93 65.22
NZB/B1NJ 12 1311.08 142.63 1156.33 81.24
NZW/LacJ 9 591.44 66.62 762.89 48.00
P/J 11 1885.55 407.27 1267.55 246.70
PL/J 12 757.35 97.23 825.86 111.87
RIIIS/J 12 470.25 36.51 578.58 25.83
SJL/J 11 1274.82 107.88 1124.45 64.77
SM/J 8 1186.95 320.21 1160.23 256.45
SWR/J 12 749.31 110.69 643.79 108.63
SEM = standard error of the mean

162
Supplementary Table 4.4 Mean relative fluorescence intensity (RFI) values for thirty-one
neurobiochemical analytes measured in the cortex of thirty mouse inbred strains
Supplementary Table 4. 4 Mean relative flourescence intensity (RFI) values for thirty-one
neurobiochemical analytes measured in the cortex of thirty mouse inbred strains
Strains ACTH# STD ACTH* STD FUT9
# STD FUT9* STD APOD
# STD APOD* STD
129S1/SvImJ 1.80 0.07 1.62 0.11 0.65 0.02 0.50 0.02 0.60 0.01 0.56 0.01
A/J 1.86 0.07 2.04 0.07 0.59 0.02 0.60 0.02 0.52 0.01 0.59 0.04
AKR/J 1.95 0.11 2.05 0.10 0.68 0.01 0.52 0.02 0.56 0.02 0.52 0.04
C57BL/6J 2.49 0.04 2.17 0.08 0.63 0.03 0.61 0.01 0.56 0.05 0.62 0.01
BALB/cByJ 2.05 0.11 2.18 0.07 0.69 0.02 0.61 0.02 0.54 0.03 0.57 0.02
C57BLKS/J 2.10 0.05 2.22 0.07 0.66 0.02 0.66 0.01 0.54 0.02 0.54 0.02
C57BR/cdJ 2.17 0.07 2.47 0.09 0.66 0.02 0.60 0.02 0.57 0.02 0.61 0.03
BTBRT+tf/J 2.25 0.05 2.12 0.05 0.74 0.02 0.60 0.02 0.52 0.01 0.57 0.01
BUB/BnJ 2.28 0.07 2.21 0.10 0.76 0.03 0.71 0.02 0.59 0.01 0.58 0.02
C3H/HeJ 2.26 0.06 2.40 0.05 0.77 0.03 0.55 0.01 0.60 0.02 0.61 0.03
C58/J 2.05 0.05 2.18 0.07 0.73 0.02 0.69 0.02 0.52 0.01 0.53 0.02
CBA/J 2.41 0.07 2.41 0.09 0.78 0.03 0.57 0.02 0.60 0.02 0.66 0.02
CE/J 2.07 0.04 2.08 0.14 0.70 0.01 0.58 0.02 0.56 0.01 0.63 0.01
DBA/2J 1.73 0.04 2.08 0.08 0.57 0.01 0.54 0.01 0.50 0.01 0.56 0.03
FVB/NJ 2.21 0.10 2.34 0.09 0.71 0.03 0.72 0.04 0.63 0.02 0.71 0.03
I/LnJ 2.01 0.07 2.03 0.12 0.75 0.03 0.61 0.02 0.53 0.03 0.57 0.01
LG/J 2.22 0.04 2.50 0.08 0.77 0.02 0.65 0.02 0.57 0.02 0.65 0.02
LP/J 2.45 0.09 1.39 0.07 0.86 0.02 0.45 0.01 0.60 0.01 0.39 0.01
MA/MyJ 1.76 0.06 2.22 0.06 0.72 0.02 0.67 0.02 0.50 0.02 0.64 0.01
MRL/MpJ 2.12 0.06 2.25 0.07 0.70 0.02 0.56 0.02 0.56 0.01 0.67 0.03
NOD/ShiLtJ 2.30 0.05 2.35 0.08 0.83 0.03 0.70 0.01 0.61 0.02 0.71 0.03
NOR/LtJ 1.70 0.06 1.97 0.07 0.65 0.02 0.66 0.02 0.48 0.02 0.62 0.02
NZB/BINJ 2.49 0.06 2.23 0.12 0.84 0.02 0.59 0.01 0.58 0.02 0.65 0.02
NZW/LacJ 2.87 0.11 1.67 0.08 0.87 0.02 0.53 0.01 0.70 0.02 0.47 0.04
P/J 2.22 0.06 2.37 0.07 0.76 0.02 0.80 0.02 0.57 0.02 0.66 0.01
PL/J 2.09 0.06 2.33 0.09 0.71 0.01 0.58 0.02 0.62 0.02 0.70 0.03
RIIIS/J 2.47 0.08 2.30 0.07 0.71 0.01 0.70 0.02 0.65 0.01 0.64 0.02
SJL/J 2.12 0.06 2.08 0.07 0.72 0.02 0.70 0.02 0.62 0.02 0.68 0.02
SM/J 2.11 0.05 2.11 0.06 0.67 0.01 0.69 0.01 0.62 0.01 0.72 0.04
SWR/J 2.26 0.07 2.59 0.08 0.69 0.01 0.75 0.02 0.62 0.03 0.69 0.03

163
# Denotes RFI values for control mice (water); * Denotes RFI values for fluoxetine-treated mice. STD stands for
standard deviation. ACTH = Adrenocorticotropin releasing hormone; APOD= Apolipoprotein D; BAG1= BCL2-
associated athanogene 1; BDNF= Brain-derived neurotrophic factor; CREB=cAMP response element-binding;
PPP1R1B= Protein phosphatase 1 subunit 1B; DAT= Dopamine transporter; GAD67 = Glutamic acid decarboxylase-67
; GAL=Galanin; GFAP=Glial fibrillary acidic protein; GLO1=Glyoxylase1; GNB1=Guanine nucleotide-binding protein
subunit beta-1; GSK3β=Glycogen synthase kinase 3 beta; GSR=Glutathione reductase; HDAC5= Histone deacetylase
5; KCNJ9=Potassium inwardly-rectifying channel, subfamily J, member 9; MCH=Melanin concentrating hormone;
NET=Norepinephrine transporter; NGF=Nerve growth factor; NMDA1=Glutamate receptor; NPY=Neuropeptide Y;
P2X7= Purinergic receptor ligand-gated ion channel7; PAQR8=Progestin and adipoQ receptor 8; PTH=Parathyroid
hormone; S100β=S100 beta protein; SERT=Serotonin transporter; SGNE=Secretogranin V; TNF-αTumor necrosis
factor-alpha; VEGF=Vascular endothelial growth factor

164
Supplementary Table 4.4 Mean relative flourescence intensity (RFI) values for thirty-one neurobiochemical
analytes measured in the cortex of thirty mouse inbred strains
Strains BAG1# STD BAG1* STD BDNF
# STD BDNF* STD c-fos
# STD c-fos* STD
129S1/SvImJ 0.15 0.01 0.12 0.01 2.08 0.02 1.74 0.06 0.25 0.01 0.28 0.01
A/J 0.17 0.01 0.16 0.01 1.75 0.04 1.65 0.04 0.25 0.01 0.30 0.01
AKR/J 0.17 0.01 0.15 0.01 2.09 0.05 1.73 0.05 0.27 0.01 0.30 0.01
C57BL/6J 0.15 0.01 0.17 0.01 1.74 0.06 2.13 0.06 0.29 0.02 0.31 0.01
BALB/cByJ 0.17 0.01 0.15 0.01 1.80 0.09 1.71 0.08 0.29 0.01 0.35 0.01
C57BLKS/J 0.18 0.01 0.16 0.01 2.08 0.04 2.14 0.06 0.26 0.01 0.28 0.02
C57BR/cdJ 0.16 0.01 0.19 0.01 2.03 0.08 2.07 0.04 0.27 0.01 0.32 0.02
BTBRT+tf/J 0.19 0.01 0.18 0.01 1.94 0.04 2.05 0.08 0.31 0.01 0.33 0.01
BUB/BnJ 0.19 0.01 0.19 0.01 2.15 0.06 1.86 0.05 0.30 0.01 0.31 0.02
C3H/HeJ 0.17 0.01 0.16 0.01 2.02 0.03 1.62 0.06 0.29 0.01 0.32 0.01
C58/J 0.18 0.01 0.17 0.01 1.92 0.04 1.80 0.04 0.29 0.01 0.32 0.02
CBA/J 0.20 0.01 0.18 0.01 2.09 0.03 2.01 0.06 0.32 0.01 0.31 0.01
CE/J 0.15 0.01 0.16 0.01 1.54 0.05 1.71 0.11 0.28 0.01 0.30 0.01
DBA/2J 0.15 0.01 0.17 0.01 1.55 0.07 1.69 0.06 0.27 0.00 0.33 0.01
FVB/NJ 0.18 0.01 0.17 0.01 2.07 0.06 1.91 0.05 0.30 0.01 0.40 0.02
I/LnJ 0.16 0.00 0.16 0.01 1.63 0.05 2.07 0.07 0.28 0.01 0.29 0.01
LG/J 0.18 0.01 0.20 0.01 1.96 0.03 2.14 0.05 0.33 0.01 0.35 0.02
LP/J 0.19 0.01 0.13 0.00 2.11 0.03 1.22 0.06 0.34 0.01 0.23 0.01
MA/MyJ 0.17 0.01 0.18 0.01 1.77 0.05 1.74 0.02 0.24 0.01 0.32 0.01
MRL/MpJ 0.17 0.01 0.20 0.01 1.63 0.03 1.76 0.05 0.31 0.01 0.34 0.01
NOD/ShiLtJ 0.19 0.01 0.19 0.01 1.89 0.06 2.00 0.04 0.30 0.01 0.33 0.02
NOR/LtJ 0.17 0.00 0.17 0.01 1.69 0.08 1.53 0.04 0.25 0.01 0.32 0.01
NZB/BINJ 0.21 0.01 0.19 0.01 1.79 0.04 1.83 0.04 0.36 0.02 0.35 0.01
NZW/LacJ 0.22 0.01 0.14 0.01 2.13 0.06 1.37 0.08 0.40 0.01 0.29 0.01
P/J 0.18 0.01 0.19 0.01 2.13 0.05 1.70 0.02 0.34 0.01 0.32 0.01
PL/J 0.17 0.01 0.21 0.01 1.82 0.03 1.90 0.05 0.33 0.01 0.34 0.02
RIIIS/J 0.19 0.01 0.211 0.013 2.2 0.051 2.041 0.052 0.368 0.017 0.362 0.014
SJL/J 0.174 0.01 0.195 0.011 2.065 0.044 1.887 0.043 0.305 0.011 0.29 0.008
SM/J 0.181 0.01 0.217 0.009 1.939 0.055 2.019 0.034 0.31 0.01 0.311 0.012
SWR/J 0.189 0.01 0.224 0.01 1.931 0.041 2.105 0.069 0.299 0.01 0.351 0.017

165
Supplementary Table 4.4 Mean relative flourescence intensity (RFI) values for thirty-one neurobiochemical
analytes measured in the cortex of thirty mouse inbred strains
Strains CREB# STD CREB* STD PPP1R1B
# STD PPP1R1B* STD GAD67
# STD GAD67* STD
129S1/SvImJ 0.69 0.03 0.62 0.02 1.08 0.03 0.76 0.03 1.3 0.09 1.13 0.06
A/J 0.73 0.03 0.72 0.01 1.02 0.03 0.88 0.03 1.38 0.05 1.4 0.06
AKR/J 0.75 0.07 0.7 0.02 1.17 0.04 0.87 0.03 1.37 0.07 1.21 0.08
C57BL/6J 0.76 0.06 0.77 0.03 1.07 0.09 0.89 0.02 1.27 0.11 1.7 0.05
BALB/cByJ 0.75 0.04 0.71 0.03 1.17 0.04 0.97 0.02 1.56 0.09 1.57 0.06
C57BLKS/J 0.78 0.03 0.69 0.02 0.94 0.05 0.93 0.04 1.66 0.04 1.87 0.08
C57BR/cdJ 0.81 0.02 0.78 0.03 1.23 0.03 1.07 0.05 1.73 0.02 1.72 0.07
BTBRT+tf/J 0.82 0.04 0.75 0.03 1.38 0.04 1.13 0.05 2.09 0.06 1.41 0.06
BUB/BnJ 0.83 0.02 0.77 0.03 1.17 0.04 1.21 0.09 1.97 0.06 1.87 0.1
C3H/HeJ 0.82 0.03 0.76 0.02 1.23 0.05 0.76 0.01 1.85 0.1 1.21 0.04
C58/J 0.76 0.02 0.8 0.04 0.87 0.04 1.12 0.04 1.72 0.05 2.07 0.09
CBA/J 0.88 0.04 0.82 0.03 1.28 0.05 1.25 0.06 2.08 0.08 2.06 0.06
CE/J 0.78 0.04 0.77 0.02 0.95 0.02 0.82 0.03 1.23 0.03 1.58 0.06
DBA/2J 0.71 0.03 0.76 0.02 0.91 0.02 1.03 0.04 1.66 0.05 1.41 0.07
FVB/NJ 0.82 0.04 0.83 0.04 1.17 0.09 1.21 0.08 1.72 0.14 1.58 0.09
I/LnJ 0.79 0.02 0.7 0.03 1.02 0.03 0.91 0.05 1.57 0.03 1.26 0.06
LG/J 0.85 0.03 0.85 0.05 1.22 0.04 0.87 0.05 1.6 0.06 1.5 0.08
LP/J 0.84 0.03 0.47 0.03 1.28 0.07 0.52 0.02 1.88 0.07 0.72 0.05
MA/MyJ 0.7 0.02 0.83 0.04 1.04 0.03 1.17 0.05 1.67 0.06 1.81 0.07
MRL/MpJ 0.82 0.02 0.85 0.03 0.82 0.05 0.8 0.04 1.85 0.07 1.31 0.05
NOD/ShiLtJ 0.83 0.04 0.78 0.02 1.17 0.05 1.16 0.07 1.84 0.08 1.41 0.06
NOR/LtJ 0.65 0.03 0.73 0.02 1.05 0.03 0.98 0.03 1.5 0.04 1.5 0.06
NZB/BINJ 0.89 0.03 0.8 0.03 1.27 0.06 1 0.05 1.18 0.03 1.23 0.05
NZW/LacJ 0.95 0.04 0.53 0.03 1.29 0.08 0.8 0.02 1.4 0.05 1.11 0.04
P/J 0.82 0.02 0.79 0.03 1.05 0.03 1.3 0.05 1.51 0.08 1.64 0.07
PL/J 0.88 0.03 0.73 0.03 1.37 0.06 0.83 0.04 1.81 0.08 1.28 0.05
RIIIS/J 0.96 0.05 0.7 0.03 1.2 0.08 0.92 0.05 1.82 0.08 1.72 0.05
SJL/J 0.81 0.03 0.7 0.03 1.25 0.04 0.86 0.03 1.73 0.05 1.64 0.07
SM/J 0.84 0.03 0.78 0.03 1.05 0.06 0.84 0.04 1.47 0.09 1.99 0.13
SWR/J 0.82 0.02 0.8 0.02 1.32 0.06 1.08 0.06 1.76 0.05 1.75 0.06

166
Supplementary Table 4.4 Mean relative flourescence intensity (RFI) values for thirty-one neurobiochemical
analytes measured in the cortex of thirty mouse inbred strains
Strains Galanin# STD
Galanin
* STD
GFAP# STD
GFA
P* STD
Ghrelin# STD Ghrelin* STD
129S1/SvImJ 1.41 0.03 0.98 0.02 2.25 0.03 1.51 0.03 0.35 0.01 0.24 0.02
A/J 1.40 0.02 1.19 0.02 2.11 0.08 2.41 0.06 0.38 0.01 0.42 0.03
AKR/J 1.51 0.03 0.99 0.03 3.05 0.05 1.51 0.06 0.39 0.02 0.39 0.03
C57BL/6J 1.14 0.08 1.42 0.03 1.83 0.19 2.06 0.03 0.31 0.04 0.38 0.01
BALB/cByJ 1.37 0.04 1.06 0.04 3.81 0.13 3.32 0.30 0.37 0.02 0.35 0.03
C57BLKS/J 1.40 0.02 1.48 0.04 1.97 0.06 1.97 0.05 0.35 0.02 0.23 0.02
C57BR/cdJ 1.30 0.03 1.01 0.02 2.31 0.12 2.22 0.07 0.35 0.01 0.32 0.02
BTBRT+tf/J 1.54 0.05 1.05 0.02 1.92 0.03 2.18 0.14 0.42 0.02 0.32 0.02
BUB/BnJ 1.52 0.04 1.06 0.03 2.69 0.13 2.23 0.14 0.44 0.01 0.34 0.01
C3H/HeJ 1.49 0.06 1.04 0.03 2.13 0.04 2.22 0.10 0.41 0.02 0.30 0.02
C58/J 1.51 0.03 1.13 0.03 2.11 0.08 7.94 0.15 0.40 0.01 0.35 0.02
CBA/J 1.58 0.04 1.21 0.02 2.63 0.08 5.02 0.11 0.45 0.01 0.34 0.02
CE/J 1.51 0.04 1.06 0.03 1.96 0.03 1.77 0.06 0.38 0.02 0.30 0.02
DBA/2J 1.30 0.04 0.96 0.02 1.74 0.08 6.81 0.18 0.37 0.02 0.33 0.01
FVB/NJ 1.43 0.05 1.20 0.03 2.67 0.10 3.07 0.16 0.44 0.03 0.35 0.02
I/LnJ 1.53 0.04 0.78 0.01 1.70 0.06 1.72 0.11 0.41 0.03 0.30 0.02
LG/J 1.37 0.02 1.01 0.05 2.53 0.11 2.86 0.14 0.46 0.02 0.38 0.01
LP/J 1.30 0.03 0.78 0.03 2.15 0.06 1.21 0.07 0.49 0.03 0.15 0.01
MA/MyJ 1.50 0.03 0.89 0.01 2.47 0.11 3.74 0.13 0.39 0.01 0.35 0.01
MRL/MpJ 2.77 0.12 1.03 0.03 2.60 0.03 3.06 0.20 0.46 0.01 0.32 0.01
NOD/ShiLtJ 2.35 0.09 1.05 0.03 2.87 0.04 2.93 0.20 0.47 0.01 0.33 0.01
NOR/LtJ 1.15 0.02 0.95 0.02 2.20 0.15 2.22 0.12 0.40 0.01 0.31 0.01
NZB/BINJ 1.13 0.03 0.96 0.02 3.08 0.17 2.56 0.13 0.50 0.01 0.31 0.01
NZW/LacJ 1.77 0.07 0.93 0.03 3.48 0.09 1.34 0.10 0.53 0.02 0.21 0.01
P/J 1.27 0.06 0.88 0.02 2.56 0.04 6.50 0.17 0.49 0.02 0.38 0.02
PL/J 1.32 0.02 0.98 0.02 2.09 0.05 2.42 0.09 0.49 0.02 0.33 0.01
RIIIS/J 1.41 0.05 1.08 0.02 5.47 0.14 3.13 0.18 0.45 0.01 0.34 0.01
SJL/J 1.34 0.04 1.05 0.02 3.16 0.04 3.04 0.20 0.47 0.01 0.31 0.01
SM/J 1.48 0.05 1.19 0.03 2.08 0.02 3.17 0.09 0.46 0.02 0.37 0.01
SWR/J 1.47 0.02 1.15 0.02 2.87 0.18 3.50 0.36 0.39 0.01 0.38 0.01

167
Supplementary Table 4.4 Mean relative flourescence intensity (RFI) values for thirty-one neurobiochemical
analytes measured in the cortex of thirty mouse inbred strains
Strains KCNJ9# STD KCNJ9* STD GSR
# STD GSR* STD GLO1
# STD GLO1* STD
129S1/SvImJ 0.36 0.01 0.33 0.01 0.85 0.03 0.53 0.04 3.49 0.18 1.77 0.26
A/J 0.36 0.01 0.35 0.01 0.72 0.01 0.66 0.02 6.21 0.16 3.61 0.46
AKR/J 0.35 0.01 0.33 0.01 0.87 0.02 0.62 0.03 5.93 0.20 3.83 0.28
C57BL/6J 0.35 0.02 0.34 0.01 0.59 0.02 0.66 0.02 2.96 0.40 2.21 0.15
BALB/cByJ 0.37 0.01 0.33 0.01 0.76 0.03 0.72 0.02 4.04 0.31 2.99 0.27
C57BLKS/J 0.30 0.01 0.33 0.01 0.65 0.02 0.64 0.03 5.02 0.19 3.57 0.14
C57BR/cdJ 0.33 0.01 0.34 0.01 0.76 0.01 0.61 0.02 3.10 0.10 3.35 0.15
BTBRT+tf/J 0.37 0.01 0.36 0.01 0.83 0.02 0.65 0.02 4.17 0.13 3.22 0.12
BUB/BnJ 0.34 0.01 0.36 0.02 0.87 0.01 0.78 0.04 4.34 0.19 3.67 0.12
C3H/HeJ 0.38 0.01 0.37 0.01 0.87 0.03 0.61 0.02 4.38 0.25 3.71 0.16
C58/J 0.37 0.01 0.37 0.01 0.75 0.02 0.67 0.03 3.78 0.14 3.27 0.06
CBA/J 0.37 0.01 0.38 0.01 0.91 0.03 0.81 0.04 5.70 0.15 4.64 0.18
CE/J 0.34 0.01 0.32 0.01 0.78 0.02 0.67 0.02 4.84 0.12 4.43 0.29
DBA/2J 0.28 0.01 0.31 0.01 0.80 0.02 0.62 0.01 4.04 0.21 4.17 0.15
FVB/NJ 0.34 0.02 0.35 0.02 0.74 0.05 0.71 0.04 4.61 0.21 3.57 0.27
I/LnJ 0.35 0.01 0.35 0.01 0.68 0.01 0.63 0.02 4.11 0.16 3.60 0.31
LG/J 0.36 0.01 0.39 0.01 0.76 0.01 0.77 0.03 4.27 0.18 4.11 0.14
LP/J 0.38 0.01 0.26 0.01 0.93 0.02 0.40 0.02 6.51 0.17 2.09 0.21
MA/MyJ 0.36 0.01 0.32 0.02 0.82 0.03 0.76 0.03 2.88 0.11 3.73 0.10
MRL/MpJ 0.36 0.01 0.33 0.01 0.82 0.03 0.72 0.02 4.91 0.18 5.31 0.14
NOD/ShiLtJ 0.35 0.01 0.36 0.01 0.85 0.02 0.77 0.02 4.34 0.21 4.22 0.16
NOR/LtJ 0.32 0.01 0.32 0.01 0.80 0.03 0.76 0.02 2.66 0.16 3.43 0.14
NZB/BINJ 0.40 0.01 0.33 0.01 0.65 0.02 0.64 0.02 4.98 0.18 4.09 0.10
NZW/LacJ 0.41 0.02 0.27 0.01 0.75 0.01 0.45 0.02 5.37 0.16 2.75 0.22
P/J 0.40 0.02 0.35 0.01 0.93 0.02 0.61 0.02 4.01 0.21 4.66 0.12
PL/J 0.36 0.01 0.36 0.01 0.84 0.02 0.71 0.02 4.35 0.10 4.17 0.10
RIIIS/J 0.37 0.01 0.38 0.02 0.83 0.03 0.80 0.03 4.98 0.18 4.07 0.18
SJL/J 0.36 0.01 0.33 0.01 0.93 0.02 0.84 0.03 3.86 0.19 3.41 0.14
SM/J 0.39 0.01 0.33 0.02 0.79 0.02 0.84 0.05 4.39 0.20 3.63 0.14
SWR/J 0.35 0.01 0.38 0.01 0.78 0.02 0.84 0.04 4.26 0.12 4.72 0.27

168
Supplementary Table 4.4 Mean relative flourescence intensity (RFI) values for thirty-one neurobiochemical
analytes measured in the cortex of thirty mouse inbred strains
Strains GNB1
# STD
GNB1
* STD
GSK3β# STD
GSK3β
* STD HDAC5# STD HDAC5* STD
129S1/SvImJ 7.79 0.78 8.43 0.65 0.87 0.05 0.67 0.04 2.04 0.09 1.63 0.10
A/J 7.04 1.02 8.57 1.04 0.93 0.04 0.46 0.02 2.52 0.05 1.67 0.07
AKR/J 8.02 0.94 8.39 0.61 0.71 0.04 0.67 0.03 2.01 0.08 2.12 0.10
C57BL/6J 7.98 0.19 8.93 0.46 0.72 0.10 0.69 0.02 2.65 0.14 1.86 0.07
BALB/cByJ 5.48 0.55 7.90 0.87 0.74 0.05 0.65 0.05 2.37 0.07 2.16 0.06
C57BLKS/J 6.58 0.66 6.76 0.78 0.72 0.01 1.15 0.04 2.13 0.10 2.52 0.13
C57BR/cdJ 6.35 0.50 6.03 0.22 1.09 0.06 0.88 0.03 2.36 0.06 2.45 0.11
BTBRT+tf/J 9.31 0.30 5.99 0.41 0.83 0.02 1.57 0.05 2.55 0.08 3.30 0.16
BUB/BnJ 9.14 0.66 11.55 0.94 0.77 0.04 1.13 0.02 2.24 0.05 2.53 0.17
C3H/HeJ 7.24 0.38 9.70 0.86 1.01 0.03 0.55 0.03 2.87 0.18 2.13 0.06
C58/J 5.68 0.44 7.71 0.41 0.92 0.03 0.82 0.02 2.57 0.10 2.42 0.11
CBA/J 10.55 0.48 8.31 0.20 0.89 0.01 1.01 0.03 2.78 0.15 2.68 0.12
CE/J 8.51 0.58 7.64 0.62 0.68 0.01 0.51 0.04 2.21 0.06 1.96 0.08
DBA/2J 7.52 0.71 7.09 0.45 0.68 0.03 0.81 0.03 1.98 0.05 2.17 0.07
FVB/NJ 6.89 0.63 8.60 1.06 0.91 0.03 0.70 0.04 2.64 0.20 2.59 0.17
I/LnJ 10.23 1.26 8.07 1.05 0.53 0.03 0.88 0.10 1.86 0.03 2.32 0.18
LG/J 7.45 0.26 8.15 0.19 1.20 0.02 0.93 0.05 2.76 0.10 2.53 0.10
LP/J 10.81 0.61 7.10 0.40 0.78 0.02 0.26 0.02 2.80 0.11 1.31 0.07
MA/MyJ 6.59 0.73 8.47 0.20 0.86 0.03 1.03 0.02 2.13 0.08 2.47 0.12
MRL/MpJ 9.11 0.69 7.20 0.45 0.72 0.02 0.47 0.03 2.12 0.07 1.80 0.07
NOD/ShiLtJ 9.85 0.88 8.91 0.62 1.59 0.04 1.37 0.04 2.98 0.06 3.05 0.16
NOR/LtJ 6.69 0.75 10.40 0.61 0.83 0.06 0.83 0.04 2.02 0.06 2.57 0.09
NZB/BINJ 14.23 1.11 7.96 0.33 1.45 0.05 0.96 0.03 3.51 0.16 2.65 0.11
NZW/LacJ 11.73 0.66 8.25 0.19 0.58 0.02 0.69 0.05 2.61 0.12 2.14 0.10
P/J 9.02 0.26 11.10 0.37 1.01 0.03 1.68 0.05 2.70 0.10 3.94 0.09
PL/J 10.29 0.56 9.01 0.28 1.11 0.02 0.76 0.03 2.88 0.09 2.35 0.10
RIIIS/J 8.49 0.41 10.41 0.66 1.05 0.02 0.57 0.02 2.62 0.13 2.04 0.11
SJL/J 7.01 0.36 9.86 0.66 1.13 0.02 0.60 0.03 2.63 0.11 2.23 0.11
SM/J 8.31 0.34 7.84 0.39 0.81 0.02 0.60 0.02 2.13 0.07 1.86 0.09
SWR/J 9.77 0.72 12.10 0.34 1.61 0.05 1.15 0.05 3.06 0.11 2.87 0.14

169
Supplementary Table 4.4 Mean relative flourescence intensity (RFI) values for thirty-one neurobiochemical
analytes measured in the cortex of thirty mouse inbred strains
Strains MCH# STD MCH* STD NGF
# STD NGF* STD NPY
# STD NPY* STD
129S1/SvImJ 0.002 0.008 0.008 0.006 1.78 0.03 1.66 0.04 0.91 0.02 0.47 0.02
A/J 0.012 0.004 0.029 0.008 1.66 0.03 1.94 0.05 0.69 0.02 0.55 0.02
AKR/J 0.015 0.004 0.026 0.006 1.83 0.05 1.88 0.06 0.94 0.03 0.49 0.03
C57BL/6J -0.004 0.004 0.01 0.005 1.60 0.06 1.62 0.03 0.76 0.05 0.77 0.01
BALB/cByJ 0.009 0.005 0.01 0.004 1.65 0.04 1.82 0.03 0.81 0.03 0.64 0.02
C57BLKS/J 0.014 0.003 0.007 0.005 1.75 0.03 1.83 0.13 0.76 0.02 0.71 0.02
C57BR/cdJ 0.002 0.003 0.009 0.004 1.67 0.03 1.53 0.02 0.97 0.02 0.66 0.03
BTBRT+tf/J -0.003 0.006 -0.005 0.003 1.52 0.05 1.86 0.02 0.87 0.02 0.63 0.02
BUB/BnJ 0.006 0.005 -0.006 0.005 1.69 0.04 1.65 0.02 0.91 0.03 0.65 0.03
C3H/HeJ 0.01 0.003 0.005 0.004 1.72 0.03 1.54 0.02 0.85 0.03 0.64 0.03
C58/J 0.01 0.003 0.004 0.006 1.65 0.03 1.54 0.04 0.73 0.02 0.67 0.02
CBA/J 0.008 0.004 0 0.002 1.55 0.02 1.87 0.02 0.81 0.02 0.72 0.02
CE/J 0.012 0.002 0.008 0.002 1.62 0.02 1.50 0.04 0.70 0.02 0.57 0.02
DBA/2J 0.012 0.003 0.015 0.004 1.44 0.04 1.54 0.03 0.67 0.03 0.66 0.01
FVB/NJ 0.014 0.004 0.008 0.005 1.75 0.02 1.69 0.13 0.77 0.04 0.64 0.04
I/LnJ 0.02 0.004 0.025 0.003 1.54 0.02 1.48 0.04 0.69 0.03 0.56 0.03
LG/J 0.016 0.004 0.021 0.004 1.69 0.04 1.61 0.02 0.69 0.03 0.60 0.02
LP/J 0.029 0.003 0.001 0.004 1.83 0.02 1.52 0.04 0.70 0.03 0.32 0.02
MA/MyJ 0.03 0.003 0.013 0.004 1.64 0.04 1.39 0.01 0.74 0.02 0.71 0.02
MRL/MpJ 0.011 0.003 -0.005 0.004 1.57 0.02 1.56 0.04 0.91 0.03 0.58 0.01
NOD/ShiLtJ 0.022 0.003 0.006 0.002 1.62 0.02 1.75 0.04 0.98 0.02 0.70 0.02
NOR/LtJ 0.011 0.002 0.003 0.003 1.55 0.04 1.44 0.02 0.69 0.03 0.59 0.02
NZB/BINJ 0.003 0.006 0.001 0.003 1.71 0.02 1.62 0.02 0.66 0.02 0.59 0.01
NZW/LacJ 0.015 0.006 -0.008 0.003 1.71 0.03 1.43 0.04 0.80 0.03 0.43 0.02
P/J 0.001 0.004 0.007 0.004 1.73 0.03 1.41 0.02 0.78 0.02 0.57 0.02
PL/J 0.017 0.004 -0.001 0.003 1.56 0.02 1.63 0.02 0.80 0.02 0.59 0.02
RIIIS/J 0.022 0.003 -0.004 0.005 1.73 0.04 1.68 0.02 0.84 0.03 0.64 0.01
SJL/J 0.021 0.003 -0.003 0.003 1.62 0.02 1.57 0.02 0.80 0.03 0.55 0.02
SM/J 0.019 0.004 0.001 0.002 1.67 0.03 1.57 0.03 0.81 0.03 0.72 0.03
SWR/J 0.006 0.002 0.004 0.003 1.64 0.03 1.81 0.02 0.74 0.01 0.65 0.02

170
Supplementary Table 4.4 Mean relative flourescence intensity (RFI) values for thirty-one neurobiochemical
analytes measured in the cortex of thirty mouse inbred strains
Strains NMDA1# STD NMDA1* STD NET
# STD NET* STD P2X7
# STD P2X7* STD
129S1/SvImJ 1.04 0.06 0.73 0.05 0.49 0.02 0.40 0.01 2.76 0.06 2.22 0.11
A/J 0.96 0.04 0.92 0.05 0.40 0.01 0.46 0.01 3.55 0.09 2.67 0.08
AKR/J 1.15 0.05 0.89 0.04 0.46 0.01 0.47 0.02 3.20 0.06 2.81 0.07
C57BL/6J 0.80 0.02 1.09 0.03 0.42 0.03 0.53 0.02 3.43 0.16 2.61 0.05
BALB/cByJ 0.88 0.05 0.98 0.03 0.44 0.02 0.47 0.01 3.73 0.13 2.99 0.07
C57BLKS/J 0.98 0.04 0.99 0.04 0.44 0.01 0.49 0.03 3.21 0.06 2.84 0.10
C57BR/cdJ 0.93 0.02 0.87 0.03 0.46 0.02 0.53 0.02 3.07 0.05 3.28 0.10
BTBRT+tf/J 1.19 0.02 0.89 0.03 0.50 0.01 0.48 0.01 3.93 0.09 3.42 0.08
BUB/BnJ 1.03 0.04 1.04 0.05 0.47 0.01 0.52 0.04 3.49 0.12 2.79 0.12
C3H/HeJ 0.93 0.04 0.60 0.03 0.41 0.02 0.48 0.02 3.62 0.14 3.38 0.08
C58/J 0.84 0.02 0.94 0.04 0.43 0.02 0.48 0.02 3.62 0.13 3.10 0.09
CBA/J 1.08 0.04 1.01 0.04 0.45 0.01 0.52 0.03 3.61 0.11 3.07 0.09
CE/J 0.72 0.02 0.80 0.03 0.39 0.01 0.43 0.01 3.42 0.05 2.98 0.07
DBA/2J 0.81 0.03 0.84 0.04 0.40 0.01 0.45 0.01 3.01 0.07 2.65 0.05
FVB/NJ 0.91 0.06 0.96 0.06 0.42 0.03 0.50 0.04 3.65 0.14 3.32 0.15
I/LnJ 0.87 0.03 0.72 0.06 0.39 0.01 0.37 0.01 3.07 0.08 3.00 0.08
LG/J 0.85 0.02 0.98 0.04 0.44 0.02 0.47 0.02 3.63 0.07 3.74 0.13
LP/J 1.10 0.03 0.45 0.02 0.45 0.02 0.29 0.01 4.12 0.10 2.32 0.08
MA/MyJ 0.86 0.03 0.98 0.06 0.40 0.02 0.49 0.01 3.28 0.08 2.97 0.09
MRL/MpJ 1.13 0.03 0.80 0.02 0.51 0.02 0.47 0.02 3.19 0.07 3.15 0.08
NOD/ShiLtJ 1.13 0.06 0.90 0.03 0.53 0.02 0.50 0.02 3.18 0.12 3.31 0.09
NOR/LtJ 0.91 0.03 0.93 0.05 0.38 0.01 0.42 0.02 3.03 0.08 3.05 0.05
NZB/BINJ 0.90 0.04 0.81 0.03 0.49 0.02 0.45 0.02 4.25 0.13 3.26 0.12
NZW/LacJ 1.20 0.05 0.65 0.02 0.54 0.03 0.35 0.01 4.27 0.13 2.35 0.10
P/J 0.94 0.04 1.08 0.03 0.50 0.03 0.44 0.03 4.04 0.14 3.69 0.10
PL/J 1.18 0.05 0.81 0.04 0.48 0.02 0.49 0.02 3.27 0.10 3.53 0.10
RIIIS/J 1.15 0.05 0.91 0.04 0.53 0.03 0.50 0.02 3.54 0.12 3.33 0.13
SJL/J 1.03 0.04 0.97 0.03 0.48 0.03 0.45 0.02 3.45 0.09 3.45 0.10
SM/J 1.04 0.04 1.17 0.05 0.47 0.02 0.52 0.03 3.00 0.08 2.72 0.11
SWR/J 0.99 0.04 0.94 0.02 0.46 0.01 0.50 0.02 2.98 0.07 3.67 0.09

171
Supplementary Table 4.4 Mean relative flourescence intensity (RFI) values for thirty-one neurobiochemical
analytes measured in the cortex of thirty mouse inbred strains
Strains PTH# STD PTH* STD PAQR8
# STD PAQR8* STD S100β
# STD S100β* STD
129S1/SvImJ 0.72 0.07 0.78 0.08 0.48 0.04 0.32 0.03 3.58 0.31 1.85 0.15
A/J 0.62 0.03 0.61 0.03 0.28 0.02 0.47 0.02 2.91 0.14 3.84 0.33
AKR/J 0.80 0.04 0.72 0.06 0.47 0.03 0.39 0.01 4.30 0.22 2.41 0.29
C57BL/6J 0.79 0.09 0.86 0.09 0.48 0.04 0.55 0.04 1.18 0.20 4.47 0.21
BALB/cByJ 0.65 0.03 0.52 0.02 0.36 0.06 0.47 0.02 3.17 0.39 3.35 0.30
C57BLKS/J 0.77 0.02 0.70 0.05 0.45 0.02 0.42 0.02 3.67 0.12 4.08 0.46
C57BR/cdJ 0.84 0.05 0.90 0.05 0.59 0.03 0.58 0.01 5.06 0.22 3.99 0.21
BTBRT+tf/J 0.73 0.01 0.58 0.01 0.50 0.01 0.51 0.02 3.96 0.16 3.97 0.23
BUB/BnJ 0.81 0.01 0.67 0.06 0.50 0.04 0.49 0.02 4.48 0.48 4.65 0.30
C3H/HeJ 0.90 0.03 0.79 0.05 0.46 0.02 0.49 0.03 2.96 0.10 2.28 0.08
C58/J 0.71 0.02 0.55 0.01 0.41 0.03 0.46 0.02 2.70 0.14 3.69 0.23
CBA/J 0.83 0.01 0.68 0.02 0.46 0.02 0.53 0.03 3.45 0.15 4.21 0.41
CE/J 0.82 0.04 0.70 0.06 0.39 0.02 0.40 0.04 2.50 0.18 3.23 0.37
DBA/2J 0.58 0.02 0.50 0.01 0.31 0.03 0.43 0.04 2.09 0.31 3.18 0.35
FVB/NJ 0.78 0.03 0.80 0.05 0.46 0.02 0.47 0.02 3.08 0.16 3.27 0.11
I/LnJ 0.81 0.05 0.65 0.05 0.41 0.04 0.37 0.03 2.47 0.36 1.66 0.27
LG/J 0.66 0.01 0.58 0.01 0.41 0.02 0.51 0.02 2.54 0.16 3.40 0.20
LP/J 0.83 0.01 0.43 0.01 0.47 0.02 0.23 0.01 2.92 0.11 1.03 0.08
MA/MyJ 0.80 0.04 0.64 0.01 0.41 0.02 0.40 0.01 2.60 0.14 4.12 0.28
MRL/MpJ 0.65 0.03 0.50 0.01 0.39 0.02 0.41 0.05 4.47 0.15 2.67 0.24
NOD/ShiLtJ 0.68 0.06 0.70 0.02 0.46 0.03 0.44 0.02 3.75 0.35 2.47 0.09
NOR/LtJ 0.68 0.04 0.64 0.02 0.45 0.02 0.32 0.03 2.03 0.23 1.03 0.33
NZB/BINJ 0.79 0.02 0.51 0.01 0.51 0.03 0.38 0.02 1.96 0.08 2.70 0.13
NZW/LacJ 0.96 0.02 0.50 0.01 0.66 0.04 0.28 0.01 2.49 0.11 1.86 0.22
P/J 0.89 0.02 0.66 0.01 0.60 0.03 0.38 0.01 2.85 0.10 3.00 0.16
PL/J 0.68 0.01 0.53 0.02 0.52 0.03 0.42 0.02 3.58 0.19 3.07 0.13
RIIIS/J 0.79 0.01 0.68 0.03 0.61 0.05 0.46 0.02 4.05 0.23 3.92 0.28
SJL/J 0.77 0.02 0.66 0.02 0.58 0.03 0.41 0.03 3.91 0.32 2.69 0.18
SM/J 0.69 0.02 0.62 0.02 0.55 0.04 0.53 0.03 3.73 0.22 4.66 0.21
SWR/J 0.84 0.03 0.89 0.04 0.45 0.03 0.49 0.03 2.81 0.28 3.44 0.09

172
Supplementary Table 4.4 Mean relative flourescence intensity (RFI) values for thirty-one
neurobiochemical analytes measured in the cortex of thirty mouse inbred strains
Strains SGNE# STD SGNE* STD SERT
# STD SERT* STD
129S1/SvImJ 0.50 0.01 0.35 0.01 1.08 0.02 0.81 0.05
A/J 0.40 0.01 0.40 0.01 0.85 0.02 0.84 0.03
AKR/J 0.57 0.02 0.30 0.01 1.08 0.03 0.57 0.02
C57BL/6J 0.46 0.02 0.51 0.01 0.95 0.08 1.01 0.02
BALB/cByJ 0.47 0.01 0.42 0.01 1.08 0.06 0.93 0.03
C57BLKS/J 0.43 0.01 0.38 0.01 0.96 0.03 0.93 0.02
C57BR/cdJ 0.57 0.01 0.47 0.01 1.17 0.03 1.03 0.02
BTBRT+tf/J 0.49 0.01 0.44 0.01 1.10 0.02 1.06 0.02
BUB/BnJ 0.49 0.01 0.38 0.01 1.12 0.03 0.93 0.03
C3H/HeJ 0.49 0.01 0.38 0.01 1.14 0.03 0.84 0.03
C58/J 0.42 0.01 0.46 0.01 0.97 0.02 0.97 0.02
CBA/J 0.48 0.01 0.44 0.01 1.08 0.02 0.97 0.03
CE/J 0.57 0.01 0.38 0.01 0.95 0.02 0.85 0.04
DBA/2J 0.46 0.01 0.43 0.01 0.92 0.06 0.87 0.02
FVB/NJ 0.44 0.02 0.38 0.01 0.97 0.04 0.90 0.02
I/LnJ 0.45 0.01 0.36 0.01 1.02 0.05 0.97 0.03
LG/J 0.48 0.01 0.41 0.01 1.09 0.02 0.87 0.03
LP/J 0.44 0.01 0.26 0.01 1.17 0.02 0.49 0.02
MA/MyJ 0.47 0.01 0.44 0.01 1.00 0.02 1.05 0.02
MRL/MpJ 0.57 0.01 0.41 0.01 1.14 0.03 0.77 0.02
NOD/ShiLtJ 0.50 0.01 0.35 0.01 1.34 0.04 0.88 0.02
NOR/LtJ 0.42 0.01 0.40 0.01 0.92 0.04 0.88 0.02
NZB/BINJ 0.45 0.01 0.44 0.01 1.06 0.03 0.85 0.02
NZW/LacJ 0.40 0.01 0.30 0.01 1.32 0.04 0.62 0.03
P/J 0.46 0.02 0.43 0.01 1.01 0.03 0.91 0.01
PL/J 0.51 0.02 0.40 0.01 1.08 0.03 0.84 0.02
RIIIS/J 0.39 0.01 0.34 0.01 1.16 0.03 0.95 0.02
SJL/J 0.52 0.01 0.37 0.01 1.14 0.03 0.80 0.02
SM/J 0.51 0.01 0.43 0.01 1.07 0.04 0.97 0.02
SWR/J 0.38 0.01 0.34 0.01 1.10 0.04 0.90 0.03

173
Supplementary Table 4.4 Mean relative flourescence intensity (RFI) values for thirty-one
neurobiochemical analytes measured in the cortex of thirty mouse inbred strains
Strains TNF-α
# STD TNF-α* STD VEGF
# STD VEGF* STD
129S1/SvImJ 0.811 0.021 0.393 0.016 0.187 0.010 0.173 0.007
A/J 0.763 0.017 0.531 0.011 0.250 0.008 0.201 0.009
AKR/J 0.821 0.021 0.477 0.015 0.217 0.008 0.183 0.009
C57BL/6J 0.710 0.057 0.555 0.021 0.245 0.010 0.178 0.007
BALB/cByJ 0.729 0.033 0.546 0.018 0.242 0.012 0.220 0.008
C57BLKS/J 0.730 0.016 0.592 0.010 0.202 0.009 0.168 0.010
C57BR/cdJ 0.723 0.018 0.608 0.027 0.202 0.008 0.225 0.014
BTBRT+tf/J 0.815 0.015 0.633 0.012 0.253 0.011 0.228 0.009
BUB/BnJ 0.835 0.030 0.586 0.015 0.221 0.009 0.197 0.012
C3H/HeJ 0.749 0.031 0.609 0.018 0.246 0.015 0.232 0.006
C58/J 0.758 0.023 0.654 0.014 0.249 0.009 0.232 0.010
CBA/J 0.829 0.038 0.610 0.017 0.230 0.008 0.209 0.008
CE/J 0.766 0.019 0.541 0.019 0.285 0.016 0.213 0.006
DBA/2J 0.681 0.035 0.527 0.020 0.232 0.006 0.212 0.007
FVB/NJ 0.718 0.033 0.584 0.029 0.231 0.016 0.209 0.015
I/LnJ 0.754 0.035 0.573 0.024 0.252 0.010 0.227 0.009
LG/J 0.790 0.021 0.687 0.027 0.291 0.011 0.261 0.014
LP/J 0.828 0.021 0.364 0.017 0.261 0.014 0.152 0.003
MA/MyJ 0.750 0.026 0.595 0.018 0.238 0.011 0.254 0.011
MRL/MpJ 0.975 0.014 0.578 0.019 0.276 0.011 0.234 0.008
NOD/ShiLtJ 1.085 0.029 0.597 0.009 0.245 0.009 0.225 0.011
NOR/LtJ 0.716 0.015 0.591 0.011 0.236 0.006 0.240 0.009
NZB/BINJ 0.902 0.021 0.623 0.016 0.332 0.013 0.245 0.015
NZW/LacJ 1.009 0.029 0.439 0.017 0.302 0.014 0.187 0.006
P/J 0.876 0.023 0.633 0.025 0.292 0.012 0.279 0.013
PL/J 0.822 0.016 0.632 0.016 0.289 0.012 0.259 0.013
RIIIS/J 0.877 0.035 0.580 0.018 0.274 0.014 0.206 0.012
SJL/J 0.864 0.019 0.584 0.012 0.273 0.014 0.235 0.016
SM/J 0.803 0.028 0.623 0.018 0.265 0.014 0.219 0.009
SWR/J 0.756 0.022 0.636 0.015 0.236 0.010 0.228 0.010
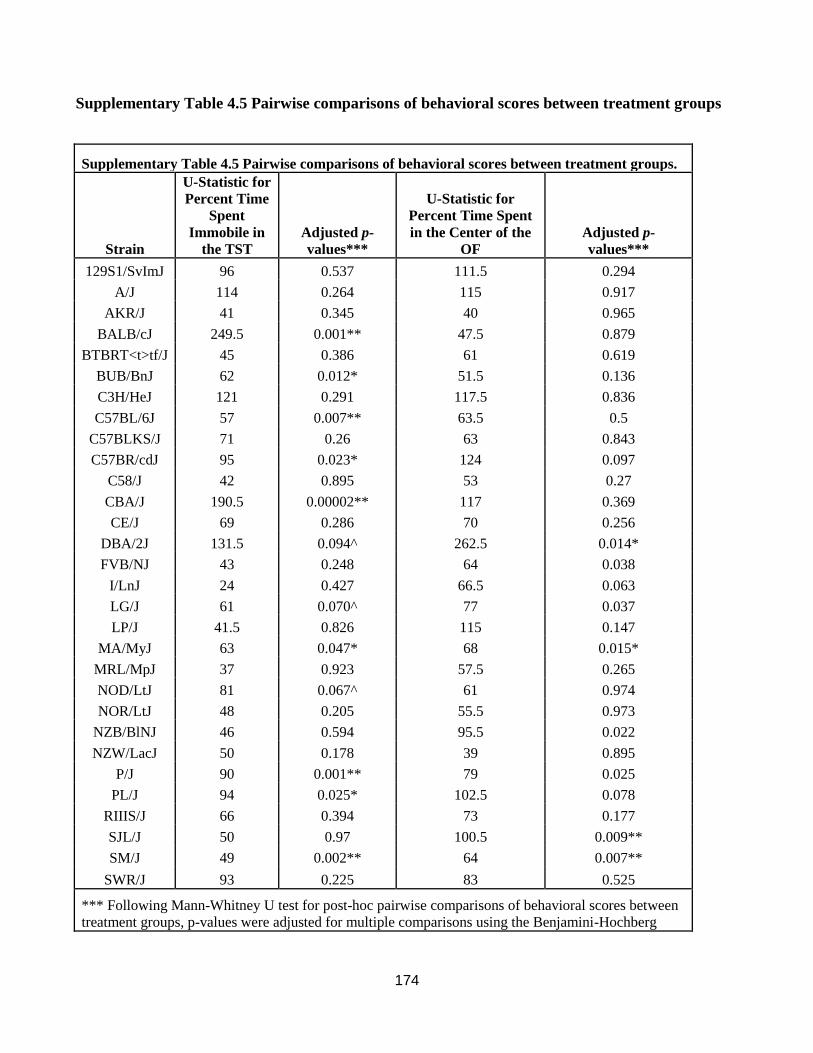
174
Supplementary Table 4.5 Pairwise comparisons of behavioral scores between treatment groups
Supplementary Table 4.5 Pairwise comparisons of behavioral scores between treatment groups.
Strain
U-Statistic for
Percent Time
Spent
Immobile in
the TST
Adjusted p-
values***
U-Statistic for
Percent Time Spent
in the Center of the
OF
Adjusted p-
values***
129S1/SvImJ 96 0.537 111.5 0.294
A/J 114 0.264 115 0.917
AKR/J 41 0.345 40 0.965
BALB/cJ 249.5 0.001** 47.5 0.879
BTBRT<t>tf/J 45 0.386 61 0.619
BUB/BnJ 62 0.012* 51.5 0.136
C3H/HeJ 121 0.291 117.5 0.836
C57BL/6J 57 0.007** 63.5 0.5
C57BLKS/J 71 0.26 63 0.843
C57BR/cdJ 95 0.023* 124 0.097
C58/J 42 0.895 53 0.27
CBA/J 190.5 0.00002** 117 0.369
CE/J 69 0.286 70 0.256
DBA/2J 131.5 0.094^ 262.5 0.014*
FVB/NJ 43 0.248 64 0.038
I/LnJ 24 0.427 66.5 0.063
LG/J 61 0.070^ 77 0.037
LP/J 41.5 0.826 115 0.147
MA/MyJ 63 0.047* 68 0.015*
MRL/MpJ 37 0.923 57.5 0.265
NOD/LtJ 81 0.067^ 61 0.974
NOR/LtJ 48 0.205 55.5 0.973
NZB/BlNJ 46 0.594 95.5 0.022
NZW/LacJ 50 0.178 39 0.895
P/J 90 0.001** 79 0.025
PL/J 94 0.025* 102.5 0.078
RIIIS/J 66 0.394 73 0.177
SJL/J 50 0.97 100.5 0.009**
SM/J 49 0.002** 64 0.007**
SWR/J 93 0.225 83 0.525
*** Following Mann-Whitney U test for post-hoc pairwise comparisons of behavioral scores between
treatment groups, p-values were adjusted for multiple comparisons using the Benjamini-Hochberg

175
correction for multiple testing; *** denotes p-values p<0.009; ** denotes p-values p<0.05; ^denotes p-
values p<0.10

176
Supplementary Table 4.6 Covariance of behavior and neurobiochemical levels explained by
partial least squares (PLS) latent vectors
Supplementary Table 4.6 Covariance of behavior and neurobiochemical levels explained by partial
least squares (PLS) latent vectors
Percent covariance explained for behavior
and biochemical levels
Cumulative percent covariance explained
for behavior and biochemical levels
Vehicle
Vector 1 59 59
Vector 2 29 88
Vector 3 12 100
Fluoxetine
Vector 1 56 56
Vector 2 33 89
Vector 3 11 100

177
Supplementary Table 4.7 Informative genes used to predict treatment groups in the k-NN leave-
one-out cross-validation test
Supplementary Table 4.7 Informative genes used to predict treatment groups in the kNN leave-one-
out cross-validation test
Genes Description
Gm129 gene model 129
Lgi2 leucine-rich repeat LGI family, member 2
Erf Ets2 repressor factor
Gnb4 guanine nucleotide binding protein (G protein), beta 4
Cdc42ep3 CDC42 effector protein (Rho GTPase binding) 3
Anp32a acidic (leucine-rich) nuclear phosphoprotein 32 family, member A
2400009B08Rik RIKEN cDNA 2400009B08 gene,
Sema4a
sema domain, immunoglobulin domain (Ig), transmembrane domain (TM) and short
cytoplasmic domain, (semaphorin) 4A,
Gpc1 glypican 1
Inhba inhibin beta-A
C030003D03Rik RIKEN cDNA C030003D03 gene
Sgsm1 small G protein signaling modulator 1

178
Supplementary Table 4.8 Informative genes used to predict response groups in the k-NN leave-
one-out cross-validation test.
Supplementary Table 4.8 Informative genes used to predict response groups in the kNN leave-one-out
cross-validation test
Genes Description
Copg2as2 coatomer protein complex, subunit gamma 2, antisense 2
Prcp prolylcarboxypeptidase (angiotensinase C)
Gpr115 G protein-coupled receptor 115
Gxylt2 glycosyltransferase 8 domain containing 4
Plb1 phospholipase B1
Txndc9 thioredoxin domain containing 9
Mum1l1 melanoma associated antigen (mutated) 1-like 1
EG545391 predicted gene

179
Supplementary Table 4.9 Baseline genetic markers that influence variable antidepressant
response
Supplementary Table 4.9 List of candidate baseline genetic markers that account for variable fluoxetine
response
Gene Gene Name p-value R2 Adjusted R
2
9230108I15Rik RIKEN cDNA 9230108I15 gene 0.00014 0.61 0.58
Gm16432 Predicted gene 16432 0.00057 0.53 0.51
C78760 Expressed sequence C78760 0.00069 0.52 0.49
Smurf2 SMAD specific E3 ubiquitin protein ligase 2 0.00086 0.51 0.48
2610005L07Rik Cadherin 11 pseudogene 0.00113 0.49 0.46
Lmo3 LIM domain only 3 0.00156 0.47 0.44
Tcrb-J T-cell receptor beta, joining region 0.00206 0.46 0.42
LOC665506 T-cell receptor beta, joining region 0.00278 0.44 0.40
Pabpc1 Poly(A) binding protein, cytoplasmic 1 0.00431 0.41 0.37
Ern1 Endoplasmic reticulum (ER) to nucleus signalling 1 0.00461 0.40 0.37
LOC627901 Similar to zinc finger protein 14 0.00533 0.39 0.36

180
8. Supplementary Figure
Supplementary Figure 4.1 Cellular adhesion and proliferation pathway links candidate
antidepressant biochemical markers S100β GFAP, GSK3β, and HDAC5
Supplementary Figure 4.1. Cellular adhesion and proliferation pathway links candidate
antidepressant biochemical markers S100β, GFAP, HDAC5, and GSK3β. Molecular connections
between candidate antidepressant biomarkers were evaluated using Ingenuity Pathway Analysis (IPA)
software. Results indicate that all candidate antidepressant markers are linked either directly or
indirectly. S100β, GFAP, HDAC5, and GSK3β connect within a common cellular growth and
proliferation network, indicating the importance of cellular genesis in mediating response to chronic
fluoxetine treatment

181
REFERENCES
Amsterdam JD, Fawcett J, Quitkin FM, Reimherr FW, Rosenbaum JF, Michelson D, Hornig-Rohan M,
Beasley CM (1997) Fluoxetine and norfluoxetine plasma concentrations in major depression: a
multicenter study. Am J Psychiatry 154: 963-9
Andreescu C, Lenze EJ, Dew MA, Begley AE, Mulsant BH, Dombrovski AY, Pollock BG, Stack J,
Miller MD, Reynolds CF (2007) Effect of comorbid anxiety on treatment response and relapse
risk in late-life depression: controlled study. Br J Psychiatry 190: 344-9
Arai M, Yuzawa H, Nohara I, Ohnishi T, Obata N, Iwayama Y, Haga S, Toyota T, Ujike H, Ichikawa
T, Nishida A, Tanaka Y, Furukawa A, Aikawa Y, Kuroda O, Niizato K, Izawa R, Nakamura K,
Mori N, Matsuzawa D, Hashimoto K, Iyo M, Sora I, Matsushita M, Okazaki Y, Yoshikawa T,
Miyata T, Itokawa M (2010) Enhanced carbonyl stress in a subpopulation of schizophrenia.
Arch Gen Psychiatry 67: 589-97
Baudry A, Mouillet-Richard S, Schneider B, Launay JM, Kellermann O (2010) miR-16 targets the
serotonin transporter: a new facet for adaptive responses to antidepressants. Science 329: 1537-
41
Beasley CM, Jr., Bosomworth JC, Wernicke JF (1990) Fluoxetine: relationships among dose, response,
adverse events, and plasma concentrations in the treatment of depression. Psychopharmacol
Bull 26: 18-24
Benekareddy M, Goodfellow NM, Lambe EK, Vaidya VA (2010) Enhanced function of prefrontal
serotonin 5-HT(2) receptors in a rat model of psychiatric vulnerability. J Neurosci 30: 12138-50
Bjarnadottir TK, Fredriksson R, Hoglund PJ, Gloriam DE, Lagerstrom MC, Schioth HB (2004) The
human and mouse repertoire of the adhesion family of G-protein-coupled receptors. Genomics
84: 23-33
Bohm C, Newrzella D, Herberger S, Schramm N, Eisenhardt G, Schenk V, Sonntag-Buck V,
Sorgenfrei O (2006) Effects of antidepressant treatment on gene expression profile in mouse
brain: cell type-specific transcription profiling using laser microdissection and microarray
analysis. J Neurochem 97 Suppl 1: 44-9
Boldrini M, Underwood MD, Hen R, Rosoklija GB, Dwork AJ, John Mann J, Arango V (2009)
Antidepressants increase neural progenitor cells in the human hippocampus.
Neuropsychopharmacology 34: 2376-89
Campbell S, Macqueen G (2004) The role of the hippocampus in the pathophysiology of major
depression. J Psychiatry Neurosci 29: 417-26
Chanock SJ, Manolio T, Boehnke M, Boerwinkle E, Hunter DJ, Thomas G, Hirschhorn JN, Abecasis
G, Altshuler D, Bailey-Wilson JE, Brooks LD, Cardon LR, Daly M, Donnelly P, Fraumeni JF,
182
Jr., Freimer NB, Gerhard DS, Gunter C, Guttmacher AE, Guyer MS, Harris EL, Hoh J, Hoover
R, Kong CA, Merikangas KR, Morton CC, Palmer LJ, Phimister EG, Rice JP, Roberts J,
Rotimi C, Tucker MA, Vogan KJ, Wacholder S, Wijsman EM, Winn DM, Collins FS (2007)
Replicating genotype-phenotype associations. Nature 447: 655-60
Choleris E, Thomas AW, Kavaliers M, Prato FS (2001) A detailed ethological analysis of the mouse
open field test: effects of diazepam, chlordiazepoxide and an extremely low frequency pulsed
magnetic field. Neurosci Biobehav Rev 25: 235-60
Cipriani A, Brambilla P, Furukawa T, Geddes J, Gregis M, Hotopf M, Malvini L, Barbui C (2005)
Fluoxetine versus other types of pharmacotherapy for depression. Cochrane Database Syst Rev:
CD004185
Cover T.M. and Hart PE (1967) Nearest neighbor pattern classification. IEEE Trans. Inform. Theory
IT-13: 21-27
Crawley JN (1985) Exploratory behavior models of anxiety in mice. Neurosci Biobehav Rev 9: 37-44
Crowley JJ, Brodkin ES, Blendy JA, Berrettini WH, Lucki I (2006) Pharmacogenomic evaluation of
the antidepressant citalopram in the mouse tail suspension test. Neuropsychopharmacology 31:
2433-42
Cryan JF, Mombereau C, Vassout A (2005) The tail suspension test as a model for assessing
antidepressant activity: review of pharmacological and genetic studies in mice. Neurosci
Biobehav Rev 29: 571-625
Dave V, Kimelberg HK (1994) Na(+)-dependent, fluoxetine-sensitive serotonin uptake by astrocytes
tissue-printed from rat cerebral cortex. J Neurosci 14: 4972-86
Deltheil T, Tanaka K, Reperant C, Hen R, David DJ, Gardier AM (2009) Synergistic neurochemical
and behavioural effects of acute intrahippocampal injection of brain-derived neurotrophic factor
and antidepressants in adult mice. Int J Neuropsychopharmacol: 1-11
Ditzen C, Jastorff AM, Kessler MS, Bunck M, Teplytska L, Erhardt A, Kromer SA, Varadarajulu J,
Targosz BS, Sayan-Ayata EF, Holsboer F, Landgraf R, Turck CW (2006) Protein biomarkers in
a mouse model of extremes in trait anxiety. Mol Cell Proteomics 5: 1914-20
Domenici E, Wille DR, Tozzi F, Prokopenko I, Miller S, McKeown A, Brittain C, Rujescu D, Giegling
I, Turck CW, Holsboer F, Bullmore ET, Middleton L, Merlo-Pich E, Alexander RC, Muglia P
(2010) Plasma protein biomarkers for depression and schizophrenia by multi analyte profiling
of case-control collections. PLoS One 5: e9166
Duman RS (2002) Pathophysiology of depression: the concept of synaptic plasticity. Eur Psychiatry 17
Suppl 3: 306-10
Duman RS, Nakagawa S, Malberg J (2001) Regulation of adult neurogenesis by antidepressant
treatment. Neuropsychopharmacology 25: 836-44

183
Emmanuel J, Simmonds S, Tyrer P (1998) Systematic review of the outcome of anxiety and depressive
disorders. Br J Psychiatry Suppl: 35-41
Encinas JM, Vaahtokari A, Enikolopov G (2006) Fluoxetine targets early progenitor cells in the adult
brain. Proc Natl Acad Sci U S A 103: 8233-8
Fatemi SH, Folsom TD, Reutiman TJ, Pandian T, Braun NN, Haug K (2008) Chronic psychotropic
drug treatment causes differential expression of connexin 43 and GFAP in frontal cortex of rats.
Schizophr Res 104: 127-34
Fatemi SH, Reutiman TJ, Folsom TD (2009) Chronic psychotropic drug treatment causes differential
expression of Reelin signaling system in frontal cortex of rats. Schizophr Res 111: 138-52
Fava M, Alpert JE, Carmin CN, Wisniewski SR, Trivedi MH, Biggs MM, Shores-Wilson K, Morgan
D, Schwartz T, Balasubramani GK, Rush AJ (2004) Clinical correlates and symptom patterns
of anxious depression among patients with major depressive disorder in STAR*D. Psychol Med
34: 1299-308
Fava M, Rush AJ, Alpert JE, Balasubramani GK, Wisniewski SR, Carmin CN, Biggs MM, Zisook S,
Leuchter A, Howland R, Warden D, Trivedi MH (2008) Difference in treatment outcome in
outpatients with anxious versus nonanxious depression: a STAR*D report. Am J Psychiatry
165: 342-51
Fava M, Rush AJ, Alpert JE, Carmin CN, Balasubramani GK, Wisniewski SR, Trivedi MH, Biggs
MM, Shores-Wilson K (2006) What clinical and symptom features and comorbid disorders
characterize outpatients with anxious major depressive disorder: a replication and extension.
Can J Psychiatry 51: 823-35
Fujimoto M, Uchida S, Watanuki T, Wakabayashi Y, Otsuki K, Matsubara T, Suetsugi M, Funato H,
Watanabe Y (2008) Reduced expression of glyoxalase-1 mRNA in mood disorder patients.
Neurosci Lett 438: 196-9
Fujishiro J, Imanishi T, Onozawa K, Tsushima M (2002) Comparison of the anticholinergic effects of
the serotonergic antidepressants, paroxetine, fluvoxamine and clomipramine. Eur J Pharmacol
454: 183-8
Ganendren R, Carter E, Sorrell T, Widmer F, Wright L (2006) Phospholipase B activity enhances
adhesion of Cryptococcus neoformans to a human lung epithelial cell line. Microbes Infect 8:
1006-15
Garriock HA, Kraft JB, Shyn SI, Peters EJ, Yokoyama JS, Jenkins GD, Reinalda MS, Slager SL,
McGrath PJ, Hamilton SP (2010) A genomewide association study of citalopram response in
major depressive disorder. Biol Psychiatry 67: 133-8
Gattaz WF, Lara DR, Elkis H, Portela LV, Goncalves CA, Tort AB, Henna J, Souza DO (2000)
Decreased S100-beta protein in schizophrenia: preliminary evidence. Schizophr Res 43: 91-5

184
Golub TR, Slonim DK, Tamayo P, Huard C, Gaasenbeek M, Mesirov JP, Coller H, Loh ML, Downing
JR, Caligiuri MA, Bloomfield CD, Lander ES (1999) Molecular classification of cancer: class
discovery and class prediction by gene expression monitoring. Science 286: 531-7
Gould J, Getz G, Monti S, Reich M, Mesirov JP (2006) Comparative gene marker selection suite.
Bioinformatics 22: 1924-5
Hodes GE, Hill-Smith TE, Suckow RF, Cooper TB, Lucki I (2010) Sex-specific effects of chronic
fluoxetine treatment on neuroplasticity and pharmacokinetics in mice. J Pharmacol Exp Ther
332: 266-73
Hovatta I, Tennant RS, Helton R, Marr RA, Singer O, Redwine JM, Ellison JA, Schadt EE, Verma IM,
Lockhart DJ, Barlow C (2005) Glyoxalase 1 and glutathione reductase 1 regulate anxiety in
mice. Nature 438: 662-6
Hu XZ, Rush AJ, Charney D, Wilson AF, Sorant AJ, Papanicolaou GJ, Fava M, Trivedi MH,
Wisniewski SR, Laje G, Paddock S, McMahon FJ, Manji H, Lipsky RH (2007) Association
between a functional serotonin transporter promoter polymorphism and citalopram treatment in
adult outpatients with major depression. Arch Gen Psychiatry 64: 783-92
Ising M, Horstmann S, Kloiber S, Lucae S, Binder EB, Kern N, Kunzel HE, Pfennig A, Uhr M,
Holsboer F (2007) Combined dexamethasone/corticotropin releasing hormone test predicts
treatment response in major depression - a potential biomarker? Biol Psychiatry 62: 47-54
Ising M, Lucae S, Binder EB, Bettecken T, Uhr M, Ripke S, Kohli MA, Hennings JM, Horstmann S,
Kloiber S, Menke A, Bondy B, Rupprecht R, Domschke K, Baune BT, Arolt V, Rush AJ,
Holsboer F, Muller-Myhsok B (2009) A genomewide association study points to multiple loci
that predict antidepressant drug treatment outcome in depression. Arch Gen Psychiatry 66: 966-
75
Jehn CF, Kuehnhardt D, Bartholomae A, Pfeiffer S, Krebs M, Regierer AC, Schmid P, Possinger K,
Flath BC (2006) Biomarkers of depression in cancer patients. Cancer 107: 2723-9
Kang HM, Zaitlen NA, Wade CM, Kirby A, Heckerman D, Daly MJ, Eskin E (2008) Efficient control
of population structure in model organism association mapping. Genetics 178: 1709-23
Kazantsev AG, Thompson LM (2008) Therapeutic application of histone deacetylase inhibitors for
central nervous system disorders. Nat Rev Drug Discov 7: 854-68
Kempermann G (2008) The neurogenic reserve hypothesis: what is adult hippocampal neurogenesis
good for? Trends Neurosci 31: 163-9
Kitanaka J, Kitanaka N, Takemura M, Wang XB, Hembree CM, Goodman NL, Uhl GR (2002)
Isolation and sequencing of a putative promoter region of the murine G protein beta 1 subunit
(GNB1) gene. DNA Seq 13: 39-45

185
Kornstein SG, Schneider RK (2001) Clinical features of treatment-resistant depression. J Clin
Psychiatry 62 Suppl 16: 18-25
Kraft JB, Peters EJ, Slager SL, Jenkins GD, Reinalda MS, McGrath PJ, Hamilton SP (2007) Analysis
of association between the serotonin transporter and antidepressant response in a large clinical
sample. Biol Psychiatry 61: 734-42
Krishnan V, Nestler EJ (2008) The molecular neurobiology of depression. Nature 455: 894-902
Kroes RA, Panksepp J, Burgdorf J, Otto NJ, Moskal JR (2006) Modeling depression: social
dominance-submission gene expression patterns in rat neocortex. Neuroscience 137: 37-49
Kromer SA, Kessler MS, Milfay D, Birg IN, Bunck M, Czibere L, Panhuysen M, Putz B, Deussing JM,
Holsboer F, Landgraf R, Turck CW (2005) Identification of glyoxalase-I as a protein marker in
a mouse model of extremes in trait anxiety. J Neurosci 25: 4375-84
Kulkarni SK, Dhir A (2007) Effect of various classes of antidepressants in behavioral paradigms of
despair. Prog Neuropsychopharmacol Biol Psychiatry 31: 1248-54
Laje G, Allen AS, Akula N, Manji H, John Rush A, McMahon FJ (2009) Genome-wide association
study of suicidal ideation emerging during citalopram treatment of depressed outpatients.
Pharmacogenet Genomics 19: 666-74
Laje G, Paddock S, Manji H, Rush AJ, Wilson AF, Charney D, McMahon FJ (2007) Genetic markers
of suicidal ideation emerging during citalopram treatment of major depression. Am J Psychiatry
164: 1530-8
Lee JH, Ko E, Kim YE, Min JY, Liu J, Kim Y, Shin M, Hong M, Bae H (2010) Gene expression
profile analysis of genes in rat hippocampus from antidepressant treated rats using DNA
microarray. BMC Neurosci 11: 152
Lekman M, Laje G, Charney D, Rush AJ, Wilson AF, Sorant AJ, Lipsky R, Wisniewski SR, Manji H,
McMahon FJ, Paddock S (2008) The FKBP5-gene in depression and treatment response--an
association study in the Sequenced Treatment Alternatives to Relieve Depression (STAR*D)
Cohort. Biol Psychiatry 63: 1103-10
Leuchter AF, Cook IA, Hamilton SP, Narr KL, Toga A, Hunter AM, Faull K, Whitelegge J, Andrews
AM, Loo J, Way B, Nelson SF, Horvath S, Lebowitz BD (2010) Biomarkers to predict
antidepressant response. Curr Psychiatry Rep 12: 553-62
Leuchter AF, Cook IA, Marangell LB, Gilmer WS, Burgoyne KS, Howland RH, Trivedi MH, Zisook
S, Jain R, McCracken JT, Fava M, Iosifescu D, Greenwald S (2009) Comparative effectiveness
of biomarkers and clinical indicators for predicting outcomes of SSRI treatment in Major
Depressive Disorder: results of the BRITE-MD study. Psychiatry Res 169: 124-31
186
Li X, Zhu W, Roh MS, Friedman AB, Rosborough K, Jope RS (2004) In vivo regulation of glycogen
synthase kinase-3beta (GSK3beta) by serotonergic activity in mouse brain.
Neuropsychopharmacology 29: 1426-31
Ling SH, Tang YL, Jiang F, Wiste A, Guo SS, Weng YZ, Yang TS (2007) Plasma S-100B protein in
Chinese patients with schizophrenia: comparison with healthy controls and effect of
antipsychotics treatment. J Psychiatr Res 41: 36-42
Liu X, Gershenfeld HK (2003) An exploratory factor analysis of the Tail Suspension Test in 12 inbred
strains of mice and an F2 intercross. Brain Res Bull 60: 223-31
Lucassen PJ, Meerlo P, Naylor AS, van Dam AM, Dayer AG, Fuchs E, Oomen CA, Czeh B (2010)
Regulation of adult neurogenesis by stress, sleep disruption, exercise and inflammation:
Implications for depression and antidepressant action. Eur Neuropsychopharmacol 20: 1-17
Lucki I, Dalvi A, Mayorga AJ (2001) Sensitivity to the effects of pharmacologically selective
antidepressants in different strains of mice. Psychopharmacology (Berl) 155: 315-22
Malberg JE, Eisch AJ, Nestler EJ, Duman RS (2000) Chronic antidepressant treatment increases
neurogenesis in adult rat hippocampus. J Neurosci 20: 9104-10
Mallela J, Perkins R, Yang J, Pedigo S, Rimoldi JM, Shariat-Madar Z (2008) The functional
importance of the N-terminal region of human prolylcarboxypeptidase. Biochem Biophys Res
Commun 374: 635-40
Mallela J, Yang J, Shariat-Madar Z (2009) Prolylcarboxypeptidase: a cardioprotective enzyme. Int J
Biochem Cell Biol 41: 477-81
Manev H, Uz T, Smalheiser NR, Manev R (2001) Antidepressants alter cell proliferation in the adult
brain in vivo and in neural cultures in vitro. Eur J Pharmacol 411: 67-70
Manji HK, Drevets WC, Charney DS (2001) The cellular neurobiology of depression. Nat Med 7: 541-
7
Manji HK, Quiroz JA, Sporn J, Payne JL, Denicoff K, N AG, Zarate CA, Jr., Charney DS (2003)
Enhancing neuronal plasticity and cellular resilience to develop novel, improved therapeutics
for difficult-to-treat depression. Biol Psychiatry 53: 707-42
Marron JS, Todd MJ, Ahn J (2007) Distance-Weighted Discrimination. Journal of the American
Statistical Association 102: 1267-1271
McMahon FJ, Buervenich S, Charney D, Lipsky R, Rush AJ, Wilson AF, Sorant AJ, Papanicolaou GJ,
Laje G, Fava M, Trivedi MH, Wisniewski SR, Manji H (2006) Variation in the gene encoding
the serotonin 2A receptor is associated with outcome of antidepressant treatment. Am J Hum
Genet 78: 804-14

187
Miller BH, Schultz LE, Gulati A, Cameron MD, Pletcher MT (2008) Genetic regulation of behavioral
and neuronal responses to fluoxetine. Neuropsychopharmacology 33: 1312-22
Miller BH, Schultz LE, Gulati A, Su AI, Pletcher MT (2010) Phenotypic characterization of a
genetically diverse panel of mice for behavioral despair and anxiety. PLoS One 5: e14458
Mirescu C, Peters JD, Gould E (2004) Early life experience alters response of adult neurogenesis to
stress. Nat Neurosci 7: 841-6
Nestler EJ, Barrot M, DiLeone RJ, Eisch AJ, Gold SJ, Monteggia LM (2002) Neurobiology of
depression. Neuron 34: 13-25
Nestler EJ, Hyman SE (2010) Animal models of neuropsychiatric disorders. Nat Neurosci 13: 1161-9
Norman TR, Gupta RK, Burrows GD, Parker G, Judd FK (1993) Relationship between antidepressant
response and plasma concentrations of fluoxetine and norfluoxetine. Int Clin Psychopharmacol
8: 25-9
Okae H, Iwakura Y (2010) Neural tube defects and impaired neural progenitor cell proliferation in
Gbeta1-deficient mice. Dev Dyn 239: 1089-101
Okajima T, Matsuura A, Matsuda T (2008) Biological functions of glycosyltransferase genes involved
in O-fucose glycan synthesis. J Biochem 144: 1-6
Olfson M, Marcus SC, Tedeschi M, Wan GJ (2006) Continuity of antidepressant treatment for adults
with depression in the United States. Am J Psychiatry 163: 101-8
Paddock S (2008) Genetic variation in GRIK4 and the implications for antidepressant treatment.
Pharmacogenomics 9: 133-5
Perlis RH, Moorjani P, Fagerness J, Purcell S, Trivedi MH, Fava M, Rush AJ, Smoller JW (2008)
Pharmacogenetic analysis of genes implicated in rodent models of antidepressant response:
association of TREK1 and treatment resistance in the STAR(*)D study.
Neuropsychopharmacology 33: 2810-9
Perlis RH, Purcell S, Fava M, Fagerness J, Rush AJ, Trivedi MH, Smoller JW (2007) Association
between treatment-emergent suicidal ideation with citalopram and polymorphisms near cyclic
adenosine monophosphate response element binding protein in the STAR*D study. Arch Gen
Psychiatry 64: 689-97
Peters EJ, Slager SL, Kraft JB, Jenkins GD, Reinalda MS, McGrath PJ, Hamilton SP (2008)
Pharmacokinetic genes do not influence response or tolerance to citalopram in the STAR*D
sample. PLoS One 3: e1872
Politi P, Minoretti P, Falcone C, Martinelli V, Emanuele E (2006) Association analysis of the
functional Ala111Glu polymorphism of the glyoxalase I gene in panic disorder. Neurosci Lett
396: 163-6

188
Qiao X, Zhang HH, Liu Y, Todd MJ, Marron JS (2010) Weighted Distance Weighted Discrimination
and Its Asymptotic Properties. J Am Stat Assoc 105: 401-414
Reich M, Liefeld T, Gould J, Lerner J, Tamayo P, Mesirov JP (2006) GenePattern 2.0. Nat Genet 38:
500-1
Riccio A, Ahn S, Davenport CM, Blendy JA, Ginty DD (1999) Mediation by a CREB family
transcription factor of NGF-dependent survival of sympathetic neurons. Science 286: 2358-61
Ripoll N, David DJ, Dailly E, Hascoet M, Bourin M (2003) Antidepressant-like effects in various mice
strains in the tail suspension test. Behav Brain Res 143: 193-200
Rossi A, Barraco A, Donda P (2004) Fluoxetine: a review on evidence based medicine. Ann Gen Hosp
Psychiatry 3: 2
Sairanen M, Lucas G, Ernfors P, Castren M, Castren E (2005) Brain-derived neurotrophic factor and
antidepressant drugs have different but coordinated effects on neuronal turnover, proliferation,
and survival in the adult dentate gyrus. J Neurosci 25: 1089-94
Schloesser RJ, Manji HK, Martinowich K (2009) Suppression of adult neurogenesis leads to an
increased hypothalamo-pituitary-adrenal axis response. Neuroreport 20: 553-7
Schmidt HD, Duman RS (2007) The role of neurotrophic factors in adult hippocampal neurogenesis,
antidepressant treatments and animal models of depressive-like behavior. Behav Pharmacol 18:
391-418
Schule C, Baghai TC, Eser D, Hafner S, Born C, Herrmann S, Rupprecht R (2009) The combined
dexamethasone/CRH Test (DEX/CRH test) and prediction of acute treatment response in major
depression. PLoS One 4: e4324
Sethi MK, Buettner FF, Krylov VB, Takeuchi H, Nifantiev NE, Haltiwanger RS, Gerardy-Schahn R,
Bakker H Identification of glycosyltransferase 8 family members as xylosyltransferases acting
on O-glucosylated notch epidermal growth factor repeats. J Biol Chem 285: 1582-6
Shyn SI, Shi J, Kraft JB, Potash JB, Knowles JA, Weissman MM, Garriock HA, Yokoyama JS,
McGrath PJ, Peters EJ, Scheftner WA, Coryell W, Lawson WB, Jancic D, Gejman PV, Sanders
AR, Holmans P, Slager SL, Levinson DF, Hamilton SP (2011) Novel loci for major depression
identified by genome-wide association study of Sequenced Treatment Alternatives to Relieve
Depression and meta-analysis of three studies. Mol Psychiatry 16: 202-15
Steiner J, Schroeter ML, Schiltz K, Bernstein HG, Muller UJ, Richter-Landsberg C, Muller WE,
Walter M, Gos T, Bogerts B, Keilhoff G (2010) Haloperidol and clozapine decrease S100B
release from glial cells. Neuroscience 167: 1025-31
Steru L, Chermat R, Thierry B, Mico JA, Lenegre A, Steru M, Simon P, Porsolt RD (1987) The
automated Tail Suspension Test: a computerized device which differentiates psychotropic
drugs. Prog Neuropsychopharmacol Biol Psychiatry 11: 659-71

189
Steru L, Chermat R, Thierry B, Simon P (1985) The tail suspension test: a new method for screening
antidepressants in mice. Psychopharmacology (Berl) 85: 367-70
Szatkiewicz JP, Beane GL, Ding Y, Hutchins L, Pardo-Manuel de Villena F, Churchill GA (2008) An
imputed genotype resource for the laboratory mouse. Mamm Genome 19: 199-208
Takahashi Y, Washiyama K, Kobayashi T, Hayashi S (2006) Gene expression in the brain from
fluoxetine-injected mouse using DNA microarray. Ann N Y Acad Sci 1074: 42-51
Takamatsu Y, Yamamoto H, Ogai Y, Hagino Y, Markou A, Ikeda K (2006) Fluoxetine as a potential
pharmacotherapy for methamphetamine dependence: studies in mice. Ann N Y Acad Sci 1074:
295-302
Takayanagi Y, Fujita E, Yu Z, Yamagata T, Momoi MY, Momoi T, Onaka T (2010) Impairment of
social and emotional behaviors in Cadm1-knockout mice. Biochem Biophys Res Commun 396:
703-8
Thase ME (2007) Molecules that mediate mood. N Engl J Med 357: 2400-2
Thornalley PJ (2006) Unease on the role of glyoxalase 1 in high-anxiety-related behaviour. Trends Mol
Med 12: 195-9
Trivedi MH, Rush AJ, Wisniewski SR, Nierenberg AA, Warden D, Ritz L, Norquist G, Howland RH,
Lebowitz B, McGrath PJ, Shores-Wilson K, Biggs MM, Balasubramani GK, Fava M (2006)
Evaluation of outcomes with citalopram for depression using measurement-based care in
STAR*D: implications for clinical practice. Am J Psychiatry 163: 28-40
Trullas R, Jackson B, Skolnick P (1989) Genetic differences in a tail suspension test for evaluating
antidepressant activity. Psychopharmacology (Berl) 99: 287-8
Tsankova N, Renthal W, Kumar A, Nestler EJ (2007) Epigenetic regulation in psychiatric disorders.
Nat Rev Neurosci 8: 355-67
Tsankova NM, Berton O, Renthal W, Kumar A, Neve RL, Nestler EJ (2006) Sustained hippocampal
chromatin regulation in a mouse model of depression and antidepressant action. Nat Neurosci 9:
519-25
Uher R, Perroud N, Ng MY, Hauser J, Henigsberg N, Maier W, Mors O, Placentino A, Rietschel M,
Souery D, Zagar T, Czerski PM, Jerman B, Larsen ER, Schulze TG, Zobel A, Cohen-Woods S,
Pirlo K, Butler AW, Muglia P, Barnes MR, Lathrop M, Farmer A, Breen G, Aitchison KJ,
Craig I, Lewis CM, McGuffin P (2010) Genome-wide pharmacogenetics of antidepressant
response in the GENDEP project. Am J Psychiatry 167: 555-64
Ukai M, Maeda H, Nanya Y, Kameyama T, Matsuno K (1998) Beneficial effects of acute and repeated
administrations of sigma receptor agonists on behavioral despair in mice exposed to tail
suspension. Pharmacol Biochem Behav 61: 247-52
190
Vaugeois JM, Passera G, Zuccaro F, Costentin J (1997) Individual differences in response to
imipramine in the mouse tail suspension test. Psychopharmacology (Berl) 134: 387-91
Warden D, Trivedi MH, Wisniewski SR, Davis L, Nierenberg AA, Gaynes BN, Zisook S, Hollon SD,
Balasubramani GK, Howland R, Fava M, Stewart JW, Rush AJ (2007) Predictors of attrition
during initial (citalopram) treatment for depression: a STAR*D report. Am J Psychiatry 164:
1189-97
Watabe K, Ito A, Koma YI, Kitamura Y (2003) IGSF4: a new intercellular adhesion molecule that is
called by three names, TSLC1, SgIGSF and SynCAM, by virtue of its diverse function. Histol
Histopathol 18: 1321-9
Wiesmann M, Wandinger KP, Missler U, Eckhoff D, Rothermundt M, Arolt V, Kirchner H (1999)
Elevated plasma levels of S-100b protein in schizophrenic patients. Biol Psychiatry 45: 1508-11
Williams Rt, Lim JE, Harr B, Wing C, Walters R, Distler MG, Teschke M, Wu C, Wiltshire T, Su AI,
Sokoloff G, Tarantino LM, Borevitz JO, Palmer AA (2009) A common and unstable copy
number variant is associated with differences in Glo1 expression and anxiety-like behavior.
PLoS One 4: e4649
Willner P (1997) Validity, reliability and utility of the chronic mild stress model of depression: a 10-
year review and evaluation. Psychopharmacology (Berl) 134: 319-29
Willner P (2005) Chronic mild stress (CMS) revisited: consistency and behavioural-neurobiological
concordance in the effects of CMS. Neuropsychobiology 52: 90-110
Wu C, Delano DL, Mitro N, Su SV, Janes J, McClurg P, Batalov S, Welch GL, Zhang J, Orth AP,
Walker JR, Glynne RJ, Cooke MP, Takahashi JS, Shimomura K, Kohsaka A, Bass J, Saez E,
Wiltshire T, Su AI (2008) Gene set enrichment in eQTL data identifies novel annotations and
pathway regulators. PLoS Genet 4: e1000070
Yang H, Ding Y, Hutchins LN, Szatkiewicz J, Bell TA, Paigen BJ, Graber JH, de Villena FP, Churchill
GA (2009) A customized and versatile high-density genotyping array for the mouse. Nat
Methods 6: 663-6
Zhiling Y, Fujita E, Tanabe Y, Yamagata T, Momoi T, Momoi MY (2008) Mutations in the gene
encoding CADM1 are associated with autism spectrum disorder. Biochem Biophys Res
Commun 377: 926-9

191
CHAPTER 5
TAKING THE YELLOW BRICK ROAD TO BIOMARKER VALIDATION

192
1. Summary
We collected genome-wide gene expression data and measured the levels of 40 biochemical
molecules that have been implicated in anxiety and depression, including neurotransmitters,
neurotrophic factors, neuropeptides, and neuroamine regulators . We quantified these biochemical
molecules under control, fluoxetine, and treatment-naïve conditions. In addition, we recorded several
baseline anxiety and depressive behavioral measures, as well as depressive-like responses, in multiple
inbred strains after administration of fluoxetine or water. Our goal is to identify genetic and
biochemical markers that can assess SSRI drug response and risk for poor treatment outcome.
2. Translating Genetic Findings from Murine to Humans
Haplotype-behavioral associations were performed, and the locations of the candidate QTLs
were examined for previous association with behavioral responses related to anxiety and depression.
We identified two anxiety-like QTLs, Chr 5: 108.2 – 110.9 and Chr 17: 18.7 – 23.7, that have
been previously reported for anxiety-related responses and circadian photosensitivity, respectively
(Cohen et al. 2001; Yoshimura et al. 2002). Investigation of genes within the anxiety-like behavior loci
on Chrs 5 and 7 reveal three genes (Fpr1, Pde6b, and Pxmp2) with previous association with anxiety or
depression (Cohen et al. 2001; Yoshimura et al. 2002). Interestingly, we identified a behavioral despair
locus on Chr 4 that has been previously linked with anxiety behavior and responses to thermal pain
(Mogil et al. 1997; Nakamura et al. 2003). Two genes within the despair locus on Chr 4, Hcrtr1 and
Oprd1, were previously correlated with depressive and/or anxiety behavior (Filliol et al. 2000; Scott et
al. 2011; van Rijn et al. 2010). Our study demonstrates the power of QTL mapping analysis for the
detection of genetic loci that influence complex behavioral phenotypes.

193
Detecting susceptibility loci for mental health disorders is challenging for human studies given
the limited ability to control and account for environmental effects and the need for larger sample sizes
to detect genes with moderate effects. Although the use of mouse models can overcome these
limitations, depression is challenging to model in animals given that diagnosis and prognosis are based
on empirical clinical observations and patients‟ phenomenological accounts. As a result, rodent
behavioral tests for depression often lack face and construct validity and are unable to model certain
symptoms, like suicidality. Therefore, an important future direction for mouse QTL behavioral
mapping studies is the assessment of candidate genes for depressive disorder. To establish association
of murine candidate genes with major depression, we propose a cross-species association analysis
approach.
Cross-species association analysis utilizes mouse QTL mapping studies for candidate gene
identification and human candidate gene association studies for gene validation. Ease in sample and
subject accessibility, reduced genomic complexity, and the ability to control for the effects of
environment on behavior makes mouse QTL mapping analysis an effective and efficient method for
candidate gene identification, while the use of human samples and data for candidate gene validation
provides further information regarding the clinical relevance of genetic biomarkers.
Stage 1: Following identification of loci associated with anxiety-like and depressive-like
phenotypes (chapter 2), genes within behavioral QTLs can be prioritized by examining gene expression
and biochemical data. Genes with expression levels that correlate with behavioral phenotypes or
neurobiochemical levels will be further examined for association with clinical anxiety and depression.
Stage 2: We will perform candidate gene analysis study on the known human homologues of
the murine candidate genes identified in Stage 1. Genes that exhibit empirical pointwise p-values of

194
<0.05 from an allelic association test or haplotype-phenotype association analysis for association with
MDD will be selected for further validation. Genotype and clinical information from the Genetic
Association Information Network (GAIN) trial are available at http://www.ncbi.nlm.nih.gov/. Details
on the methods and study participants have been previously described (Boomsma et al. 2008).
Stage 3: Genotyping experiments will be performed on additional markers within genes that
correlate with major depression in stage 2. These markers include haplotype tagging SNPs and SNPs
projected to alter gene function (nonsynonymous SNPs and variants for polymorphic microRNA
(miRNA) binding sites). Genetic data, clinical information, and biological materials will be obtained
from the National Institute of Mental Health Center (NIMH) for Genomic Studies.
It is possible that some genes identified in our mouse QTL mapping analysis may not correlate
with major depression. In this case, we will look for similar connections or similar downstream
pathways that are shared among candidate behavioral despair genes. We can also compare our pre-
clinical findings to human studies that have examined a more homogenous patient population (e.g.,
patients with recurrent depression or early-onset major depressive disorder).
3. Candidate Gene Validation
3.1 Oprd1 in comorbid anxiety and depression
The locus on Chr 4 for depressive-like behavior has been previously linked with anxiety
behavior and responses to thermal pain. Of particular interest is the Oprd1 gene, which encodes for the
opioid receptor, delta1. The Oprd1 null mice display increased behavioral despair and anxiety-like
behavior, indicating that delta1 opioid receptor activity is critical for mediating both anxiety and mood
disorder (Filliol et al. 2000). Importantly, this result suggests that similar genetic mechanisms underlie

195
anxiety and major depression. To further examine the role of Oprd1 in comorbid anxiety and
depression, we can compare the behavioral effects of a delta-selective opioid agonist, selective
serotonin reuptake inhibitor (SSRI), and benzodiazepine in attenuating anxiety-like and depressive-like
responses. This study can be performed in strains with a) high anxiety-like and minimal depressive-like
behavior, b) low anxiety-like and high depressive-like behavior, and c) high anxiety-like and high
depressive-like behavior. Strains will be chosen following an exhaustive analysis of our behavioral data
and the data from other studies that have assessed several anxiety-like and depressive-like responses
between strains.
3.2 Dpp4 in depression
From our QTL mapping analysis, we identified a significant association between Dpp4 and
depressive-like responses. DPP4 is an ectoenzyme that cleaves polypeptides with proline and, to a
lesser extent, alanine at the penultimate position. In this study, we found that higher baseline
immobility scores are linked with reduced DPP4 protein levels. Compared to D2 mice, B6 mice have
higher immobility scores and higher plasma and brain DPP4 protein levels. There are six different
Dpp4 transcript variants that have been reported for B6. One of these isoforms leads to an alternative
protein product, which may explain the difference in DPP4 protein levels between B6 and D2 mice.
There was no difference in enzymatic activity between B6 and D2, which suggest that baseline inter-
strain behavioral differences are likely due to difference in DPP4 protein levels. This result concurs
with a mouse knockout study that showed Dpp4-/-
mice have lower immobility scores compared to
wild-type.
Treatment with sitagliptin resulted in greater than 80% inhibition of plasma DPP4 enzymatic
activity. However, no significant difference in depressive-like responses was observed between

196
vehicle- and sitagliptin-treated mice of either strain. It is likely that prolonged DPP4 inhibition is
required to mediate depressive-like responses. To assess the direction of the correlation between DPP4
and depressive behavior, we will evaluate the relationship between behavioral responses and DPP4
transcript levels, protein expression, and activity after long-term inhibition of sitagliptin. We will also
measure depressive-like responses in mice following intracranial administration of sitagliptin or
placebo to ascertain if reduction in brain DPP4 activity is required to affect behavior.
In agreement with this finding, strains that were less immobile or less “depressed-like” after
fluoxetine treatment exhibited lower mRNA expression of Dpp4 after fluoxetine administration (data
not reported), indicating a potential role of DPP4 in antidepressant therapy. Reduction in Dpp4 gene
expression after fluoxetine treatment corresponds with lower immobility. This result suggests a
potential role of DPP4 in antidepressant therapy. After the direction of the association between Dpp4
and depressive-like behavior has been established, we will examine the relationship between Dpp4 and
fluoxetine response. In this study, we will assess behavioral responses following administration of
water, fluoxetine, and fluoxetine plus sitagliptin.
4. Biochemical Marker Validation
Overall differences in neurobiochemical levels were observed for positive and negative
responders. Biochemical alterations following chronic fluoxetine treatment identified positive
responders, while baseline neurobiochemical differences differentiated negative responders. Results
show that glial fibrillary acidic protein (GFAP), S100 beta protein (S100β), GLO1, and histone
deacytelase 5 (HDAC5) contributed the most to fluoxetine response. These proteins are linked within a
cellular growth/proliferation pathway, suggesting the involvement of cellular genesis in fluoxetine
response.

197
Our research approach, if validated, provides an unprecedented and feasible means in which we
can investigate the effectiveness and clinical utility of new agents in non-responsive lines and strains
susceptible to depressive-like phenotypes, ultimately facilitating research efforts towards
antidepressant drug development. Unlike other mouse models, our treatment-resistant and depressive-
like prone strains were not habituated to exhibit more depressive-like features, nor were their genomes
manipulated. Our forward genetic approach uses multiple inbred mouse strains, thereby taking
advantage of the naturally-occurring genetic and phenotypic variation extant across inbred mouse
strains, which more closely parallels the genetic and phenotypic complexities in the heterogeneous
human population. Therefore, our mouse models more closely mimic the conditions of depressed
individuals and are powerful pre-clinical models for in vivo antidepressant screening and comparative
drug studies. For independent validation, we are using a different, but more robust, mouse model of
depression, as well as evaluating the antidepressive-like effects of other mood-altering agents.
Study 1: Strains previously shown to have differential depressive-like and anxiety-like
behavior at baseline will be selected for this study. We will assess baseline and chronic mild stress
(CMS)-induced hedonic responsiveness, behavioral despair, and anxiety-like behavior in the strains
that were previously shown to have variable depressive-like and anxiety-like behavior at baseline. The
chronic mild stress (CMS) behavioral paradigm presents several advantages. First, CMS is sensitive to
chronic antidepressant treatment, thereby providing predictive validity. CMS also reduces hedonic
responsiveness to pleasurable items, modeling anhedonia observed in depressed patients. Finally, CMS
elicits many of the depressive symptoms commonly found in humans, including reduction in sexual
behavior, increased HPA axis activity, and abnormal EEG measures, thereby providing good face
validity (Willner 1997; Willner et al. 1992) and making this test a robust animal model of depression

198
(Nestler and Hyman 2010). The first study will examine baseline responses to chronic mild stress
(CMS) to identify depressive-like prone strains, thus providing an independent validation of our
previous findings.
Study 2: Upon completion of the first study, the mice will be randomized to receive vehicle,
citalopram (20 mg/kg), or novel antidepressant agent UNC1 for 28 days. Mice will be exposed to
various stressors for 5 days during the second and third week of the treatment study to maintain stress-
induced hedonic state in the mice (Strekalova et al. 2006). After chronic treatment, the mice will be
tested in the open field, light/dark test, tail suspension test, and forced swim test. Preference and
consumption of sucrose-flavored water will be measured weekly using previously published protocols
(Strekalova et al. 2006). The goal of study 2 is to investigate the ability of citalopram and UNC1 to
reverse stress-induced depressive-like and anxiety-like response in susceptible and non-susceptible
strains, previously identified in study1. In this study, we will investigate if the same genetic and
biochemical markers of fluoxetine response can delineate treatment responders to other antidepressant
agents (citalopram and novel agent UNC1), providing an independent validation of predictive
biomarkers, which has not been done before in pre-clinical models of depression. Furthermore, we plan
to collectively assess molecular, biochemical, and behavioral parameters in order to establish a
composite measure of drug response.
Another important avenue for future study is the assessment of these biomarkers in easily
accessible samples, like plasma or serum, thus facilitating translation of pre-clinical findings in mice to
human studies. Current work in the lab aims to evaluate the relationship between behavioral responses
and serum levels of neurobiochemical markers across multiple inbred strains.

199
5. Conclusion
We conducted a comprehensive analysis of behavioral, neurobiochemical, and transcriptome
data across thirty mouse inbred strains, which has not been accomplished previously. We identified
biomarkers that influence fluoxetine response, which altogether, implicate the importance of cellular
genesis in fluoxetine treatment. More broadly, this approach can be used to assess a wide range of drug
response phenotypes that remain challenging to address using human samples.

200
REFERENCES
Boomsma DI, Willemsen G, Sullivan PF, Heutink P, Meijer P, Sondervan D, Kluft C, Smit G, Nolen
WA, Zitman FG, Smit JH, Hoogendijk WJ, van Dyck R, de Geus EJ, Penninx BW (2008)
Genome-wide association of major depression: description of samples for the GAIN Major
Depressive Disorder Study: NTR and NESDA biobank projects. Eur J Hum Genet 16: 335-42
Cohen RM, Kang A, Gulick C (2001) Quantitative trait loci affecting the behavior of A/J and CBA/J
intercross mice in the elevated plus maze. Mamm Genome 12: 501-7
Filliol D, Ghozland S, Chluba J, Martin M, Matthes HW, Simonin F, Befort K, Gaveriaux-Ruff C,
Dierich A, LeMeur M, Valverde O, Maldonado R, Kieffer BL (2000) Mice deficient for delta-
and mu-opioid receptors exhibit opposing alterations of emotional responses. Nat Genet 25:
195-200
Mogil JS, Richards SP, O'Toole LA, Helms ML, Mitchell SR, Belknap JK (1997) Genetic sensitivity to
hot-plate nociception in DBA/2J and C57BL/6J inbred mouse strains: possible sex-specific
mediation by delta2-opioid receptors. Pain 70: 267-77
Nakamura K, Xiu Y, Ohtsuji M, Sugita G, Abe M, Ohtsuji N, Hamano Y, Jiang Y, Takahashi N, Shirai
T, Nishimura H, Hirose S (2003) Genetic dissection of anxiety in autoimmune disease. Hum
Mol Genet 12: 1079-86
Nestler EJ, Hyman SE (2010) Animal models of neuropsychiatric disorders. Nat Neurosci 13: 1161-9
Scott MM, Marcus JN, Pettersen A, Birnbaum SG, Mochizuki T, Scammell TE, Nestler EJ, Elmquist
JK, Lutter M (2011) Hcrtr1 and 2 signaling differentially regulates depression-like behaviors.
Behav Brain Res 222: 289-94
Strekalova T, Gorenkova N, Schunk E, Dolgov O, Bartsch D (2006) Selective effects of citalopram in a
mouse model of stress-induced anhedonia with a control for chronic stress. Behav Pharmacol
17: 271-87
van Rijn RM, Brissett DI, Whistler JL (2010) Dual efficacy of delta opioid receptor-selective ligands
for ethanol drinking and anxiety. J Pharmacol Exp Ther 335: 133-9
Willner P (1997) Validity, reliability and utility of the chronic mild stress model of depression: a 10-
year review and evaluation. Psychopharmacology (Berl) 134: 319-29
Willner P, Muscat R, Papp M (1992) Chronic mild stress-induced anhedonia: a realistic animal model
of depression. Neurosci Biobehav Rev 16: 525-34
Yoshimura T, Yokota Y, Ishikawa A, Yasuo S, Hayashi N, Suzuki T, Okabayashi N, Namikawa T,
Ebihara S (2002) Mapping quantitative trait loci affecting circadian photosensitivity in retinally
degenerate mice. J Biol Rhythms 17: 512-9