Prairie Pothole Region Assessment Impact of U.S ... · PDF file199 9 200 0 200 1 200 2 200 3...
68
Prairie Pothole Region Assessment Impact of U.S. Department of Interior and U.S. Department of Agriculture Programs on Ecological Services Derived from Restored Prairie Wetlands and Adjacent Grasslands U.S. Department of the Interior U.S. Geological Survey
-
Upload
trinhtuong -
Category
Documents
-
view
216 -
download
1
Transcript of Prairie Pothole Region Assessment Impact of U.S ... · PDF file199 9 200 0 200 1 200 2 200 3...

Prairie Pothole Region Assessment
Impact of U.S. Department of Interior and U.S. Department of Agriculture Programs on
Ecological Services Derived from Restored Prairie Wetlands and Adjacent Grasslands
U.S. Department of the InteriorU.S. Geological Survey


THE WETLAND CONTINUUM:
A Conceptual Framework for Interpreting Biological Studies
N.H. Euliss, Jr., J.W. LaBaugh, L.H. Fredrickson,D.M. Mushet, M. K. Laubhan, G.A. Swanson,
T.C. Winter, D.O. Rosenberry, and R.D. NelsonU.S. Department of the InteriorU.S. Geological Survey

RechargeFlow ThroughDischarge
Wetland Hydrological Functions


Palmer Drought Severity Index, Division 5, ND (1895 to 2000)
-8
-6
-4
-2
0
2
4
6
818
95
1905
1915
1925
1935
1945
1955
1965
1975
1985
1995


05
1015202530354045
1992
1993
1994
1995
1996
1997
1998
1999
2000
2001
2002
2003
0
5
10
15
20
25
30
35
1992
1993
1994
1995
1996
1997
1998
1999
2000
2001
2002
2003
0
20
40
60
80
100
120
1992
1993
1994
1995
1996
1997
1998
1999
2000
2001
2002
2003
0
5
10
15
20
25
1992
1993
1994
1995
1996
1997
1998
1999
2000
2001
2002
2003
0
5
10
15
20
25
30
35
1992
1993
1994
1995
1996
1997
1998
1999
2000
2001
2002
2003
0
1
2
3
4
5
6
7
8
1992
1993
1994
1995
1996
1997
1998
1999
2000
2001
2002
2003
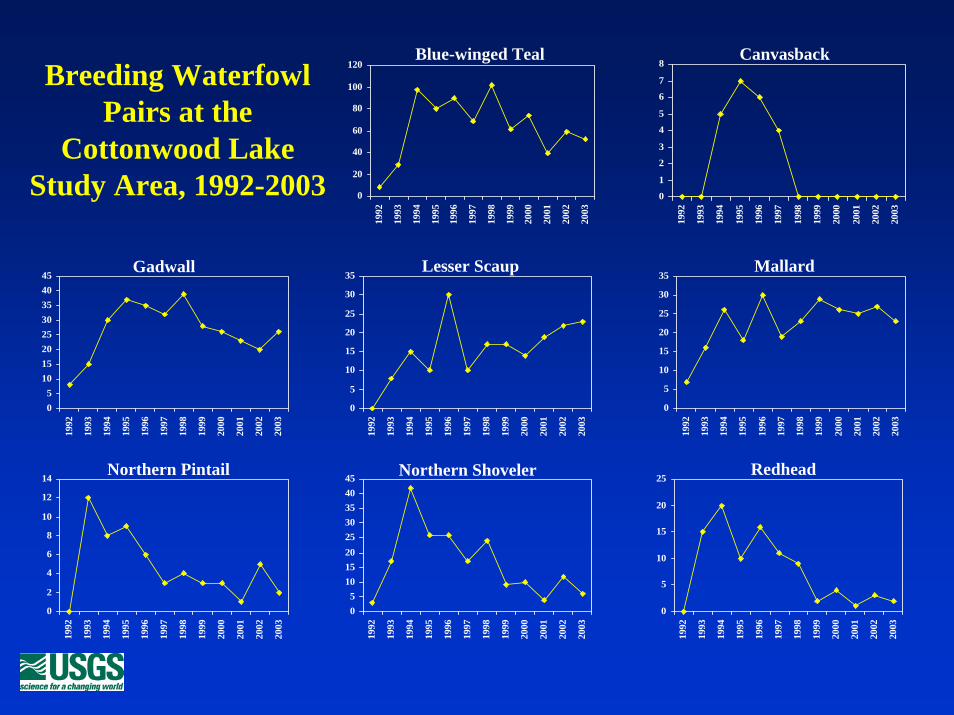
CanvasbackBlue-winged TealBreeding Waterfowl
Pairs at the Cottonwood Lake
Study Area, 1992-2003
Lesser Scaup Mallard
05
1015202530354045
1992
1993
1994
1995
1996
1997
1998
1999
2000
2001
2002
2003
Gadwall
Redhead
0
2
4
6
8
10
12
14
1992
1993
1994
1995
1996
1997
1998
1999
2000
2001
2002
2003
Northern Pintail Northern Shoveler
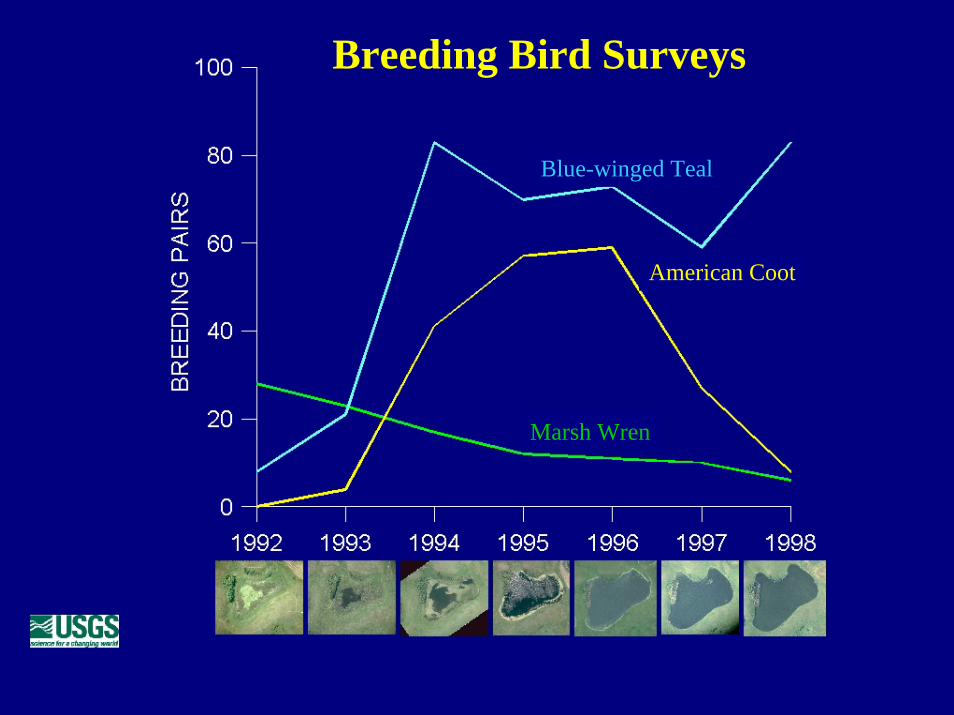
Blue-winged Teal
American Coot
Marsh Wren
Breeding Bird Surveys

Invertebrate Biomass (grams x 100)
0
200
400
600
800
1000
1200
14001994
1997
1995
1996
19931992
April May June July Aug. Sept.

0
500
1000
1500
2000
2500
1992 1993 1994 1995 1996 1997 1998
Closed Basin Semipermanent WetlandDischarge Wetland
Open Basin Semipermanent WetlandClosed Basin Seasonal Wetland
Tiger Salamander Captures in Cottonwood Lake Study Area
Wetlands

THE WETLAND CONTINUUMD
RO
UG
HT
D
EL
UG
EC
LIM
AT
E C
ON
DIT
ION
RECHARGE DISCHARGEHYDROLOGICAL RELATION TO GROUND WATER
TerrestrialPerennials
TerrestrialAnnuals
Early SeasonWetland
Perennials
RobustWetland
Perennials
WetlandAnnuals
SubmersedWetland
Perennials


WRP Sites in thePrairie Pothole Region
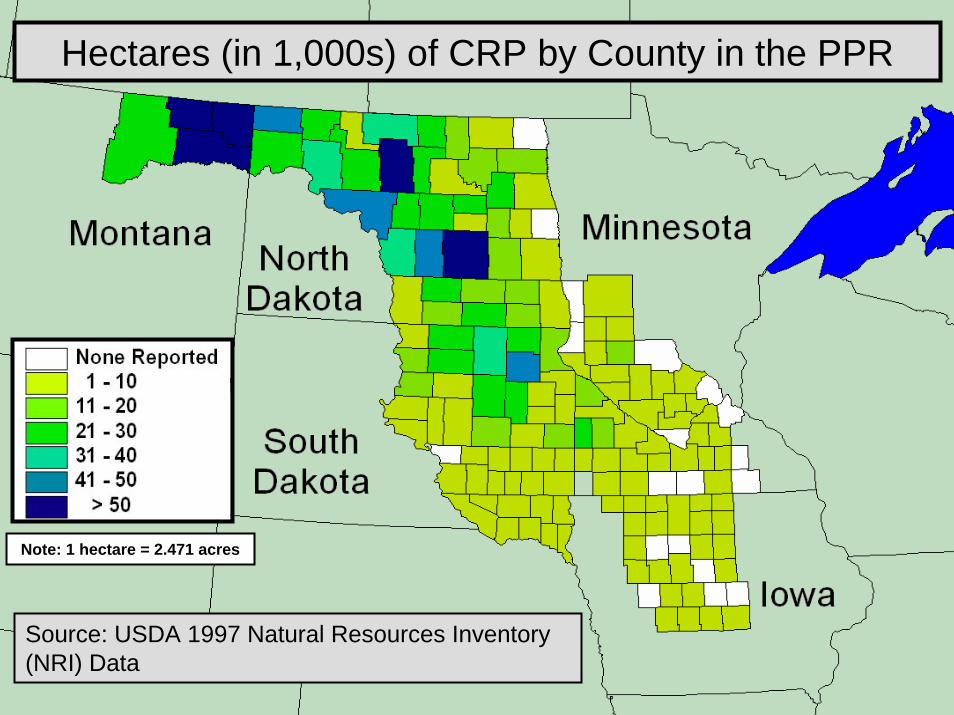
Source: USDA 1997 Natural Resources Inventory (NRI) Data
Hectares (in 1,000s) of CRP by County in the PPR
Note: 1 hectare = 2.471 acres

Gleason et al. (in Review)Gleason et al. (in Review)

Gleason et al. (in Review)
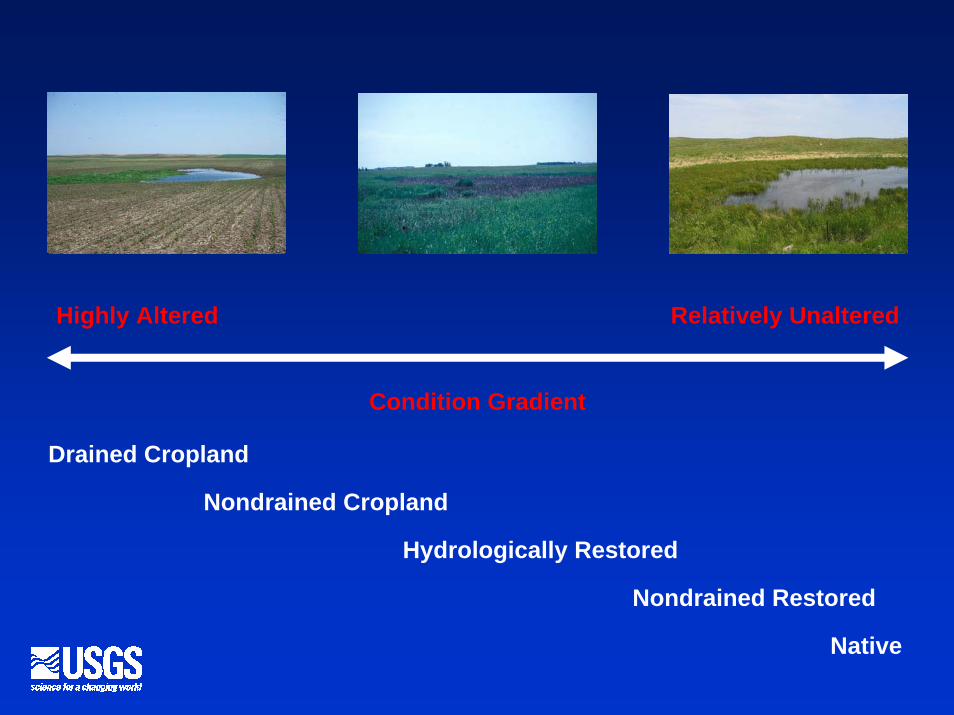
Condition Gradient
Highly Altered Relatively Unaltered
Drained Cropland
Nondrained Cropland
Hydrologically Restored
Nondrained Restored
Native

CRP or WRP Lands
Hydrologic restoration
Nondrainedrestoration
Years restored Years restored
1<5 5<10 >10 1<5 5<10 >10 Drained Nondrained Reference
Missouri Coteau
Temporary 5 5 5 5 5 5 5 5 5
Seasonal 5 5 5 5 5 5 5 5 5
Semipermanent 5 5 5 5 5 5 5 5 5
Glaciated Plains
Temporary 5 5 5 5 5 5 5 5 5
Seasonal 5 5 5 5 5 5 5 5 5
Semipermanent 5 5 5 5 5 5 5 5 5
Croplands Native PrairieRegion
Wetland Class

overflow / spillelevation
Upland zone
shoulder-slope
mid-slope
toe-slope
upland sub-zones
deep-marsh
shallow-marsh
wet-meadow
Wetland zone
wetland sub-zones
shoulder-slope
mid-slope
toe-slope
shallow-marsh
deep-marsh
wet-meadow overflow / spillelevation
Catchment
Upland zone Wetland zone
overflow / spillelevation
Upland zone
shoulder-slope
mid-slope
toe-slope
upland sub-zones
deep-marsh
shallow-marsh
wet-meadow
Wetland zone
wetland sub-zones
shoulder-slope
mid-slope
toe-slope
shallow-marsh
deep-marsh
wet-meadow overflow / spillelevation
Catchment
Upland zone Wetland zone
Gleason et al. (in Review)

shoulder-slope
mid-slope
toe-slope
shallow-marsh
deep-marsh
wet-meadow overflow / spelevation
Catchment
Upland zone Wetland zoneshoulder-slope
mid-slope
toe-slope
shallow-marsh
deep-marsh
wet-meadow overflow / spelevation
Catchment
Upland zone Wetland zone


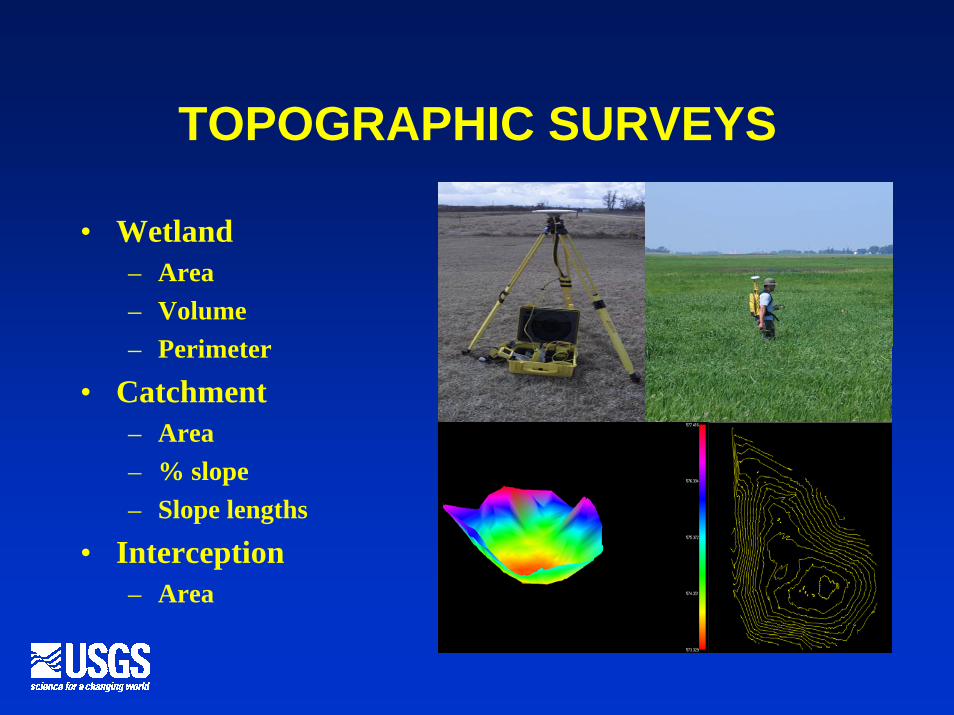
TOPOGRAPHIC SURVEYS
• Wetland– Area– Volume– Perimeter
• Catchment– Area– % slope– Slope lengths
• Interception– Area
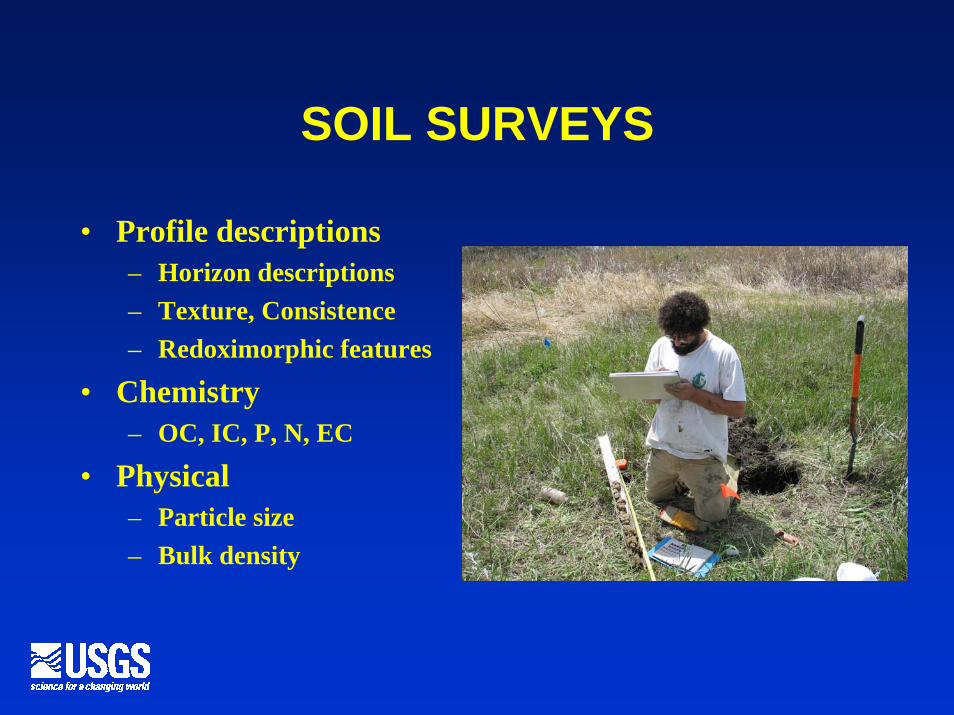
SOIL SURVEYS
• Profile descriptions– Horizon descriptions– Texture, Consistence– Redoximorphic features
• Chemistry– OC, IC, P, N, EC
• Physical– Particle size– Bulk density

VEGETATION SURVEYS
• Wetland and Catchment– Cover estimates– Species lists– Litter depths– Visual obstruction
(Robels)– Biomass clippings
(dry wt, TOC, P, N)

SPECIES SURVEYS?????????
• Wetland and Catchment– Species observations– Species lists
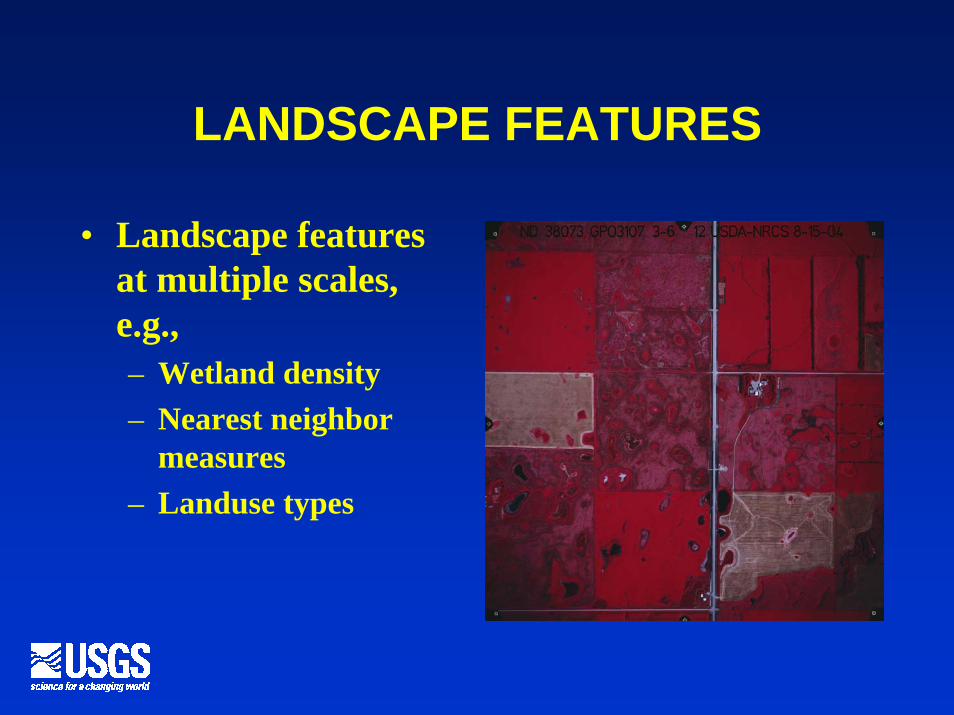
LANDSCAPE FEATURES
• Landscape features at multiple scales, e.g.,– Wetland density– Nearest neighbor
measures– Landuse types

RESTORATION STUDY (1997)
FY2004 PROJECTS
Type of drainage X X
Date of drainage X
History
Completeness of drainage X
Age of restoration (years) X X
Area (wetland, zones, catchment; ha) X X
Shoreline length (m) X X
Elevations (hydric, veg, zones, spill, etc.; m) X X
Volumes (ha-m) X X
GPS location, lat/long X X
Morphology (3-D toposurvey)
Gleason et al. (in Review)

RESTORATIONSTUDY (1997)
FY2004 PROJECTS
Number of veg zones X X
Width of veg zones (m) X X
Wetland class X X
% open water X X
Water Depth (m) X X
Floristic composition X X
Cover estimates (%) X X
Catchment cover type X X
Litter depth (m) and dry mass (g) X X
Robel readings and dry mass (g) X X
Seed banks X
Invertebrates Egg banks X
Vegetation
Gleason et al. (in Review)

RESTORATION STUDY (1997)
FY2004 PROJECTS
Soil SamplesOC, IC, P, N, PSA,texture (%) X X
EC (milimhos/cm), Ph(pH units) X X
Bulk density (grams/cm3) X XMini-soil profile description
Soil classification (family) X XLitter thickness (cm) X XBiomass X XRedox characteristics X XTexture X X
Soils/ Sediment
Gleason et al. (in Review)

RESTORATION STUDY (1997)
FY2004 PROJECTS
Soil QualityRoot pores XSoil consistency XGrade XSize XForm X
Hydric soil boundary X XBuried horizons X XSedimentation X (n=19)137-Cs and 210Pb dates X (n=19)Water depth (actual and maximum; m) X X
Natural outlet and inlets X XWetland class X X
Hydrology
Soils/ Sediment
Gleason et al. (in Review)

Service MeasureEstimate of water storage potentialFloodwater Storage
Floristic quality, taxon richness, habitat suitability
Biodiversity/Habitat Quality
Sedimentation and nutrient loading for wetlands in cropland, restored grassland and native prairie
Erosion, Sedimentation and nutrient loading potential
Estimates of soil and wetland vegetation carbon stocks
Carbon Sequestration
Comparison of rates of reduction greenhouse gas emissions from wetlands in cropland, restored grassland and native prairie
Greenhouse Gas Emissions Reduction

SURFACE AREA-VOLUME PREDICTIVE MODELS
02
468
101214
1618
1 2 3 4 5 6 7 8 9 10
WETLAND SURFACE AREA (ha)
WET
LAN
D V
OLU
ME
(ha-
m)
>9% (9-21%; n=37)PC(n=23)MC (n=171)6-9% (n=61)3-6% (n=147)GP (n=289)0-3% (n=238)

Flood Water Storage Service
Existing Storage Potential Storage
Existing and Potential Storage
(ha-m)
(ha-m)
(ha-m)
(ha-m)
(ha-m)

INTERCEPTION AREA PREDICTIVE MODELS
0
5
10
15
20
25
30
0 2 4 6 8 10
WETLAND AREA (ha)
PRED
ICTE
D IN
TER
CEP
TIO
N (h
a)
Haan and Johnson 1967Missouri CoteauPrairie CoteauGlaciated Plains RestorableGlaciated PlainsArndt and Richardson 1988

Existing Interception
Existing and Potential
InterceptionPotential
Interception
Interception Area
(ha)
(ha)
(ha)
(ha)
(ha)

Erosion, Sedimentation, and NutrientLoading Reduction Service
Estimate overall erodibility of catchment beforeand after restoration using Universal Soil Loss
Equations
Predicted soil loss from catchment (Mg/year)Before After4.69 0.06

0
10
20
30
40
Temporary Seasonal Semipermanent
Wat
er-L
evel
Flu
ctua
tion
(cm
)Grassland Cropland
Influence of Surrounding Land Use
* Data from Euliss and Mushet 1996

Influence of Surrounding Land Use
0
0.05
0.1
0.15
0.2
0.25
CRP Prairie Buffer Tilled
cm R
unof
f / c
m R
ain
* Data from Gleason 1996
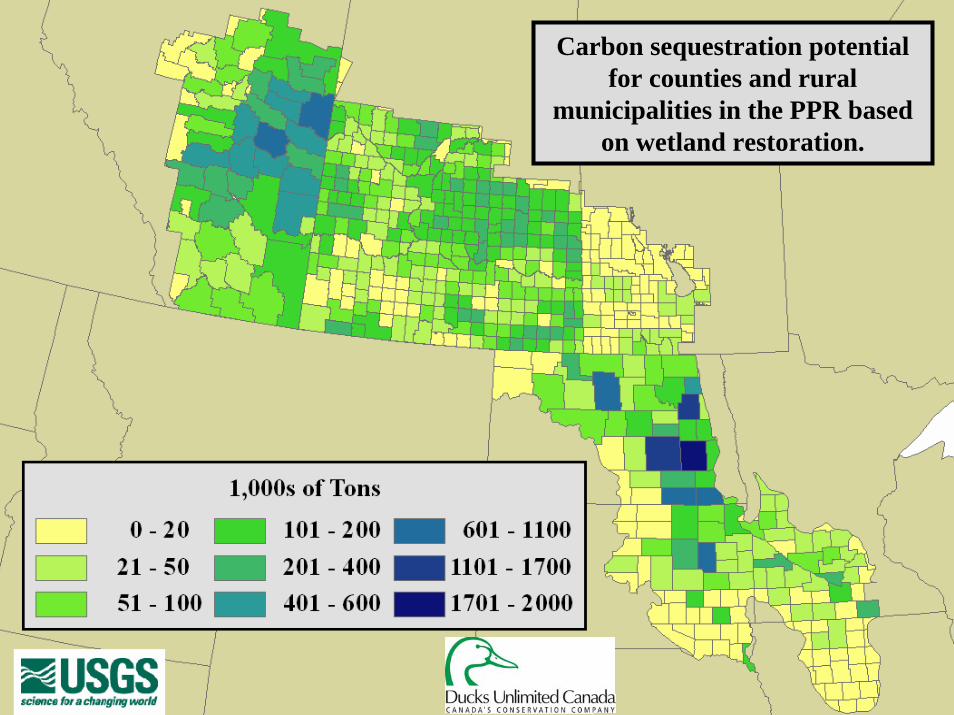
Carbon sequestration potential for counties and rural
municipalities in the PPR based on wetland restoration.

Carbon Sequestration Service
Condition Gradient
Highly Altered Relatively Unaltered
MLRA Cropland (OC Mg/ha) Restored (OC Mg/ha) Native (OC Mg/ha)102A 48.1 ? 73.4103 56.2 ? 76.753C 50.9 ? 54.9

Nitrous Oxide Flux From Farmed and Restored Wetlands
Sample Date21 MAY 4 JUN 18 JUN 2 JUL
N2O
(g h
a-1 d
-1)
0
5
10
15
20
25
30RESTOREDFARMED

Vegetative Biodiversity Service
Coefficient of Conservatism (C)• Value from 0-10 assigned to each
native species
• Values depict species toleranceto disturbance
• 0 = High tolerance to disturbance10 = Low tolerance to disturbance
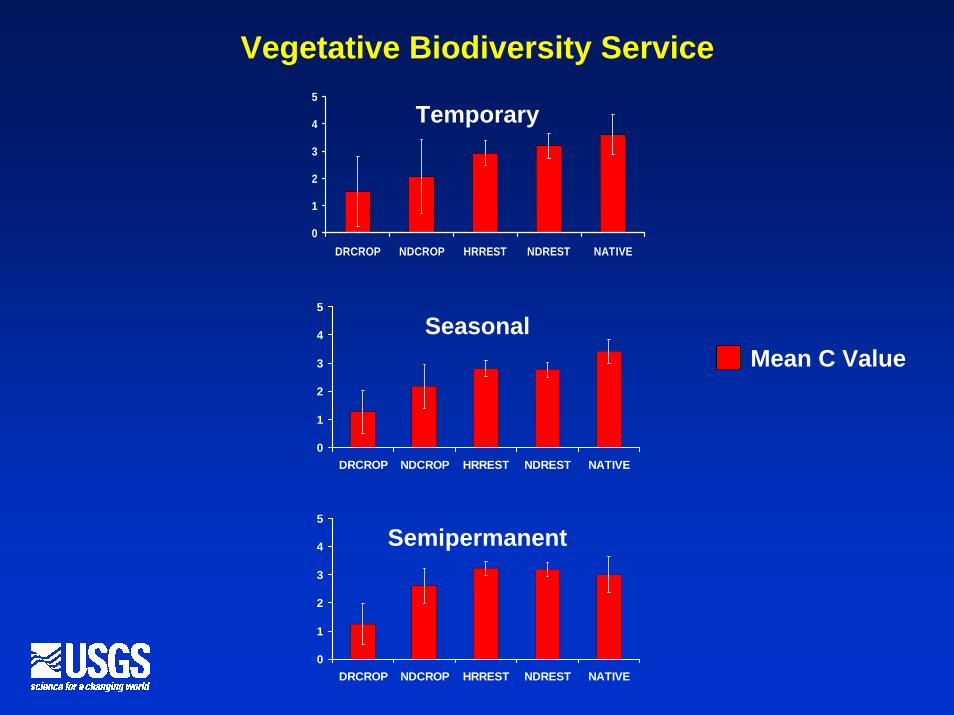
Mean C Value
Vegetative Biodiversity Service
0
1
2
3
4
5
DRCROP NDCROP HRREST NDREST NATIVE
Temporary
0
1
2
3
4
5
DRCROP NDCROP HRREST NDREST NATIVE
Seasonal
0
1
2
3
4
5
DRCROP NDCROP HRREST NDREST NATIVE
Semipermanent

Wildlife Habitat Service
• Compare published information on species habitat requirements to existing abiotic and vegetation conditions in wetlands surveyed to assess the potential habitat suitability
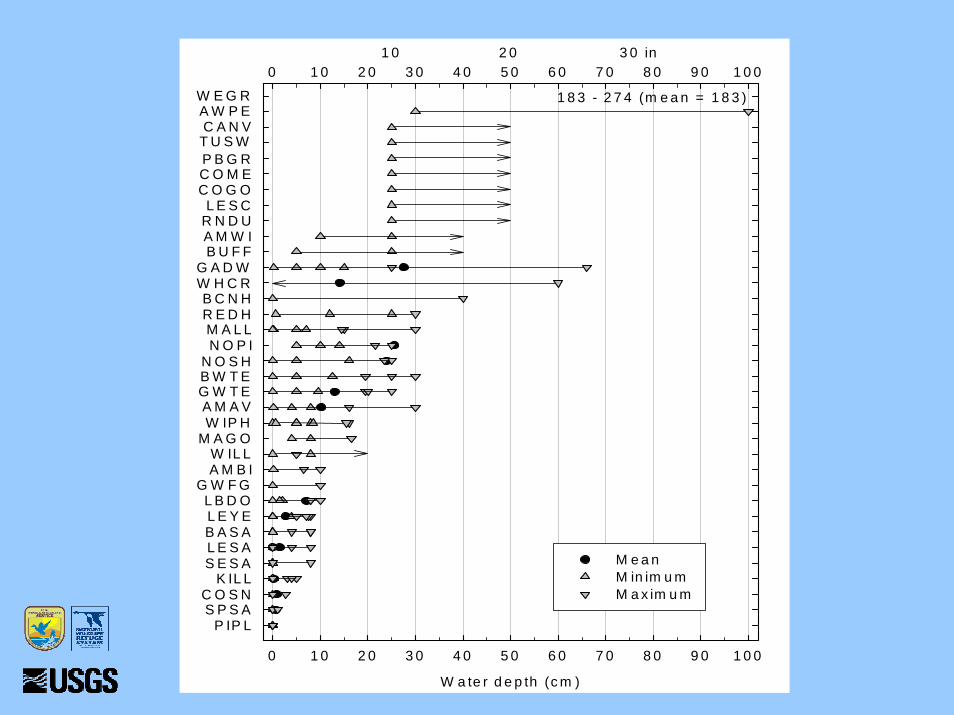
W a te r d e p th (c m )
0 1 0 2 0 3 0 4 0 5 0 6 0 7 0 8 0 9 0 1 0 0
0 1 0 2 0 3 0 4 0 5 0 6 0 7 0 8 0 9 0 1 0 0
M e a nM in im u mM a x im u m
1 0 2 0 3 0 in
W E G R
C A N VT U S W
A W P E
P B G R
B C N HW H C R
C O M E
B U F F
C O G OL E S C
W IP H
R N D U
R E D H
N O P I
A M W I
M A L L
G A D W
N O S H
G W T EB W T E
A M A V
L E S A
A M B I
M A G OW IL L
G W F GL B D OL E Y E
P IP L
B A S A
S P S AC O S N
S E S AK IL L
1 8 3 - 2 7 4 (m e a n = 1 8 3 )

V is u a l o b s tru c t io n re a d in g (c m )
0 5 1 0 1 5 2 0 2 5 3 0 3 5 4 0 4 5 5 0 5 5
0 5 1 0 1 5 2 0 2 5 3 0 3 5 4 0 4 5 5 0 5 5
M e a n M in im u mM in im u m (1 0 % )M in im u m (2 5 % )M a x im u m (7 5 % )M a x im u m (9 0 % )M a x im u m
5 1 0 2 0 in1 5
D IC KN O H A
G A D WM A L L
S E W R
C C S P
S E O WS A V S
B W T ES T G RG R S P
N O S HB O B O
N O P IB A IS
W E M ES O S P
S P P IU P S AC C L OL A B U
M A G OW IL L
H O L AK IL L

Land Use in a Single Township in the Glaciated Plains of the Prairie Pothole Region
Prior to Implementation of the Conservation Reserve Program (CRP)
After Implementation of the Conservation Reserve Program (CRP)
(Laubhan et al. in Review)
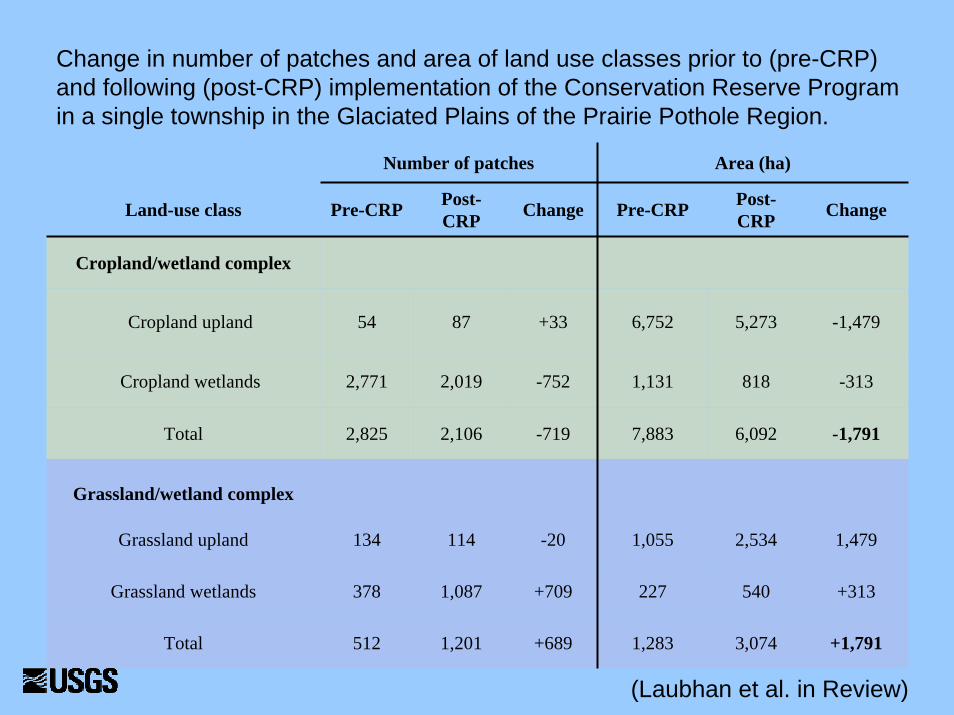
Change in number of patches and area of land use classes prior to (pre-CRP) and following (post-CRP) implementation of the Conservation Reserve Program in a single township in the Glaciated Plains of the Prairie Pothole Region.
Number of patches Area (ha)
Land-use class Pre-CRP Post-CRP Change Pre-CRP Post-
CRP Change
Cropland/wetland complex
Cropland upland 54 87 +33 6,752 5,273 -1,479
Cropland wetlands 2,771 2,019 -752 1,131 818 -313
Total 2,825 2,106 -719 7,883 6,092 -1,791
Grassland/wetland complex
Grassland upland 134 114 -20 1,055 2,534 1,479
Grassland wetlands 378 1,087 +709 227 540 +313
Total 512 1,201 +689 1,283 3,074 +1,791
(Laubhan et al. in Review)

Change in the number of suitable grassland patches for five grassland-dependent bird species in a PPR township.
Patch number
Species Spatial metric Requirement of bird (ha) State Citation Pre-
CRPPost-CRP Change
Upland Sandpiper Minimum area >10>70
MOMO
Samson 1980Winter 1998
264
3413
+8+9
Perimeter:area <0.008 NE Helzer and Jelinski1999 6 21 +15
Savannah Sparrow Minimum area >75 IL Walk and Warner 1999 4 13 +9
50% incidence >40 IL Herkert 1994 10 21 +11
Territory >15 IL O’Leary and Nyberg 2000 21 30 +9
Vesper Sparrow Minimum area >10 MO Samson 1980 26 34 +8
50% incidence >20 ME Vickery et al. 1994 18 27 +9
Grasshopper Sparrow Minimum area >12 IL Walk and Warner 1999 22 32 +10
50% incidence >30>70
ILIA
Herkert 1994Horn 2000
154
2513
+10+9
Perimeter:area <0.018 NE Helzer and Jelinski1999 28 36 +8
(Laubhan et al. in Review)

Median (–), interquartile (25-75%) range (box), and 10-90 quantile (10-90%) range (stems) of vegetation obstruction measurements for nine catchmenttypes in the vicinity of the Prairie Pothole Region township used as an example to illustrate a habitat-based approach for determining wildlife habitat suitability.
Visual vegetation obstruction (cm)
0 5 10 15 20 25 30 35 40 45 50 55 60 65 70
Cat
chm
ent t
ype
Cro
pR
esto
red
Nat
ive
TemporarySeasonalSemipermanent
(Laubhan et al. in Review)

Range (50% of observations) of visual obstruction measurements in the upland zone of 54 catchments sampled (n = 9 catchments in each type) in the vicinity of the example township in the Glaciated Plains and the range of visual obstruction estimates at nest sites of 10 bird species reported in the literature. Species that potentially could occur in a catchment type based on visual obstruction measurements are denoted with an “X”.
Species (range of reported visual obstruction [cm])1,2
Catchmenttype
Interquartilerange of upland
vegetation obstruction
(cm)
Mallard(14.7-42.0)
Sharp-tailed
Grouse(15.0-30.0)
Northern Harrier
(10.0-48.0)
Willet(0.0-20.0)
Upland Sand-piper(0.0-40.0)
Clay-colored
Sparrow(16.0-46.3)
Grass-hopper
Sparrow(13.0-33.6)
Dickcissel(17.0-67.0)
Bobo-link
(19.2-22.0)
Crop
Temporary 0.0-2.5 x x
Seasonal 0.0-0.0 x x
Semiperm-anent 0.0-0.0 x x
Restored
Temporary 22.5-40.6 x x x x x x x
Seasonal 20.0-40.0 x x x x x x x x x
Semiperm-anent 21.3-36.3 x x x x x x x x
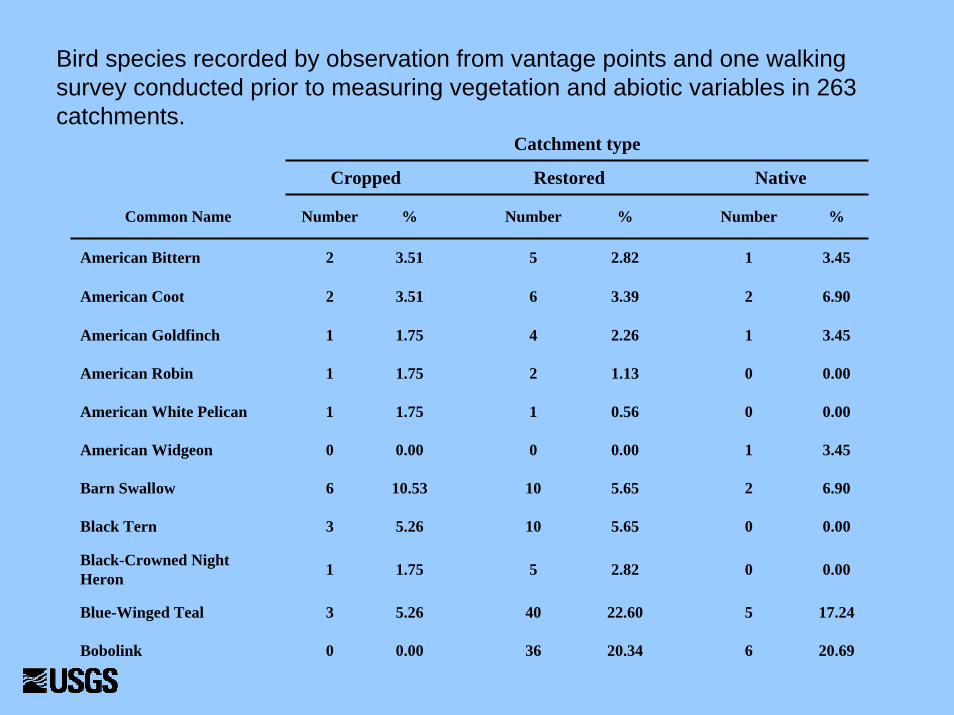
Bird species recorded by observation from vantage points and one walking survey conducted prior to measuring vegetation and abiotic variables in 263 catchments.
Catchment type
Cropped Restored Native
Common Name Number % Number % Number %
American Bittern 2 3.51 5 2.82 1 3.45
American Coot 2 3.51 6 3.39 2 6.90
American Goldfinch 1 1.75 4 2.26 1 3.45
American Robin 1 1.75 2 1.13 0 0.00
American White Pelican 1 1.75 1 0.56 0 0.00
American Widgeon 0 0.00 0 0.00 1 3.45
Barn Swallow 6 10.53 10 5.65 2 6.90
Black Tern 3 5.26 10 5.65 0 0.00
Black-Crowned Night Heron 1 1.75 5 2.82 0 0.00
Blue-Winged Teal 3 5.26 40 22.60 5 17.24
Bobolink 0 0.00 36 20.34 6 20.69

Supporting Model
Functions
•Element cycling andtransformation•Ground water recharge•Trophic structuresupport
•Organic matter production, decompositionand export•Plant biomass production
BIOVERSITYAnd
HABITATQUALITY
SEDIMENT ANDNUTRIENT
REDUCTION
Relatively Unaltered
Highly Altered
GradientCondition
FLOOD WATERSTORAGE
GREENHOUSEGAS EMISSIONS
REDUCTION
CARBONSEQUESTRATION