Practices and pitfalls in inferring neural representations
12
Practices and pitfalls in inferring neural representations Vencislav Popov a, b, *, 1 , Markus Ostarek c, 1 , Caitlin Tenison a, b a Department of Psychology, Carnegie Mellon University, 5000 Forbes Avenue, Baker Hall, 15289, Pittsburgh, PA, USA b Center for the Neural Basis of Cognition, 4400 Fifth Ave, 15213, Pittsburgh, PA, USA c Max Planck Institute for Psycholinguistics, PO Box 310, 6500, AH Nijmegen, The Netherlands ARTICLE INFO Keywords: Representation fMRI Encoding models Multivariate pattern analysis ABSTRACT A key challenge for cognitive neuroscience is deciphering the representational schemes of the brain. Stimulus- feature-based encoding models are becoming increasingly popular for inferring the dimensions of neural repre- sentational spaces from stimulus-feature spaces. We argue that such inferences are not always valid because successful prediction can occur even if the two representational spaces use different, but correlated, represen- tational schemes. We support this claim with three simulations in which we achieved high prediction accuracy despite systematic differences in the geometries and dimensions of the underlying representations. Detailed analysis of the encoding models' predictions showed systematic deviations from ground-truth, indicating that high prediction accuracy is insufficient for making representational inferences. This fallacy applies to the prediction of actual neural patterns from stimulus-feature spaces and we urge caution in inferring the nature of the neural code from such methods. We discuss ways to overcome these inferential limitations, including model comparison, absolute model performance, visualization techniques and attentional modulation. Introduction A key challenge for cognitive neuroscience is to understand the neural code that underlies the encoding and representation of sensory, motor, spatial, emotional, semantic and other types of information. To decipher the representational schemes of the brain, researchers often employ neuroimaging techniques such as functional magnetic resonance imaging (fMRI). fMRI measures the blood oxygenation level-dependent (BOLD) activation in the brain that is elicited when participants engage with different stimuli. The neural representation underlying each stimulus is assumed to have measurable but complex effects on the BOLD activation patterns. In order to understand what those patterns of activity can tell us about how the brain processes and represents information, researchers have used various analytical tools such as univariate subtraction methods, multivariate pattern (MVP) classification, representational similarity analysis (RSA) and, recently, explicit stimulus-feature-based encoding and decoding models (for reviews, see Davis and Poldrack, 2013, Haxby et al., 2014, or Naselaris et al., 2011). Despite their dif- ferences, all of these methods have the same goal – to quantify how changes in task conditions and the properties of the stimuli relate to changes in BOLD activation and vice versa. One way in which these methods differ is in how they achieve that mapping and in what in- ferences they allow us to draw. In this article, we review some of the known inferential limitations of existing fMRI analysis methods and we highlight an often-overlooked issue in interpreting results from stimulus-feature-based encoding and decoding models. The latter are steadily becoming the de facto gold standard for investigating neural representational spaces (Haxby et al., 2014; Naselaris and Kay, 2015). Using simulated data with known representational schemes, we demonstrate the limitations of these anal- ysis methods. These simulations, the accompanying code and the text also provide a useful guide for using encoding models to understand neural representations. Univariate vs. multivariate analysis Two of the main questions that any fMRI analysis technique attempts to answer are 1) where information is represented/processed and 2) what the nature of those representations is (Davis and Poldrack, 2013). Across the fMRI analysis techniques we review below it becomes apparent that understanding how information is represented is more difficult than un- derstanding where it is represented or processed. * Corresponding author. Carnegie Mellon University, 5000, Forbes Avenue, Baker Hall, 345G, Pittsburgh, PA, USA. E-mail address: [email protected] (V. Popov). 1 VP and MO contributed equally and should be considered co-first authors. Contents lists available at ScienceDirect NeuroImage journal homepage: www.elsevier.com/locate/neuroimage https://doi.org/10.1016/j.neuroimage.2018.03.041 Received 29 November 2017; Received in revised form 16 March 2018; Accepted 18 March 2018 Available online 22 March 2018 1053-8119/© 2018 Elsevier Inc. All rights reserved. NeuroImage 174 (2018) 340–351
Transcript of Practices and pitfalls in inferring neural representations

NeuroImage 174 (2018) 340–351
Contents lists available at ScienceDirect
NeuroImage
journal homepage: www.elsevier.com/locate/neuroimage
Practices and pitfalls in inferring neural representations
Vencislav Popov a,b,*,1, Markus Ostarek c,1, Caitlin Tenison a,b
a Department of Psychology, Carnegie Mellon University, 5000 Forbes Avenue, Baker Hall, 15289, Pittsburgh, PA, USAb Center for the Neural Basis of Cognition, 4400 Fifth Ave, 15213, Pittsburgh, PA, USAc Max Planck Institute for Psycholinguistics, PO Box 310, 6500, AH Nijmegen, The Netherlands
A R T I C L E I N F O
Keywords:RepresentationfMRIEncoding modelsMultivariate pattern analysis
* Corresponding author. Carnegie Mellon UniverE-mail address: [email protected] (V.
1 VP and MO contributed equally and should be
https://doi.org/10.1016/j.neuroimage.2018.03.041Received 29 November 2017; Received in revised fAvailable online 22 March 20181053-8119/© 2018 Elsevier Inc. All rights reserved
A B S T R A C T
A key challenge for cognitive neuroscience is deciphering the representational schemes of the brain. Stimulus-feature-based encoding models are becoming increasingly popular for inferring the dimensions of neural repre-sentational spaces from stimulus-feature spaces. We argue that such inferences are not always valid becausesuccessful prediction can occur even if the two representational spaces use different, but correlated, represen-tational schemes. We support this claim with three simulations in which we achieved high prediction accuracydespite systematic differences in the geometries and dimensions of the underlying representations. Detailedanalysis of the encoding models' predictions showed systematic deviations from ground-truth, indicating that highprediction accuracy is insufficient for making representational inferences. This fallacy applies to the prediction ofactual neural patterns from stimulus-feature spaces and we urge caution in inferring the nature of the neural codefrom such methods. We discuss ways to overcome these inferential limitations, including model comparison,absolute model performance, visualization techniques and attentional modulation.
Introduction
A key challenge for cognitive neuroscience is to understand the neuralcode that underlies the encoding and representation of sensory, motor,spatial, emotional, semantic and other types of information. To decipherthe representational schemes of the brain, researchers often employneuroimaging techniques such as functional magnetic resonance imaging(fMRI). fMRI measures the blood oxygenation level-dependent (BOLD)activation in the brain that is elicited when participants engage withdifferent stimuli. The neural representation underlying each stimulus isassumed to have measurable but complex effects on the BOLD activationpatterns. In order to understand what those patterns of activity can tell usabout how the brain processes and represents information, researchershave used various analytical tools such as univariate subtractionmethods, multivariate pattern (MVP) classification, representationalsimilarity analysis (RSA) and, recently, explicit stimulus-feature-basedencoding and decoding models (for reviews, see Davis and Poldrack,2013, Haxby et al., 2014, or Naselaris et al., 2011). Despite their dif-ferences, all of these methods have the same goal – to quantify howchanges in task conditions and the properties of the stimuli relate tochanges in BOLD activation and vice versa. One way in which these
sity, 5000, Forbes Avenue, BakerPopov).considered co-first authors.
orm 16 March 2018; Accepted 1
.
methods differ is in how they achieve that mapping and in what in-ferences they allow us to draw.
In this article, we review some of the known inferential limitations ofexisting fMRI analysis methods and we highlight an often-overlookedissue in interpreting results from stimulus-feature-based encoding anddecoding models. The latter are steadily becoming the de facto goldstandard for investigating neural representational spaces (Haxby et al.,2014; Naselaris and Kay, 2015). Using simulated data with knownrepresentational schemes, we demonstrate the limitations of these anal-ysis methods. These simulations, the accompanying code and the textalso provide a useful guide for using encoding models to understandneural representations.
Univariate vs. multivariate analysis
Two of the main questions that any fMRI analysis technique attemptsto answer are 1) where information is represented/processed and 2) whatthe nature of those representations is (Davis and Poldrack, 2013). Acrossthe fMRI analysis techniques we review below it becomes apparent thatunderstanding how information is represented is more difficult than un-derstanding where it is represented or processed.
Hall, 345G, Pittsburgh, PA, USA.
8 March 2018
V. Popov et al. NeuroImage 174 (2018) 340–351
The localization and the representational questions are related, butdistinct. This difference is most clearly exemplified in univariate sub-traction analyses. Before the advent of the more advanced techniques wereview below, the standard approach for analyzing fMRI data involvedcomparing how activity in a single voxel or averaged activity in acontiguous area of voxels differs between task conditions or stimuli (seeFig. 1). Researchers have used these univariate subtraction methodssuccessfully to understand the relative engagement of certain brain areasin specific tasks. For example, the observation that remembered stimulicause greater hippocampal activation during their encoding compared toforgotten stimuli, has corroborated conclusions from lesion studies aboutthe role of the medial temporal lobe in memory formation (Wagner et al.,1998).
Unfortunately, the coarse nature of this method precludes fine-grained inferences about the underlying representational content andcomputations that give rise to the observed BOLD signal. Univariatemethods assume that representational or processing differences betweenstimuli can be observed in individual voxels, and they ignore any re-lationships between different voxels (Davis and Poldrack, 2013). Byignoring the possibility that information might be represented in adistributed manner across voxels, the assumptions underlying univariatesubtraction methods limit their use in understanding neural representa-tions. In addition, these methods cannot tell us whether changes inactivation are due to representational preferences, processing differ-ences, or attentional variation among conditions (Coutanche, 2013).
In contrast, multivoxel pattern analysis (MVPA) techniques overcomethese limitations by looking at how various categories of stimuli or taskconditions lead to combinatorial differences (i.e. MVP classification) orsimilarities (i.e. representational similarity analysis, RSA, see Fig. 2) indistributed patterns of activity over multiple voxels. These methods havebecome popular partly because they allow researchers to relate brainstates to informational content. This can be highly useful for real-worldapplications, such as brain-computer interfaces (Lotte et al., 2007) andthe diagnosis of diseases (Ewers et al., 2011). More importantly for thepresent paper, MVPA methods make it possible to study neural repre-sentational spaces with greater sensitivity and resolution than univariateapproaches. For example, a seminal study by Haxby et al. (2001) found
Fig. 1. Univariate vs. Multivariate fMRI. In univariate fMRI (left), the average actanimal vs. tool words). In multivoxel pattern analysis (right), machine learning technactivation patterns (yellow box) and its classification performance is evaluated on a
341
that visual object categories can be classified based on the pattern ofactivation that their exemplars elicited in the ventral temporal cortex.The classification was successful despite the lack of overall activationdifferences in that region. Similar methods have been used to show thatconcepts have language-invariant representations in the anterior tem-poral lobe (Correia et al., 2014), that very similar visual scenes can bediscriminated in the hippocampus (Bonnici et al., 2012) and that duringtheir retrieval from memory, the shape, color and identity of visual ob-jects can be differentially decoded across several cortical areas (Cou-tanche and Thompson-Schill, 2015).
Despite early enthusiasm that MVPA methods could be used to un-derstand the structure of the neural code and the nature of the underlyingrepresentations (Norman et al., 2006), conventional MVP classificationand RSA techniques share one of the same fundamental inferential lim-itations of univariate methods. Researchers can use successful classifi-cation or careful inspection of confusions/similarity matrices to learnthat some relevant information about the stimulus class is present in thepopulation of analyzed voxels, thus answering the where question. How-ever, these methods cannot identify unambiguously exactly what thatinformation is (i.e., the stimulus category, category-related features, etc),or how it is represented and organized (Naselaris and Kay, 2015; Pol-drack, 2011; Tong and Pratte, 2012). Neural data is correlational, whichmeans that many different properties of the stimuli might lead to suc-cessful classification of the stimulus category, the task condition, or thebrain state in question. For example, successfully categorizing whether aword represents an animate or an inanimate object does not necessarilymean that the region of interest encodes that category distinction. Thereare many differences between animate and inanimate objects, such asdifferences in their sensory and functional features (Farah and McClel-land, 1991) that could be responsible for the successful classification.
In a similar argument, Ritchie et al. (2017) recently pointed out thatthe main reason behind this limitation is that linear classifiers are“informationally greedy”: they are likely to pick up any information thatdistinguishes the to-be-classified categories and it is therefore oftenimpossible to knowwhat that information is. This uncertainty can lead todisagreements between researchers looking at similar data. For instance,it remains unclear whether the orientation of a grating can be decoded
ivation level in a brain region is compared across experimental conditions (e.g.,iques are used to train a classifier to distinguish categories based on fine-grainedseparate test set (red box).

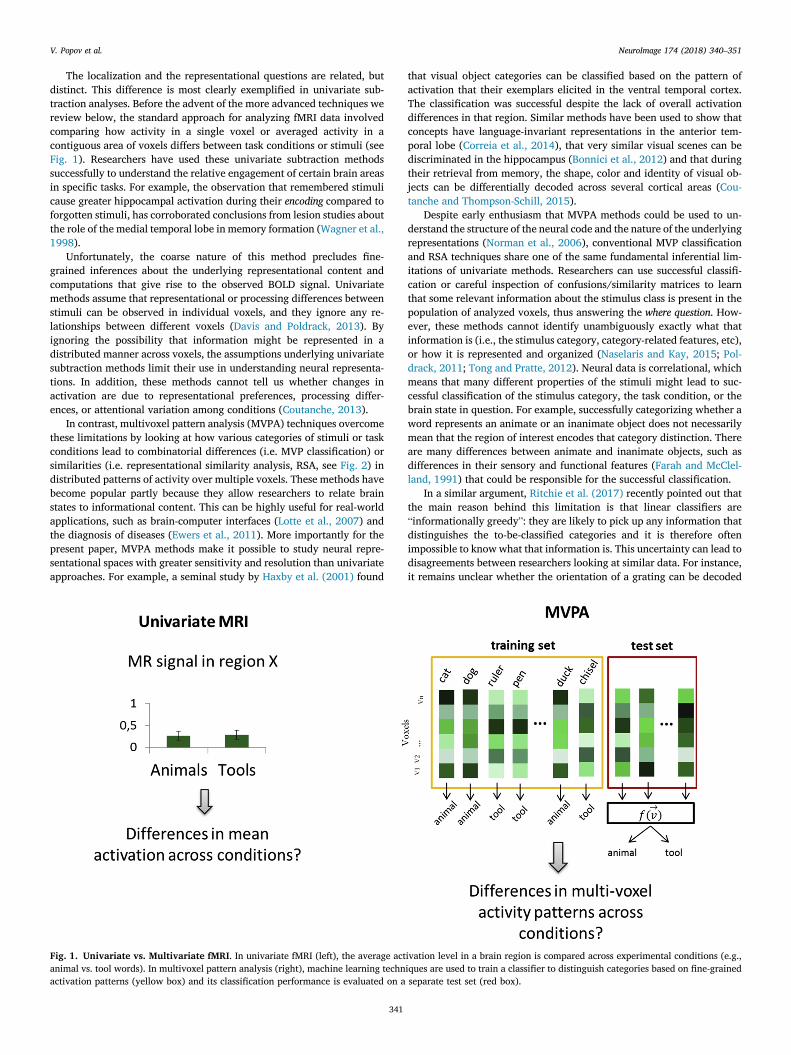
Fig. 2. Representational Similarity Analysis (RSA).Multivoxel activation patterns of all items or conditions (e.g., words) are estimated (top panel) and compared toeach other (typically by calculating 1 - correlation) to produce a representational dissimilarity matrix (RDM; middle panel) that abstracts away from the precisepatterns related to each item and instead quantifies their dissimilarity. RDMs derived from neural activation patterns can be correlated with model RDMs that reflecthypotheses about the organization of informational content in a given brain region. In this hypothetical example, the RDM based on activity patterns strongly cor-relates with the RDM derived from behavioral ratings of animacy, but not with the RDM derived from behavioral ratings of size.
V. Popov et al. NeuroImage 174 (2018) 340–351
from visual cortex because imperfect sampling of orientation-selectivecolumns leads to hyperacuity (Kamitani & Tong, 2005), because ofradial biases in the retinotopic map (Freeman et al., 2011), or because ofedge-related activity (Carlson, 2014). Ritchie et al. (2017) further sug-gest that relating classifier performance to behavior only partly remediesthe problem as “a brain region might carry information which is reliablycorrelated with the information that is actually used, but which is notitself used in behavior”.
Another limitation of conventional MVP classifiers is that they cannot
342
generalize and predict behavioral responses to novel types of stimuli ortask conditions. An MVP classifier is usually trained on stimuli that aretokens from several types. The relationship between these tokens andtypes impacts the generality of the classifier. The stimuli tokens might bedifferent category exemplars, and the classifier is trained to predict thetype of category to which they belong. In this case, the classifier can onlybe used to predict category membership of items that belong to one of thecategories on which it was trained. For instance, if one trains a classifierto predict the color of objects and trains it on yellow and orange objects

V. Popov et al. NeuroImage 174 (2018) 340–351
(Coutanche and Thompson-Schill, 2015), one will not be able to predictthe color of novel objects that are green. Alternatively, the tokens mightbe multiple presentations of the same word in different modalities orlanguages and the types are the unique words themselves. Even thoughthe classifier in this example could be used to predict exemplars in novellanguages or modalities, it is again restricted only to exemplars of thewords on which it was trained in the first place. In general, while thetokens being tested might be novel, they can be successfully classifiedonly if they are exemplars of a type that has already been trained on.
This methodological limitation is important - just as understandinghow the decimal system represents numbers allows people to understandand manipulate numbers they have never seen before, understandinghow a neural representational system works should allow researchers touse the neural pattern associated with novel stimuli to predict theiridentity, even if those stimuli are not exemplars of the types on which aparticular model was trained on.
Encoding models
To overcome these limitations many researchers are turning to anovel analysis method that is known by a few different names – voxelwisemodelling (Naselaris and Kay, 2015), stimulus-model based encodingand decoding (Haxby et al., 2014), voxel-based encoding and decodingmodels (Naselaris et al., 2011), and forward models (Brouwer andHeeger, 2009; Fernandino et al., 2016). For simplicity, we will refer tothis class of methods as encoding models.2
In contrast to MVP classifiers, which assign one of the trained cate-gory labels to a novel stimulus token, encoding models can predict theidentity of novel types of stimuli. They achieve that by attempting topredict the neural activity for a set of simpler features into which thestimuli can be decomposed (see Fig. 3). In a seminal study, Mitchell et al.(2008) predicted the neural activity associated with individual novelwords based only on the activation of other words. They decomposedeach word into a vector of weights on 25 sensory-motor semantic features(verbs such as “eat”, “taste”, “run”, “fear”, etc.). The weights were esti-mated from co-occurrence statistics of the word with each verb feature ina large corpus. They trained a classifier to predict the neural activityassociated with each constituent feature of a training set of words, whichresulted in separate neural activation maps for each feature. Neural ac-tivity for novel test words was then predicted highly accurately as a linearcombination of the semantic feature activation maps weighted by theassociation of the word with each feature. Based on these results,Mitchell et al. (2008) concluded that the neural representation of con-crete nouns might be based on sensory-motor features.
Similar approaches have been used to predict the neural response tonovel natural images using Gabor filter features (Kay et al., 2008), tonovel colors based on color tuning curve features (Brouwer and Heeger,2009), to novel music clips based on acoustic timbre features (Caseyet al., 2012), to natural sounds based on frequency, spectral and temporalmodulations (Santoro et al., 2014), to novel faces based on a PCAdecomposition of face features (Lee and Kuhl, 2016), to novel wordsbased on subjective sensory-motor ratings (Fernandino et al., 2016). Themotivating question behind many of these studies has been about thenature of the representations used by the brain in encoding the experi-mental stimuli, and the results are often cited as evidence that the neuralrepresentation is based on the constituent features of the stimuli used inthe model.
In general, most encoding models use the following analysis pro-cedure (see also Fig. 3):
2 Encoding usually refers to the prediction of neural patterns for the purposeof understanding the neural representational space, while decoding refers to thereconstruction of an experienced stimulus from neural data (Naselaris et al.,2011).
343
1 Specify a set of features that hypothetically underlie the representa-tion of a stimulus set in the brain
2 Decompose a set of stimuli into vectors of weights for each feature3 Select a region of interest (ROI) in the brain from which to analyze
neural activation4 Train a model to predict activity in each voxel for a training set of
stimuli, using the weights of their features as predictors5 Derive activation pattern maps (e.g. regression coefficients) associ-
ated with each feature6 .Predict neural activity in the ROI for novel stimuli, based on their
feature weights and the activation pattern maps for each feature7 Compare predicted neural activity for each novel stimulus with their
observed neural activity and derive a measure of fit and accuracy
Encoding models attempt to map a stimulus feature representationalspace, where each feature is a separate dimension, and each stimulus is apoint in that space, to a neural activation space, where each voxel or eachneuron is a separate dimension, and the activation pattern elicited byeach stimulus is a point in that space (Kriegeskorte and Kievit, 2013).
What can we infer about neural representations?
Encoding models have grown in popularity due to their many ad-vantages over more classical classification approaches. While there islittle doubt that these models are a useful and powerful analytic tool,their growing use requires us to carefully consider what we can andcannot conclude on the basis of above-chance prediction of neural ac-tivity. What can a successful mapping between a stimulus feature spaceand a neural activation space tell us about the nature of the representa-tion used by the brain? A common inference in some of these studies isthat if you can predict the identity of novel stimuli based on that map-ping, then the neural representation is likely based on the feature set usedby the model. Put formally, the inferential claim goes as follows:
� We can represent certain stimuli as a combination of lower-levelfeatures
� We can show that it is possible to predict the neural pattern caused bya novel stimulus in brain area A from an encoding model based onthese features
� Therefore, brain area A encodes those features and uses a represen-tational scheme based on them.
This claim has been made to different degrees both in theoretical andmethodological papers reviewing the approach (e.g., Haxby et al., 2014;Naselaris and Kay, 2015; Naselaris et al., 2011; Norman et al., 2006;Ritchie et al., 2017; Tong and Pratte, 2012), as well as in empiricalstudies that use it to address representational questions (Fernandinoet al., 2016; Kay et al., 2008; Mitchell et al., 2008; Santoro et al., 2014;although some are more cautionary, e.g. Lee and Kuhl, 2016). Whilesome authors have carefully restrained their discussion to the practicalbenefits of encoding models (Haxby et al., 2014; Davis and Poldrack,2013), the interpretative benefits of encoding models over MVP classi-fication are expressed strongly by many others (e.g., Naselaris and Kay,2015; Ritchie et al., 2017).
A useful illustration of this inference in practice comes from a recentstudy by Fernandino et al. (2016). The authors wanted to understand howconceptual information is represented in a set of higher-order non--modality-specific brain regions in the General Semantic Network (GSN;Binder et al., 2009). An encoding model based on subjective ratings for 5sensory-motor features (“color”, “motion”, “sound”, “shape”, “action”) oftraining words was used to predict neural activation patterns related tonovel individual words. The model successfully predicted above chancethe brain activity patterns for concrete words in the semantic networkregions (61%mean accuracy), but not in a set of control regions associatedwith visual word form processing. Based on these finding, Fernandino et al.(2016) suggested that “the brain represents concepts as multimodal

Fig. 3. Encoding models. Stimuli are broken down into a set of features that are hypothesized to underlie stimulus representation. During training, a model learns toassociate each feature's weights with voxel-wise activity, resulting in one feature activation map per feature. The model then predicts voxel-wise activity to unseen teststimuli as the linear combination of these feature activation maps weighted by the test items' association with each feature. Predicted activity is compared to theactually observed activity per voxel to quantify prediction accuracy.
V. Popov et al. NeuroImage 174 (2018) 340–351
combinations of sensory and motor representations” and that “heteromodalareas involved in semantic processing encode information about the relativeimportance of different sensory-motor attributes of concepts, possibly by storingparticular combinations of sensory and motor features” (p. 9763).
Putting aside the fact that 61% prediction rank accuracy is quite low,albeit above chance,3 the more important issue is that this inference isnot formally valid. We need to consider what the data would have lookedlike if the underlying neural representation was actually different(Mahon, 2015). In this example, the above-chance prediction of con-ceptual identity in the GSN based on an encodingmodel of sensory-motorfeatures does not necessitate the representational format in the GSN to besensory-motor in nature. The results might be obtained even if the GSN
3 In praxis, success of an encoding model is often defined as above-chanceprediction and thus treated like an all-or-nothing phenomenon. This is in partbecause absolute prediction values are difficult to interpret (Hebart and Baker,2017). However, attaining above-chance prediction does not justify strongclaims about the nature of neural representations.
344
uses amodal representations, as long as the representational space usedby the GSN and the sensory-motor features are correlated. This correla-tion could be driven by a non-arbitrary mapping between representationsin the GSN and sensory-motor features.
To illustrate, let us assume that the GSN instead encodes word co-occurrence statistics. As co-occurrence statistics correlate with sensory-motor feature ratings, it would be possible to predict GSN activity pat-terns above-chance based on these features, even though they are notdriving the activity patterns. Thus, while we can rule out the possibilitythat conceptual representations in heteromodal areas bear an arbitraryrelation to sensory-motor features, as has been argued by some pro-ponents of symbolic systems (Fodor & Pylyshyn, 1988), we cannotconclude that the GSN encodes multimodal sensory-motor informationon the basis of Fernandino et al. (2016) results. At most, we can say thatthe subjective sensory-motor relevance ratings that Fernandino et al.(2016) gathered for each concept capture some information representedin the GSN, but not whether this information is sensory-motor in nature.
This issue is akin to the affirming the consequent fallacy. It is the case thatif the brain uses a specific representational scheme, an encoding model

Table 1Limitations of representational analyses for fMRI.
Limitation Univariate MVP Encodingmodels
1. Ignores distributed information þ – –
2. Cannot predict activity for novel types ofstimuli
þ þ –
3. Sensitive to correlated sources ofinformation
þ þ þ
Table 2Examples of studies that use feature encoding models.
Source Item Features Response vector
Mitchellet al.(2008)
Concretewords(dog)
Co-occurrencestatistics with25 sensory-motor verbs
Pattern of activation in all corticalvoxels
Fernandinoet al.(2016)
Concretewords(dog)
5 sensory-motorrelevanceratings
Pattern of activation in the GSN(Binder et al., 2009)
Simulation1
Numbers(3497)
5 decimal digits[0 3 4 9 7]
17 binary digits [00 0 0 0 0 0 0 0 0 0 0 0 0 0 0 0 00 0 1 1 0 1 1 0 1 0 1 0 0 1]
Simulation2
Colors(skyblue)
RGB values,[135 206 235]
HSV values [197, 42.6, 92.2]
Simulation3
Colors(skyblue)
HSV values[197, 42.6,92.2]
Population code based on 5preferred values on each RGBdimension
V. Popov et al. NeuroImage 174 (2018) 340–351
that implements those feature will likely be able to predict neural activa-tion fairly well. However, we cannot reverse this claim – successful pre-diction of neural activity based of an encoding model does not guaranteethat the model in question is correct.4 We argue that information in onerepresentational system might be decoded or predicted above-chancebased on features from another, even if they use different representa-tional schemes, as long as there is at least a partially systematic mapping be-tween them, which causes their dimensions to be correlated. This limitation isshared with univariate and MVP approaches (see Table 1). There are atleast three ways in which mappings between representational systems canbe made and successful prediction can occur in two of those cases.
Types of mappings
Arbitrary mappings between representations
First, items from two representational systems might be related in anentirely arbitrary way, which results in no shared variance in their di-mensions. For example, the meaning of words is mostly unrelated to theirorthographic features,5 and the geographic locations of countries are notpredictive of their names, etc. More generally, consider two unorderedsets of items, A ¼ fA1;A2;…;Ang and B ¼ fB1;B2;…;Bng An arbitrarymapping between these two sets exists when the mapping from a specificitem in set A to a corresponding item in set B is unrelated to the mappingsbetween the remaining items in the two sets. In the context of encodingmodels and the brain, predicting the identity of novel items from one setwould be impossible based on a feature model from the other set, if thesetwo sets are not correlated.
Sets that use the same representational scheme
In contrast, a successful prediction can occur if the two sets use thesame representational scheme. Consider the set of multi-digit numbers inthe decimal system, A ¼ f10;11;…;427;…g, and the set of 10 digits inthe decimal system, B ¼ f0; 1; 2;3;4; 5; 6;7;8; 9g. These sets use thesame representational scheme to represent quantities (the decimal sys-tem), and there is a systematic linear mapping from the features (thedigits), to the multi-digit numbers, such that:
dndn�1…d1d0 ¼Xni¼0
ðdi � 10iÞ
3491 ¼ 3� 1000þ 4� 100þ 9� 10þ 1� 1
When we have such systematic mappings between systems that usethe same representational scheme, knowing the mapping function allowsus to decompose any item from set A as a combination of features fromset B. An example of such a mapping would be Fernandino et al. (2016)suggestion that the General Semantic Network encodes multimodal
4 This problem is similar, but not identical, to the problem of reverse inference(Poldrack, 2006).5 Whereas a minor degree of systematicity does seem to exist in this domain
(e.g., Monaghan et al., 2014), word meanings cannot be systematically predictedbased on their orthography and vice versa.
345
combinations of sensory-motor features by integrating information frommodality-specific sensory-motor areas. If this were true, then you couldpredict the neural pattern of novel items from their featural representa-tions, which is what that study found as well.
Sets that use different but systematically related representational schemes
However, there is an alternative, which would also allow you to makea successful prediction from encoding models due to shared variance innonequivalent representational spaces. Two sets can use differentrepresentational schemes, while at the same time maintaining a sys-tematic mapping between themselves. That systematicity results incorrelated dimensions and it allows us to predict the mapping of any onepair of items from knowledge of the mapping function. Within thecontext of conceptual representations in the brain, higher-level hetero-modal areas might use a representational code that is different from theone used by sensory-motor cortices, but the representational dimensionsin the two systems might be correlated.
For a simplified example, consider the relation between the decimaland the binary systems for representing numeric values. A binary rep-resented value can be transformed into a decimal number by applying thefollowing formula:
�dndn�1…d0
�2→
Xni¼0
ðdi � 2iÞ!
10
100112→1� 24 þ 0� 23 þ 0� 22 þ 1� 21 þ 1� 20 ¼ 1610 þ 210 þ 110
¼ 1910
Clearly, there is a systematic but non-linear mapping between thedecimal and the binary system, and yet, these two systems use differentcodes to represent numbers. If our argument is correct then it should bepossible to predict above chance the binary representation of a numberbased on a decimal feature encoding model. Below we present a simu-lation that achieves this by applying the encoding model approach oftenused in neuroimaging studies. Within the simulation, binary vectors areanalogous to voxel activation patterns, and the encoding model is basedon decimal representations (Table 2).
Simulation 1: predicting binary representations with a decimalfeature encoding model
6As detailed previously, encoding models predict stimulus identity
6 The code for all simulations is available at https://github.com/venpopov/inferential_pitfalls.

V. Popov et al. NeuroImage 174 (2018) 340–351
from brain activation by modelling the relationship between the con-stituent features of the training stimuli and their corresponding BOLDactivation in a group of voxels. Then they use that relationship to esti-mate the expected neural activation patterns for novel test items based ontheir feature representations. The predicted activation pattern for eachstimulus is compared to the observed patterns for all test stimuli. For thefollowing simulation, let us consider the numbers from 0 to 99 999 as ourstimulus set. They can be decomposed into 5-dimensional feature vectorswhere each feature is a decimal digit (e.g., 3497 can be decomposed as [03 4 9 7]. These features can be considered analogous to the 5 sensory-motor relevance ratings of words used by Fernandino et al. (2016) orto the co-occurrence statistics with sensory-motor verbs used by Mitchellet al. (2008). Further, let us consider the binary representation numbersas 17-dimensional vectors (e.g. [0 0 0 0 0 0 0 0 0 0 0 0 0 0 0 0 0 0 0 0 1 10 1 1 0 1 0 1 0 0 1], to be analogous to the BOLD activation pattern in a setof 17 voxels in an ROI under investigation. The correspondence betweenthese patterns and actual neuroimaging studies using this approach isdemonstrated in Table 2.
We trained an encodingmodel to predict the binary activation patternfor a given number, based on its 5-dimensional decimal feature repre-sentation. We performed a 10-fold cross-validation. The modelling fol-lowed 4 steps: 1) splitting the stimuli into a training (90%) and a test(10%) set, 2) fitting multiple linear regression models on the training setwith the 17 binary features as response variables, and the 5 decimalfeatures as predictors, 3) calculating predicted activation pattern (pre-dicted maps, PMs) for each test item from its decimal features and themultivariate regression model, 4) comparing the PMs with the actualbinary patterns for all test items (observed maps, OMs). In the compar-ison stage, we computed the Euclidean distance between each PM andthe OMs for all test items, and we calculated the percentile rank of thesimilarity between the PM and the OM of each item. For example, if thePM for the number 29782 were most similar to the OM for that number,then the percentile rank for it would be 10 000/10 000¼ 1. However, if itwere more similar to the OMs of 1000 other items, then its percentilerank would be 9000/10 000¼ 0.9.
The encoding model successfully predicted above chance the binaryrepresentation of untrained items based only on their decimal features(Maccuracy¼ 0.7, SD¼ 0.24, p< .0001, Wilcoxon signed rank test). Sinceby definition binary and decimal number systems use different repre-sentational schemes, we cannot conclude that the representation of bi-nary numbers encodes decimal features. By analogy, successfullypredicting patterns of neural activation based on a stimulus feature space,
Fig. 4. a) the RGB color space – black arrows show the three main color dimensionscolor space; b) the HSV color space – black arrows show the value, saturation and huspace. Images by Michael Horvath, available under Creative Commons Attribution-S
346
cannot be used to infer that the brain encodes information about thesefeatures or that its neural representational space is organized along thedimensions of that feature space.
Simulation 2: predicting a color represented in one color spacewith an encoding model in another color space
Another way to illustrate how two correlated, but distinct represen-tational spaces can be predicted from one another, is to use colorrepresentational spaces. Any color can be uniquely defined as a point in athree-dimensional space. There exist numerous color spaces, and in someof them the dimensions reflect three distinct colors that can be mixed indifferent proportions to produce any other color (e.g., RGB, CMY), whilein other color spaces the dimensions reflect attributes such as hue,saturation and lightness (e.g., HSL, HSV). RGB and HSV are both three-dimensional spaces; however, their dimensions are related non-linearly(see Fig. 4). As a result, their representational geometry is different,and for example, one color can be equally distant from two others in RGBspace, while it can be closer to one of them in HSV space. Despite this, theposition of colors within those two spaces are systematically but non-linearly related, and there exist a number of algorithms to convert RGBrepresentations to HSV and vice versa (for a primer on color spaces andcolor space conversions, see Ford and Roberts, 1998).
The goal of the following simulation was to demonstrate that we cansuccessfully predict the three valued HSV representation of novel colors,by training an RGB encoding model on a subset of randomly sampledcolors. For the stimuli, we used 1000 colors by selecting 10 equallyspaced values on each RGB dimensions. Thus, the stimulus features ofeach color were its three RGB values. The response vectors in this casewere the corresponding three HSV values for each color. The procedurewas otherwise identical to the one in Simulation 1. We performed a 10-fold cross-validation. Similar to Simulation 1, the encoding model basedon RGB color representations was able to predict the HSV color repre-sentations of untrained colors quite well (mean rank accuracy 0.82,SD¼ 0.22, p< .0001).
The current simulation allows us to illustrate how such a high pre-dictive accuracy in and of itself might not provide enough information tojudge how well the encoding model reflects the neural representationalspace. For each item, we can directly compare the predicted color fromthe encoding model with the actual color of the stimulus. In Fig. 5, weshow the “observed” ground truth and the predicted color for each testitem. Each panel shows hues for different combinations of saturation and
, whose values are subtracted to achieve the resulting color at each point in thee dimensions that are combined to determine the color of each point in the colorhare Alike 3.0 Unported license.

Fig. 5. Results from fitting the RGB-based encoding model on the HSV color stimuli. Each mini-panel shows observed and predicted colors for a specific saturation andvalue combination. Within each panel, bottom row shows the sequence of HSV stimuli (i.e., ‘ground truth’ or ‘observed colors’), and the top row shows the predictedcolor from the RGB encoding model.
V. Popov et al. NeuroImage 174 (2018) 340–351
value. Within each panel, the bottom half shows the actual color and thetop half shows the predicted color based on the RGB encodingmodel. Themodel fares well in predicting the value and the saturation of the color.However, while overall it captures the hue progression, there are sig-nificant deviations (e.g. failing to predict red colors, overpredictingyellow-brown colors, and underpredicting blue colors). These deviationsoccur because the model is trying to impose a linear transformation onnon-linearly related representational spaces. In summary, a high pre-dictive accuracy is not by itself sufficient to conclude that an encodingmodel reflects the nature of the underlying neural representation.
Discussion
Encoding models (Haxby et al., 2014; Naselaris et al., 2011) are apowerful new tool for studying how the constituent features of stimulirelate to the neural activation patterns elicited by these stimuli. Theyrepresent a significant methodological advance over more traditionalMVPA methods because they allow us to predict neural activation fornovel items and because they can be used to decode the identity of suchitems from neural data alone. While this is an impressive feat and anincredibly useful tool, we have to be cautious in interpreting what suchsuccesses mean for our understanding of the representational system ofthe brain. Both theorists (e.g., Haxby et al., 2014; Naselaris and Kay,2015; Naselaris et al., 2011; Norman et al., 2006; Tong and Pratte, 2012)and practitioners (e.g. Fernandino et al., 2016; Kay et al., 2008; Mitchellet al., 2008; Santoro et al., 2014) have suggested that we can infer that
347
the brain uses a certain set of features to encode information, if we cansuccessfully predict the activity of novel items from such features.However, as we have argued here, this inference is not formally valid.Successful prediction might be the result of a systematic relationshipbetween the representational system of the brain and the stimulus featureset, even if those utilize different representational schemes.
Representational equivalence – is it in the eye of the beholder?
How do we know whether two representational systems are trulydifferent? It could be argued that in our first example, both binary anddecimal number systems share many properties, and that they are merelydifferent implementations of the same fundamental representation. Forexample, both systems use the position of a digit to encode its magnitude,and as a result, all arithmetic procedures that can be performed withdecimal numbers can be applied to binary numbers as well. Despite thesesimilarities, the transformation required to get the decimal from the bi-nary representation of a number is non-linear. Linearity is important – ithas been argued that two representational spaces could be consideredequivalent only if there exists a linear transformation from one to theother (Naselaris et al., 2011). Linear transformations rotate multidi-mensional spaces, but do not change the nature of the representation,only the interpretation of the dimension. However, when the trans-formation required is non-linear, then the geometry of the underlyingrepresentational spaces is different (Kriegeskorte and Kievit, 2013).
We further propose that the key issue in determining whether two

V. Popov et al. NeuroImage 174 (2018) 340–351
representational system are equivalent is whether you can establish aone-to-one mapping relation between features at different levels of rep-resentation in each system. For example, if you substitute each decimaldigit with a unique letter, the resulting system would appear to be verydifferent from the decimal system only on the surface – the relation be-tween multi-digit numbers and their features would be the same in bothcases.7 In contrast, decimal and binary features have a qualitativelydifferent relation to the numbers they represent. Despite this, binaryrepresentations can be predicted based on decimal features, illustratingthe inferential problem of encoding models we address here.
Simulation 2 allowed us to illustrate this point more clearly bydirectly visualizing the differences in the geometries of RGB and HSVcolor spaces. While both color models use 3 dimensions to representcolors, these dimensions have distinct interpretations and can be relatedby a systematic non-linear transformation. The RGB color model is anadditive mixture space, in which any color is produced by mixing thethree primary colors in different proportions. In contrast, the HSV modelrepresents colors by specifying their hue (e.g., red), their saturation (i.e.,the intensity of the pigment), and their value (i.e., the darkness of thepigment). These three-dimensional representational spaces havedifferent geometries, such that the relative distances between colors arenot identical. Yet, training an encoding model to predict the HSV rep-resentation of novel colors based on the relationship between the RGBand HSV features of other colors, was highly accurate on average.
Where to go from here?
Model comparisonAn important question that naturally arises from the caveats we dis-
cussed is how one can maximize confidence in the outcome of a forwardencoding model approach, or conversely, guard oneself against unjusti-fied inferences. As others have noted, it is crucial to compare the per-formance of several possible encoding models (Haxby et al., 2014;Naselaris et al., 2011). If one model leads to a higher prediction accuracythan another, that is evidence that its features capture the variance of theneural representations better than the alternative model. However, it isnot sufficient to use a “baseline model” that is unrelated to the domain ofinterest (i.e., comparing a semantic feature model to a low-level visualword formmodel as exemplified by Fernandino et al., 2016). Instead, oneor several alternative representational models should be tested that arederived from competing theories (i.e., semantic model A vs. semanticmodel B). To illustrate, an elegant comparison of a sensory-based vs.non-sensory-based semantic model was achieved by Anderson et al.(2015). These authors contrasted a visual model with a wordco-occurrence model to investigate which brain regions representmodality-specific visual features, and which do not (using differentialcorrelation in RSA rather than an encoding model).
The relative superiority of a particular model at predicting activationpatterns in a brain region makes it more likely that the brain is using therepresentational scheme of the better performing model rather than thealternative. However, it is important to keep in mind that such compar-isons only provide evidence for the relative likelihood of eachmodel, but,due to the limitations discussed above, still do not allow us to infer thatthe winning model is the “true” model (Palminteri et al., 2017). Addi-tionally, when fitting these models, researchers need to account for dif-ferences in the number of parameters in each model and the risk ofoverfitting.
Absolute model performanceFor that reason, besides the assessment of relative model performance
based on model comparison, a second crucial step is to evaluate absolute
7 In fact, because of that linear one-to-one relationship, replicating oursimulation with these two examples leads to perfect prediction accuracy;compare that to the 0.7 prediction accuracy for the decimal-to-binary model.
348
prediction performance. In particular, the observed prediction accuracycan be compared to the “noise ceiling”, or to the “upper limit of pre-diction accuracy” (Naselaris et al., 2011), reflecting the maximal per-formance that can be feasibly achieved given the noise present in thesignal. The gap between the two can be thought of as the variance that isnot explained by the current model, which should motivate and guide thesearch for an improved or alternative version of the model. Until suchmaximal performance is obtained, we should be careful in making strongrepresentational inferences about the brain from the currently availableanalytic methods. It is important to note that assessing absolute modelperformance should not be done in isolation, but rather in combinationwith model comparison as a givenmodel may in principle reach the noiseceiling even if a more appropriate model exists.
Beyond the prediction accuracy: visualizing and comparing the organizationof predicted and observed neural activation patterns
It is important to note that even high decoding or predictive accuracyon its own is insufficient to establish representational equivalence.Despite the fact that in Simulation 2 our RGB encoding model predictedthe HSV representation with an 82% rank accuracy, a more careful in-spection of the actual and the predicted HSV colors revealed that thereare significant deviations in the model predictions. This is because theregression model is attempting to establish a linear rotation between thenon-linearly related RGB and HSV spaces.
This result should make us wary of making conclusions of represen-tational equivalence based on a single accuracy value, as is the practice insome published studies (e.g. Fernandino et al., 2016). Rather, it isimportant to examine the actual correspondence of the representationswith additional RSA methods or dimensionality reduction and visuali-zation techniques (e.g., Brouwer and Heeger, 2009; Foster et al., 2015).For example, in studying color representation in the early visual cortex,Brouwer and Heeger (2009) used principal components analysis (PCA)on the predicted voxel activation patterns and showed that the two maincomponents present in the signal corresponded well to the actual orga-nization of the colors in the color space they were using. Similarly, Fosteret al. (2015), who attempted to decode the orientation of lines that wereheld in visual working memory, showed that activity in the hypothesizedangular channels, on which their encoding model was based, follows agraded pattern that peaks at their preferred orientation. In summary, webelieve it is crucial to carefully examine the model predictions. If theencoding model reflects the actual representational space, there shouldbe no systematicity in the errors it makes, and the relations between thepredicted activation patterns should resemble the relations and the or-ganization of the observed activation patterns.
Attentional modulationUltimately, many of these inferential caveats exist because fMRI data
is correlational. Comparing alternative models and evaluating absoluteprediction performance might eventually converge on the true underly-ing feature model, but this is not guaranteed. We propose that an evenbetter way to test representational hypotheses might be to experimen-tally manipulate the hypothesized representational dimensions. Forexample, one could prime participants to weight or attend to some fea-tures of the stimuli more than others. This type of attentional modulationdecreases noise in the correlated activity between individual neurons,which enhances population coding (Downer et al., 2015), and it alsoincreases selectivity of individual neurons for task-relevant stimulusfeatures (Sigala and Logothetis, 2002). Thus, if orienting attention tosome features of the stimuli improves the ability of an encoding modelbased on those features to predict neural activity, this would constitutemuch stronger evidence for the viability of the model.
Relatively little work exists to evaluate this proposal with fMRI,although three recent studies present promising results with an atten-tional modulation method that could eventually be extended to encodingmodel analyses as well. Çukur et al. (2013) showed that when partici-pants were searching for people or for vehicles in movie clips, individual

Fig. 6. Results of the attentional modulation simulation – mean rank accuracy in predicting neural population codes generated from an RBG model, depending onwhether attention is focused on none of the dimensions (‘no’), the R, the G or the B dimension. Each row shows results for different values of the Gaussian noisestandard deviation parameter; each column shows the attentional selectivity parameter, e.g., the reduction in the width of the Gaussian response of each “neuron” tothe attended dimension.
V. Popov et al. NeuroImage 174 (2018) 340–351
voxels became more attuned to the attended category. This occurredregardless of whether the target category was actually present in a scene.Importantly, this tuning shift was progressively stronger in higher-ordervisual areas compared to early retinotopic visual areas. Thus, attentionaltuning likely reflects the fact that some aspect of the attended informa-tion is being represented in a specific ROI. Relatedly, Braunlich and Love
349
(2018), showed that when one feature of artificial category stimuli be-comes more relevant for a categorization task, the ability to predict thepresence of that feature increased. Additionally, they demonstrated thatpredictive accuracy correlated with attentional modulation parametersderived by cognitive models of conceptual representation.
Even more relevant is a recent study by Nastase et al., (2017), who

8 This would be analogous to asking participants to 1) discriminate betweencolors; to respond which color is more 2) red, 3) blue or 4) green.
V. Popov et al. NeuroImage 174 (2018) 340–351
extended this approach to representational similarity analysis. Partici-pants saw a sequence of short clips with animals performing certain be-haviors, and they had to respond to each clip in one of two ways. In onecondition, the task was to say whether the animal in the current clip isfrom the same taxonomic category as the animal in the previous clip. In theother condition, participants had to respond whether the animal wasperforming the same behavior as the animal in the previous clip. Theauthors derived two representational dissimilarity matrices for thestimuli – one based on the taxonomic dissimilarity, and one based on thedissimilarity in the behavior that the animals performed. They calculatedthe correlation of these two representational dissimilarity matrix (RDM)with an RDM derived from the neural signal. When participants attendedto the taxonomic category of the animals, the correlation between theneural and the taxonomic RDM increased. In contrast, attending to theanimal's behavior increased the correlation of the neural RDM with thebehavioral RDM.
Perhaps the most relevant finding of the study is that even thoughthere was a significant correlation between the model RDMs and theneural RDMs in several regions, attentional modulation did not increasethe correlation in all of them. For example, while the behavioral modelcorrelated with neural activity in both the early visual cortex, and in post-central parietal regions involved in motion perception, attending to thebehavior of the animals increased the correlation only in the latter re-gions. Thus, on the basis of the overall correlation one might haveconcluded that behavior is represented even in early visual cortex;however, the lack of the attentional modulation in those areas indicatesthe overall correlation might have been driven by some visual informa-tion that is simply confounded with the animal's behavior. Similarly,taxonomic information correlated with the early visual cortex and theventrotemporal cortex, but attending to taxonomy increased the corre-lation only in the latter. Nevertheless, one caveat to this proposal is thatsome brain areas might not be susceptible to attentional modulation. Forthat reason, it is important to note that while the presence of attentionalmodulation increases support for the model, the absence of such does notnecessarily reduce it, and such inferences should be made with care.
Overall, these results provide some indication that modulatingattention to specific features of the stimuli can be beneficial in deter-mining whether successful prediction reflects the nature of the neuralrepresentation, or whether it is picking up systematically related infor-mation instead. We expect that this technique can be effectively extendedto encoding models as well, as illustrated in Simulation 3.
Simulation 3: attentional modulationOne potential caveat to our proposal is that attentional modulation
might increase performance even for incorrect models, if attention isfocused on features that are highly correlated between the models. Itseems natural to suggest that the extent to which attentional modulationwill allow discrimination between models depends inversely on the de-gree to which that the attended dimension is correlated in the twomodels.
To test this intuition, we performed a third simulation, in which weextended our color prediction example. As we discussed above, one of theconsequences of attentional modulation is the increased sensitivity ofneurons to their preferred stimulus. In order to simulate attentionalmodulation, this time we simulated neural data from the RGB space in adifferent way. We assumed that each dimension is represented by apopulation code of five units, where each unit had a different preferredvalue on that dimension and its activity followed a Gaussian distributionaround that preferred value (similarly to Foster et al., 2015). Thepreferred values were equally spaced from 0 to 1 (i.e., 0.1, 0.3, 0.5, 0.7,0.9), and the default standard deviation of the response was 1 in theabsence of attentional modulation. We additionally added Gaussian noiseto the activity of each neuron, because prediction was nearly perfect forthe correct RGB model.
To simulate increased selectivity due to attentional modulation, wereduced the width (i.e. the standard deviation) of the Gaussian response
350
function for units that coded the attended dimension, and we increasedthe maximal response. The final response vector had 15 units, 5 for eachof the three dimensions, and we compared how successful the RGBgenerating model and the alternative incorrect HSV model were in pre-dicting the neural responses depending on four conditions – no atten-tional modulation, attending to the R, to the G or to the B dimension.8
The R dimension was the least correlated on average with the HSV model(r ¼ 0.24), followed by the G (r ¼ 0.38) and the B (r¼ 0.41).
We expected that for the true RGB model, the increase in predictiveaccuracy would be the same regardless of which dimension attention wasfocused on. However, for the incorrect HSV model, we expected that theincrease will be proportional to how strongly the attended dimension wascorrelated with the model. We ran the simulation for a range of noise andselectivity parameters, and the results are presented in Fig. 6. Our pre-dictions were confirmed across all parameter values. In summary, apredictive accuracy increase due to attentional modulation should in-crease trust in the model to the degree to which 1) focusing on thedifferent dimension produces equivalent increases and 2) the attendeddimension is not correlated with alternative models. This further suggeststhat attentional modulation might help identify which features of themodel are more likely to capture a feature of the underlyingrepresentation.
Final remarks
Many of the points we have raised here are not specific to encodingmodels, but can also be leveled against any other method currently in usefor understanding neural representations. The reason why we focusedhere on encoding models is that they are becoming increasingly popular,and we believe it is important to highlight their limitations. The speed atwhich multivariate methods have developed since Haxby et al. (2001)seminal study on multivariate analyses illustrates the importance of thesemethods to the neuroscientific community. Encoding models have manyadvantages over more traditional MVPA techniques, such as the ability todecode or predict activity for items that the model has not been trainedon. However, because encoding models are so powerful, it is important tounderstand what inferences we can and cannot draw from them. There islittle doubt that successful prediction or decoding in a certain brain areatells us a lot about where in the brain the information might be repre-sented. The question of how those representations are organized, albeit,is more difficult and cannot be answered only on the basis of a singlesignificant prediction value. Our hope with this commentary is not todownplay the important role of these methods, but to further the dis-cussion about what we can and cannot learn by using them.
Author contributions
Conceptualization, V.P and M.O; Formal Analysis,V.P; Writing –
Original Draft, V.P. and M.O.; Writing – Review& Editing, V.P., M.O. andC.T; Visualization, M.O. and V.P.
Declarations of interest
None.
Acknowledgements
We are grateful to Marc Coutanche, Timothy Verstynen and BrianMacWhinney for comments on a previous version of this draft. Thisresearch did not receive any specific grant from funding agencies in thepublic, commercial, or not-for-profit sectors.

V. Popov et al. NeuroImage 174 (2018) 340–351
References
Anderson, A.J., Bruni, E., Lopopolo, A., Poesio, M., Baroni, M., 2015. Reading visuallyembodied meaning from the brain: visually grounded computational models decodevisual-object mental imagery induced by written text. NeuroImage 120, 309–322.
Binder, J.R., Desai, R.H., Graves, W.W., Conant, L.L., 2009. Where is the semanticSystem? A critical review and meta-analysis of 120 functional neuroimaging studies.Cereb. Cortex 19 (12), 2767–2796.
Bonnici, H.M., Kumaran, D., Chadwick, M.J., Weiskopf, N., Hassabis, D., Maguire, E.A.,2012. Decoding representations of scenes in the medial temporal lobes. Hippocampus22 (5), 1143–1153.
Braunlich, K., Love, B.C., 2018, February 14. Occipitotemporal Representations ReflectIndividual Differences in Conceptual Knowledge bioRxiv, 264895. Retrieved from.https://www.biorxiv.org/content/early/2018/02/14/264895. https://doi.org/10.1101/264895.
Brouwer, G.J., Heeger, D.J., 2009. Decoding and reconstructing color from responses inhuman visual cortex. J. Neurosci. 29 (44), 13992–14003.
Carlson, T.A., 2014. Orientation decoding in human visual cortex: new insights from anunbiased perspective. J. Neurosci. 34 (24), 8373–8383.
Casey, M., Thompson, J., Kang, O., Raizada, R., Wheatley, T., 2012. Population CodesRepresenting Musical Timbre for High-level fMRI Categorization of Music Genres. InMachine Learning and Interpretation in Neuroimaging. Springer Berlin Heidelberg,pp. 34–41.
Correia, J., Formisano, E., Valente, G., Hausfeld, L., Jansma, B., Bonte, M., 2014. Brain-based translation: fMRI decoding of spoken words in bilinguals reveals language-independent semantic representations in anterior temporal lobe. J. Neurosci. 34 (1),332–338.
Coutanche, M.N., 2013. Distinguishing multi-voxel patterns and mean activation: why,how, and what does it tell us? Cognit, Affect. Behav. Neurosci. 13 (3), 667–673.
Coutanche, M.N., Thompson-Schill, S.L., 2015. Creating concepts from convergingfeatures in human cortex. Cereb. Cortex 25 (9), 2584–2593.
Çukur, T., Nishimoto, S., Huth, A.G., Gallant, J.L., 2013. Attention during natural visionwarps semantic representation across the human brain. Nat. Neurosci. 16, 763–770.
Davis, T., Poldrack, R.A., 2013. Measuring neural representations with fMRI: practicesand pitfalls. Ann. N. Y. Acad. Sci. 1296 (1), 108–134.
Downer, J.D., Niwa, M., Sutter, M.L., 2015. Task engagement selectively modulatesneural correlations in primary auditory cortex. J. Neurosci. 35 (19), 7565–7574.
Ewers, M., Sperling, R.A., Klunk, W.E., Weiner, M.W., Hampel, H., 2011. Neuroimagingmarkers for the prediction and early diagnosis of Alzheimer's disease dementia.Trends Neurosci. 34 (8), 430–442.
Farah, M.J., McClelland, J.L., 1991. A computational model of semantic memoryimpairment: modality specificity and emergent category specificity. J. Exp. Psychol.General 120 (4), 339.
Fernandino, L., Humphries, C.J., Conant, L.L., Seidenberg, M.S., Binder, J.R., 2016.Heteromodal cortical areas encode sensory-motor features of word meaning.J. Neurosci. 36 (38), 9763–9769.
Fodor, J.A., Pylyshyn, Z.W., 1988. Connectionism and cognitive architecture: a criticalanalysis. Cognition 28, 3–71.
Ford, A., Roberts, A., 1998. Color Space Conversions. Retrieved from. http://www.poynton.com/PDFs/coloureq.pdf.
Foster, J.J., Sutterer, D.W., Serences, J.T., Vogel, E.K., Awh, E., 2015. The topography ofalpha-band activity tracks the content of spatial working memory. J. Neurophysiol.115 (1), 168–177.
Freeman, J., Brouwer, G.J., Heeger, D.J., Merriam, E.P., 2011. Orientation decodingdepends on maps, not columns. J. Neurosci. (13), 4792–4804.
351
Haxby, J.V., Connolly, A.C., Guntupalli, J.S., 2014. Decoding neural representationalspaces using multivariate pattern analysis. Annu. Rev. Neurosci. 37 (1), 435–456.
Haxby, J.V., Gobbini, M.I., Furey, M.L., Ishai, A., Schouten, J.L., Pietrini, P., 2001.Distributed and overlapping representations of faces and objects in ventral temporalcortex. Science 293 (5539), 2425–2430.
Hebart, M.N., Baker, C.I., 2017. Deconstructing multivariate decoding for the study ofbrain function. NeuroImage.
Kamitani, Y., Tong, F., 2005. Decoding the visual and subjective contents of the humanbrain. Nat. Neurosci. 8 (5), 679.
Kay, K.N., Naselaris, T., Prenger, R.J., Gallant, J.L., 2008. Identifying natural images fromhuman brain activity. Nature 452 (7185), 352–355.
Kriegeskorte, N., Kievit, R.A., 2013. Representational geometry: integrating cognition,computation, and the brain. Trends Cognit Sci. 17 (8), 401–412.
Lee, H., Kuhl, B.A., 2016. Reconstructing perceived and retrieved faces from activitypatterns in lateral parietal cortex. J. Neurosci. 36 (22), 6069–6082.
Lotte, F., Congedo, M., L�ecuyer, A., Lamarche, F., Arnaldi, B., 2007. A review ofclassification algorithms for EEG-based brain–computer interfaces. J. neural Eng. 4(2), R1.
Mahon, B.Z., 2015. The burden of embodied cognition. Can. J. Exp. Psychol. 69 (2),172–178.
Mitchell, T.M., Shinkareva, S.V., Carlson, A., Chang, K.-M., Malave, V.L., Mason, R.A.,Just, M.A., 2008. Predicting human brain activity associated with the meanings ofnouns. Science 320 (5880), 1191–1195.
Monaghan, P., Shillcock, R.C., Christiansen, M.H., Kirby, S., 2014. How arbitrary islanguage? Phil. Trans. R. Soc. B 369 (1651), 20130299.
Naselaris, T., Kay, K.N., 2015. Resolving ambiguities of MVPA using explicit models ofrepresentation. Trends Cognit Sci. 19 (10), 551–554.
Naselaris, T., Kay, K.N., Nishimoto, S., Gallant, J.L., 2011. Encoding and decoding infMRI. NeuroImage 56 (2), 400–410.
Nastase, S.A., et al., 2017. Attention selectively reshapes the geometry of distributedsemantic representation. Cerebr. Cortex 1–15. https://doi.org/10.1093/cercor/bhx138.
Norman, K., Polyn, S., Detre, G., Haxby, J., 2006. Beyond mind-reading: multi-voxelpattern analysis of fMRI data. Trends Cognit Sci. 10 (9), 424–430.
Palminteri, S., Wyart, V., Koechlin, E., 2017. The importance of falsification incomputational cognitive modeling. Trends Cognit Sci. Advance Online Publication.
Poldrack, R., 2006. Can cognitive processes be inferred from neuroimaging data? TrendsCognit Sci. 10 (2), 59–63.
Poldrack, R.A., 2011. Inferring mental states from neuroimaging data: from reverseinference to large-scale decoding. Neuron 72 (5), 692–697.
Ritchie, J.B., Kaplan, D., Klein, C., 2017, April 15. Decoding The Brain: NeuralRepresentation And The Limits Of Multivariate Pattern Analysis In CognitiveNeuroscience bioRxiv, 127233. Retrieved from biorxiv.org/content/early/2017/04/15/127233. https://doi.org/10.1101/127233.
Santoro, R., Moerel, M., Martino, F.D., Goebel, R., Ugurbil, K., Yacoub, E., Formisano, E.,2014. Encoding of natural sounds at multiple spectral and temporal resolutions in thehuman auditory cortex. PLOS Comput. Biol. 10 (1), e1003412.
Sigala, N., Logothetis, N.K., 2002. Visual categorization shapes feature selectivity in theprimate temporal cortex. Nature 415 (6869), 318–320.
Tong, F., Pratte, M., 2012. Decoding patterns of human brain activity. Annu. Rev. Psychol.63 (1), 483–509.
Wagner, A.D., Schacter, D.L., Rotte, M., Koutstaal, W., Maril, A., Dale, A.M., Buckner, R.L.,1998. Building memories: remembering and forgetting of verbal experiences aspredicted by brain activity. Science 281 (5380), 1188–1191.