
Practical Radio Link Resource Allocation for Fair QoS ...
24
HAL Id: hal-00532888 https://hal.archives-ouvertes.fr/hal-00532888 Submitted on 29 Nov 2010 HAL is a multi-disciplinary open access archive for the deposit and dissemination of sci- entific research documents, whether they are pub- lished or not. The documents may come from teaching and research institutions in France or abroad, or from public or private research centers. L’archive ouverte pluridisciplinaire HAL, est destinée au dépôt et à la diffusion de documents scientifiques de niveau recherche, publiés ou non, émanant des établissements d’enseignement et de recherche français ou étrangers, des laboratoires publics ou privés. Practical Radio Link Resource Allocation for Fair QoS-Provision in OFDMA Cellular Systems with Partial Channel-State Information Ayman Alsawah, Inbar Fijalkow To cite this version: Ayman Alsawah, Inbar Fijalkow. Practical Radio Link Resource Allocation for Fair QoS-Provision in OFDMA Cellular Systems with Partial Channel-State Information. EURASIP Journal on Advances in Signal Processing, SpringerOpen, 2008, 2009, pp.ID 602856. 10.1155/2009/602856. hal-00532888
Transcript of Practical Radio Link Resource Allocation for Fair QoS ...

HAL Id: hal-00532888https://hal.archives-ouvertes.fr/hal-00532888
Submitted on 29 Nov 2010
HAL is a multi-disciplinary open accessarchive for the deposit and dissemination of sci-entific research documents, whether they are pub-lished or not. The documents may come fromteaching and research institutions in France orabroad, or from public or private research centers.
L’archive ouverte pluridisciplinaire HAL, estdestinée au dépôt et à la diffusion de documentsscientifiques de niveau recherche, publiés ou non,émanant des établissements d’enseignement et derecherche français ou étrangers, des laboratoirespublics ou privés.
Practical Radio Link Resource Allocation for FairQoS-Provision in OFDMA Cellular Systems with Partial
Channel-State InformationAyman Alsawah, Inbar Fijalkow
To cite this version:Ayman Alsawah, Inbar Fijalkow. Practical Radio Link Resource Allocation for Fair QoS-Provision inOFDMA Cellular Systems with Partial Channel-State Information. EURASIP Journal on Advancesin Signal Processing, SpringerOpen, 2008, 2009, pp.ID 602856. �10.1155/2009/602856�. �hal-00532888�
Practical Radio Link Resource Allocation for Fair QoS-Provision in
OFDMA Cellular Systems with Partial Channel-State Information
Ayman Alsawah, Inbar Fijalkow
ETIS Laboratory - CNRS UMR 8051 - ENSEA - University of Cergy-Pontoise
6, avenue du Ponceau, 95014 Cergy-Pontoise Cedex, France
{ayman.alsawah,inbar.fijalkow}@ensea.fr
Abstract
We address the problem of resource allocation on the downlink of an OFDMA cellular systemunder fairness constraints with limited Channel State Information (CSI). Target QoS corresponds toa minimum user data rate, a target Bit-Error Rate and a maximum outage probability. The channelmodel includes pathloss, shadowing and fading. The only available CSI is the channel average gainof each user. This partial CSI defines a shadowed pathloss that yields a modified user distribution.Resource allocation is based on the shadowed user distribution that we characterize analytically.Thus, under the target QoS, we provide the optimal resource allocation that maximizes the userrate. Compared to full-CSI-based allocation schemes, our solution offers a significant complexityand feedback reduction. Finally, the performance of our method is compared to other existingmethods and the robustness of its outage performance vis-a-vis of CSI accuracy is shown.
Resource allocation, OFDMA, Adaptive Subcarrier and Rate Allocation, QoS fairness, Partial CSI.
1 Introduction
In cellular systems, service providers are interested in offering a given Quality of Service (QoS) toall users regardless of their locations in the cell. This leads to the challenging problem of resourceallocation under fairness constraints. In this paper, we are interested in the case of an OFDMAdownlink. OFDMA is a promising modulation and multiple-access technique that has been adoptedin key standards like 802.16d/e (WiMax) [1, 2].
The problem of resource allocation in OFDMA under fairness constraints continues to be an activeresearch area [5–9]. Depending on the target application, the proposed solutions differ in the fairnessrequirement and in the adopted objective function. However, the common point is that some availableChannel State Information (CSI) is used by the base station in order to maximize the objective function.The optimization operates on some degrees of freedom like the subcarrier, rate and power allocationschemes. Obviously, the ultimate optimal performance is obtained if the base station jointly optimizesthe available degrees of freedom while having an instantaneous full CSI knowledge. Full CSI allows thesystem to exploit the different forms of diversity like time, frequency or multiuser diversity. In practice,this knowledge is very expensive in terms of the bandwidth required on feedback channels. Moreover,even with full and perfect CSI, finding the optimal solution usually involves prohibitive computationalcomplexity. These drawbacks usually make the proposed solutions unsuitable for practical use in realsystems. Therefore, the goal of the present work is to propose a low-complexity resource allocationalgorithm assuming partial and imperfect CSI.
This paper focuses on the downlink of a single-cell OFDMA system with adaptive modulation andsubcarrier allocation. Fairness constraints correspond to a target Quality of Service (QoS) common to
1

all the users in the cell. This target QoS is defined by a minimum data rate and a target Bit-Error Rate(BER). In addition to the pathloss, the channel model includes log-normal shadowing and Rayleighfading. We suppose that the only CSI available to the base station is the channel average power-gainof each user. This partial CSI can be estimated by averaging the received power over the differentsubcarriers assuming equal subcarriers’ powers. It can be considered as a shadowed pathloss thatcorresponds to modified users’ distances. This simple CSI results in a feedback overhead reductionfactor equal to the number of subcarriers, i.e. between 64 and 1024, compared to full-CSI requiredoverhead. Resource allocation is carried out by the base station based on the notion of shadowed userdistance that we introduce and characterize analytically. Thus, under the target QoS, a total peakpower constraint and a given number of users uniformly distributed over the cell of a given radius, weprovide the optimal subcarrier and rate allocation that offers the maximum data rate per user. Thepresence of unknown fading leads to an outage each time the BER achieved by a given user exceedsthe target BER. Therefore, a maximum BER-outage probability constraint is added to the target QoSspecification. This BER-outage constraint requires considering a fading power margin. This meansthat a portion of the total power is dedicated to the fading mitigation and that resource allocation isbased on the remaining power. Moreover, due to shadowing, some users may fall, in terms of shadoweddistance, out of the coverage range. This corresponds to a rate-outage probability that we characterizeas well.
Simulation results allows us to evaluate the achievable performance for a typical parameter setting.They show that our algorithm yields a significant spectral efficiency enhancement compared to atraditional static resource allocation. Meanwhile, the loss in terms of average spectral efficiency withrespect to a full-CSI-based opportunistic allocation remains acceptable. This loss is counterweightedby the complexity and feedback overhead reduction in our approach. Finally, simulations reveal thatthe overall outage performance is very robust vis-a-vis of the accuracy of the adopted CSI.
2 System Model
We consider an uncoded OFDMA downlink from a base station to U uniformly-distributed usersin a single circular cell of radius R. A total peak power Ptot is available for transmission over Ssubcarriers. The transmitted signal received by user u experiences a frequency-selective slow-fadingchannel characterized by S i.i.d. random variables gu,s (s = 1, ..., S). These gu,s represent the channelpower gains over the different subcarriers. Channel realizations are independent from a user to another.Each coefficient gu,s accounts for a deterministic propagation pathloss G(xu), that depends on thedistance xu of user u to the base station, in addition to a log-normal shadowing 10 0.1 ξu and to amultipath Rayleigh fading φ2
u,s. So, if pu,s denotes the transmitted power on subcarrier s, the received
Signal-to-Noise Ratio (SNR) at the uth user on this subcarrier is given by
γu,s =pu,s gu,s
BN0=
pu,s
BN0G(xu)10 0.1 ξu φ2
u,s (1)
where B is the subcarrier spacing and N0 is the AWGN power spectral density. The pathloss G(xu)represents the long-term average, called also the area mean, of the channel power gain at distance xu.Thus, the quantity
¯γu,s =pu,s
BN0G(xu) (2)
is the area-mean received SNR at user u on subcarrier s. The double bar in ¯γu,s corresponds to theexpectation of the instantaneous SNR with respect to both shadowing and fading (¯γu,s = Eξ,φ[γu,s]).
We assume that the logarithmic pathloss GdB(xu) = −10 log10 G(xu) follows the exponent model [3]
2

defined by
GdB(xu) = GdB(x0) + 10 α log10
xu
x0. (3)
The term GdB(x0) is the pathloss at a reference distance x0 while α ≥ 2 is the pathloss exponent. Thevalue of α depends on the terrain nature and on the base station antenna height [3]. We have
GdB(x0) = 20 log10
4πf x0
c(4)
where f is the frequency of the considered subcarrier and c is the light speed. By taking a unit referencedistance (x0 = 1), the pathloss can be written simply as follows
G(xu) =G0
xαu
(5)
with G0 = ( c4πf )2. Since the OFDM total bandwidth SB is typically small compared to the center
frequency fc, we consider that G0 is independent from the subcarrier index. This parameter is usuallycalculated using the high end of the bandwidth, i.e. at frequency fc + SB/2 (worst case value).
In (1), the log-normal shadowing 10 0.1 ξu is the mid-term average gain called the local-mean gain. It ischaracterized by the shadowing standard deviation σ which is the standard deviation of the zero-meanGaussian random variable ξu. We define the local-mean received SNR (or the shadowed SNR) by
γu,s =pu,s
BN0G(xu) 10 0.1 ξu . (6)
The single bar in γu,s is related to the expectation of the instantaneous SNR γu,s with respect to the fad-ing process only (γu,s = Eφ[γu,s]). This shadowed SNR follows a log-normal distribution LN (µu,s, σ
2)where the logarithmic average is simply the area-mean received SNR in decibels µu,s = 10 log10
¯γu,s.
Now we define the Shadowed Pathloss for user u by
Gu = G(xu) 10 0.1 ξu =G0
xαu
10 0.1 ξu . (7)
This quantity can be estimated in practice by averaging the received power over the subcarriers duringone or more dedicated OFDM training symbols. The reason for calling Gu the shadowed pathloss isthat a user equivalent-distance du can be introduced so that Gu is obtained by the same pathloss model(5) as follows
Gu =G0
dαu
. (8)
Thus, from (7) and (8) we get
du = xu 10 −0.1 ξu/α. (9)
In the sequel, we call du the shadowed distance of user u. So, replacing user actual distance xu bythe shadowed distance du allows us to make abstraction of the shadowing as if the random componentof the channel is reduced to fading. Obviously, the uniform user distribution is transformed into adifferent one (see Figure 2) that we characterize farther in our analysis. In the following, we considerthat the available CSI about user u is the corresponding shadowed distance du defined in(9). Based on this CSI, the base station suitably allocates system resources (subcarriers, powers andrates) in order to offer the maximum common rate while satisfying the minimum required QoS. Theminimum QoS is defined by the minimum data rate per user D0, the target BER b and the maximum
3

Table 1: Notations
fc Carrier frequency HzS Number of subcarriers -B Subcarrier spacing (⇒ total OFDM bandwidth=SB) HzM Set of available modulation orders (ex. M = {4, 2} ⇔ {QPSK, BPSK}) -Ptot Maximum total transmit power Wpu,s Power allocated to the uth user over the sth subcarrier Wxu Distance between the uth user and the base station mN0 White noise power density W/Hzα Pathloss exponent -σ Log-normal shadowing logarithmic standard deviation dBTs OFDM symbol duration secLf Frame length symbolsD0 Target minimum data rate per user bpsb Target bit-error rate −ε Target maximum BER-outage probability −U Total number of users usersR Cell radius m
BER-outage probability ε. The resource allocation is done on a frame-basis with a given frame lengthLf expressed in OFDM symbols. We consider that the channel variation rate is small compared to theframe rate so that the CSI is invariant during the same frame (slow fading assumption).
Finally, we assume that the users’ terminals demodulate each subcarrier using a coherent receiverwith a Nyquist matched filter. This means that the subcarrier spacing B is equal to the symbolrate. Consequently, the quantity log2 M represents the spectral efficiency in bps/Hz of the M -QAMconstellation. Throughout this paper, the term M -QAM is also used for the BPSK case where M = 2.We suppose that the set M = {M1, M2, ..., MQ} of available constellations’ orders is an ordered set,that is M1 > M2 > .. > MQ where Q = card(M). Table 1 summarizes the main notations.
In the next section we formulate the considered optimization problem with arbitrary CSI in order tocompare our approach based on partial CSI to other existing full-CSI-based approaches.
3 Problem Formulation and Related Work
Assume that the base station allocates subcarrier s to user u with power pu,s so that this user achievesa data rate ru,s. This rate depends on the target BER b, on the maximum outage probability ε, onthe allocated power pu,s and on the available CSI denoted as hu,s. This hu,s may represent the actualchannel gain gu,s, in the case of full CSI, or any other information derived from gu,s in the case ofpartial or imperfect CSI. Let us describe the rate adaptation by a function Φ as follows
ru,s = Φ(b, ε, pu,s, hu,s). (10)
4

The subcarrier allocation can be described by the matrix A = [au,s] where au,s = 1 if subcarrier s isallocated to user u and au,s = 0 otherwise. Hence, user u achieves a total data rate
ru =S∑
s=1
au,sΦ(b, ε, pu,s, hu,s). (11)
Let P = [pu,s] be the power allocation matrix. Maximizing the common data rate for a given numberof users U can be written as a problem of sum-rate maximization under fairness constraints as follows
maxA,P
U∑
u=1
S∑
s=1
au,sΦ(b, ε, pu,s, hu,s)
subject to [c1]: au,s ∈ {0, 1} ∀u, s[c2]: au,s au,s = 0 ∀s, ∀u 6= u
[c3]:∑u=U
u=1
∑s=Ss=1 au,s pu,s ≤ Ptot
[c4]: r1 = r2 = ... = rU
[c5]: ru ≥ D0 ∀u.
(12)
In this formulation [c3] represents the total power constraint. Fairness is defined by [c4] while [c5]corresponds to a minimum rate requirement. Finally, constraints [c1] and [c2] mean that during eachOFDM symbol, a given subcarrier can be allocated to at most one user. This condition is very stringentand may render the problem unfeasible because of the discrete nature of variables au,s. If this conditionis relaxed, we obtain the following problem where all the variables are continuous
maxA,P
U∑
u=1
S∑
s=1
au,sΦ(b, ε, pu,s, hu,s)
subject to [c1]: au,s ∈ [0, 1] ∀u, s
[c2]:∑u=U
u=1 au,s ≤ 1 ∀s
[c3]:∑u=U
u=1
∑s=Ss=1 au,s pu,s ≤ Ptot
[c4]: r1 = r2 = ... = rU
[c5]: ru ≥ D0 ∀u.
(13)
Allowing variables au,s to take real values in the range [0, 1] does not necessarily means that the ex-clusive subcarrier assignment is violated. In fact, sharing the same subcarrier can be carried out bytime-division over several OFDM symbols assuming that the channel state remains invariant mean-while. For example, if the optimal solution of (13) gives a1,s = a2,s = 0.5, then subcarrier s has to beshared by both user 1 and user 2 during 50% of the time each.
Let us go back to equation (10) that describes the rate adaptation. Without any CSI, one mustallocate subcarriers and powers in a static way based on a worst-case design (adaptation to edge-usercondition). With full CSI, the product pu,shu,s = pu,sgu,s represents the actual received SNR given by(1). In this case, a zero-outage (ε = 0) can be achieved since the allocated powers can compensate forthe actual channel attenuation. This allows the system to get benefit of the frequency diversity andto achieve higher data rates. In literature, authors often consider the case of full CSI with continuousmodulation and zero-outage [5–9]. Some authors [5–7] consider the error-free Shannon capacity sothat ru,s = B log2(1 + γu,s). Such information-theoretical approaches provide upper-bounds on theachievable performance but are not directly connected to real implementations. Other authors [8, 9]consider the case of a positive bit error rate (b > 0) with M-QAM constellations. In this case, a BERapproximation for M-QAM performance is used. The SNR gap [11], used in [9], is an example ofa BER approximation in the uncoded M-QAM case. Another example for encoded M-QAM can befound in [10].
5

In all cases, finding the optimal solution to (13) involves excessive computational complexity [5].Hence, several suboptimal solutions have been proposed. Some are based on separating the subcarrierallocation step from the power allocation step as in [8]. Others assume equal powers to simplify thesubcarrier assignment step as in [5]. Nevertheless, the assumption of full CSI remains unrealistic inpractical systems especially for a large number of users. This is due to the prohibitive overhead requiredfor CSI feedback. Moreover, in real systems, whatever the CSI estimation method is, the obtainedCSI is imperfect due to estimation errors, feedback errors, feedback delay and quantization noise. Theeffect of imperfect CSI on the performance of the proposed algorithms is rarely evaluated. Thus, theaim of this work is to propose a low-complexity suboptimal solution based on partial and imperfectCSI so that the resulting algorithm can be implemented in real systems with acceptable performance.
In this paper, we suppose that the only available CSI is the users’ shadowed distances defined in(9). Furthermore, we show later that even a coarse CSI estimation can be sufficient as the obtainedperformance is shown to be very robust against CSI estimation errors. The reason why the shadoweddistance du is considered rather than the shadowed pathloss (7) is that the resource allocation algorithmthat we propose is based on user distribution.
To reduce the complexity of the proposed solution, we adopt the equal-power scheme, that is
pu,s =Ptot
S, ∀u, s. (14)
With equal powers, (13) is reduced to a subcarrier and rate allocation problem. Moreover, since du
is not a frequency-selective information, the subcarrier allocation is transformed into a bandwidthallocation. Thus, resolving (13) consists in deciding how many subcarriers each user does need andwhich M-QAM constellation has to be used on these subcarriers. Let us replace the subcarrier assign-ment matrix A by the vector W = [W (1), ..., W (U)] where W (u) represents the number of subcarriersallocated to user u, i.e.
W (u) =S∑
s=1
au,s. (15)
With the equal power scheme (14), we obtain from (13.c3) and (15) the following condition
U∑
u=1
W (u) ≤ S. (16)
We assume also that the same constellation of order M(u) is used on the W (u) subcarriers of user u.With uncoded M-QAM, the rate adaptation function (10) becomes
Φ(b, ε,Ptot
S, du) = B log2 M(u). (17)
Notice that Φ(b, ε, Ptot
S , du) is now independent from the subcarrier index s so that, from (11) and (15),the data rate achieved by user u is
ru = W (u) Φ(b, ε,Ptot
S, du) = W (u)B log2 M(u). (18)
So, under these assumptions, the optimization problem (13) becomes
maxW
U∑
u=1
W (u) Φ(b, ε,Ptot
S, du)
subject to [c1]: W (u) ∈]0, S[ ∀u
[c2]:∑U
u=1 W (u) ≤ S[c3]: r1 = r2 = ... = rU
[c4]: ru ≥ D0 ∀u.
(19)
6
If we denote by D the common data rate, then (19) can be transformed into a common rate maximiza-tion problem as follows
maxW
D
subject to [c1]: W (u) ∈]0, S[ ∀u
[c2]:∑U
u=1 W (u) ≤ S
[c3]: W (u) Φ(b, ε, Ptot
S , du) = D ∀u[c4]: D ≥ D0 ∀u.
(20)
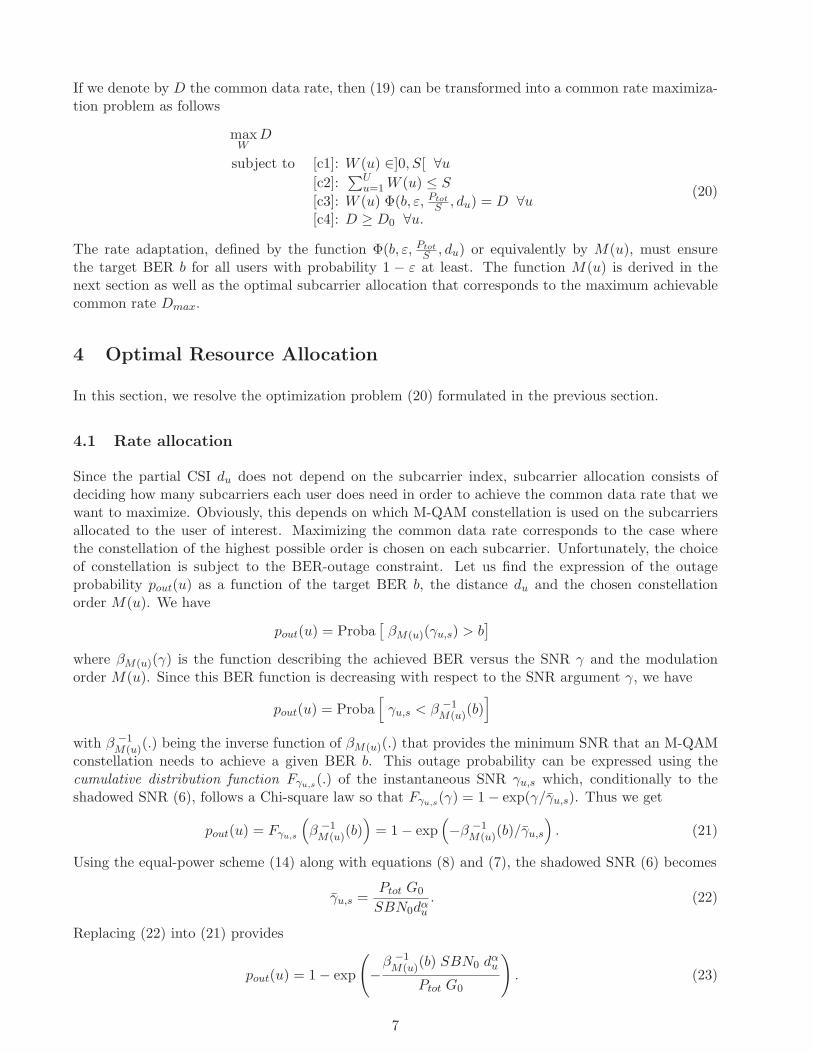
The rate adaptation, defined by the function Φ(b, ε, Ptot
S , du) or equivalently by M(u), must ensurethe target BER b for all users with probability 1 − ε at least. The function M(u) is derived in thenext section as well as the optimal subcarrier allocation that corresponds to the maximum achievablecommon rate Dmax.
4 Optimal Resource Allocation
In this section, we resolve the optimization problem (20) formulated in the previous section.
4.1 Rate allocation
Since the partial CSI du does not depend on the subcarrier index, subcarrier allocation consists ofdeciding how many subcarriers each user does need in order to achieve the common data rate that wewant to maximize. Obviously, this depends on which M-QAM constellation is used on the subcarriersallocated to the user of interest. Maximizing the common data rate corresponds to the case wherethe constellation of the highest possible order is chosen on each subcarrier. Unfortunately, the choiceof constellation is subject to the BER-outage constraint. Let us find the expression of the outageprobability pout(u) as a function of the target BER b, the distance du and the chosen constellationorder M(u). We have
pout(u) = Proba[
βM(u)(γu,s) > b]
where βM(u)(γ) is the function describing the achieved BER versus the SNR γ and the modulationorder M(u). Since this BER function is decreasing with respect to the SNR argument γ, we have
pout(u) = Proba[
γu,s < β −1M(u)(b)
]
with β −1M(u)(.) being the inverse function of βM(u)(.) that provides the minimum SNR that an M-QAM
constellation needs to achieve a given BER b. This outage probability can be expressed using thecumulative distribution function Fγu,s(.) of the instantaneous SNR γu,s which, conditionally to theshadowed SNR (6), follows a Chi-square law so that Fγu,s(γ) = 1 − exp(γ/γu,s). Thus we get
pout(u) = Fγu,s
(
β −1M(u)(b)
)
= 1 − exp(
−β −1M(u)(b)/γu,s
)
. (21)
Using the equal-power scheme (14) along with equations (8) and (7), the shadowed SNR (6) becomes
γu,s =Ptot G0
SBN0dαu
. (22)
Replacing (22) into (21) provides
pout(u) = 1 − exp
(
−β −1
M(u)(b) SBN0 dαu
Ptot G0
)
. (23)
7

For a given value of M(u), this outage probability increases with user distance du. Therefore, themaximum outage probability constraint
pout(u) ≤ ε (24)
means that each constellation Mq-QAM (q = 1, ..., Q) can be used up to a maximum distance Rq whichis the solution of
1 − exp
(
−β −1
Mq(b) SBN0 Rα
q
Ptot G0
)
= ε. (25)
We obtain
Rq =
[
(Ptot/F ) G0
SBN0 β −1Mq
(b)
]1/α
(26)
with the parameter F given by
F =−1
log(1 − ε). (27)
This parameter F represents the fading power margin that guarantees a BER-outage probabilitybounded by ε.
In (26), the SNR-threshold function β −1Mq
(b) is increasing with Mq (a higher-order modulation requires
higher SNR to achieve the same BER). So, for the complete set of available constellations we haveR1 < R2 < ... < RQ. Remember that maximizing the common rate requires using for each user theconstellation of the highest possible order. Consequently, the Mq-QAM constellation must be allocatedto users whose shadowed distances du are in ]Rq−1, Rq] with R0 = 0. This defines the optimal rateallocation as follows
M(u) = maxq
Mq ∈ M : du ≤ Rq =
[
(Ptot/F ) G0
SBN0 β −1Mq
(b)
]1/α
. (28)
Thus, each constellation Mq-QAM covers an annular zone of internal (resp. external) radius Rq−1
(resp. Rq). This is depicted in Figure 1 in the case of three modulations (Q = 3). In the following,the qth annular zone is referred to as zone q.
4.2 Rate-outage probability
The coverage range corresponds to RQ, the range of the lowest-order modulation. Although users areactually located inside the circle of radius R, their shadowed distances may be greater than R or eventhan the maximum range RQ (see Figure 2). As long as the user shadowed distance is smaller thanRQ, this user can be served with the required QoS. In the opposite case, this user is said to be inrate-outage. This corresponds to the situation where the base station decides to use all the availableconstellations and to serve all the users whose shadowed distances are smaller than RQ. But, in orderto improve the overall QoS of the provisioned users, the base station may decides not to serve thosewhose shadowed distances are greater than a given cut-off distance Rcut ∈ [R, RQ]. Thus, we define therate-outage probability for a user u by ρu(Rcut) = Proba [du > Rcut]. This probability can be derivedgiven the statistics of the random variable du defined in (9). It is easier to consider the random variable10 log10 du = 10 log10 xu−ξu/α which follows a Gaussian law N (10 log10 xu, σ2/α2). The correspondingcumulative distribution function is
F10 log10
du(y) = 0.5 + 0.5 erf
(
y − 10 log10 xu
σ√
2/α
)
8

Figure 1: Modulation zones and SNR thresholds (Q = 3 modulations).
Figure 2: Initial uniform and shadowed user distribution.
9
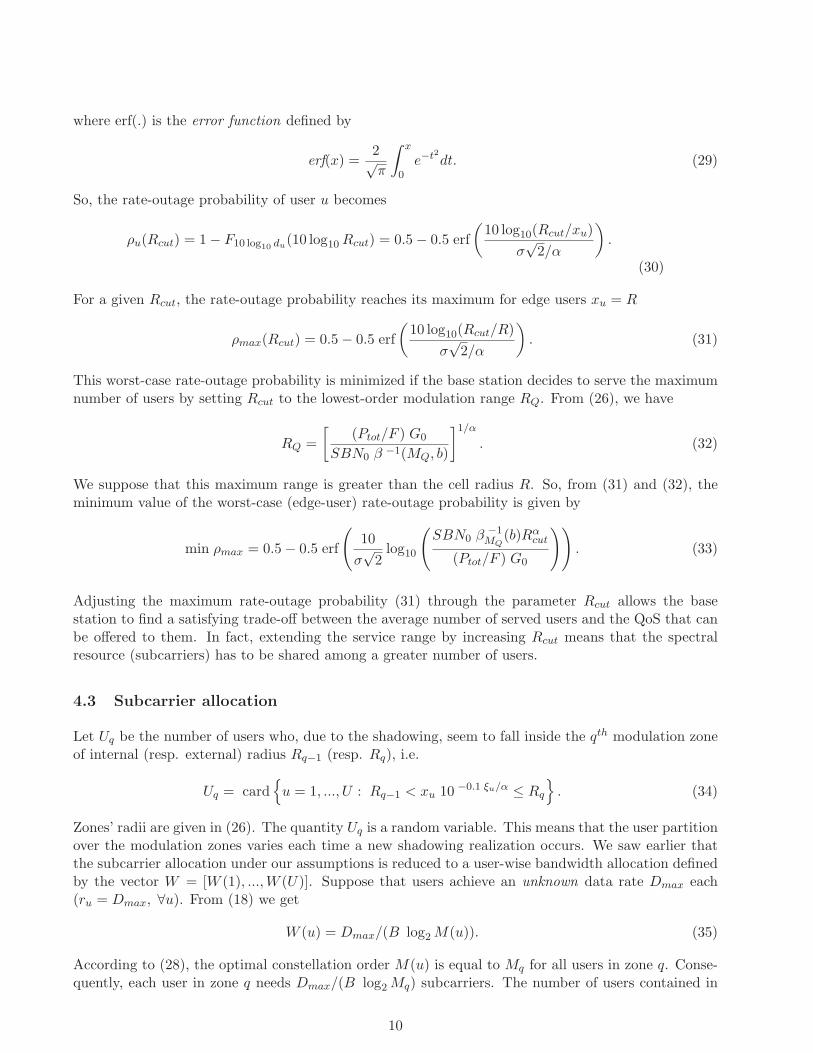
where erf(.) is the error function defined by
erf(x) =2√π
∫ x
0e−t2dt. (29)
So, the rate-outage probability of user u becomes
ρu(Rcut) = 1 − F10 log10
du(10 log10 Rcut) = 0.5 − 0.5 erf
(
10 log10(Rcut/xu)
σ√
2/α
)
.
(30)
For a given Rcut, the rate-outage probability reaches its maximum for edge users xu = R
ρmax(Rcut) = 0.5 − 0.5 erf
(
10 log10(Rcut/R)
σ√
2/α
)
. (31)
This worst-case rate-outage probability is minimized if the base station decides to serve the maximumnumber of users by setting Rcut to the lowest-order modulation range RQ. From (26), we have
RQ =
[
(Ptot/F ) G0
SBN0 β −1(MQ, b)
]1/α
. (32)
We suppose that this maximum range is greater than the cell radius R. So, from (31) and (32), theminimum value of the worst-case (edge-user) rate-outage probability is given by
min ρmax = 0.5 − 0.5 erf
(
10
σ√
2log10
(
SBN0 β −1MQ
(b)Rαcut
(Ptot/F ) G0
))
. (33)
Adjusting the maximum rate-outage probability (31) through the parameter Rcut allows the basestation to find a satisfying trade-off between the average number of served users and the QoS that canbe offered to them. In fact, extending the service range by increasing Rcut means that the spectralresource (subcarriers) has to be shared among a greater number of users.
4.3 Subcarrier allocation
Let Uq be the number of users who, due to the shadowing, seem to fall inside the qth modulation zoneof internal (resp. external) radius Rq−1 (resp. Rq), i.e.
Uq = card{
u = 1, ..., U : Rq−1 < xu 10 −0.1 ξu/α ≤ Rq
}
. (34)
Zones’ radii are given in (26). The quantity Uq is a random variable. This means that the user partitionover the modulation zones varies each time a new shadowing realization occurs. We saw earlier thatthe subcarrier allocation under our assumptions is reduced to a user-wise bandwidth allocation definedby the vector W = [W (1), ..., W (U)]. Suppose that users achieve an unknown data rate Dmax each(ru = Dmax, ∀u). From (18) we get
W (u) = Dmax/(B log2 M(u)). (35)
According to (28), the optimal constellation order M(u) is equal to Mq for all users in zone q. Conse-quently, each user in zone q needs Dmax/(B log2 Mq) subcarriers. The number of users contained in
10

zone q is Uq defined in (34). Thus, the number of subcarriers required by zone q in order to satisfy itsUq users is
Sq =Dmax Uq
B log2 Mq. (36)
The issue now is to determine the required number of modulation zones, denoted by Z ≤ Q, as afunction of the cut-off distance Rcut ∈ [R, RQ]. We have
Z = min {q ∈ {1, ..., Q} : Rcut ≤ Rq} . (37)
So, from the constraint of the total number of subcarriers
Z∑
q=1
Sq = S (38)
and from (36) it follows
Dmax =BS
∑q=Zq=1 Uq/ log2 Mq
(39)
which is the maximum achievable common rate. By substituting Dmax from (39) back into (36) weget an expression for the optimal zone-wise subcarrier allocation as follows
Sq =Uq/ log2 Mq
∑k=Zk=1 Uk/ log2 Mk
S. (40)
Note that Sq is a random variable because Uq is. This means that the zone-wise bandwidth reservationdepends on the shadowing realization. In other words, the base station must update the variables Sq’seach time it gets a new feedback about the users’ shadowed distances. The achievable user rate Dmax
does change accordingly as well.
Now, the aim of what follows is to evaluate the achievable average performance in terms of rate-outage,user rate, spectral efficiency and bearable number of users.
5 Average Achieved Performance
In order to evaluate the average performance of our method, we need to evaluate the expectation ofthe shadowed zone-wise number of users Uq defined in (34).
5.1 Average shadowed user-distribution
Starting from the assumption of a deterministic uniform user-distribution (actual users’ positions), wewant to derive the average user-distribution when users’ distances xu are replaced by the shadoweddistances du defined in (9). Averaging is relative to the log-normal shadowing process.
Consider a differential annular zone centered at the base station with an internal (resp. external) radiusof r (resp. r+dr ). We denote this annular zone by A(r). The area of A(r) is π(r+dr)2−πr2 ≃ 2πrdr.When U users are uniformly distributed over the cell of radius R, we have a constant user density ofU/(πR2). Thus, the annular zone A(r) contains 2rdrU/R2 users. These users are uniformly distributed
11

over 2π radians around the base station. This means that the number of users contained within adifferential angular sector of [θ, θ + dθ] radians at distances in ]r, r + dr] is equal to
u(r, θ) = Ur/(πR2). (41)
Since the shadowing is closely related to the surrounding environment topology, we assume that theseu(r, θ) users are subject to the same shadowing realization. In other words, they have the sameshadowed distance d(r, θ) = r 10 −0.1 ξ(r,θ)/α where ξ(r, θ) follows a normal distribution N (0, σ2). Thecumulative distribution function of d(r, θ) is given by
Fd(r,θ)(y) = Proba [d(r, θ) ≤ y] = 0.5 + 0.5 erf
(
10 log10(y/r)
σ√
2/α
)
. (42)
Thus, the average ratio of users whose shadowed distances are in ]0, Rq] is
u(Rq) =1
U
∫ R
0
∫ 2π
0u(r, θ) Proba [d(r, θ) ≤ Rq] drdθ. (43)
Using (41) and (42) we prove in Appendix I that
u(Rq) =1
2
[
1 + erf
(
C logRq
R
)
+R2
q
R2e1/C2
(
1 − erf
(
C logRq
R+
1
C
))
]
(44)
where C = 10α/(σ√
2 log 10). The product u(.)U represents the average cumulative distribution func-tion of the number of users when actual distances are replaced by the shadowed distances. It is theexpectation, with respect to the shadowing random process, of Uq defined in (34). This importanttheoretical result is confirmed by simulation in section 7.
5.2 Rate-outage average performance
Thanks to (44), we can now evaluate Uout, the average number of users that can never be served (usersin rate outage) because their shadowed distances exceed the range RQ, given in (32), of the lowest-ordermodulation. We have
Uout(RQ) = (1 − u(RQ))U. (45)
Moreover, the average number of users in rate outage versus an arbitrary cut-off distance Rcut ∈ [R, RQ]is given by
Uout(Rcut) = (1 − u(Rcut))U. (46)
As mentioned earlier, the cut-off distance Rcut provides a way to trade-off the maximum rate-outageprobability (31) and the average number of users in rate-outage (46) against the data rate (39) offeredto each served user. The effect of Rcut is investigated by simulation in section 7.
5.3 Average user-rate and spectral efficiency
In order to derive an approximative bound for the average maximum achievable rate Dmax, we replacein (39) each variable Uq by its expectation as follows
Dmax =BS
∑q=Zq=1 Uq/ log2 Mq
. (47)
12

From (44) we get
Uq = (u(Rq) − u(Rq−1))U. (48)
What about the average spectral efficiency achieved by our allocation method? Note that the averagenumber of served users is
Usrv =
q=Z∑
q=1
Uq. (49)
These Usrv users achieve an aggregate data rate of UsrvDmax on average using a total bandwidth ofBS. So, from (47) we find that the average spectral efficiency is given by
η =
∑q=Zq=1 Uq
∑q=Zq=1 Uq/ log2 Mq
. (50)
Notice that the constraint of the minimum data rate per user D0 has not been considered yet. Con-sidering this additional constraint provides a criterion for admission control as discussed here-below.
5.4 System capacity and admission control
Having Dmax ≥ D0 along with equations (39) and (48) gives the following upper-bound on the bearable
number of users
Umax =BS
D0∑q=Z
q=1 (u(Rq) − u(Rq−1)) / log2 Mq
. (51)
This Umax corresponds to a kind of maximum system load in terms of number of users given theminimum required QoS. When the system is fully-loaded, that is U = Umax, it cannot offer to eachuser better than the minimum required data rate D0. In this case, any additional user that requestsan access to the service is rejected by the base station. So, the ratio U/Umax can be considered as ametric for the system load. In brief, for U ≤ Umax we have
Dmax =Umax
UD0. (52)
The next section describes the proposed resource allocation algorithm from a practical point of view.
6 Resource Allocation Algorithm in Practice
In the following we assume that U ≤ Umax. We saw that the optimal user-wise subcarrier allocationis defined by (40). However, one must take into account the fact that, in practice, only an integernumber of subcarriers can be assigned to a given modulation zone. Thus, the Sq’s have to be roundedto integer numbers. Let
Sq = I(Sq) = I(
Uq/ log2 Mq∑k=Z
k=1 Uk/ log2 Mk
S
)
(53)
where I(x) is the nearest integer to x. These Sq’s define Z zones inside the frame where the first zonefor example is constituted of slots modulated by the M1-QAM constellation.
13
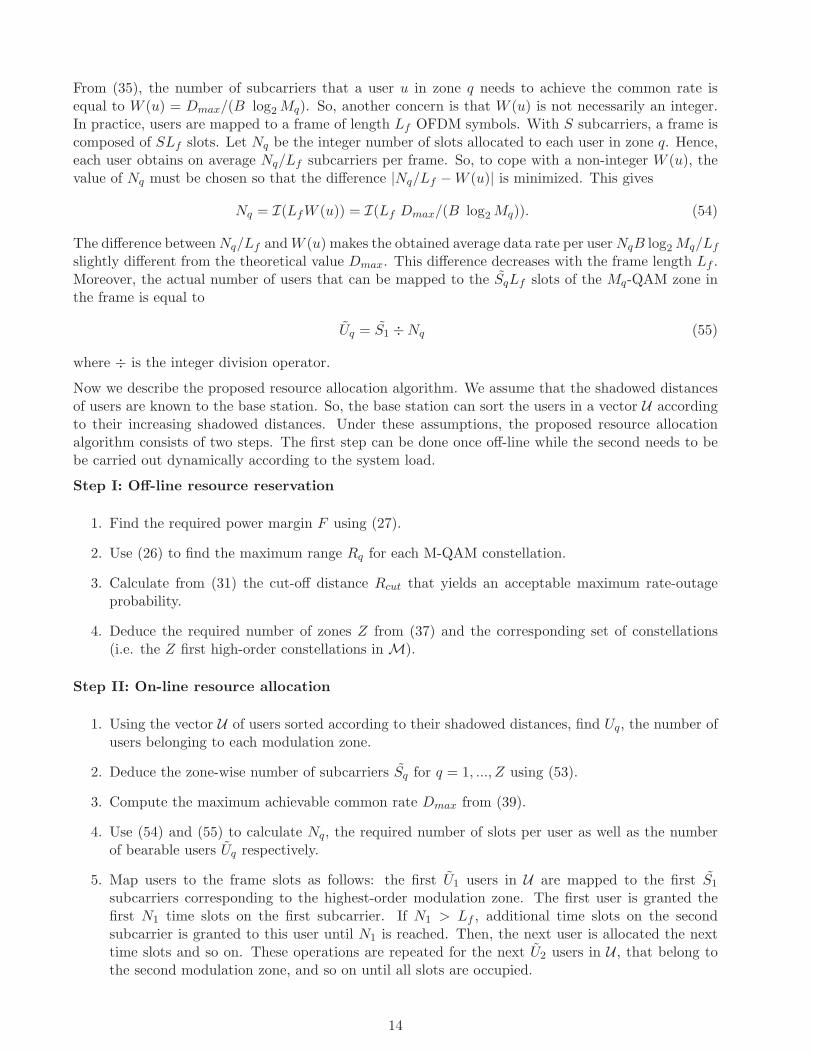
From (35), the number of subcarriers that a user u in zone q needs to achieve the common rate isequal to W (u) = Dmax/(B log2 Mq). So, another concern is that W (u) is not necessarily an integer.In practice, users are mapped to a frame of length Lf OFDM symbols. With S subcarriers, a frame iscomposed of SLf slots. Let Nq be the integer number of slots allocated to each user in zone q. Hence,each user obtains on average Nq/Lf subcarriers per frame. So, to cope with a non-integer W (u), thevalue of Nq must be chosen so that the difference |Nq/Lf − W (u)| is minimized. This gives
Nq = I(LfW (u)) = I(Lf Dmax/(B log2 Mq)). (54)
The difference between Nq/Lf and W (u) makes the obtained average data rate per user NqB log2 Mq/Lf
slightly different from the theoretical value Dmax. This difference decreases with the frame length Lf .Moreover, the actual number of users that can be mapped to the SqLf slots of the Mq-QAM zone inthe frame is equal to
Uq = S1 ÷ Nq (55)
where ÷ is the integer division operator.
Now we describe the proposed resource allocation algorithm. We assume that the shadowed distancesof users are known to the base station. So, the base station can sort the users in a vector U accordingto their increasing shadowed distances. Under these assumptions, the proposed resource allocationalgorithm consists of two steps. The first step can be done once off-line while the second needs to bebe carried out dynamically according to the system load.
Step I: Off-line resource reservation
1. Find the required power margin F using (27).
2. Use (26) to find the maximum range Rq for each M-QAM constellation.
3. Calculate from (31) the cut-off distance Rcut that yields an acceptable maximum rate-outageprobability.
4. Deduce the required number of zones Z from (37) and the corresponding set of constellations(i.e. the Z first high-order constellations in M).
Step II: On-line resource allocation
1. Using the vector U of users sorted according to their shadowed distances, find Uq, the number ofusers belonging to each modulation zone.
2. Deduce the zone-wise number of subcarriers Sq for q = 1, ..., Z using (53).
3. Compute the maximum achievable common rate Dmax from (39).
4. Use (54) and (55) to calculate Nq, the required number of slots per user as well as the numberof bearable users Uq respectively.
5. Map users to the frame slots as follows: the first U1 users in U are mapped to the first S1
subcarriers corresponding to the highest-order modulation zone. The first user is granted thefirst N1 time slots on the first subcarrier. If N1 > Lf , additional time slots on the secondsubcarrier is granted to this user until N1 is reached. Then, the next user is allocated the nexttime slots and so on. These operations are repeated for the next U2 users in U , that belong tothe second modulation zone, and so on until all slots are occupied.
14

Figure 3: Flow chart of the resource allocation on-line step.
15
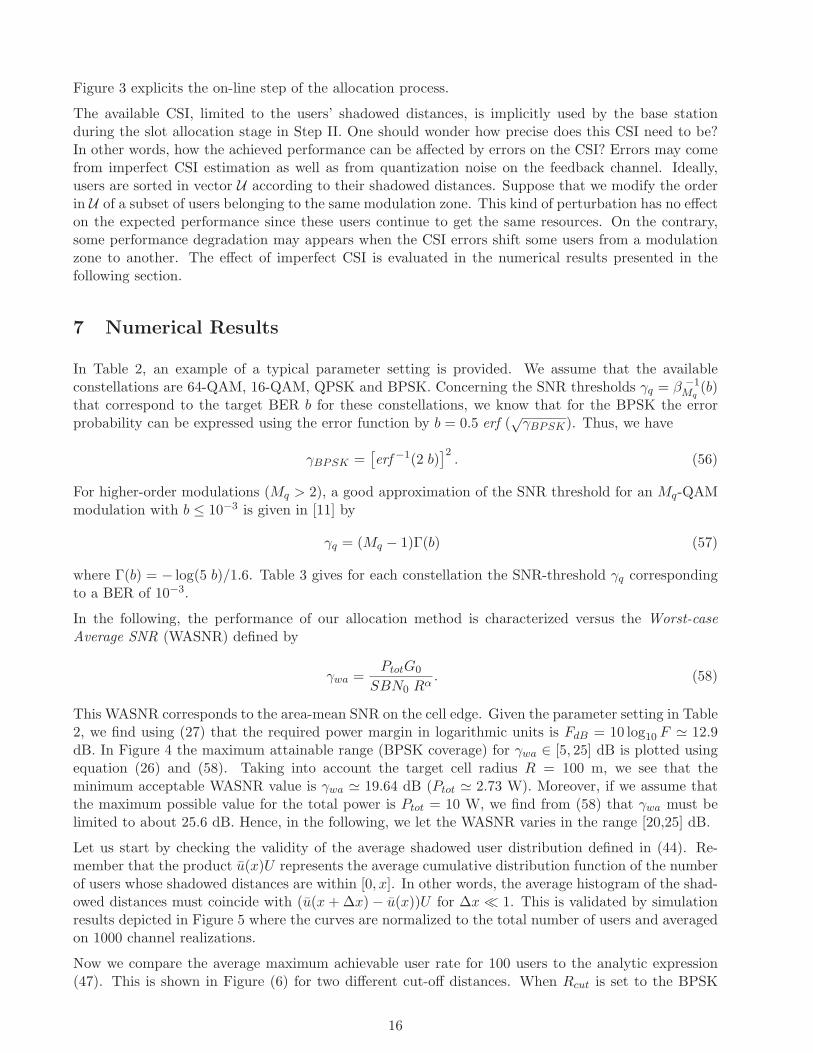
Figure 3 explicits the on-line step of the allocation process.
The available CSI, limited to the users’ shadowed distances, is implicitly used by the base stationduring the slot allocation stage in Step II. One should wonder how precise does this CSI need to be?In other words, how the achieved performance can be affected by errors on the CSI? Errors may comefrom imperfect CSI estimation as well as from quantization noise on the feedback channel. Ideally,users are sorted in vector U according to their shadowed distances. Suppose that we modify the orderin U of a subset of users belonging to the same modulation zone. This kind of perturbation has no effecton the expected performance since these users continue to get the same resources. On the contrary,some performance degradation may appears when the CSI errors shift some users from a modulationzone to another. The effect of imperfect CSI is evaluated in the numerical results presented in thefollowing section.
7 Numerical Results
In Table 2, an example of a typical parameter setting is provided. We assume that the availableconstellations are 64-QAM, 16-QAM, QPSK and BPSK. Concerning the SNR thresholds γq = β −1
Mq(b)
that correspond to the target BER b for these constellations, we know that for the BPSK the errorprobability can be expressed using the error function by b = 0.5 erf (
√γBPSK). Thus, we have
γBPSK =[
erf −1(2 b)]2
. (56)
For higher-order modulations (Mq > 2), a good approximation of the SNR threshold for an Mq-QAMmodulation with b ≤ 10−3 is given in [11] by
γq = (Mq − 1)Γ(b) (57)
where Γ(b) = − log(5 b)/1.6. Table 3 gives for each constellation the SNR-threshold γq correspondingto a BER of 10−3.
In the following, the performance of our allocation method is characterized versus the Worst-case
Average SNR (WASNR) defined by
γwa =PtotG0
SBN0 Rα. (58)
This WASNR corresponds to the area-mean SNR on the cell edge. Given the parameter setting in Table2, we find using (27) that the required power margin in logarithmic units is FdB = 10 log10 F ≃ 12.9dB. In Figure 4 the maximum attainable range (BPSK coverage) for γwa ∈ [5, 25] dB is plotted usingequation (26) and (58). Taking into account the target cell radius R = 100 m, we see that theminimum acceptable WASNR value is γwa ≃ 19.64 dB (Ptot ≃ 2.73 W). Moreover, if we assume thatthe maximum possible value for the total power is Ptot = 10 W, we find from (58) that γwa must belimited to about 25.6 dB. Hence, in the following, we let the WASNR varies in the range [20,25] dB.
Let us start by checking the validity of the average shadowed user distribution defined in (44). Re-member that the product u(x)U represents the average cumulative distribution function of the numberof users whose shadowed distances are within [0, x]. In other words, the average histogram of the shad-owed distances must coincide with (u(x + ∆x) − u(x))U for ∆x ≪ 1. This is validated by simulationresults depicted in Figure 5 where the curves are normalized to the total number of users and averagedon 1000 channel realizations.
Now we compare the average maximum achievable user rate for 100 users to the analytic expression(47). This is shown in Figure (6) for two different cut-off distances. When Rcut is set to the BPSK
16
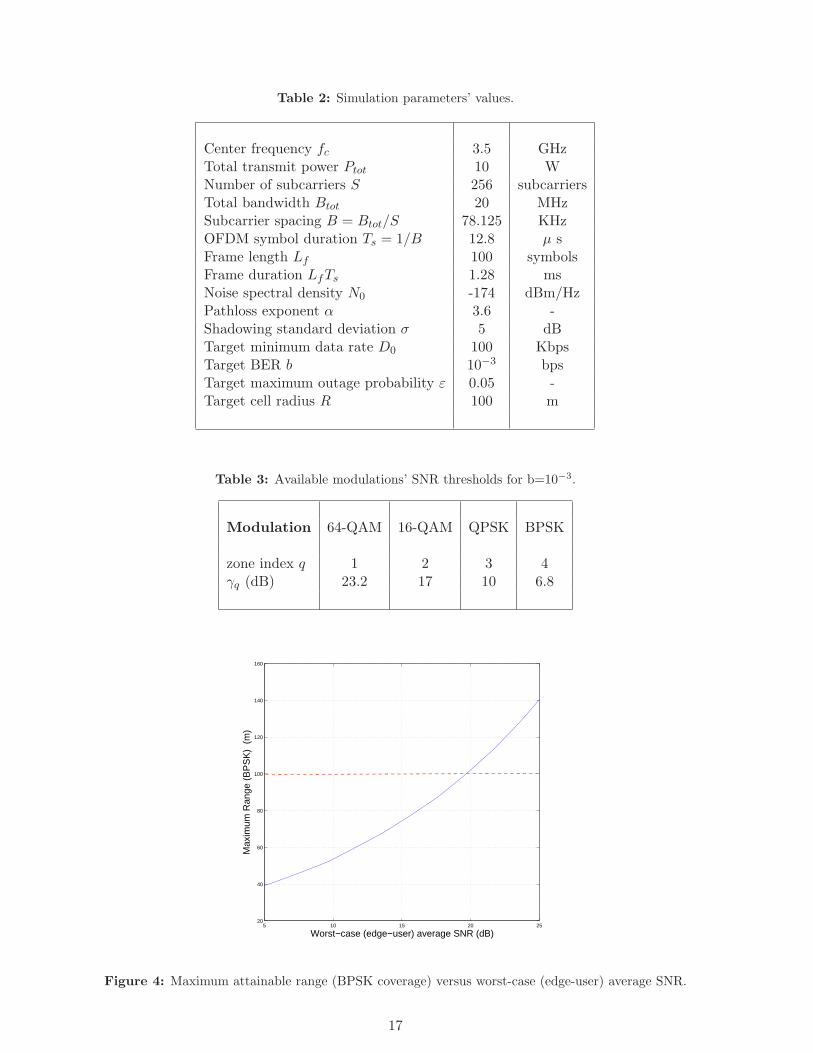
Table 2: Simulation parameters’ values.
Center frequency fc 3.5 GHzTotal transmit power Ptot 10 WNumber of subcarriers S 256 subcarriersTotal bandwidth Btot 20 MHzSubcarrier spacing B = Btot/S 78.125 KHzOFDM symbol duration Ts = 1/B 12.8 µ sFrame length Lf 100 symbolsFrame duration LfTs 1.28 msNoise spectral density N0 -174 dBm/HzPathloss exponent α 3.6 -Shadowing standard deviation σ 5 dBTarget minimum data rate D0 100 KbpsTarget BER b 10−3 bpsTarget maximum outage probability ε 0.05 -Target cell radius R 100 m
Table 3: Available modulations’ SNR thresholds for b=10−3.
Modulation 64-QAM 16-QAM QPSK BPSK
zone index q 1 2 3 4γq (dB) 23.2 17 10 6.8
5 10 15 20 2520
40
60
80
100
120
140
160
Worst−case (edge−user) average SNR (dB)
Max
imum
Ran
ge (
BP
SK
) (
m)
Figure 4: Maximum attainable range (BPSK coverage) versus worst-case (edge-user) average SNR.
17

0 50 100 150 200 250 3000
0.005
0.01
0.015
0.02
0.025
0.03
0.035
0.04
Shadowed distance (m)
Nor
mal
ized
ave
rage
his
togr
am
analytic
simulated
Figure 5: Average histogram of user shadowed distance.
range RBPSK , the maximum number of users is served except those who fall beyond RBPSK in termsof shadowed distance. The achievable data rate is improved in the opposite case when the base stationdecides not to serve users beyond the cell edge by setting Rcut = R. The improvement is significantfor high SNR’s while it vanishes near SNR=20 dB where RBPSK ≃ R. The gain in achievable rateis paid for in terms of the average number of users in rate-outage as expected by equation (46). Thisis shown in Figure (7). So, a trade-off has to be found, via Rcut, between the achievable data rateand the rate-outage. By varying Rcut for a fixed total power Ptot = 10 W, we show in Figure (8) theaverage percentage of users in rate-outage versus the average maximum achievable user rate.
Now we can consider a small number of users, say U = 10, and we compare the average spectralefficiency (50) of our allocation method to the average spectral efficiency of two other methods. Thefirst one, used if no CSI is available, corresponds to a traditional “static” allocation of subcarriers andrates based on a worst-case design. The second allocation method, called “Max-Min” method, is theone introduced in [5] and reused in [7]. It is based on the assumption of full CSI knowledge that allowsan improved spectral efficiency but requires excessive feedback overhead.
In the static allocation case, the power margin must account for both effects of shadowing and fading.We found by simulation that under a composite log-normal-Rayleigh channel, the required powermargin for the specified BER and outage probability is F = 14.8 dB. This value can be retrievedanalytically using results in [12] where it was shown that a composite log-normal-Rayleigh distributionis equivalent to a modified log-normal distribution. Without any CSI, the same modulation mustbe used over all subcarriers. The modulation order M must guarantee to edge users (worst-case) therequired BER. So, M can be obtained by setting du in (28) to the cell radius R. Then, the S subcarriersmust be equally partitioned among the users so that each user achieves a data rate (S/U)B log2 M .Concerning the “Max-Min” method [7], its goal is to maximize the minimum user rate under a totalpower constraint. Maximizing the minimum rate is equivalent to maximizing the sum-rate with usershaving equal rates. In Figure 9, the spectral efficiency (50) of our allocation method is compared to thespectral efficiency of the above-mentioned methods. To make the comparison fair, the CSI is quantizedon 3 bits. This reduces the feedback overhead required by the “Max-Min” method to 3S bits per user.However, our allocation method requirement in terms of CSI precision is significantly less as shown inthe sequel.
With the static method, the whole cell is covered using the BPSK of spectral efficiency 1 bps/Hz.
18

20 20.5 21 21.5 22 22.5 23 23.5 24 24.5 250
100
200
300
400
500
600
700
800
900
1000
Worst−case (edge−user) average SNR (dB)
Use
r da
ta r
ate
(Kbp
s)
Analytic
Simulated
Rcut
= RBPSK
Rcut
= R
Figure 6: Maximum achievable user rate versus worst-case average SNR.
100 105 110 115 120 125 130 135 1400
2
4
6
8
10
12
14
16
18
20
Cut−off distance (m)
Nb.
of u
sers
in r
ate−
outa
ge/ N
b of
use
rs (
%)
Analytic
Simulated
Figure 7: Average percentage of users in rate outage versus the cut-off distance.
19

600 650 700 750 800 850 9000
2
4
6
8
10
12
14
16
18
20
Achieved user rate (Kbps)
Per
cent
age
of u
sers
in r
ate−
outa
ge (
%)
Rcut
= RBPSK
Rcut
= R
Figure 8: Trade-off between the achievable user rate and the percentage of users in rate outage.
We see that our allocation method offers a significant spectral efficiency gain compared to the staticmethod.
As mentioned earlier, the main advantages of our method are its simplicity and the limited CSI feedbackit requires. The price to be paid is some degradation in spectral efficiency compared to the “Max-Min”method that exploits frequency and multiuser diversities thanks to full CSI knowledge. We see that,despite the simplicity of our method, the spectral efficiency degradation compared to the Max-Min isacceptable. This loss is compensated by the complexity reduction and the limited feedback overheadthat our algorithm requires. Furthermore, as shown soon below, our method is very robust to imperfectCSI.
Finally, we want to characterize the sensitivity of our allocation method to CSI accuracy. ImperfectCSI is modeled by adding a zero-mean Gaussian error to the user’s shadowed distance. We assume thaterrors for different users are independent. Thus, if du is the shadowed distance of user u, the estimateddistance is du = du + eu. The error eu follows a Gaussian law of standard deviation σu = a R so thata represents the error standard deviation normalized to the cell radius R. This parameter measuresthe CSI accuracy (a perfect CSI corresponds to a = 0). Errors on shadowed distances disturb the rateallocation decision leading to unexpected BER outage events. We use the average percentage of users
in outage per frame as an overall performance metric. In Figure 10, this metric is plotted versus theaccuracy parameter a for a fully-loaded system (U = Umax) and a total power Ptot = 10 W. We noticethat the percentage of users in BER outage for perfect CSI (a = 0) is about 2 %. The degredationdoes not exceed 2 % even at a = 0.5 which corresponds to a significantly-degraded CSI. This shows therobustness of the proposed resource allocation method vis-a-vis of CSI estimation errors. So, even withcoarse estimates of users’ shadowed distances, the achieved overall performance remains acceptable. Infact, all the base station needs in order to properly allocate the resources is the index of the modulationzone each user belongs to. Assume that the base station broadcasts the modulation zones’ radii toall the users in a dedicated frame header and that the shadowed distances are estimated by usersthemselves. In this case, each user can find the index of his modulation zone and then feedback thisvalue to the base station on the uplink. This fedback information is simply a discrete value between1 and Z, the number of modulation zones. So, the feedback requires about log2 Z information bits
20

20 20.5 21 21.5 22 22.5 23 23.5 24 24.5 250
1
2
3
4
5
6
7
Worst−case average SNR (dB)
Spe
ctra
l effi
cien
cy (
bps/
Hz)
Max−Min method (full CSI) Our method (partial CSI) Static method (no CSI)
Figure 9: Average spectral efficiency of our allocation method compared to the static and Max-Min methods.
0 0.05 0.1 0.15 0.2 0.25 0.3 0.35 0.4 0.45 0.50
0.5
1
1.5
2
2.5
3
3.5
4
4.5
5
CSI accuracy parameter a
Ave
rage
per
cent
age
of u
sers
in B
ER
out
age
(%)
Figure 10: Effect of CSI accuracy measured by the parameter a on the average percentage of users in BERoutage (U = Umax, Ptot = 10 W).
21

per user. In our example above where Z = 4 zones, two bits per user are needed. This approach isequivalent to quantizing the CSI, or users’ shadowed distances, using irregular thresholds which are thezones’ radii (Rq = 51, 76, 119, 146 (m) in our example). In full CSI approaches, if the CSI is quantizedon N bits, the feedback overhead is NS bits per user. Furthermore, if the CSI for each subcarrier isreduced to the amount required by our algorithm, i.e. N = log2 Z bits per subcarrier per user, fullCSI approaches suffer from severe performance degradation and still require S log2 Z bits of feedbackper user.
8 Conclusion
In this paper, we considered the problem of resource allocation on the downlink of a single-cell OFDMAsystem under QoS fairness constraints with limited Channel State Information (CSI). Fairness wasdefined by a minimum user data rate, a target BER and a maximum outage probability. We supposedthat the only CSI available to the base station is a coarse estimation of the users’ shadowed distancesthat we defined. Thus, under the fairness constraint, a total peak power constraint and a given numberof users uniformly distributed over the cell of a given radius, we derived the optimal subcarrier andrate allocation that offers the maximum data rate per user.
Simulation results showed that our resource allocation algorithm yields a significant spectral efficiencyenhancement compared to the traditional static scheme. Meanwhile, the loss in terms of averagespectral efficiency with respect to a full-CSI-based opportunistic allocation was shown to be acceptable.In fact, this performance degradation is the price to be paid for the reduced complexity and thelow feedback overhead that our solution requires. Finally, the robustness of our algorithm to CSIestimation errors was shown which proving that even a coarse CSI is sufficient for our algorithm tooperate efficiently.
Appendix I
Here we provide the details of derivation of (44) from (43). After replacing (41) and (42) into (43) andintegrating with respect to θ, the equation to be proved becomes∫ R
0erf
(
10 log10(Rq/r)
σ√
2/α
)
rdr =1
2R2 erf
(
C logRq
R
)
+1
2R2
q e1/C2
(
1 − erf
(
C logRq
R+
1
C
))
.
The positive constant C was defined earlier by C = 10α/(σ√
2 log 10). Let Aq = C log Rq. Then, theleft-hand side (LHS) of the equation above becomes
LHS =
∫ R
0erf (Aq − C log r) rdr.
Considering the variable change y = Aq − C log r we obtain
LHS =1
Ce2Aq/C
∫ ∞
Aq−C log Re−2y/Cerf(y)dy.
Now we integrate by parts assuming that g(y) = erf(y) and df(y)/dy = −(2/C)e−(2/C)y. It followsthat dg(y)/dy = 2√
πe−y2
and f(y) = e−(2/C)y. So, we obtain
LHS = −1
2e2Aq/C
[
[f(y)g(y)]∞Aq−C log R −∫ ∞
Aq−C log Rf(y)
dg(y)
dydy
]
=1
2e2Aq/C
[
e−2(Aq−C log R)/Cerf(Aq − C log R) +2√π
∫ ∞
Aq−C log Re−
2
Cy−y2
dy
]
.
22
A new variable change x = y + 1/C in the second term integral leads to
LHS =1
2e2Aq/C
[
e−2(Aq−C log R)/Cerf(Aq − C log R) + e1/C2 2√π
∫ ∞
Aq−C log R+1/Ce−x2
dx
]
=1
2R2erf(Aq − C log R) +
1
2e1/C2
e−2Aq/C (1 − erf(Aq − C log R + 1/C)) .
Remembering that Aq = C log Rq, the wanted formula is obtained.
References
[1] IEEE std 802.16d, “Air Interface for Fixed Broadband Access Systems,” 2004.
[2] WiMax Forum, “Fixed, Nomadic, Portable and Mobile Applications for 802.16-2004 and 802.16eWiMAX Networks,” White paper, November 2005.
[3] V.S. Abhayawardhana, I.J. Wassell, D. Crosby, M.P. Sellars, M.G. Brown, “Comparison of Em-pirical Propagation Path Loss Models for Fixed Wireless Access Systems,” 61st IEEE Vehicular
Technology Conference (VTC’05), June 2005.
[4] M.-S. Alouini and A. Goldsmith, “Adaptive M-QAM Modulation over Nakagami Fading Channels,”IEEE Global Telecommunications Conference (Globecom), 1997.
[5] W. Rhee and J. Cioffi, “Increase in Capacity of Multiuser OFDM System Using Dynamic Subchan-nel Allocation”, Vehicular Technology Conference (VTC), 2000.
[6] A. Pandharipande, M. Kountouris, H. Yang, and H. Park, “Subcarrier Allocation Schemes forMultiuser OFDM Systems,” 7th IEEE International Conference on Signal Processing and Commu-
nications (SPCOM’04), December 2004.
[7] Zukang Shen, J.G. Andrews, B.L. Evans, “Adaptive Resource Allocation in Multiuser OFDMSystems with Proportional Rate Constraints,” IEEE Transactions on Wireless Communications,Vol. 4, No. 6, Nov. 2005.
[8] H. Yin and H. Liu, “An Efficient Multiuser Loading Algorithm for OFDM-Based Broadband Wire-less Systems,” IEEE Global Telecommunications Conference (Globecom), 2000.
[9] I.C. Wong, Z. Shen, B.L. Evans, J.G. Andrews, “A Low Complexity Algorithm for Proportional Re-source Allocation in OFDMA Systems,” IEEE Workshop on Signal Processing Systems (SIPS’04),Oct. 2004
[10] D. Kivanc, Li Guoqing, Liu Hui, “Computationally Efficient Bandwidth Allocation and PowerControl for OFDMA,” IEEE Transactions on Wireless Communications, Vol. 2, No. 6, Nov. 2003.
[11] A. J. Goldsmith and S.-G. Chua, “Variable Rate Variable Power MQAM for Fading Channels,”IEEE Transactions on Communications, Vol. 45, No. 10, October 1997.
[12] M.-S. Alouini and A. Goldsmith, “Area Spectral Efficiency of Cellular Mobile Radio Systems,”IEEE Trans. on Vehicular Technol. , Vol. 48, 1999.
23