
Practical Aspects of Amino Acid Balancing in the Dairy Co · Practical Aspects of Amino Acid...
67
Practical Aspects of Amino Acid Balancing in the Dairy Cow Patrick French Technical Service & Research Director RP Feed Components, East Troy, WI TAKE HOME MESSAGE The functional aspects of AA in the dairy cow are just beginning to be elucidated and their requirement for health, reproduction, cell signaling, etc. may be greater than that for production of milk and tissue protein. This may explain the tremendous impact that methionine has been shown to have in the transition cow. For prefresh transition cows, nutritionists should target a MP flow of 1,300 g/d, 30-35 g mMet and 90-95 g mLys. Body weight loss should be incorporated into modeling the fresh cow and formulating to nutrient concentrations may be more appropriate than formulating to a nutrient quantity. Metabolizable protein concentration in DM that is needed to meet the requirement of the fresh cow ranges from 12-14% and corresponding MP-Met and MP-Lys should be 2.6-2.8% and 7.0-7.2%, respectively. In the postfresh cow, indexing AA supply to energy supply should be used to optimize production. Current recommendations for the CNCPS model are 1.14 g mMet/Mcal ME and 3.03 g mLys/Mcal ME. INTRODUCTION Guidance for meeting the requirement of the most limiting AA in the lactating dairy cow was published 15 years ago by the NRC (2001). These early requirements were based on a percentage of MP (% MP) where maximal milk protein yield was reached when methionine approached 2.35% and lysine 7.08%. In the last 5 years, several authors have described the basic aspects of meeting the MP and AA needs of the lactating dairy cow (Hanigan et al., 2013; Hristov, 2013; Schwab, 2014; Tucker, 2014). This paper will focus on the practical aspects of AA balancing in the high producing dairy cow and non-lactating cattle. PREFRESH DAIRY COW Topics such as controlled energy rations and DCAD rations for the prefresh cow have received considerable research and press in the last two decades. Early work in the area of CP showed no relationship between prepartum CP intake and postpartum production, which in part was likely due to the poor relationship between ration CP and MP flow (Bell et al., 2000). More recently, Van Saun and Sniffen (2014) reported that nutritionists should target an MP flow of 1,300 g/d in close-up cow rations and suggested that the primary benefits of adequate MP are disease prevention and improved reproductive performance, in addition to improved milk component yield. The MP requirement of a close-up dry (CUD) cow as estimated by NRC (2001) is 850 g/d, which is generally recognized as too low by the dairy nutrition industry. The Cornell Net Carbohydrate and Protein System version 6.55 (CNCPS) estimates the requirement of a CUD Holstein cow to be 1,125 g/d. The discrepancy between NRC and CNCPS is almost entirely due to a mammogenesis requirement in CNCPS, which is not included in NRC. The additional 175 g MP/d beyond CNCPS recommendation as proposed by Van Saun and Sniffen (2014) is a safety factor due to the tremendous variation that exists in between cow DMI in CUD pens. A review of 18 transition cow studies published in the Journal of Dairy Science over the last 15 years shows that within experiment SD for prefresh DMI is 2.1 kg. If we are targeting 12.5 kg DMI in CUD pens, then we should assume that most (68%) of the cows are eating 10.4-14.6 kg DM. Based on a target of 104 g MP/kg DM (1,300 g MP ÷ 12.5 kg DM) only 16% of cows are consuming less than 1,082 g MP. 1
Transcript of Practical Aspects of Amino Acid Balancing in the Dairy Co · Practical Aspects of Amino Acid...

Practical Aspects of Amino Acid Balancing in the Dairy Cow Patrick French Technical Service & Research Director RP Feed Components, East Troy, WI
TAKE HOME MESSAGE
The functional aspects of AA in the dairy cow are just beginning to be elucidated and their requirement for health, reproduction, cell signaling, etc. may be greater than that for production of milk and tissue protein. This may explain the tremendous impact that methionine has been shown to have in the transition cow. For prefresh transition cows, nutritionists should target a MP flow of 1,300 g/d, 30-35 g mMet and 90-95 g mLys. Body weight loss should be incorporated into modeling the fresh cow and formulating to nutrient concentrations may be more appropriate than formulating to a nutrient quantity. Metabolizable protein concentration in DM that is needed to meet the requirement of the fresh cow ranges from 12-14% and corresponding MP-Met and MP-Lys should be 2.6-2.8% and 7.0-7.2%, respectively. In the postfresh cow, indexing AA supply to energy supply should be used to optimize production. Current recommendations for the CNCPS model are 1.14 g mMet/Mcal ME and 3.03 g mLys/Mcal ME.
INTRODUCTION
Guidance for meeting the requirement of the most limiting AA in the lactating dairy cow was published 15 years ago by the NRC (2001). These early requirements were based on a percentage of MP (% MP) where maximal milk protein yield was reached when methionine approached 2.35% and lysine 7.08%. In the last 5 years, several authors have described the basic aspects of meeting the MP and AA needs of the lactating dairy cow (Hanigan et al., 2013; Hristov, 2013; Schwab, 2014; Tucker, 2014). This paper will focus on the practical aspects of AA balancing in the high producing dairy cow and non-lactating cattle.
PREFRESH DAIRY COW
Topics such as controlled energy rations and DCAD rations for the prefresh cow have received considerable research and press in the last two decades. Early work in the area of CP showed no relationship between prepartum CP intake and postpartum production, which in part was likely due to the poor relationship between ration CP and MP flow (Bell et al., 2000). More recently, Van Saun and Sniffen (2014) reported that nutritionists should target an MP flow of 1,300 g/d in close-up cow rations and suggested that the primary benefits of adequate MP are disease prevention and improved reproductive performance, in addition to improved milk component yield.
The MP requirement of a close-up dry (CUD) cow as estimated by NRC (2001) is 850 g/d, which is generally recognized as too low by the dairy nutrition industry. The Cornell Net Carbohydrate and Protein System version 6.55 (CNCPS) estimates the requirement of a CUD Holstein cow to be 1,125 g/d. The discrepancy between NRC and CNCPS is almost entirely due to a mammogenesis requirement in CNCPS, which is not included in NRC. The additional 175 g MP/d beyond CNCPS recommendation as proposed by Van Saun and Sniffen (2014) is a safety factor due to the tremendous variation that exists in between cow DMI in CUD pens. A review of 18 transition cow studies published in the Journal of Dairy Science over the last 15 years shows that within experiment SD for prefresh DMI is 2.1 kg. If we are targeting 12.5 kg DMI in CUD pens, then we should assume that most (68%) of the cows are eating 10.4-14.6 kg DM. Based on a target of 104 g MP/kg DM (1,300 g MP ÷ 12.5 kg DM) only 16% of cows are consuming less than 1,082 g MP.
1

Based on a retrospective analysis of published research, French (2012) supports the 1,300 g MP/d target for CUD based on postpartum yield response from a diverse set of rations. As mentioned above, positive responses from formulating at 1,300 g MP/d may be due to individual cow DMI variability and meeting the requirement of most of the cows or MP requirement for the average cow may be closer to 1,300 g/d.
Limited information exists on the AA needs of the CUD. Kudrna et al. (2009) fed transition cows one of four rations in a 2x2 factorial design where cows were supplemented with or without Mepron®
prefresh and immediately after calving both groups were further divided into two groups supplemented with or without Mepron®. Supplementation with Mepron® increased prefresh metabolizable methionine (mMet) from 24 to 35 g based on CNCPS. The prefresh rations supplied 84 g MP/kg DM and are considered low MP based on current recommendations. Regardless, supplying additional mMet prefresh, postfresh, or both increased component corrected milk (CCM) by 5.1%, 5.0%, and 8.5%, respectively. Osorio et al. (2013) increased mMet from 25 to 32 g in 90 g MP/kg prefresh rations based on CNCPS and methionine supplementation continued through the postpartum period. Supplying additional mMet during the transition period improved CCM by 10.9%.
Amino acid recommendations for CUD cows are poorly defined by nutritional models. However, a reasonable starting point is adapting the ideal AA profile of lactating cows and applying it to prefresh cows. Following this methodology and using CNCPS ideal AA profiles (2.6% MP-Met and 7.0% MP-Lys) the recommended mMet and mLys for prefresh cows is 34 g/d and 91 g/d, respectively. These calculated recommendations are very close to those suggested by French (2012) where postpartum milk protein yield was maximized when the CUD ration provided 30-35 g mMet and 90-95 g mLys. These targets are based on achieving 12-14 kg DMI with 100 g MP/kg DM. It will be difficult to achieve 1,300 g MP, 35 g mMet, and 90 g mLys at lower DMI. However, these targets are not the minimum threshold that must be achieved to reap the benefits of MP and AA. The response to additional MP and AA appears to be curvilinear and an increase from 25 to 30 g mMet is likely more beneficial than an increase from 30 to 35 g mMet.
In 1999, Drackley wrote that the biology and nutrition of the transition cow was the final frontier. Seventeen years later there are still opportunities in the transition cow frontier. Although loosely defined recommendations exist for MP and AA in the transition cow these guidelines are largely based on production outcomes, and the greatest opportunity exists with the functional aspects of AA and their role in health, reproduction, cell signaling, and regulation of gene expression. Functional AA can be nutritionally essential, nonessential, or conditionally essential AA as shown in Table 1 (Wu, 2013).
Of the co-limiting, nutritionally essential AA only Met is considered a functional AA. Supplying additional mMet to a ration already sufficient in mMet increased proliferative ability of peripheral blood T lymphocytes in mid-lactation cows (Soder and Holden, 1999). More recently, Osorio et al. (2014)
Table 1. Classification of AA in animal nutrition (Wu, 2013)
Mammals Poultry
EAA NEAA CEAA EAA NEAA CEAA
Arga Ala Glna Arga Ala Glna Cysa Asn Glua Cysa Asn Glua His Aspa Glya Glya Aspa Taua Ile Ser Proa His Ser Leua Tauc Ile Lys Leua Meta Lys Phe Meta Thr Phe Trpa Proa Tyra Thr Val Trpa Tyra Val
EAA nutritionally essential AA, NEAA nutritionally nonessential AA, CEAA conditionally essential AA aFunctional AA
2

reported that inflammatory biomarkers indicated improved metabolic status in transition cows supplied additional mMet.
FRESH DAIRY COW
A reasonable starting point for supplying adequate AA to fresh cows is using nutrition models and base supply on requirements. In order to accurately model the fresh cow, one must consider the contribution of BW loss to the energy supply. A review of 18 transition cow studies published in the Journal of Dairy Science shows that the average BCS change is from prefresh to fresh is 0.4 units, where prefresh BCS was the average over the last 21 days of gestation and fresh was the average over the first 21-28 DIM. The fresh cow will be undersupplied approximately 100 g MP (6% of requirement) relative to ME if BCS loss is not considered assuming 0.4 units BCS loss over the first 30 DIM. Typical MP concentrations of postfresh (28+ DIM) rations range from 10-12% and appear satisfactory in ration models if BW loss of fresh cows is ignored. When BW loss is incorporated into modeling the MP concentration in DM that is needed to meet the requirement of the fresh cow ranges from 12-14%. Since fresh cow pens are very dynamic in DIM and DMI, formulating to nutrient concentrations may be more appropriate than formulating to a nutrient quantity at this stage of lactation.
The practical standard for the AA profile of MP for fresh cows should be at least similar to that shown to optimize production, which is 2.6% MP-Met and 7.0% MP-Lys. Kudrna et al. (2009) fed fresh cows rations supplying 2.65% MP-Met and CCM was improved 5.0-8.5%. Soder and Holden (1999) fed early lactation cows a ration supplying 2.7% MP-Met and some biomarkers of immune function were improved. Given that the functional requirement of an AA may be greater than its productive requirement a working range of 2.6-2.8% MP-Met is recommended for fresh cows. Furthermore, if maintaining Lys:Met at 2.6-2.7:1 then MP-Lys for fresh cow rations should fall in the range of 7.0-7.2%.
POSTFRESH DAIRY COW
Updated NRC (2001) recommendations for MP-Met and MP-Lys for maximal milk protein are 2.28 and 6.83, respectively (Whitehouse et al., 2013). Similar breakpoint estimates for CNCPS are 2.6% MP-Met and 7.0% MP-Lys to maximize milk protein yield. These recommendations work best when energy is not limiting and MP is neither in excess or deficiency. If energy is limiting, then efficient utilization of MP and AA will not occur. Likewise, if MP is limiting even a balanced AA profile in MP will result in a shortage of essential AA. Therefore, it seems logical to couple AA to energy, the most limiting nutrient in high producing dairy cattle rations.
Recognizing the interrelationship of protein and energy, Hague et al. (2013) formulated research rations to ensure a protein-to-energy ratio of 66 g of PDIE/Mcal of NEL. Protein digested in the small intestine (PDIE) is the sum of dietary RUP and microbial protein from rumen-fermented OM (INRA, 1989). Equating PDIE to MP and assuming a conversion of ME to NEL of 64%, an adequate MP to ME ration is 42 g MP/Mcal ME. This is very close to 44 g MP/Mcal ME for a Holstein cow modeled in CNCPS. Van Amburgh and coworkers (2015) at Cornell have taken the interrelationship of MP and energy a step further and applied it to AA. Table 2 presents the
Table 2. Calculated optimum supply of metabolizable AA relative metabolizable energy, as a percentage of total AA, and as a ratio with Met for CNCPS v6.5 (Van Amburgh et al., 2015).
AA g AA/Mcal ME % EAA Met:AA Ratio
Arg 2.04 10.2 0.56 His 0.91 4.5 1.27 Ile 2.16 10.8 0.53 Leu 3.42 17.0 0.34 Lys 3.03 15.1 0.38 Met 1.14 5.7 1.00 Phe 2.15 10.7 0.53 Thr 2.14 10.7 0.53 Trp 0.59 2.9 1.97 Val 2.48 12.4 0.46
3

calculated optimum supply of metabolizable AA relative metabolizable energy for CNCPS. Methionine and Lys should be provided at 1.14 g/Mcal ME and 3.03 g/Mcal ME, respectively.
CONCLUSION
Amino acid supply can be expressed in several ways, such as g/d, % MP, and g/Mcal ME and each have applicability depending on stage of lactation cycle of the cow. At this point in time it seems most appropriate to target 30-35 g mMet/d in the prefresh cow, 2.6-2.8% MP-Met in the fresh cow, and 1.14 g mMet/Mcal ME. For lysine, benchmarks are target 90-95 g mLys/d in the prefresh cow, 7.0-7.2% MP-Met in the fresh cow, and 3.03 g mLys/Mcal ME.
REFERENCES
Bell A. W., W. S. Burhans and T. R. Overton. 2000. Protein nutrition in late pregnancy, maternal protein reserves and lactation performance in dairy cows. Proc. Nutr. Soc. 59:119-126.
Drackley, J. K. 1999. Biology of dairy cows during the transition period: the final frontier. J. Dairy Sci. 82:2259-2273.
French, P. D. 2012. French P. How to meet the MP & AA needs of “most” cows. In Proc Penn State Dairy Cattle Nutr. Conf. Grantville, PA.
Hanigan, M. D., S. I. Arriola Apelo, and M. Aguilar. 2013. Feeding low crude protein diets to improve efficiency of nitrogen use. Pages 224-237 in Proc. Western Dairy Mgt. Conf. Reno, NV.
Haque, M. N., H. Rulquin , and S. Lemosquet. 2013. Milk protein responses in dairy cows to changes in postruminal supplies of arginine, isoleucine, and valine. J. Dairy Sci. 96:420-430.
Hristov, A. N. 2013. Feeding metabolizable protein-deficient rations is a reality with rumen protected amino acid supplementation. Pages 7-24 in Proc. Pacific NW Anim. Nutr. Conf. Coeur d’Alene, ID.
INRA. 1989. Ruminant Nutrition: Recommended Allowances and Feed Tables. INRA Editions, Paris, France.
Kudrna, V., J. Illek, M. Marounek, and A. Nguyen Ngoc. 2009. Feeding ruminally protected methionine to pre- and postpartum dairy cows: effect on milk performance, milk composition and blood parameters. Czech J. Anim. Sci. 54:395-402.
National Research Council. 2001. Nutrient Requirements of Dairy Cattle. 7th rev. ed. Natl. Acad. Sci., Washington, DC.
Osorio, J. S., P. Ji, J. K. Drackley, D. Luchini, and J. J. Loor. 2013. Supplemental Smartamine M or MetaSmart during the transition period benefits postpartal cow performance and blood neutrophil function. J. Dairy Sci. 96:6248-6263.
Osorio, J. S., E. Trevisi, P. Ji, J.K. Drackley, D. Luchini, G. Bertoni, J.J. Loor. 2014. Biomarkers of inflammation, metabolism, and oxidative stress in blood, liver, and milk reveal a better immunometabolic status in peripartal cows supplemented with Smartamine M or MetaSmart. J. Dairy Sci. 97:7437-7450.
Schwab, C. G. 2014. Basic aspects of amino acid nutrition in lactating cattle. Pages 6-13 in Four-State Dairy Nutr. and Mgt. Conf. Dubuque, IA.
Soder, K. J., and L. A. Holden. 1999. Lymphocyte proliferation response of lactating dairy cows fed varying concentrations of rumen-protected methionine. J. Dairy Sci. 82:1935-1942.
Tucker, H. A. 2014. Metabolism and performance responses to protein and amino acid supply – latest applications. Pages 37-47 in Proc. Cornell Nutr. Conf. Dept. of Animal Science, Cornell University, Ithaca, NY.
Van Amburgh, M. E., R. J. Higgs, A. Foskolos, D. A. Ross, and L. E. Chase. 2015. Updates to the CNCPS v6.5 and a Perspective on the Future. In Proc. Mid-South Rum. Nutr. Conf. Grapevine, TX.
Van Saun R. J., and C. J. Sniffen. 2014. Transition cow nutrition and feeding management for disease prevention. Vet. Clin. Food Anim. 30:689-719.
Whitehouse, N. L., C. G. Schwab, T. Tylutki, and B. K. Sloan. 2013. Optimal lysine and methionine concentrators for milk protein production as determined with the latest versions of Dairy NRC 2001 and AMTS.Cattle. J. Dairy Sci. 93 (Suppl.1):253. (Abstr.)
4

The Future of Livestock Nutrition and Alternatives to Antibiotics
Dr. Steven C. Ricke Wray Food Safety Endowed Chair and Director of the Center for Food Safety, IFSE Food Science Department, Division of Agriculture University of Arkansas, Fayetteville, AR Email: [email protected]
Take Home Message As antibiotics continue to be phased out of livestock production, alternative feed amendments have received increased interest not only from a research standpoint but for commercial application. Most of the emphasis to date has focused on food safety aspects, particularly on lowering the incidence of foodborne pathogens in livestock. Several candidates are currently either being examined or are already being implemented in commercial settings. Among these candidates are organic acids, botanical compounds, bacteriophage, prebiotics, and probiotics. They are all mechanistically different to some extent with some such as bacteriophage being capable of lysing colonized pathogens in the gastrointestinal tract and others such as probiotics and prebiotics shifting the gastrointestinal microbiota towards microorganisms that are antagonistic to pathogen establishment. While some success has been achieved with reducing foodborne pathogen levels in livestock, more recent interest is now emerging on the impact of these compounds and additives on livestock performance and sustainability. However, much less is known about the influence of these various alternatives on nutrition and performance of animals fed these compounds. Now the ability to conduct various molecular methodologies on assessing the gastrointestinal microbiome as well as the host gastrointestinal tract tissues that interface with the gastrointestinal microbiome offers tremendous opportunities to assess gut-host responses to dietary amendments. The eventual outcome of these efforts could lead to more precise strategies for identifying antibiotic alternatives that meet specific livestock production parameters under different management conditions. Introduction As the global food demand continues to increase more pressure will be placed on agriculture to improve productivity of cereal crops, fruits and vegetables and other commodity groups and provide more high quality protein sources (Swick, 2006; Chalova et al., 2009a). This will place further demands on soil fertility, water use and the overall environmental footprint from agricultural activities. Consequently, sustainability in agricultural practices will need to be balanced with any improvements made in technologies being developed to improve productivity. In response to this need to balance production more efforts are being made using Life Cycle Assessment (LCA) approaches to account for all inputs and outputs for a wide range of variables (Guinée et al., 2011; Hellweg, and Milà i Canals. 2014). These include parameters such as energy, nutrient and water usage as well greenhouse gas emissions (Cooper, 2012; Stoessel et al., 2012). Non-environmental factors are also being modeled such as social LCAs to assess impacts on human activities and economic LCAs (Benoît et al., 2010; Hellweg, and Milà i Canals. 2014). As more data is generated and/or becomes available it is anticipated that these models will become more and more useful for matching environmental demands with economic and perhaps social limitations. In addition to general demands for increases in global food production specific preferences for individual agricultural products will also change. As income levels of individual citizens rise in countries where the their respective national economy is improving the demand for high quality animal derived protein products will also increase thus putting demands on red meat, seafood, poultry and egg production (Speedy, 2002). This presents a challenge to the livestock industry to
37

generate their respective protein products more efficiently from the feed their livestock species consume (Chadd et al., 2002; Chalova et al., 2009a). Consequently, more emphasis on feed efficiency and conversion to gain rather than outright rate of gain are becoming more important economically as a performance criteria. However, improvements on feed conversion are further confounded by the removal of traditional feed additives such as antibiotics that can help to reduce mortalities and generally improve performance (Chen et al., 2015). There has been considerable public concern in recent years on the potential impact of widespread antibiotic use in the food animal industry and the potential for the emergence of antibiotic resistant bacterial pathogens that are of human clinical importance (Chen et al., 2015). Consequently, there has been increasing pressure on suppliers by food retailers to produce antibiotic-free animal products for sale that can be advertised as such. Removal of dietary additives such as antibiotics presents a dilemma for livestock production as it not only loses potential performance responses gained by their presence but the industry must now find alternatives to antibiotics to economically recover these benefits. This is made more difficult as the actual mechanism(s) whereby antibiotics were growth promoting to the animal are not necessarily known. Thus the selection mechanisms for suitable replacements are not well established. It has now also become clear that the gastrointestinal microbiota play a much more prominent role in the host animal’s response to dietary changes and supplementation of feed additives. This is a function not only of the gut microbiota’s direct response to the feed material but the influence that the establishment of the gut microbiota has on the metabolic and immunological development of the host as it interacts with the incoming array of microorganisms. Consequently, feed additives such as probiotics and prebiotics have received more attention now, perhaps more than ever before because of their fairly clear-cut impacts on the establishment of particular microorganisms in the gut and the subsequent selection for certain microorganisms more beneficial to the host. In this review potential alternatives to antibiotics will be discussed, the rationale for their use, and future research directions that need to be considered. Antibiotics in Livestock Essentially the group of compounds often referred to collectively as “antibiotics” are chemical entities produced by either fungi or in some cases bacteria that when produced by the respective organism or added independently of the organism inhibits other bacteria. In a more general sense antibiotics can be considered a subset of the much more broadly defined group known as “antimicrobials”, which include not only antibiotic compounds produced by organisms but chemicals and other substances that are either bacteriostatic or bactericidal towards the target microorganism. Antimicrobials can include a wide variety of compounds and chemicals including organic acids, chemical disinfectants such as chlorine-based compounds, and hydrogen peroxide just to name a few (Ricke, 2003, Ricke et al. 2005). Some of these antimicrobials such as organic acids have a long history of use in the food animal industry as feed additives to control fungal contamination and limit foodborne pathogen establishment in the gastrointestinal tract of animals as well as in human foods as preservatives (Cherrington et al., 1991; Ricke, 2003). The practice of adding antibiotics as growth promoting agents in animal feeds has a long history beginning in the late 1940’s when it was noted that inclusion of antibiotics increased weight gain in farm animals such as chickens and by 1951 the United States Food and Drug Administration (FDA) approved the use of antibiotics in animal feeds without a veterinary prescription (Jones and Ricke, 2003). However, even early on it was believed that antibiotic supplementation in farm animal diets could also serve to create a reservoir in farm animals for antibiotic resistant clinically important bacterial pathogens that are also typically isolated from humans (Smith, 1968; Levy et al., 1976; Armstrong, 1984; Neu, 1992). As more became known, antibiotic resistance was a concern due to the presence of resistant organisms that possessed genes being capable of generating the mechanisms for overcoming the toxicity of a particular antibiotic either by modifying the antibiotic itself or altering the cellular target to make the organism less susceptible. However, the greater
38

concern emerged when it was realized that antibiotic resistant gene systems could not only be passed from one generation of antibiotic resistant bacterial cells to the next but that these same genes could also be easily transferred not only within a population of the same bacterial species but also among unrelated bacterial species. Finally, the fact that bacteria could express resistance to multiple antibiotics simultaneously led to the realization that this could be very problematic for clinical treatment of clinical bacterial diseases. As concerns over the increases in antibiotic resistance in bacterial pathogens led to more problems with treatment of clinical diseases, controversies surrounding non-veterinary antibiotic use in farm animal management in the U.S. and Europe became more prominent (Glynn et al., 1998; Monnet 1999; Koutsolioutsou et al., 2001). This became more of a food safety issue when it was realized that the primary foodborne pathogens, Salmonella, Listeria, pathogenic Escherichia coli, and Campylobacter were all capable of expressing antibiotic resistance to clinically important antibiotics and in some cases were capable of expressing multiple antibiotic properties (Lungu et al., 2011; Chen, 2015; Chen et al., 2015; Jarvis et al., 2015; Ricke and Rivera Calo, 2015; Rossi et al., 2015; Cha et al., 2016). Consequently, increasing public awareness of this issue along with the increasing commercial interest in antibiotic-free production systems such as organically and naturally-labelled food products (Ricke et al., 2012b) added to the momentum towards consumer demands for antibiotic-free conventionally produced meat products and the corresponding retailer and restaurant requirements for these items. As the demand for antibiotic-free meat products increases the need for feed additive alternatives during livestock rearing that not only retain performance gains already achieved but also reduce bacterial pathogen loads and support systemic improvements in overall food safety management are more urgently needed. Alternatives to Antibiotics for Livestock Management – Biological Compounds and Bacteriophage There are a number of intervention strategies that have been either implemented, experimentally tested, or at least suggested as possible alternatives to antibiotic supplementation in livestock production. Most of the focus thus far has been directed toward development of interventions to prevent gastrointestinal colonization of foodborne pathogens. These intervention and control measures for live animal production can be broadly categorized as either capable of eliminating already colonized foodborne pathogens or prevention of initial colonization. Administration of antimicrobials such as organic acids, essential oils and other botanicals, and bacteriophage have all been examined as a means to limit foodborne pathogens either already colonized in the gastrointestinal tract or in some cases prevent colonization (Joerger, 2003; O’Bryan et al., 2015; Ricke, 2003; Ricke et al., 2012a). Some of these such as organic acids and botanicals are fairly broad spectrum and potentially could also have an impact on the nonpathogenic gastrointestinal microbiota. While some of the bactericidal and bacteriostatic mechanisms are understood to some extent particularly for organic acids, much remains to be determined at the molecular level. This is particularly critical since bacteria can become resistant to some of these organic acids via acid tolerance systems. The same can be said of botanicals although these compounds represent a much more chemically diverse group of compounds many of which remain somewhat undefined in terms of chemical structure and the corresponding effect on bacterial cells. Other unknowns remain with many of these compounds, particularly their respective activities once introduced into diets and after entrance into the gastrointestinal tracts of animals consuming them. For example using radioactively labelled propionate it was demonstrated that when chickens were gavaged with the labelled compound most of the organic acid was absorbed long before it reached the ceca thus minimizing any effect it might have in the lower parts of the gastrointestinal tract (Hume et al., 1993). It is quite possible that as of yet undetermined changes could occur to some of these compounds as they enter the more highly anaerobic sections of the gastrointestinal tract such as the ceca of chickens. Likewise, the highly anaerobic nature of the foregut or rumen of the ruminant animal with its highly complex microbiota could immediately alter the nature of incoming
39

antimicrobial compounds before they reach the small intestine. In addition to potential effects on the resident gastrointestinal microbial populations host responses could also vary. The specific tissue responses of the host is to changes in the indigenous gastrointestinal microbiota and/or changes in the bacterial metabolic and fermentation activities remains to be determined. As molecular approaches such as transcriptomics becomes more advanced some of this may become better understood and allow for more precise targeting of the antimicrobial compound being fed. Bacteriophages can be defined in simple terms as bacterial viruses which upon gaining entry to the bacterial cell can replicate within the bacterial cell and eventually lyse the bacterial cell releasing phage particles to infect other target bacteria. Bacteriophage unlike organic acids and botanicals are quite specific being able to target a particular bacterial species and at times can even be strain specific within a species. When administered to the gastrointestinal tract to limit pathogens such as Salmonella mixed results have been recorded as apparently high dosages of phage are required to be effective (Ricke et al., 2012a). Part of this may be due to the barriers such as the gastric acidity and proteolytic enzymes present in the gastrointestinal tract that can inactivate bacteriophage particles (Ricke et al., 2012a). Even if they reach the target, the phage particles still must contend with a highly dense microbiota which detracts against optimal phage-host bacterial contact. Finally, target bacterial pathogens can develop a variety of resistance mechanisms rendering them recalcitrant to the lytic properties of the phage. In future work optimization approaches will probably need to consider developing some sort of carrier system that can ensure delivery of bacteriophage to the target site in the gastrointestinal tract and overcome some of the obstacles present in this ecosystem. Alternatives to Antibiotics for Livestock Management – Vaccines, Probiotics, and Prebiotics Vaccines, probiotics and prebiotics while mechanistically quite different represent approaches to essentially prevent microbial pathogen colonization in the gastrointestinal tract. Vaccines involve essentially some form of the target bacterial either as killed cells or an attenuated virulent but live cell version that can be used to trigger the immune system of the animal host to mount an immune response to later exposure to the wildtype bacterial pathogen in question. Considerable research has been conducted to develop vaccines for foodborne pathogens such as Salmonella and several are now available commercially and have been summarized extensively elsewhere; thus will not be discussed in the current review (Revolledo and Ferreira, 2012). Probiotics consist of live bacterial cultures that when administered to an animal provide certain benefits to the recipient host (Nisbet, 2002; Revolledo et al., 2006; Callaway and Ricke, 2012; Siragusa and Ricke, 2012). Selection and optimization of probiotic cultures have generally focused on screening bacterial candidates for prevention of foodborne pathogen establishment in the gastrointestinal tract. Initially, undefined cultures (bacterial species not identified and therefore unknown) retrieved from chickens not colonized by Salmonella were used to inoculate chicks and demonstrate protection against later infection by Salmonella (Nurmi and Rantala, 1973). However, regulatory demands and other criteria encouraged the development of defined probiotic cultures (all bacterial species identified) for commercial application. Defined probiotics also referred to as competitive exclusion cultures were initially developed as fairly complex mixtures of microbial species forming a metabolic consortia that could be introduced to young chicks relatively soon after hatch. The idea was that such bacteria once introduced into the gastrointestinal tract could become established and produce fermentation products such as short chain volatile acids (SCFA including acetate, propionate, and butyrate) that would be inhibitory to establishment of pathogens (Ricke, 2003). For example, when mixtures of 29 chick cecal organisms selected in the laboratory by continuous culture generating propionic acid as a primary fermentation product were introduced to young chicks they were still capable of producing propionic acid in vivo and limiting Salmonella colonization of the gastrointestinal tract (Nisbet et al., 1996a,b). Since this time more research and development on competitive exclusion cultures has been conducted to generate simpler bacterial mixtures and in some cases single bacterial cultures that are now being commercially marketed
40

(Callaway and Ricke, 2012; Siragusa and Ricke, 2012; Hanning et al., 2015; Callaway et al., 2016). In recent times to better fit with feed manufacturing and feed mill operations spore formers such as Bacillus species have been screened for probiotic properties and incorporated as spores to be fed to chickens where once they reach the gastrointestinal tract they are expected to germinate into vegetative bacterial cells (Ricke and Saengkerdsub. 2015). Prebiotics are compounds which when included as a dietary supplement can be utilized by individual members of the gastrointestinal microbiota that would be considered beneficial to the host (Patterson and Burkholder, 2003). Typically such bacteria that are considered beneficial to the host include bifidobacteria and bacterial species belonging to the lactobacilli group. These bacterial species are believed to produce SCFA and/or lactic acid which are antagonistic to pathogenic bacteria and therefore limit their establishment in the gastrointestinal tract (Ricke, 2003, 2015). Prebiotic compounds typically are complex carbohydrate compounds that are indigestible by the host but can be utilized by bacteria such as bifidobacteria and lactic acid bacteria. Probably the best known and one of the more commonly used prebiotic compounds is fructooligosaccharide (FOS; Ricke, 2015). Others include galactooligosaccharides and various mannan derivatives from yeast products (Roto et al., 2015; Ricke, 2016). As more is becoming known about the gastrointestinal microbiome via sequencing and subsequent identification and functionality of specific resident gastrointestinal bacteria, the definition of what a prebiotic is from a structural standpoint and how it behaves mechanistically is evolving. As a result it is now being suggested that prebiotics may in fact be a broader group of indigestible carbohydrate compounds and by definition are probably more identified by their impact on the gastrointestinal microbiota (Hutkins et al., 2016; Ricke et al., 2016). It is anticipated that as more becomes known about the gastrointestinal microbiota both in terms of makeup as well as functionality that the role(s) prebiotics play will become more refined and in turn the construction of novel prebiotics may be more specifically directed towards particular gastrointestinal microbial targets and/or host functions. Potential Management Tools for Improving Livestock Management While antibiotics are being phased out, efforts to find suitable acceptable replacements is only beginning to become extensively researched to identify suitable feed additive candidates and establish functional criteria for screening. However, changing feed additives is not the only means to address the fundamental concept of improving animal performance and efficiency. Development and employment of other management tools are coming onto play that should offer some options for improved efficiency in overall animal production systems. Improving livestock management in a more comprehensive manner offers the opportunity to improve efficiency on multiple fronts including not just the standard nutritional and veterinary practices but other sometimes less obvious cost/ benefit factors. Some of these tools such as LCA – based approaches offer better management strategies by using a balance sheet approach to account for all inputs and outputs for a multitude of operational costs and factors that could influence economic and environmental impact. Like their agronomic counterparts, livestock based-LCA assessments are now being generated for most of the animal, dairy, poultry meat and egg layer production cycles as well as food processing systems for most of the corresponding dairy, egg, and meat products (Boggia et al., 2010; Leinonen et al., 2012; Wiedemann et al., 2012; Coderoni et al. 2015; Skunca et al., 2015). Incorporation of a balance sheet type approach offers opportunities to not only better manage costs and minimize the environmental footprint but helps to identify potential steps or management practices where improvements and adjustments can be made. Secondly, methods are being developed to achieve more rapid assessment of bioavailability of individual nutrients such as amino acids that in turn should eventually lead to more precise nutritional formulation (Erickson et al. 2002; Froelich, Jr. and Ricke, 2005; Chalova et al., 2009a,b, 2010). For example, Escherichia coli-based whole cell fluorescent sensors for lysine and methionine biological availability have been constructed. In particular, E. coli lysine biosensors have proven to be quantitatively comparable to chick growth responses to limiting crystalline lysine added to the diet
41

(Chalova et al. 2007). As these biosensors are developed further, the opportunity to adjust and make more instantaneous changes in dietary mixtures to balance the addition of purified amino acids with the bioavailability of corresponding amino acid(s) in the dietary proteins to meet the animal requirements without over-supplementation becomes possible. This is important because unnecessary over - supplementation of an amino acid is not only added cost but can result in excessive livestock nitrogen emissions which in turn can potentially lead to pollution of groundwater sources (Kim et al., 2006). As such nutrient based sensors become more sophisticated it is anticipated that feeds could be formulated and mixed at the feed mill perhaps based entirely on in vitro laboratory assessment of the bioavailability of the nutrient profiles in the feed components. Conclusions and Future Directions As antibiotics become phased out of livestock production, alternatives are needed to retain any of the potential performance and health gains made via the supplementation of antibiotics. There are several candidates including chemicals such as organic acids and various botanical sources of compounds along with competitive exclusion/probiotic cultures and prebiotics. Most of these have been identified and/or applied based on their abilities to exclude or in some cases eliminate foodborne pathogens in the gastrointestinal tract. Some have proven to be more effective than others for specific pathogens while others are considered more broad spectrum. However, mechanisms in terms of how they function in the gastrointestinal tract are quite variable and in many cases are not known. As more work is done at the molecular level both on the gastrointestinal tract microbiota as well as on individual foodborne pathogens present under these conditions it is conceivable that not only will specific mechanisms be identified but in some cases better targets for more effective application. Much less is known about the impact of these various alternatives on nutrition and performance of animals fed these compounds. Some of this is due to the historical emphasis on the food safety and foodborne pathogen aspect. However, in the past the research tools were lacking that would have enabled more refined and detailed characterization of the host responses. Now the ability to conduct various “omics” methodologies such as proteomics and transcriptomics on internal host tissues as well as the tissue linings of the gastrointestinal tract that interface with the attached gastrointestinal microbiota offers tremendous opportunities to assess host responses to alterations in gastrointestinal bacterial makeup as well as changes in metabolism and fermentation. Documentation of host immune and inflammation responses could help to delineate shifts in host health and performance after exposure to certain changes in the gut ecosystem. Finally, in-depth documentation of the gastrointestinal microbiota may reveal how these organisms interact and in some cases perhaps compete with the host for particular nutrients being supplied in the diet. The eventual outcome of these efforts could lead to more precise strategies for identifying antibiotic alternatives that meet specific livestock production parameters under different management conditions. References Armstrong, D. G. 1984. Antibiotics as feed additives for ruminant livestock .Pages 331-347 in
Antimicrobials and Agriculture—Proceedings of the 4th International Symposium in Agriculture: Benefits and Malefits. M. Woodbine, (Ed). Buttersworths, London, UK.
Benoît, C., G.A. Norris, S. Valdivia, A. Ciroth, A. Moberg, U. Bos, S. Prakash, C. Ugaya, and T. Beck. 2010. The guidelines for social life cycle assessment of products: just in time! Int. J. Life Cycle Assess.15:156-163.
Boggia, A., L. Paolotti, and C. Castellini. 2010. Environmental impact evaluation of conventional, organic and organic-plus poultry production systems using life cycle assessment. World’s Poultry Sci. J. 66: 95-114.
42

Callaway, T.R., T.S. Edrington, J.A. Byrd, D.J. Nisbet, and S.C. Ricke. 2016. Chapter 15. Use of direct fed microbials in layer hen production - Performance response and Salmonella control. In S.C. Ricke and R.K. Gast (Eds.). Producing Safe Eggs-The Microbial Ecology of Salmonella. Elsevier, Inc., San Diego, CA. (In press).
Callaway, T.R. and S.C. Ricke (Eds.), 2012. Direct Fed Microbials/Prebiotics for Animals: Science and Mechanisms of Action, Springer Science, New York, NY, 206 pp.
Cha, W., S.L. Wengert, P. Singh, D.W. Newton, H. Salimnia, P. Lephart, W. Khalife, L.S. Mansfield, J.T. Rudrik, and S.D. Manning. 2016. Antimicrobial susceptibility profiles of human Campylobacter jejuni isolates and association with phylogenetic lineages. Frontiers in Microbiology 7 (Artcle 589): 1-12. Doi: 10.3389/fmicb.2016.00589.
Chadd, S.A., W.P. Davies, and J.M. Kolvisto. 2002, Practical production of protein for food animals. FAO Animal Production and Health Division, pp 77-123.
Chalova, V.I., C.A. Froelich, Jr., and S.C. Ricke. 2010. Potential for development of an Escherichia coli – based biosensor for assessing bioavailable methionine: A review. Sensors 10: 3562-3584.
Chalova V.I., R.C. Anderson, D.J. Nisbet and S.C. Ricke 2009a. Chapter 5. Biosensors in the animal industry - the need for better nutritional management in the face of rising corn costs and increased ethanol demand. In: Bioprocess & Bioproducts - Technology Trends & Opportunities, S. Biswas, N. Kaushik and A. Pandey (eds) Asiatech Publishers, Inc., New Delhi India, pp. 66-87.
Chalova, V.I., S. Sirsat, C.A. O’Bryan, P.G. Crandall, and S.C. Ricke. 2009b. Escherichia coli, an intestinal microorganism, as a biosensor for amino acid bioavailability quantification. Sensors 9: 7038-7057.
Chalova, V.I., W.K. Kim, C.L. Woodward, and S.C. Ricke. 2007. Quantification of total and bioavailable lysine in feed protein sources by a whole cell green fluorescent protein growth-based biosensor. Appl. Microbiol. Biotechnol. 76: 91-99.
Chen, C.-Y., X. Yan, and C. Jackson (Eds.). 2015. Antimicrobial Resistance and Food Safety: Methods and Techniques. Academic Press/Elsevier Science, Amsterdam, The Netherlands.
Chen, J. 2015. Chapter 2. Antimicrobial resistance in shiga toxin-producing Escherichia coli In: Chin-Yi Chen, Xianghe Yan, and Charlene Jackson (Eds.). Antimicrobial Resistance and Food Safety: Methods and Techniques. Academic Press/Elsevier Science, Amsterdam, The Netherlands. pp. 19-36.
Cherrington, C.A., M. Hinton, G.C. Mead, and I. Chopra.1991. Organic acids: Chemistry, antibacterial activity andpractical applications. Adv. Microb. Physiol. 32:87-108.
Coderoni, S., L. Valli, and M. Canavari. 2015. Climate change mitigation options in the Italian livestock sector. EuroChoices 14(1): 17-24.
Cooper, D.C. 2012. Sustainability and energy development: Influences of greenhouse gas emission reduction options on water use in energy production. Environmental Sci. & Technol. 46: 3509−3518.
Erickson, A.M., X. Li, I.B. Zabala-Diaz, and S.C. Ricke. 2002. Potential for measurement of lysine bioavailability in poultry feeds by microbiological assays-A Review. J. Rapid Methods Automation Microbiol.10: 1-8.
Froelich Jr., C.A. and S.C. Ricke. 2005. Rapid bacterial-based bioassays for quantifying methionine bioavailability in animal feeds: A review. J. Rapid Meths. Auto. Microbiol. 13: 1-10.
Glynn, M. K., C. Bopp, W. Dewitt, P. Dabney, M. Mokhtar, and F.J. Angulo. 1998. Emergence of multidrug-resistant Salmonella enterica serotype Typhimurium DT104 infections in the United States. N. Engl. J. Med. 338:1333-1338.
Guinée, J.B., R. Heijungs, G. Huppes, A. Zamagni, P. Masoni, R. Buonamici, T. Ekvall, and T. Rydberg. 2011. Life cycle assessment: Past, present, and future. Environmental Sci. & Technol., 45, 90-96.
Hanning, I., J. Lingbeck, and S.C. Ricke. 2015. Cardiovascular health and disease prevention: association with foodborne pathogens and potential benefits of probiotics. In: Bioactive Foods in Promoting Health: Probiotics-Prebiotics, 2nd Edition. R.R. Watson and V.R. Preedy (Eds.) Elsevier, San Diego, CA. pp. 793-806.
43

Hellweg, S. and L. Milà i Canals. 2014. Emerging approaches, challenges and opportunities in life cycle assessment, Science 344: 1109-1113.
Hume, M.E., D.E.Corrier, G.W. Ivie, and J.R.DeLoach.1993. Metabolism of [14C] propionic acid in broiler chicks. Poultry Sci. 72:786-793.
Hutkins, R.W., J.A. Krumbeck, L.B. Bindels, P.D. Cani, G.C. Fahey, Jr., Y.J. Goh, B. Hamaker, E.C. Martens, D.A. Mills, R.A. Rastal, E. Vaughan, and M.E. Sanders. 2016. Prebiotics: Why definitions matter. Curr. Opin. Biotech. 37: 1-7.
Jarvis, N.A., P.G. Crandall, C.A. O’Bryan, and S.C. Ricke. 2015. Chapter 8. Antimicrobial resistance in Listeria spp. In: Chin-Yi Chen, Xianghe Yan, and Charlene Jackson (Eds.). Antimicrobial Resistance and Food Safety: Methods and Techniques. Academic Press/Elsevier Science, Amsterdam, The Netherlands. pp. 137-153.
Joerger, R.D. 2003. Alternatives to antibiotics: Bacteriocins, antimicrobial peptides and bacteriophages. Poultry Sci. 82: 640-647.
Jones, F.T. and S.C. Ricke. 2003. Observations on the history of the development of antimicrobials and their use in poultry feeds. Poultry Sci. 82: 613-617.
Kim, W.K., C.A. Froelich, Jr., P.H. Patterson, and S.C. Ricke. 2006. The potential to reduce poultry nitrogen emissions with dietary methionine or methionine analogues supplementation. World’s Poultry Science Journal 62: 338-353.
Koutsolioutsou, A., E. A. Martins, D. G. White, S. B. Levy, and B.Demple.2001. A soxRS-constitutive mutation contributing to antibiotic resistance in clinical isolate of Salmonella enterica (serovar Typhimurium). Antimicrob. Agents Chemother. 45:38-43.
Leinonen, I., A.G. Williams, J. Wiseman, J. Guy, and I. Kyriazakis. 2012. Predicting the environmental impacts of chicken systems in the United Kingdom through a life cycle assessment: Egg production systems. Poultry Sci. 91: 26-40.
Levy, S. B., G. B. Fitzgerald, and A. B. Macone. 1976. Spread of antibiotic-resistant plasmids from chicken to chicken and from chicken to man. Nature 260:40-42.
Lungu, B., C.A. O’Bryan, A, Muthaiyan, S. R. Milillo, M.G. Johnson, P.G. Crandall, and S.C. Ricke. 2011. Listeria monocytogenes: Antibiotic resistance in food production. Foodborne Path. Dis. 8: 569-578.
Monnet, D. L. 1999. European recommendations to respond to the threat of antimicrobial-resistant microorganisms. Amer. Soc. Microbiol. News 65: 390-391.
Neu, H. C. 1992. The crisis in antibiotic resistance. Science 257:1064-1073. Nisbet D. 2002. Defined competitive exclusion cultures in the prevention of enteropathogen
colonization in poultry and swine. Antonie von Leeuwenhoek. 81: 481-486. Nisbet,D.J.D.E.Corrier,S.C.Ricke,M.E.Hume,J.A.ByrdII,andJ.R.DeLoach.1996a.Maintenanceof the
biological efficacy in chicks of a cecal competitive exclusion culture against Salmonella by continuous flow fermentation. J. Food Prot. 59:1279-1283.
Nisbet, D. J., D. E. Corrier, S. C. Ricke, M. E. Hume, J. A. Byrd II, and J. R. DeLoach. 1996b. Cecal propionic acid as a biological indicator of the early establishment of a microbial ecosystem inhibitory to Salmonella in chicks. Anaerobe 2:345-350.
Nurmi, E. and M. Rantala. 1973. New aspects of Salmonella infection in broiler production. Nature 241:210-211.
O’Bryan, C.A., S.J. Pendleton, P.G. Crandall, and S.C. Ricke. 2015. Potential of plant essential oils and their components in animal agriculture – in vitro studies on antibacterial mode of action. Front. Vet. Sci. 2 (Article 35): 1-8.
Patterson, J.A. and K. Burkholder. 2003. Application of prebiotics and probiotics in poultry production. Poultry Sci., 82: 627-631.
Revolledo, L. and A.J.P. Ferreira. 2012. Current perspectives in avian salmonellosis: vaccines and immune mechanisms of protection. J. Applied Poultry Res. 21: 418-431.
Revolledo, L., Ferreira, A.J.P., and Mead, G.C. 2006. Prospects in Salmonella control: competitive exclusion, probiotics, and enhancement of avian intestinal immunity. J. Applied Poultry Res. 15: 341-351.
44
Ricke, S.C. 2016. Chapter 16. Gastrointestinal ecology of Salmonella Entertidis in laying hens and intervention by prebiotic and non-digestible carbohydrate dietary supplementation. In S.C. Ricke and R.K. Gast (Eds.). Producing Safe Eggs-The Microbial Ecology of Salmonella. Elsevier, Inc., San Diego, CA. (In press).
Ricke, S.C. 2015. Potential of fructooligosaccharide prebiotics in alternative and nonconventional poultry production systems. Poultry Sci. 94:1411-1418.
Ricke, S.C. 2003. Perspectives on the use of organic acids and short chain fatty acids as antimicrobials. Poultry Sci. 82: 632-639.
Ricke, S.C. and J. Rivera Calo. 2015. Chapter 3. Antibiotic resistance in pathogenic Salmonella. In: Chin-Yi Chen, Xianghe Yan, and Charlene Jackson (Eds.). Antimicrobial Resistance and Food Safety: Methods and Techniques. Academic Press/Elsevier Science, Amsterdam, The Netherlands. pp. 37-53.
Ricke, S.C., and S. Saengkerdsub. 2015. Chapter 19. Bacillus probiotics and biologicals for improving animal and human health: Current applications and future prospects In: V. Ravishankar Rai and A Jamuna Bai (Eds.) Beneficial Microbes in Fermented and Functional Foods, CRC Press/Taylor & Francis Group, Boca Raton, FL pp. 341-360.
Ricke, S.C., A.V.S. Perumalla, and N.S. Hettiarachchy. 2016. Chapter 6. Alternatives to antibiotics in preventing zoonoses and other pathogens in poultry: Prebiotics and related compounds. In: S.C. Ricke (Ed.) Achieving Sustainable Production of Poultry Meat- Volume 1 Safety, Quality and Sustainability. Burleigh Dodd Publishing, Cambridge, UK. (In press).
Ricke, S.C., P. Hererra, and D. Biswas. 2012a. Chapter 23. Bacteriophages for potential food safety applications in organic meat production. In: S.C. Ricke, E.J. Van Loo, M.G. Johnson and C.A. O’Bryan (Eds.), Organic Meat Production and Processing. Wiley Scientific/IFT, New York, NY. pp. 407-424.
Ricke, S.C., E.J. Van Loo, M.G. Johnson and C.A. O’Bryan (Eds.), 2012b. Organic Meat Production and Processing. Wiley Scientific/IFT, New York, NY 444 pp.
Ricke, S.C., M.M. Kundinger, D.R. Miller and J.T. Keeton. 2005. Alternatives to antibiotics: Chemical and physical antimicrobial interventions and foodborne pathogen response. Poultry Sci. 84: 667-675.
Rivera Calo, J., P.G. Crandall, C.A. O’Bryan, and S.C. Ricke. 2015. Essential oils as antimicrobials in food systems – A review. Food Control. 54: 111-119.
Rossi, M., S. Olkkola, M. Roasto, R. Kivistö, M.-L. Hänninen. 2015. Chapter 4. Antimicrobial resistance and Campylobacter jejuni and C. coli. In: Chin-Yi Chen, Xianghe Yan, and Charlene Jackson (Eds.). Antimicrobial Resistance and Food Safety: Methods and Techniques. Academic Press/Elsevier Science, Amsterdam, The Netherlands. pp. 55-75.
Roto, S.M., P. M. Rubinelli, and S.C. Ricke. 2015. An introduction to the avian gut microbiota and the effects of yeast-based prebiotic compounds as potential feed additives. Front. Vet. Sci. 2 (Article 28): 1-18. doi: 10.3389/fvets.2015.00028.
Siragusa, G.E. and S.C. Ricke. 2012. Probiotics as pathogen control agents for organic meat production. In: Ricke, S. C., Van Loo, E. J., Johnson, M. G., and O’Bryan C. A. (Eds.) Organic Food Production and Processings. First edition. John Wiley and Sons Inc. pp: 331-349.
Skunca, D., I. Tomasevic, and I. Djekic. 2015. Environmental performance of the poultry meat chain – LCA approach. Procedia Food Science 5, 258-261.
Smith, H.W.1968. Anti-microbial drugs in animal feeds. Nature 218:728-731. Speedy W., 2002. Overview of world feed supply feed protein needs and supply. Proceedings –
Protein sources for the animal feed industry, FAO Animal Production and Health Division, 9-27. Stoessel, F., R. Juraske, S. Pfister, and S. Hellweg. 2012. Life cycle inventory and carbon and
water foodprint of fruits and vegetables: Application to a Swiss retailer. Environmental Sci. & Technol. 46: 3253−3262.
Swick RA, 2006, World Nutrition Forum, American Soybean Association International marketing, Singapore.
Wiedemann, S., E. McGahan, and Poad. 2012. Using life cycle assessment to quantify the environmental impact of chicken meat production. Australian Government – Rural Industries Research and Development Corporation. RIRDC Publication No. 12/029, 73 pp.
45

How Will a Nutrition Program Become Successful in an Antibiotic Restricted World? Sean P. Montgomery1 and Kelly E. Keaschall2
1Beef Cattle Nutritionist, Corn Belt Livestock Services, Papillion, NE 2Swine Nutritionist, Corn Belt Livestock Services, Rock Falls, IL
Take Home Message The Veterinary Feed Directive (VFD) will change the way medically important antibiotics have been used in animal agriculture and their use will become restricted. Therefore, the importance of properly formulated diets and management practices to decrease the incidence of disease will become paramount. Introduction As of January 1st, 2017 the FDA’s Veterinary Feed Directive (VFD) will become law and will change the way medically important antibiotics have been used in animal agriculture for decades. This is because according to the FDA it will become illegal to use medically important antibiotics for growth promotion in animal production. Furthermore, animal producers will need to obtain authorization from a licensed veterinarian in order to use medically important antibiotics for the prevention, control or treatment of a specifically identified disease. The off label use of feed grade antibiotics is currently illegal and the judicious use of such antibiotics in the prevention and the treatment of disease has always been prescribed in animal agriculture. However, enacting the VFD law will quite possibly require animal agriculture to explore alternative practices to help prevent and control disease as the use of medically important antibiotics will become heavily regulated. The aim of this paper is to review some of the alternative technologies and practices that might be incorporated to help prevent disease in animal agriculture. Nutrition Animals that are stressed such as newly arrived feedlot cattle typically have depressed feed intakes (NRC, 2016); therefore, it is imperative that diets be formulated to account for this. For example, properly formulated diets for newly arrived, stressed feedlot calves should contain higher concentrations of required nutrients to better allow them to meet their nutrient requirements in spite of lower feed intakes (Duff and Galyean,2005). Increasing dietary energy by increasing the concentrate portion in receiving diets has been shown to increase growth performance in calves (Lofgreen et al., 1981; Rivera et al., 2005). However, it should be mentioned that increases in dietary energy may result in increased morbidity in calves during the receiving period as well (Lofgreen et al., 1981; Rivera et al., 2005). Environment Growth performance of feedlot cattle in the upper Midwest has been shown to be improved for cattle fed in deep bedded facilities when compared to cattle fed in open lots (Pastoor et al., 2012). Presumably, the improvement in growth performance for cattle fed in deep bedded housing compared to cattle fed in open lots is a result of improved cattle comfort by decreasing environmental stress (Pastoor et al., 2012). Providing bedding to feedlot cattle has been shown to improve cattle growth performance by insulating cattle from cold pen surfaces and decreasing mud by absorbing excess moisture with the pen (Mader, 2003). Mader (2003) summarized two finishing cattle experiments in which cattle were bedded and concluded that providing approximately 2.0
49

pounds of bedding in the form of wheat straw per head daily improved average daily gain by 7% and feed efficiency by 6%. Anderson (2006) reported that providing bedding to finishing cattle over the course of two winters in North Dakota improved average daily gain by up to 30%and feed efficiency by up to 31%. In the same experiment, Anderson (2006) also reported that providing bedding to finishing cattle improved final live weight, hot carcass weight, dressing percentage, rib eye area, and the percentage of carcasses grading USDA Choice. Because cattle that are fed in a well maintained environment have improved growth performance it only stands to reason that health status would be improved as well. Preconditioning for Beef Cattle According to the latest USDA NAHMS (2013) survey, the perceived benefit of preconditioning calves before arrival at the feedlot on decreasing morbidity rose from approximately 50%in 1994 to between 70 and 90%in 2011. Specifically, preconditioning practices surveyed consisted of acclimation to a feed bunk, respiratory vaccine given at least two weeks before weaning, respiratory vaccine given at weaning, calves weaned at least four weeks prior to shipping, calves castrated and dehorned prior to shipping, and calves treated for internal and external parasites prior to shipping. Preconditioning calves prior to the arrival at the feedlot should help to decrease stress which should help fight disease. Low Stress Handling Anything that can be done to help decrease stress and increase animal comfort will help improve growth performance and health. Low stress handling of cattle is becoming more widely practiced as the results are quite clear that when stress is lower, health is improved. Low stress handling workshops and clinics are becoming more popular and even cattle handling equipment is increasingly designed to provide for low stress handling. Direct-Fed Microbials and Yeast Products Direct fed microbials (DFM) and yeast products fall under the category “generally recognized as safe” according to the FDA which prohibits any therapeutic or growth claims with such products. However, according to the latest USDA NAHMS (2013) survey the percentage of feedlot cattle fed a probiotic increased from 17.2 in 1999 to 53.8 in 2011. The increase in the amount of cattle being fed a DFM or yeast culture has occurred in spite of mixed results regarding improved growth performance and health reported in the literature when such products are fed. In a review by Krehbiel et al. (2003) an overall improvement in ADG and feed efficiency of 2.5 and 2.0% respectively in feedlot cattle feedlot cattle fed a DFM. In the same review Krehbiel (2003) also reported an overall increase in milk yield of between 0.75 and 2.0 kg/d when lactating dairy cows were provided a DFM. However, Wilson et al. (2016) reported no effects on feedlot cattle growth performance when fed a DFM and Raeth-Night et al. (2007) reported no effects of feeding a DFM to dairy cows in mid lactation on milk yield, diet digestibility, or ruminal fermentation. Wagner et al. (2016) conducted a meta-analysis consisting of experiments in which feedlot cattle were fed a spent yeast culture and the effects on cattle growth performance were evaluated. Wagner et al. (2016) reported that when feedlot cattle were fed a Saccharomyces cerevisiae fermentation product that overall DMI, ADG, and feed efficiency improved by 1.0, 6.5, and 2.6%, respectively. Kenny-Rambo (2016) conducted a meta-analysis on the effects of feeding a DFM to feedlot cattle and reported an interaction regarding whether an ionophore was fed and whether the diet contained slow fermenting grains or grain co-products. Kenny-Rambo (2016) reported that growth performance was improved for cattle fed an ionophore in conjunction with a DFM with diets containing slow-fermenting grains or grain co-products. Ponce et al. (2012) fed a dried Saccharomyces cerevisiae product to beef heifers in a receiving experiment and although there were no effects on overall feed efficiency, heifers fed the dried yeast product did consume more dry
50
matter and tended to have a higher ADG and lower morbidity. Buntyn et al. (2016) fed the same Saccharomyces cerevisiae product as Ponce et al. (2012) and reported no effects of feeding the Saccharomyces cerevisiae product on growth performance during the receiving and finishing period. However, Buntyn et al. (2016) reported a tendency for lower morbidity in steers fed the Saccharomyces cerevisiae product similar to Ponce (2012). The mode of action is not totally understood regarding the effects of feeding DFM or yeast products and subsequent effects on cattle growth performance and health. However, proposed mechanisms regarding the effects of feeding DFM and yeast products to cattle consist of competitive attachment, antibacterial effects, modulating the immune response, and positively affecting ruminal fermentation (Krehbiel, 2003). Inconsistent results regarding the feeding of DFM and yeast products on the growth performance of feedlot cattle appear in the literature. According to Kenny-Rambo (2016) inconsistent responses regarding the effects of feeding DFM’s and yeast products on cattle growth performance might be attributed to a variety of factors such as dietary ingredients, ruminal environment, level of feed intake, dietary fiber and or starch concentration, length of feeding period, and cattle management. Genetic Approaches It has been reported that the susceptibility of cattle to bovine respiratory disease is moderately heritable (Nuepane et al., 2015). Therefore, according to Nuepane et al. (2015) the discovery of the genotype and quantitative trait loci associated with the susceptibility of contracting bovine respiratory disease might be included in selection indexes thereby allowing for the selection against genetic traits susceptible to bovine respiratory disease. VFD’s and the Practical Application for Swine Producers So far the main focus has been on the feedlot side, but it is also important to make a few comments on how VFDs will affect the swine producer. The swine producer has the advantage of already working with the VFD process. Pulmotil, from Elanco, was the first feed additive to be commercially available on December 17, 1996 which required a VFD. Therefore, swine producers, swine veterinarians, and the feed industry has almost 20 years of experience working with VFDs, which is a major difference from the beef industry. Due to the importance of health status, vertical integration, and disease control in swine operations, almost all swine operations already have established a veterinarian-client-patient relationship (VCPR). As opposed to beef operations, which establish receiving programs and treatment protocols for cattle upon arrival, but may not have the vet on site. Often feed grade medications used later in the feeding period are frequently discussed with the consulting nutritionist or feed manufacture rather than a vet. The key first step is to develop the VCPR and many swine producers have already established that. There are more feed additives available to swine producers with a variety of claims other than gain or feed conversion. Many of these products will continue to be available, but under the direction of a VFD. The feed industry has worked with the proper labeling, claims and feeding directions of these feed additives for many years. The feed additive compendium serves as the “bible” for developing labels with proper feeding directions and withdrawal times. Veterinarians have done a tremendous job educating producers on injectable products and their proper use and application. However, many have not been exposed to the detail on feed additives and the feed additive compendium. Therefore, it is important for the producer to have a good working relationship with both the vet and feed supplier. A comparison can be made between a doctor/pharmacist and a veterinarian/feed supplier. It is strongly recommended that all producers have a good working relationship with both the veterinarian and feed manufacture.
51

The swine industry stands to lose more products related to growth promotion and feed efficiency than the cattle industry. The beef industry will be able to continue to use important products like ionophores (Rumensin, Bovatec, and Cattlyst) for growth promotion or feed efficiency as they are not used in human medicine. The only ionophore available to the swine industry is Narasin (Skycis) and does not have broad use in the swine industry, but may draw more interest in 2017. Another challenge for producers and consultants alike, will be all the new products promoted as alternatives to feed grade antibiotics. There will be more enzymes, yeast products, and other nutraceuticals that will come to market. It is important to evaluate products based on good science, not just non-controlled studies of now vs. then. The feed grade antibiotic suppliers such as Elanco, Zoetis, Phibro, Merck and others have spent a lot of money proving the safety and efficacy of their products. One area that the VFD process may have left out or not considered is the small producer. What happens to the young person with a steer or pig that has an animal they are preparing for the county fair? How does this person cost effectively get access to something that is readily available today, like Chlortetracycline, but will require a VFD in 2017? Will the animal go untreated? This isn’t just limited to 4H or FFA participants. The average cow herd size in the US much smaller than the average hog farm so think about how many small producers it takes to bring the average down. This is a challenge that small producers and veterinarians will have to address. Literature Cited Anderson, V. L., R. J. Wiederholt, and J. P. Schoonmaker. 2006. Effects of bedding feedlot cattle
during the winter on performance, carcass quality, and nutrients in manure. 2006 NDSU Carrington Research Extension Center Feedlot. Research Rep. 29:28-36. North Dakota State Univ. Research Extension Center, Carrington.
Buntyn, J. O., S. E. Sieren, C. J. Bittner, D. Burken, and G. E. Erickson. 2016. Effects of feeding OmniGen-AF on immune function, performance, and carcass characteristics during the feeding period. Nebraska Beef Report pages 96-98.
Duff, G. C., and M. L. Galyean. 2007. Board Invited Review: Recent advances in management of highly stressed, newly arrived feedlot cattle. J. Anim. Sci. 85:823-840.
Kenny-Rambo, N., K. Nenn, and A. DiCostanzo. 2016. Eubiotics feeding strategies (EFS) in the feedlot: Review of evidence of effects on performance, and mechanism of action. Proceedings of Plains Nutrition Council Spring Conference pages 28-43.
Krehbiel, C. R., S. R. Rust, G. Zhang, and S. E. Gilliland. 2003. Bacterial and direct-fed microbials in ruminant diets: Performanc response and mode of action. J. Anim. Sci. 81(E. Suppl. 2):E120-E132.
Lofgreen, G. P., A. E. El Tayeb, and H. E. Kiesling. 1981. Millet and alfalfa hays alone or in combination with high-energy diets for receiving stressed calves. J. Anim. Sci. 52:959-968.
Mader, T. L. 2003. Environmental stress in confined beef cattle. J. Anim. Sci. 81(E. Suppl. 2):E110-E119.
Neupane, M., J. N. Kiser, C. M. Seabury, J. F. Taylor, J. E. Womack, and H. L. Neibergs. 2015. Genetic approaches to identify genomic regions associated with decreased susceptibility to bovine respiratory disease complex. American Association of Bovine Practitioners Annual Conference Proceedings. Pages 148-153.
NRC, 1996. Nutrient Requirements of Beef Cattle. 8th ed. Natl. Acad. Press, Washington DC. Pastoor, J. W., D. D. Loy, A. Trenkle, and J. D. Lawrence. 2012. Comparing fed cattle performance
in open lot and bedded confinement feedlot facilities. Prof. Anim. Sci. 28:410-416. Ponce, C. H., J. S. Schutz, C. C. Elrod, U. Y. Anele, and M. L. Galyean. 2012. Effects of dietary
supplementation of a yeast product on performance and morbidity of newly received beef heifers. Prof. Anim. Sci. 28:618-622.
52

Raeth-Knight, M. L., J. G. Linn, and H. G. Jung. 2007. Effect of direct-fed microbials on performance, diet digestibility, and rumen characteristics of Holstein dairy cows. J. Dairy. Sci. 4:1802-1809.
Rivera, J. D., M. L. Galyean, and W. T. Nichols. 2005. Review: Dietary roughage concentration and health of newly received cattle. Prof. Anim. Sci. 21:345-351.
USDA NAHMS. 2013. Feedlot 2011. Part III. Trends in health and management practices at U.S. feedlots, 1994-2011. USDA-APHIS-VS-CEAH-NAHMS #637.0713.
Wagner, J. J., T. E. Engle, C. R. Belkamp, and K. L. Dorton. 2016. Meta-analysis examining the effects of Saccharomyces cerevisiae fermentation products on feedlot performance carcass traits. Prof. Anim. Sci. 32:172-182.
Wilson, BK., B. P. Holland, D. L. Step, M. E. Jacob, D. L. VanOverbeke, C. J. Richards, T. G. Nagaraja, and C. R. Krehbiel. 2016. Feeding wet distillers grains plus solubles with and without a direct-fed microbial to determine performance, carcass characteristics, and fecal shedding of O157:H7 in feedlot heifers. J. Anim. Sci. 1:297-305.
53

The Changing Structure of the Dairy Industry by 2030 Lucas Sjostrom, MS Government and Policy Relations Manager Minnesota Milk Producers Association and Midwest Dairy Association
Abstract The attractiveness of the Midwest milk shed ebbs and flows with the corn market. While many factors play in farms’ profitability, milk price and feed costs are almost always atop the list. Individual Midwest farms feel multiple pressures, but the Midwest Dairy Association’s Path Forward Study showed that the region’s producers are genuinely content. The catastrophic year of 2009 notwithstanding, Midwestern producers appear to be doing quite well. As one of the nation’s best milk markets, recognized both by those who live here and those who do not, investment in processing is a big need. But if that big processing hurdle can be overcome by 2030, what does the Midwest region look like? How much more milk? How many specialty and value-added products will be produced? Is non-Class I going to continue to be the primary market? This presentation will look at the future of the Midwestern producer, and how things might change, and might not, by 2030.
54

Dietary Factors Associated with Gastrointestinal Development of Dairy Calves both Pre- and Post-Weaning M. H. Ghaffari, Z. He, A. Fischer, M. A. Steele Department of Agricultural, Food and Nutritional Science University of Alberta
Take Home Message
The prevalence of morbidity and mortality of dairy calves has reached alarming levels and most health problems are related to gastrointestinal health.
Feeding sufficient amounts of colostrum in the first 24 h of life is vital for calves and feeding colostrum or transition milk in the first week of life may improve gastrointestinal health and growth performance.
The elevated plane of milk nutrition during pre-weaning results in an increased average daily gain and the potential for more milk production in the future.
Weaning represents a massive change in the structure and microbiology of the gastrointestinal tract. As such, weaning later and step-down weaning protocols are necessary when feeding an elevated plane of milk pre-weaning.
The post-weaning phase is often forgotten in calf research and is the next frontier of calf biological discoveries.
Abstract Raising healthy and productive calves is crucial for the long-term success of the dairy industry. The pre-weaning and weaning periods of life are considered as the most challenging times in dairy production and are associated with the highest morbidity and mortality rates among the herd. A survey conducted by the USDA reported that pre-weaning mortality rates for calves have reached up to 10% and morbidity rates over 46%. Most calf health problems are related to abnormal gastrointestinal function that can be avoided through a sound nutritional program. Because the newborn calf is born without an active immune system, colostrum is the main source of nutrients and immunity – in the form of immunoglobulins (Ig) – after birth. Recent research showcases that pasteurization of colostrum, extending colostrum feeding and introducing transition milk during the first day of life prior to transitioning to milk or milk replacer can have a positive impact on the health and gastrointestinal function in calves. During the first month of life, calves are traditionally fed a limited amount of milk or milk replacer (often ~10% of birth body weight, BW) in dairy production. This is a striking contrast to how calves would feed if they were allowed to stay with their dam and suckle ad libitum or had unlimited access to an automated feeder, where they would consume ~20% of birth BW in either situation. Calves raised on a full potential feeding program display many benefits, including greater total weight gain during the pre-weaning period, fewer signs of hunger and greater milk production in future lactations (Soberon et al., 2012). The dairy calf undergoes intensive biological adaptations of the gastrointestinal tract during the weaning transition and these adaptations are even more abrupt when elevated levels of milk are fed. A smooth transition from liquid feed to solid feed by weaning later in life and applying a proper step-down feeding protocol is highly recommended as it allows calves to intake and digest sufficient solid feed for their growth and minimize distress at weaning. To date, most research has focused on the neonatal calf, the pre-weaning period and weaning. Rarely do studies focus on the period from post-weaning to first lactation. The lack of understanding between early life nutrition and gastrointestinal function later in life represents a large knowledge gap that should be addressed in future studies.
59
First week of life The most critical management factors in calf survival and health is feeding a sufficient amount of high-quality colostrum shortly after birth and ensuring that the newborn calf absorbs adequate Ig. The timing of colostrum delivery is important because the absorption of large peptides, such as Ig, from colostrum reduces rapidly from birth (Godden et al., 2012). In particular, it is thought that the ability to absorb Ig is nearly nonexistent by 24 hours - a term called “gut closure”. Studies focused on colostral immunity in newborn calves have shown that delaying colostrum feeding linearly decreases the apparent efficiency of IgG absorption from 0 to 12 hours after birth largely due to gut closure (Rajala and Castren, 1995; Weaver et al., 2000). The USDA National Dairy Heifer Evaluation Project reported that more than 40% of dairy calves did not consume sufficient good quality colostrum in the first 24 hours of life (Quigley, 2001). The quality of colostrum is typically expressed in terms of IgG content; first-milking colostrum is generally considered of high quality when it contains at least 50 g/L of IgG with a low level of bacterial contaminants (<100,000 CFU/ml and <10,000 CFU/ml coliform count) and is entirely free of infectious agents, such as Mycoplasma species and Salmonella species. Some of the initial recommendations state that the newborn calf should receive a minimum mass of 100 g of IgG in the first 2 h of life (Quigley et al. 2001), however many industry representatives are currently recommending increasing that amount by over 50% (>150g of IgG in the first 2 h of life). A proper colostrum feeding protocol should prevent or reduce the risk of bacterial contamination through implementation of strict hygiene management (Meganck et al., 2014). It is well known that bacteria in colostrum may interfere with passive absorption of colostral Ig into the circulation of newborn calves (Johnson, et al., 2007). In order to reduce the risk of pathogen and bacterial colonization in the neonate, colostrum can also be pasteurized. Recently, Armengol and Fraile (2016) showed that pasteurization of colostrum and milk, even in animals receiving appropriate colostrum ingestion, significantly reduced the morbidity and mortality (5.2 and 2.8%) when compared to calves receiving non-pasteurized colostrum and milk (15.0% and 6.5%, respectively) during the first 21 d of life. Malmuthuge et al. (2015) also concluded that the feeding of heat-treated colostrum soon after the birth can increase the colonization of healthy bacteria (Bifidobacterium) and decrease the colonization of Escherichia coli (E. coli) in the ileum of calves during the first 12 hours of life. Although the benefits of pasteurizing colostrum have been shown, it is important that pasteurized colostrum is properly stored to reduce the regrowth of bacteria – something that is often neglected on many dairy farms. Colostrum and transition milk also contains several nutritional factors that may not be found in whole milk. Colostrum contains several types of Ig, growth factors, hormones, cytokines, enzymes, polyamines and nucleotides, and antimicrobial components, all of which are necessary to provide passive immunity (Hammon and Blum, 2002) and promote the growth and development of the newborn calf. Several other bioactive components in colostrum, such as growth factors and antimicrobial factors, have received comparatively little attention in the past but are likely to be important in improving early gastrointestinal health (Hammon and Blum, 2002). Certain bioactive compounds such as insulin-like growth factor 1 (IGF-1) can stimulate intestinal epithelial cell proliferation (Baumrucker et al., 1994), while others, such as lactoferrin, lysozyme and lactoperoxidase, may help to maintain a healthy gastrointestinal tract (Pakkanen and Aalto, 1997). Although they are found at high levels in colostrum, these compounds are not detectable in whole milk (Blum and Hammon, 2000). Recently, Krueger et al. (2016) reported that providing colostrum to newborn calves not only provides passive immunity via IgG, but also provides immunoregulatory molecules, such as haptoglobin, that may develop the endogenous immune system by decreasing the susceptibility to infectious pathogens. Although most of the current research is focused on colostrum feeding strategies in order to ensure the absorption of adequate IgG in the first several hours of life (Godden et al., 2012), we may need to consider the possible added benefits of transition milk after the first meal or day of life (Vasseur et
60

al., 2010). Transition milk is most commonly characterized as the milk after the first milking during the first days of lactation (Figure 1). The nutrient composition between true colostrum, transition milk, and whole milk are very different from the standpoint of nutritional and bioactive compounds (Blum and Hammon, 2000). A recent study by Conneely et al. (2014) showed the health benefits of feeding transition milk to calves during the first days of life. Many research groups are investigating extended colostrum and transition milk feeding schemes which will hopefully open the doors to many novel feeding programs in the first week of life.
Figure 1. Conventional and transition colostrum and transition milk feeding programs.
First month of life There are two main calf feeding systems during the pre-weaning period that are known as conventional and elevated calf rearing programs. In the conventional milk feeding program, dairy calves are fed a restricted amount of milk or milk replacer (half of normal ad libitum consumption) at 10% of the birth BW, which translates to ~4-5 L/day (Khan et al., 2007a,b; Silper et al., 2014). The goal of conventional rearing is to limit milk intake in order to encourage calf starter intake, and therefore rumen development (Drackley, 2008), as well as to reduce calf rearing costs, milk is more expensive than solid feed (Khan et al., 2011). Calves fed milk through conventional methods struggle to meet their energy requirements for growth due to the low plane of milk offered and thus need to consume more starter feed to compensate for the low energy intake from suckled milk. As a result, calves are considered to be in a nutrient deprived condition, with the rates of live weight gain ranging from 0.3 to 0.5 kg daily (Jasper and Weary, 2002), and they have larger, more frequent solid feed meals before weaning (Miller-Cushon and DeVries, 2015). In the elevated milk feeding program, dairy calves are fed a higher plane of milk nutrition (approximately double the volume of milk than the conventional method) at approximately 20% of the birth BW, which translates to ~8 L/day (MacPherson et al., 2016). Several studies (Jasper and Weary, 2002; Khan et al., 2007a; Sweeney et al., 2010) have shown that calves can safely consume whole milk or milk replacer at approximately 20% BW (~10 -12 L per day). The elevated milk feeding program is designed to mimic calves natural suckling. During nursing from the dam, calves are often consuming between 16-24% of their BW/day in milk during the first month of life. The pre-weaning average daily gain (ADG) of calves in the elevated milk feeding program are considered to be greater than 0.8 kg/day (Jasper and Weary, 2002). Despite the advantages of an elevated milk feeding program, commercial production systems are reluctant to implement a high plane of milk nutrition due to the increased costs of milk or milk replacer
61

(Moore et al., 2009). It is generally perceived that a restricted milk feeding program is the lower cost option; however, a recent study (Overton et al., 2013) reported that when feeding dairy calves a higher plane of milk nutrition producers can expect a net value return of ~$180 USD/calf after their first lactation. Whether on a conventional or elevated plane of nutrition, calves are typically provided with milk twice daily on commercial dairy operations, which is a drastic contrast to how calves are fed ad libitum or would naturally feed with their dam (Egli and Blum, 1998). There is concern that feeding more milk, especially when claves are only fed twice a day, may lead to abomasal ulcers and a decrease in insulin sensitivity in milk-fed calves (Berends, 2015). Previous studies showed that veal calves fed large amounts of milk for a period of 6 months often express problems controlling their blood glucose after a meal. In particular, calves showed hyperglycaemia, hyperinsulinaemia, and glucosuria (Hostettler-Allen et al., 1994; Hugi et al., 1998; Vicari et al., 2008) which leads to depressed health and performance. A recent study (Bach et al., 2013) also investigated the effect of plane of nutrition (high vs. low) on insulin responses to high plasma glucose in dairy calves and found that all calves were able to control glycemia. However, results from that study also showed that calves fed high plane of nutrition (8 L/day) needed significantly higher insulin to control the suddenly high plasma glucose when compared to calves fed a lower plane of nutrition. In contrast, a recent study by MacPherson et al. (2016) demonstrated that feeding an elevated plane of nutrition (8 L MR/d) in two meals per day had minimal impact on glucose metabolism and insulin sensitivity, which may be associated with the ability of the calf to slow down the delivery of large meals from the abomasum to the intestine. The major difference between the studies was that the calves in the study by MacPherson et al. (2016) were fed the elevated plane of nutrition from the first week of life, which may be a critical developmental window for the calf to adapt to the higher level of milk feeding. Weaning The onset of weaning is one of the most important factors contributing to calf performance and rumen development (Khan et al., 2011). Under natural conditions, the gradual weaning process occurs over several weeks when milk supply from the dam declines and solid feed intake increases, a process which occurs at approximately 10 months of age (Reinhardt and Reinhardt, 1981). In the past decade, researchers have focused on alternative milk feeding procedures in an attempt to improve calf performance. Weaning of calves in commercial dairy production systems is usually early and abrupt compared to the natural weaning process, where feeding milk or milk replacer is more expensive than feeding solid feed. In early weaning programs (4-6 weeks of life), calves have limited access to milk or milk replacer (10% of birth BW) in order to limit feed cost, encourage early intake of starter feed and facilitate rumen development (Kertz and Loften, 2013). Calves consuming high quantities of milk experience a challenge at weaning because of low solid feed intakes prior to weaning (Jasper and Weary, 2002), leading to concerns that the calf's digestive tract is not accustomed to the digestion of solid feed following weaning (Terré et al., 2007). A previous study has shown that delaying age of weaning increased total weight gain in calves fed an elevated plane of nutrition before weaning, yet decreased the transient reduction of weight gain at weaning (Meale et al., 2015). Recently, Eckert et al. (2015) reported that calves fed milk replacer on an elevated plane of nutrition during the pre-weaning stage had greater starter feed intake and weight gain during the weaning period when weaning was extended from 6 to 8 weeks of age. Furthermore, later-weaned calves were better able to cope with weaning compared to early-weaned calves, as they had higher solid feed intake during weaning transition. In addition to weaning later in life, a weaning protocol termed the “step-down” was developed to minimize the challenges of weaning from high amounts of milk or milk replacer. In the first paper reporting the step-down protocol (Khan et al.,2007a,b), calves received higher amounts of milk during the early weeks of the feeding period compared to the conventional method, followed by
62

lower amount of milk until weaning. Khan et al. (2007a,b) reported that intake of solid feed and weight gain increased during weaning in calves fed higher planes of milk through the step-down method compared to those fed milk conventionally. When feeding with automation, the step-down protocols can be less abrupt as milk can be gradually declined on a daily basis. Sweeney et al., (2010) showed that the ideal step-down period for calves fed an elevated plane of nutrition was 10 days as it encouraged dry feed intake and maintained growth during the weaning period. More research is required to determine the interaction between age of weaning and step-down protocols – especially around the post-weaning, post-transition nutrition program, in order to develop more sound protocols that avoid declines in growth during weaning. During the weaning process, the gastrointestinal tract undergoes significant changes, with the surface area and the absorption capacity of the rumen increasing from 30 to 70% of the entire gut. This change occurs to accommodate absorption of the end products of ruminal fermentation to meet the demands for growth (Figure 2; Warner et al., 1956; Baldwin et al., 2004). Gastrointestinal maturity during the weaning process is the result of differential expressions of multiple genes involved in the physical and metabolic regulation of several tissues, such as rumen (Connor et al., 2013). The majority of these genes are related to nutrient metabolism, organ development, and the immune response. Changes in the expression of genes regulating growth during rumen development appear to be correlated with changes in the rumen microbial population. A recent study revealed that the expression of genes belonging to the first line defense mechanisms, gut barrier functions (i. e., toll-like receptor, β-defensin, peptidoglycan recognition protein 1, claudin 4, and occludin), and bacterial diversity were changed in response to the introduction of solid feed during the weaning process in calves (Malmuthuge et al., 2013).
Figure 2. Gastrointestinal development of calves during transition from liquid to solid feed in
commercial production systems.
In addition to gene expression changes of the gut, microbiota adaptations have also been characterized. Current findings from next generation DNA sequencing techniques show that the rumen microbiota of pre-ruminant calves has a similar functional capacity compared to a mature ruminant (Jami et al., 2013). Li et al., (2012) showed that species of the genus Bacteriodetes
63

phylum decreased, while bacteria belonging to the Firmicutes and Proteobacteria phyla increased in response to the weaning process. Interestingly, lower gut microbiota also undergo transformations during weaning, with the microbial diversity increasing in the fecal microbiota (Li et al., 2012), which may be due to the functional changes, such as increased permeability (Wood et al., 2015), in the gastrointestinal tract. However, limited literature is available regarding the influences of pre-weaning feeding regimens and weaning on the lower gut of dairy calves. This paucity of information ultimately underlines the amount of future research is still needed to fill the gap in our understanding.
Post-weaning – the next frontier? Traditionally, the main goal for managing replacement heifers during the pre and post-weaning period is to keep them healthy and increase growth rates while reducing feed costs. Almost all research has focused solely on the first months of life and fails to track to the long-term biological and economic impact of these feeding regimens (Figure 3). Interestingly, it has recently been shown that increasing the ADG of calves during the pre-weaning phase can increase future milk production. Soberon et al. (2012) reported that every 1kg of pre-weaning ADG translates to 970 kg more milk in the first lactation. Another study by Faber et al. (2015) further showed that colostrum feeding regimens can have a long-term impact on growth and future milk production during the first and second lactations. The biological mechanisms governing how early-life events can impact performance later in life are unknown and represent a major knowledge gap in calf research. Furthermore, limited research exists regarding feeding programs during the post-weaning period, as well as the long-term implications of these nutritional practices on calf performance, health, and welfare. As such, further research regarding this seemingly critical period is needed.
Figure 3. Calf research and knowledge gap.
Conclusion Nutritional management of dairy calves, in particular colostrum feeding, plane of nutrition, and weaning strategy, results in great differences in growth performance, health and gastrointestinal development. Strategies to optimize gastrointestinal health and development of calves are encouraged due to the high prevalence of mortality and morbidity related to abnormal gastrointestinal function. Moreover, feeding elevated plane of nutrition pre-weaning has the potential to impact long-term cow health and future milk production. The long-term impacts of particular feeding regimens during the first week, first month and weaning period are currently unknown. As such, they represent a significant knowledge gap in calf nutrition. More research examining the impact of nutrition schemes from the first hours, weeks and months of life is required to properly understand the influence that gastrointestinal function has on the health and performance of future calf.
64

References Armengol, R., and L. Fraile. 2016. Colostrum and milk pasteurization improve health status and
decrease mortality in neonatal calves receiving appropriate colostrum ingestion. J. Dairy Sci. 99: 4718-4725.
Bach, A., L. Domingo, C. Montoro, and M. Terré. 2013. Short communication: insulin responsiveness is affected by the level of milk replacer offered to young calves. J. Dairy Sci. 96: 4634-4637.
Baldwin, R.L., K.R. McLeod, J.L. Klotz, and R.N. Heitmann. 2004. Rumen development, intestinal growth and hepatic metabolism in the pre- and postweaning ruminant. J. Dairy Sci. 87 (E. Suppl.): E55-E65.
Baumrucker, C.R., D.L. Hadsell, and J.W. Blum. 1994. Effects of dietary insulin-like growth factor 1 on growth and insulin-like growth factor receptors in neonatal calf intestine. J. Anim. Sci. 72: 428-433.
Berends, H., J.J. van den Borne, N. Stockhofe-Zurwieden, M.S. Gilbert, T. Zandstra, W.F. Pellikaan, C.G. van Reenen, E.A.M. Bokkers, and W.J.J. Gerrits. 2015. Effects of solid feed level and roughage-to-concentrate ratio on ruminal drinking and passage kinetics of milk replacer, concentrates, and roughage in veal calves. J. Dairy Sci. 98: 5621-5629.
Blum, J.W., and H. Hammon. 2000. Colostrum effects on the gastrointestinal tract, and on nutritional, endocrine and metabolic parameters in neonatal calves. Livest. Prod. Sci. 66:151-159.
Conneely, M., D.P. Berry, J.P. Murphy, I. Lorenz, M.L. Doherty, and E. Kennedy. 2014. Effect of feeding colostrum at different volumes and subsequent number of transition milk feeds on the serum immunoglobulin G concentration and health status of dairy calves. J. Dairy Sci. 97: 6991-7000.
Connor, E.E., R.L. Baldwin, C. Li, R.W. Li, and H. Chung. 2013. Gene expression in bovine rumen epithelium during weaning identifies molecular regulators of rumen development and growth. Funct. Integr. Genomics.13: 133-142.
Drackley, J.K. 2008. Calf nutrition from birth to breeding. Vet. Clin. North Am. Food Anim. Pract. 24: 55-86.
Eckert, E., H.E. Brown, K.E. Leslie, T.J. DeVries, and M.A. Steele. 2015. Weaning age affects growth, feed intake, gastrointestinal development, and behaviour in Holstein calves fed an elevated plane of nutrition during the preening stage. J. Dairy Sci. 98: 6315-6326.
Egli, C.P., and J.W. Blum. 1998. Clinical, haematological, metabolic and endocrine traits during the first three months of life of suckling Simmentaler calves held in a cow-calf operation. J. Vet. Med. A. 45: 99-118.
Faber, S.N., N.E. Faber, T.C. McCauley, and R.L. Ax. 2005. Effects of colostrum ingestion on lactational performance. Prof. Anim. Sci. 21: 420-425.
Godden, S.M., D.J. Smolenski, M. Donahue, J.M. Oakes, R. Bey, S. Wells, S. Sreevatsan, J. Stabel, and J. Fetrow. 2012. Heat-treated colostrum and reduced morbidity in preweaned dairy calves: Results of a randomized trial and examination of mechanisms of effectiveness. J. Dairy Sci. 95: 4029-4040.
Hammon, H.M., and J.W. Blum. 2002. Feeding different amounts of colostrum or only milk replacer modify receptors of intestinal insulin-like growth factors and insulin in neonatal calves. Domest. Anim. Endocrin. 22: 155-168.
Hostettler-Allen, R.L., L. Tappy, and J.W. Blum. 1994. Insulin resistance, hyperglycemia, and glucosuria in intensively milk-fed calves. J. Anim. Sci. 72: 160-173.
Hugi, D., L. Tappy, H. Sauerwein, R.M. Bruckmaier, and J.W. Blum. 1998. Insulin-dependent glucose utilization in intensively milk-fed veal calves is modulated by supplemental lactose in an age-dependent manner. J. Nutr. 128: 1023-1030.
Jasper, J., and D.M. Weary. 2002. Effects of ad libitum milk intake on dairy calves. J. Dairy Sci. 85: 3054-3058.
Jami, E, A. Israel, A. Kotser, and I. Mizrahi. 2013. Exploring the bovine rumen bacterial community from birth to adulthood. ISME J. 7: 1069-1079.
65

Johnson, J.L., S.M. Godden, T. Molitor, T. Ames, and D. Hagman. 2007 Effects of feeding heat-treated colostrum on passive transfer of immune and nutritional parameters in neonatal dairy calves. J. Dairy Sci. 90: 5189-5198.
Kertz, A.F. and J.R. Loften. 2013. REVIEW: A historical perspective of specific milk-replacer feeding programs in the United States and effects on eventual performance of Holstein dairy calves. Prof. Anim. Sci. 29: 321-332.
Khan, M.A, D.M. Weary, and M.A. von Keyserlingk. 2011. Invited review: effects of milk ration on solid feed intake, weaning, and performance in dairy heifers. J. Dairy Sci. 94: 1071-1081.
Khan, M.A., H.J. Lee, W.S. Lee, H.S. Kim, S.B. Kim, K.S. Ki, J.K. Ha, H.G. Lee, and Y.J. Choi. 2007a. Pre- and postweaning performance of Holstein female calves fed milk through step-down and conventional methods. J. Dairy Sci. 90: 876-885.
Khan, M.A., H.J. Lee, W.S. Lee, H.S. Kim, K.S. Ki, T.Y. Hur, G.H. Suh, S.J. Kang, and Y.J. Choi. 2007b. Structural growth, rumen development, and metabolic and immune responses of Holstein male calves fed milk through step-down and conventional methods. J. Dairy Sci. 90: 3376-3387.
Krueger, L.A., T.A. Reinhardt, D.C. Beitz, R.L. Stuart, and J.R. Stabel. 2016. Effects of fractionated colostrum replacer and vitamins A, D, and E on haptoglobin and clinical health in neonatal Holstein calves challenged with Mycobacterium avium ssp. paratuberculosis. J. Dairy Sci. 99: 2884-2895.
Li, R.W., E.E. Connor, C. Li, R.L. Baldwin VI, and M.E. Sparks. 2012. Characterization of the rumen microbiota of pre-ruminant calves using metagenomics tools. Environ. Microbiol. 14: 129-139.
MacPherson, J.A.R., H. Berends, L.N. Leal, J.P. Cant, J.Martín-Tereso, and M.A. Steele. 2016. Effect of plane of milk replacer supply and age on glucose and insulin kinetics and abomasal emptying in female Holstein Friesian dairy calves fed twice daily. J. Dairy Sci. (in press).
Malmuthuge, N., M. Li, L.A. Goonewardene, M. Oba, and L.L. Guan. 2013. Effect of calf starter feeding on gut microbial diversity and expression of genes involved in host immune responses and tight junctions in dairy calves during weaning transition. J. Dairy Sci. 96: 189-200.
Malmuthuge, N., Y. Chen, G. Liang, L.A. Goonewardene and L.L. Guan. 2015. Heat-treated colostrum feeding promotes beneficial bacteria colonization in the small intestine of neonatal calves. J. Dairy Sci. 98: 8044-8053.
Meale, S.J. L.N. Leal, J. Martín-Tereso, and M.A. Steele. 2015. Delayed weaning of Holstein bull calves fed an elevated plane of nutrition impacts feed intake, growth and potential markers of gastrointestinal development. Anim. Feed Sci.Tech. 209: 268-273.
Meganck, V., G. Hoflack, and G. Opsomer. 2014. Advances in prevention and therapy of neonatal dairy calf diarrhoea: A systematical review with emphasis on colostrum management and fluid therapy. Acta Vet. Scand. 56: 75.
Miller-Cushon, E., and T. DeVries. 2015. Development and expression of dairy calf feeding behaviour. Can. J. Anim. Sci. 95: 341-350.
Moore, D.A., J. Taylor, M.L. Hartman, and W.M. Sischo. 2009. Quality assessments of waste milk at a calf ranch. J. Dairy Sci. 92: 3503-3509.
Overton, M.W., R.B. Corbett, and W.G. Boomer. 2013. An economic comparison of conventional vs. intensive heifer rearing. Proceedings Western Dairy Management Conf., March 6-8. p. 123-131.
Pakkanen, R. and Aalto, J. 1997. Growth factors and antimicrobial factors in bovine colostrums. Int. Dairy J. 7, 285-298.
Quigley, J. 2001. Calf note #16—Stress at weaning. http://www.calfnotes.com/pdffiles/CN016.pdf July 15, 2009.
Rajala, P., and H. Castren. 1995. Serum immunoglobulin concentrations and health of dairy calves in two management systems from birth to 12 weeks of age. J. Dairy Sci. 78: 2737-2744.
Reinhardt, V., and A. Reinhardt. 1981. Natural sucking performance and age at weaning in zebu cattle (Bos indicus). J. Agric. Sci. 96: 309-312.
Silper, B.F., A.M.Q. Lana, A.U. Carvalho, C.S. Ferreira, A.P.S. Franzoni, J.A.M. Lima, H.M. Saturnino, R.B. Reis, and S.G. Coelho. 2014. Effects of milk replacer feeding strategies on performance, ruminal development, and metabolism of dairy calves. J. Dairy Sci. 97: 1016-1025.
Soberon, F., E. Raffrenato, R.W. Everett, and M.E. Van Amburgh. 2012. Preweaning milk replacer intake and effects on long-term productivity of dairy calves. J. Dairy Sci. 95: 783-793.
66

Sweeney, B.C., J. Rushen, D.M. Weary, and A.M. de Passillé. 2010. Duration of weaning, starter intake, and weight gain of dairy calves fed large amounts of milk. J. Dairy Sci. 93: 148-152.
Terré, M., M. Devant, and A. Bach. 2007. Effect of level of milk replacer fed to Holstein calves on performance during the preweaning period and starter digestibility at weaning. Livest. Sci. 110: 82-88.
Vasseur, E., F. Borderas, R.I. Cue, D. Lefebvre, D. Pellerin, J. Rushen, K.M. Wade, and A.M. de Passillé. 2010. A survey of dairy calf management practices in Canada that affect animal welfare. J. Dairy Sci. 93: 1307-1315.
Vicari, T., J.J.G. C. Van den Borne, W.J.J. Gerrits, Y. Zbinden, and J.W. Blum. 2008. Postprandial blood hormone and metabolite concentrations influenced by feeding frequency and feeding level in veal calves. Domest. Anim. Endocrin. 34: 74-88.
Warner, R.G., W.P. Flatt, and J.K. Loosli. 1956. Dietary factors influencing the development of the ruminant stomach. Agric. Food Chem. 4: 788-801.
Weaver, D.M., J.W. Tyler, D.C. VanMetre, D.E. Hostetler, and G.M. Barrington. 2000. Passive transfer of colostral immunoglobulins in calves. J. Vet. Intern. Med. 14: 569-577.
Wood, K.M., S. Palmer, M.A, Steele, J.A. Metcalf, and G.B. Penner. 2015. The influence of age and weaning on permeability of the gastrointestinal tract in Holstein bull calves. J. Dairy Sci. 98: 7226-7237.
67

Impact of Feedlot Environment on Cattle Performance. What Can Management Do to Alleviate It? Sheri Bundy, PhD Corn Belt Livestock Services
Alfredo DiCostanzo, PhD Department of Animal Science, University of Minnesota, St. Paul
Feedlot cattle endure various weather conditions throughout their feeding period. The weather events impact cattle performance in various ways that have been calculated or predicted with equations but not documented through actual closeout information. The database has allowed us to determine what constitutes weather event that has impact on performance and quantify that impact.
Our feedlot customers have two main questions, “Do I need to build a building?” and “What happened in this closeout, why isn’t the performance as expected”. We also have the comments of “they just didn’t have enough time to recover” from the heat stress, rain, blizzard or severe cold. We now have some answers to these questions. Our data base consists of closeouts from Blac-X Feedlot located in Southwest corner of MN near Garretson, SD. The yard has 2500 hd capacity with 13 outside pens. They feed calves and yearlings, steers and heifers.
Jay Bakken is owner and bunk manager of the feedlot. He manages intakes by clean bunk management system. On arrival cattle have controlled intakes and once on finish ration they are kept at about 10% below ad-libitum intake. Jay will adjust intakes according to weather, in wet weather, intakes are dropped some, in heat intakes are dropped to hopefully hold somewhat steady in heat stress. In severe cold he increases intake slightly to help with heat of fermentation and to boost caloric intake of the cattle. They feed modified distiller, corn silage, mix of hay and corn stalks, dry rolled corn, high moisture corn and dry supplement.
Blac-X feedlot had asked previous questions and they also wanted to know if their older pens (Pens 1 – 7) had different performance compared to their new pens (Pens 8 – 13). The old pens have more cement in them and are sloped primarily to the east. All pens have perimeter cement with a dirt area in the center. They run a bed pack on the cement perimeter throughout the winter months. Each pen has good size water tank and extra water tank is placed in each pen for the summer months. Pens 1 and 2 were changed to all cement pens starting in fall of 2015.
The new pens (Pens 8 – 13) have 32” apron and slope to the south with fairly steep slope. Most of the pens have cement at the bottom of the pen to facilitate cleaning and drainage from the pens. The pens have good size water tanks and an extra water tank in placed on opposite side of the pen in the summer months.
Blac-X feedlot will stock their pens to have tighter square footage in the winter and more square footage in the summer. They feed two times per day as close to the same time every day. Cattle are pushed to perform as well as they can. All the closeouts were generated by Iowa State Feedlot monitor. All closeouts are figured with deads in. Corn price, in and out price and net return are all the actual numbers for when the closeout occurred. Blac-X feedlot uses almost 100% home raised corn, so the corn price was the local market price.
71

Blac-X feedlot feeds Optaflexx to about every pen of cattle prior to harvest. When Zilmax was available, they fed it to about every pen. Blac-X feedlot uses Revalor implants. We typically give calf fed steers Rev-IS at about 650 lbs and terminal Rev-200 at 90 days prior to harvest. For heifer calves similar program but we gave them Rev-IH up front. Yearling steers will get Rev-XS or wait to have about 100 -120 day maximum on Rev-200 implant. Yearling heifers, if enough days on feed, received Rev-IH on arrival and Rev-200 80 to 90 days prior to harvest.
Calves were sourced from most of the same ranches for majority of the years. Yearlings were primarily sourced from the same back ground yards and from same producers. There were some calves and yearlings sourced through sale barns.
We applied weather data to the closeout data. We sourced the weather from weather station at Sioux Falls, SD which was located 20 miles from the feedlot.
Materials and Methods
We evaluated the weather events that occurred during 2007 to present and determine various categories for rain and snow falls.
Table 1.
Category Rain Sum
inches Snow Sum
inches
Snow Depth inches
Avg Max Temp
degrees F
Avg Min Temp
degrees F
Snow Days, # days
occurred*
Rain Days, # days
occurred**
High > 15“ > 24” > 1.5” 66 50 > 5 > 7
Moderate 5 to 15“ 10 to 24” 0.5 to 1.5” 38 to 66 25 to 50 2 to 5 3 to 7
Low < 5” < 10” < 0.5” < 38 < 25 < 2 < 3
*A day with 2” or more snow was considered a snow day
**A day with 0.5” or more of rain was considered a rain day
We used Proc mix procedures in SAS to evaluate the weather and closeout data. Class level information included: class (steer calves (SC), heifer calves (HC), yearling heifers (YH), and yearling steers (YS)), year (2007 to 2016), and Season (if closeout feeding period was primarily during Fall, Winter, Spring or Summer).
We used the following continuous variables as dependent variables: Dry matter intake (DMI), average daily gain (ADG), and feed to gain (FTG but analyzed as gain to feed). We used the following as continuous variables: Vet/medical expenses (VTM), corn price ($/bu), in price ($/cwt), out price ($/cwt), net return ($/hd), and square footage (ft2/hd).
We used class of animal and feedlot site (old or new) for non-continuous, independent variables. For Independent continuous variables we used: rain sum, snow sum, average maximum temperature, average minimum temperature, rain days, snow days and sum of days (sum of rain and snow days during feeding period). For class variables we used the categories for: rain sum, snow sum, snow depth, average maximum temperature, average minimum temperature, snow days, rain days and sum of days (sum of rain and snow days).
For the data that is presented in this paper included DOF as a covariate and we weighted the data by number of head in.
72
The Blac-X data set had total of 164 closeouts. Of those 164, 74 (45.1%) were calf fed closeouts (20 of them were heifer calves (27%) and 54 (73%) were steer calves). Of calf closeouts, 57 of them (77%) were fed in the old pens and 17 (23%) were fed in the new pens. Blac-X feedlot prefers the old pens for calves because the pens are located closer and more convenient to processing and treatment facilities.
In Blac-X data set we had 90 (54.9%) yearling closeouts. There were only 6 (6.7%) yearling heifers and 84 (93.3%) yearling steer closeouts. Of the yearlings closeouts, 17 (18.9%) were fed in the old pens and 73 (81.1%) were fed in the new pens.
Table 2 shows the mean values by class used in several calculations discussed throughout the paper.
Table 3 summarizes the weather events which occurred 2007 to present. We had good array of weather events, several closeouts had various levels of rain and snow fall. Please note that each category represents all 164 closeouts.
Majority of the closeouts experienced BOTH moderate to high rain sum and moderate to high snow sum. When closeout had high and moderate snow depth, they also had high snow sum and moderate rain sum. Temperature max and min were figured as the maximum and minimum temperature for each day and averaged over the feeding period. Please note, majority of cattle were fed through various weather conditions so temperature becomes quite average number.
We had only 3.05% (n = 15) of closeouts in the table have low rain sum. There were 72.8% (n = 358) of closeouts that had high to moderate snow sum. We had 100% (n = 492) of closeouts have some snow depth (high, moderate or low) and moderate rain! There were 35.2% (n = 173) of closeouts with high to moderate snow depth and high snow sum. There were 24.2% (n = 119) low snow depth and low snow sum. Only 27.3% of the closeouts had low category weather (low rain sum, low snow sum and low snow depth). The yard was weather challenged!
The amounts of snow and rain are factors that likely impact cattle performance. We also evaluated the number of days cattle had to experience various weather events (Table 4). A rain day, was a day with 0.5” of rain or more that day. A snow day, was a day with 2” or more of snow that day.
Again temperature didn’t vary much across the day categories. With rain days, we had No low rain sum, no low snow sum and no low snow depth! When we had high rain days we also had high rain sum with moderate snow sum and moderate snow depth for 37% (n = 182) closeouts. With moderate rain days we had moderate rain sum, high snow sum and moderate snow depth for 64.6% (n = 318) closeouts. With low rain days we had moderate rain sum, moderate snow sum, and moderate snow depth for 47.2% (n = 232) closeouts.
With high number of snow days we also had moderate rain day sum, high snow sum and high snow depth for 60.6% (n = 298) closeouts. With moderate number of snow days we had moderate rain sum, snow sum and snow depth for 44.9% (n = 221) closeouts. With the low number of snow days we still had moderate rain sum but low snow sum and low snow depth for 24.2% (n = 119) closeouts.
Overall when we had low category of weather event, it was low for all weather events.
73

Ta
ble
2.
Cla
ss
* S
C
HC
Y
H
YS
Item
M
ean
M
in
Max
Mean
M
in
Max
Mean
M
in
Max
Mean
M
in
Max
In W
t (l
bs)
627
478
729
563
491
662
845
775
890
864
626
1002
Ou
t W
t (l
bs)
1349
1229
1437
1214
1131
1263
1290
1178
1403
1464
1325
1606
DO
F+
212
170
237
218
188
254
140
125
169
157
108
222
DM
I +
19.9
18.0
23.3
18.8
16.8
19.8
22.3
20.8
23.6
23.8
19.4
28
AD
G +
3.4
2.9
2
4.6
2.9
6
2.6
3.4
3.1
9
2.9
4
3.3
8
3.8
2
2.7
5.2
F/G
+
5.8
7
4.8
6.9
6.1
6
5.3
6.8
7
6.3
7.3
8
6.3
5.0
7
8.9
Death
lo
ss
(%
) 0.9
9
0
3.0
8
1.2
8
0
3.6
8
0.3
3
0
1.4
0.8
6
0
6.2
1
Vet
Med
($/h
d)
22.5
8
9.1
8
46.2
9
22.3
8
7.3
4
33.1
1
10.5
8
6.2
2
16.7
5
13.0
8
5.1
1
23
Net
Retu
rn (
$/h
d)
43.3
8
-535.5
1
374.9
4
25.1
6
-287.7
7
258.5
3
-14.0
3
-134.8
8
116.6
0
-18.8
5
-577.0
3
538.8
3
Ft2
/hd
184
90
368
163
94
281
220
154
357
258
84
466
*Cla
ss =
SC
– s
teer
calv
es;
HC
– h
eifer
calv
es;
YH
– y
earlin
g h
eifers
; and Y
S –
yearlin
g s
teers
+D
OF
– d
ays o
n f
eed
; D
MI
– d
ry m
atter
inta
ke; A
DG
– a
vera
ge d
aily
gain
; F
/G –
feed t
o g
ain
74

Ta
ble
3.
Cate
go
ry
Rain
S
no
w
Sn
ow
Dep
th
>
15”
5 t
o 1
5”
< 5
”
> 2
4”
10 t
o 2
4”
< 1
0”
> 1
.5”
0.5
to
1.5
”
< 0
.5”
Item
H
igh
M
od
era
te
Lo
w
Hig
h
Mo
dera
te
Lo
w
Hig
h
Mo
dera
te
Lo
w
# C
loseo
uts
39
110
15
78
36
50
43
52
69
% o
f C
loseo
uts
23.8
67.1
9.2
47.6
22
30.5
26.2
31.7
42.1
Rain
su
m (
inch
es)
19.4
10.4
3.6
11.7
11.7
12.8
12.8
10.4
12.7
Sn
ow
su
m (
inch
es)
24
25.9
9
43.4
16.3
2.3
48.7
29.3
6.4
Sn
ow
dep
th (
inch
es)
0.9
1.3
0.4
2.2
0.7
0
3.1
1
0.1
Av
g T
Max °
F *
61
53
54
43
55
73
43
46
68
Av
g T
Min
°F
*
40
32
30
23
33
50
24
25
45
Sig
n. R
ain
Ev
en
t+
11
6
2
6
6
8
7
6
8
Sig
n. S
no
w E
ven
t+
4
5
1
8
3
0
9
55
1
Su
m S
ign
Ev
en
ts+
16
10
2
14
9
8
15
11
9
DO
F
193
177
139
199
175
148
202
183
160
*Avg T
Max =
avera
ge d
aily
hig
h tem
pera
ture
for
the
feedin
g p
erio
d;
Avg T
Min
= a
vera
ge d
aily
lo
w tem
pera
ture
for
the f
eedin
g p
eri
od
+S
ign
ific
ant ra
in e
vent
is d
ay w
ith 0
.5 o
r m
ore
inches o
f ra
in;
Sig
nific
ant sno
w e
ve
nt is
da
y w
ith
2”
or
more
of
sno
w a
nd S
um
sig
nific
ant
eve
nts
is t
he t
ota
l num
ber
of
sig
nific
ant ra
in a
nd s
no
w e
vents
75

Table 4.
Category Rain Days Snow Days
> 7 days 3 to 7 days < 3 days > 5 days 2 to 5 days < 2 days
Item High Moderate Low High Moderate Low
# of Closeouts 55 75 34 67 23 74
% of Closeouts 33.5 45.7 20.7 40.9 14 45.1
Rain Sum (inches) 17.7 10.7 5.6 12.3 11.7 11.9
Snow Sum (inches) 23.4 25.9 20.1 45.8 23.5 7.1
Snow Depth (inches) 0.9 1.4 0.9 2.3 1.1 0.2
Avg TMax °F * 61 55 48 43 51 66
Avg TMin °F * 40 33 26 23 30 43
Sign Rain+ 11 6 2 7 6 7
Sign Snow+ 4 5 3 9 4 1
Sum Sign Events+ 15 11 5 15 11 8
DOF 186 181 155 203 184 156
*Avg TMax = average daily high temperature for the feeding period; Avg TMin = average daily low temperature for the feeding period
+Significant rain event is day with 0.5 or more inches of rain; Significant snow event is day with 2” or more of snow and Sum significant events is the total number of significant rain and snow evets
Results and Discussion
We determined what independent variables impacted DMI, ADG, Feed conversion, corn price, vet med expenses, death loss and net return. We evaluated the independent variables’ impact in categorical manner and as a regression to help evaluate the impact on the dependent variables. The analysis helped us determine ways to help reduce negative impacts on independent variables and how to adjust management to improve performance variables. Only significant (P < or equal to 0.10) outcomes were evaluated.
Table 5 shows the mean values for variables that significantly impacted DMI and how much they increased or decreased DMI.
Table 5 shows that for every inch of snow, DMI decreased 0.04 lbs from the mean DMI for the closeout. For every inch of snow that fell during the feeding period, we lost 0.04 lbs of DMI. For average of high and moderate snow sum we had 30” of snow so DMI would go from 21.9 (for steer calf) to 20.7 lbs DM. Based on the energy of the rations fed at Blac-X feedlot that equates to 4.39 vs 4.08 ADG or loss of 0.31 lbs/hd/day. If cattle are on feed for average of 199 days, that equates to 61.7 lbs lost due to snow and subsequent reduced DMI.
Intake drops 0.02 lb/longer days on fee. This is seen with calves that have lower DMI compared to yearlings. For every $1/bu increase in corn price, intake decreased 0.21 lbs DM. In years where we had higher corn price, we had lower DMI. With high feed prices, feed conversion is extremely important. Thus Blac-X was managing intakes very closely to improve feed conversion. For every $/cwt more that cattle cost, DMI intake was increased 0.01 lbs DM. The greater the investment in the cattle, the more pounds we need out of them to be profitable.
Please note that location within feedlot and snow depth did not impact DMI but snow sum did.
76

Table 5.
Change in DMI
Item Mean DMI Amount increased Amount Decreased
SC 21.9 0.88
HC 21.1 1.72
YH 20.6 1.77
YS 22.6 Standard rest of DMI figured from
Rain high sum 20.8 High vs Low 1.59
Rain moderate sum 21.4 High vs Moderate 0.61
Rain low sum 22.4 Moderate vs Low 0.98
Snow high sum 21.2 High vs Low 0.81
Snow moderate sum 21.4 High vs Moderate Not significant
Snow low sum 22.0 Moderate vs Low Not significant
Snow sum 0.04
Sign. Rain Event* 0.31
In weight 0.005
Ft2/hd 0.004
DOF 0.02
Corn Price 0.21
In Price 0.01
*Significant Rain Event is a day when they had 0.5” or more of rain.
Blac-X feedlot changes intake to adjust and respond to weather events. The changes help reduce the impact of the variable in some cases, but hurts in others. We’ll discuss how DMI should be handled due to various events later in the paper.
Table 6 shows the variables that impacted ADG.
Table 6 shows when high level of rain vs low, cattle gained 0.46 lb less. The average DOF for closeouts with high rain was 193 days. That equates to 88.8 lbs LESS gained when feeding period has high sum of rain! In today’s economics that equates to 88.8 lbs @ $115 = $102.10/hd less. High sum of snow has very similar negative impact on gain.
As discussed with DMI factors, for every inch of snow intake is decreased 0.04 lbs DM. At the high level of snow, the reduced intake caused about 61.7 lbs of decrease in total pounds gained based on live weight gain (LWG) equation using Blac-X feedlot ration energy. With ADG we see very similar results. For every inch of snow we have 0.01 lb lower ADG. Using our same average of 30” of snow, that equates to 0.3 lb lower ADG. Steer calves had 3.4 ADG but with high to moderate level of snow, ADG was only 3.1 lbs. Cattle were fed average of 199 days so that equates to 60 lbs LESS total gain when have high to moderate sum of snow. Thus the difference in DMI does account for basically all the difference we observed in performance. I recommend we strive to not decrease intake during snow fall events.
77
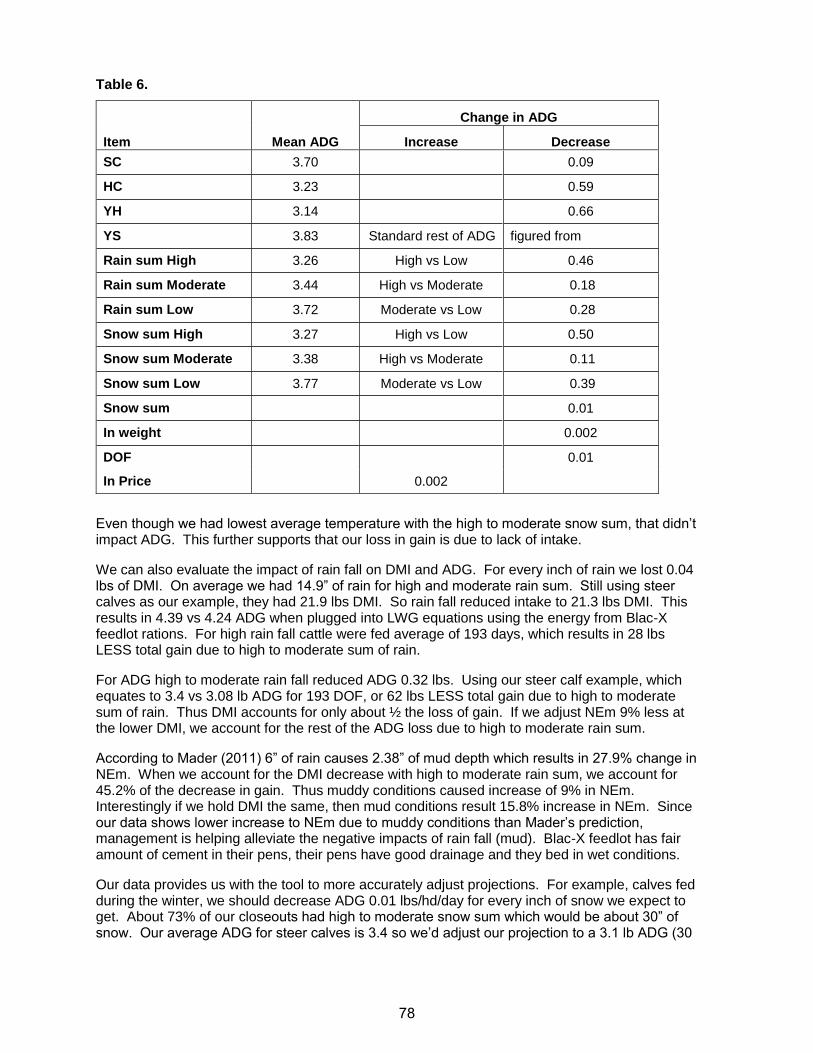
Table 6.
Item Mean ADG
Change in ADG
Increase Decrease
SC 3.70 0.09
HC 3.23 0.59
YH 3.14 0.66
YS 3.83 Standard rest of ADG figured from
Rain sum High 3.26 High vs Low 0.46
Rain sum Moderate 3.44 High vs Moderate 0.18
Rain sum Low 3.72 Moderate vs Low 0.28
Snow sum High 3.27 High vs Low 0.50
Snow sum Moderate 3.38 High vs Moderate 0.11
Snow sum Low 3.77 Moderate vs Low 0.39
Snow sum 0.01
In weight 0.002
DOF 0.01
In Price 0.002
Even though we had lowest average temperature with the high to moderate snow sum, that didn’t impact ADG. This further supports that our loss in gain is due to lack of intake.
We can also evaluate the impact of rain fall on DMI and ADG. For every inch of rain we lost 0.04 lbs of DMI. On average we had 14.9” of rain for high and moderate rain sum. Still using steer calves as our example, they had 21.9 lbs DMI. So rain fall reduced intake to 21.3 lbs DMI. This results in 4.39 vs 4.24 ADG when plugged into LWG equations using the energy from Blac-X feedlot rations. For high rain fall cattle were fed average of 193 days, which results in 28 lbs LESS total gain due to high to moderate sum of rain.
For ADG high to moderate rain fall reduced ADG 0.32 lbs. Using our steer calf example, which equates to 3.4 vs 3.08 lb ADG for 193 DOF, or 62 lbs LESS total gain due to high to moderate sum of rain. Thus DMI accounts for only about ½ the loss of gain. If we adjust NEm 9% less at the lower DMI, we account for the rest of the ADG loss due to high to moderate rain sum.
According to Mader (2011) 6” of rain causes 2.38” of mud depth which results in 27.9% change in NEm. When we account for the DMI decrease with high to moderate rain sum, we account for 45.2% of the decrease in gain. Thus muddy conditions caused increase of 9% in NEm. Interestingly if we hold DMI the same, then mud conditions result 15.8% increase in NEm. Since our data shows lower increase to NEm due to muddy conditions than Mader’s prediction, management is helping alleviate the negative impacts of rain fall (mud). Blac-X feedlot has fair amount of cement in their pens, their pens have good drainage and they bed in wet conditions.
Our data provides us with the tool to more accurately adjust projections. For example, calves fed during the winter, we should decrease ADG 0.01 lbs/hd/day for every inch of snow we expect to get. About 73% of our closeouts had high to moderate snow sum which would be about 30” of snow. Our average ADG for steer calves is 3.4 so we’d adjust our projection to a 3.1 lb ADG (30
78

inches of snow @ 0.01 lbs/inch = 0.3 lower ADG). With more accurate projections we can use all our tools more effectively (implants, hedging, marketing, beta-agonist).
Another question that is often asked, “How much less do I need to buy heifers for?” Based on this data base and ADG, we need to buy heifer calves $19.13/cwt less than steer calves. Heifer calves had 0.499 lower ADG compared to steer calves, fed for 200 days that equates to 99.8 lbs @ $115 = $ 114.77/600 lb (average in weight) = $ 19.13/cwt less. For yearling heifers we make similar calculation that shows we should pay $ 15.61/cwt less for heifers. We typically do not see that much price difference. But we also need to take into account the impact we see between heifers and steers in feed conversion.
Table 7 shows means and how variables impacted feed conversion.
Table 7.
Change in Feed to Gain
Item Mean Improved Decreased
SC 5.91 .001
HC 6.57 0.015
YH 6.70 0.017
YS 5.99 Standard rest of f/g figured from
Feedlot New 6.35 0.003
Feedlot Old 6.20 Standard feedlot new figured from
Rain sum High 6.49 High vs moderate 0.18
Rain sum Moderate 6.31 High vs low 0.45
Rain sum Low 6.04 Moderate vs low 0.27
Snow depth High 6.47 High vs low 0.43
Snow depth Moderate 6.33 Moderate vs low 0.29
Snow depth Low 6.04 High vs moderate Not significant
Rain sum+ 0.0005
Snow sum+ 0.0006
Avg Tmax*+ 0.0003
Sign Snow Event**+ 0.002
In weight+ 0.00014
DOF+ 0.0002
Corn Price+ 0.0022
+Regression values are on gain to feed vs feed to gain. All other values in table on feed to gain.
* Avg Tmax is the average of the warmest daily temperature for feeding period.
** Significant snow event is a day when 2” or more of snow falls.
Feed conversion is only parameter significant for location in the feedlot. The old pens have better feed conversion because 77% of the closeouts were calf feds in old part of feedlot while 81 % of yearlings were fed in new pens. The mean feed conversion for calf feds is better than yearlings.
79

Thus the pen design and location didn’t improve feed conversion, just the decision to feed calves more in old yard!
Feed conversion is only parameter significantly impacted by temperature. The warmer the temperature the better cattle converted. This may be a function of the lower intake during heat but still able to maintain gain.
Rain and snow depth (amount of snow on ground) had similar negative impact on feed conversion. Using $6.75/cwt for ration cost and taking the high rain level feed conversion vs low rain feed conversion we get $0.03/lb of gain higher feed cost of gain due to heavy rain or snow depth. We put on average of 661 lbs (average of steer calves and yearling steers) that equates to $20.03/hd Higher feed cost when have 15” or more of rain fall or greater than 1.5” of snow on the ground! With moderate rain fall (5 – 15”) or moderate snow depth (0.5 to 1.5” of snow on ground) we have $0.018/lb higher feed cost of gain. That equates to $12.03/hd higher feed cost for the feeding period. Almost all closeouts had high to moderate rainfall!
When we calculate the impact rain fall has on DMI and ADG we see about 0.48 change in feed conversion (6.92 vs 6.44) which is very similar to the impact we have on feed conversion. So DMI decrease and impact of wetness on NEm requirements explains the negative impact on feed conversion.
Snow depth is the amount of snow that is on the ground during the feeding period. Blac-X feedlot gets into pens and removes snow as soon as possible after snow event. But the impact on performance is still present. This indicates we need to bed more in snow events, to keep pens drier and to reduce negative impacts on maintenance energy.
There was no change to DMI due to snow depth, only sum of snow fall. Thus the loss of feed conversion is primarily due to wetness and duration of wetness.
As corn price increases we saw decrease in DMI and thus we improved feed conversion. Also, with higher feed cost we typically market cattle sooner vs feeding them longer, which also improves feed conversion.
Higher in weight results in higher DMI and thus not as good of feed conversion. Similarly the more days on feed the worse our feed conversion will be. These factors cannot be changed much. Zilmax has been one tool that allowed us to have better feed conversion with more DOF.
We can re-evaluate the question of “How much less should I pay for heifers?” Heifer calves had 6.57 feed conversion vs steers at 5.91. At $6.75/cwt ration cost that equates to $0.045/lb gain higher feed cost for heifers. Take that times average total pounds gained for calves (687 lbs) equates to $30.92/hd more to feed the heifers. Divide that by 600 lb in weight and we should pay $5.15/cwt less for heifers. This is significantly different from the $19/cwt, figured based on ADG. Thus the heifer improves some on feed conversion. I recommend taking the average of the two and try to purchase heifer calves for $12.14/cwt less than steers. At very least purchase them $5.15/cwt less.
A similar calculation may be done for yearling heifers which equates to $2.95/cwt less you need to pay for yearling heifer. This is significantly different from $15.61/cwt we figured based on ADG. I recommend that try to purchase yearling heifers $9.28/cwt (average of ADG and feed conversion results) less than yearling steers.
We also evaluated impacts on non-performance variables. Table 8 shows the impacts on vet-med expenses. At Blac-X feedlot, vet-med expenses includes all processing charges (implants, vaccines) and CTC treatments.
80

Table 8.
Item Means
Change in Vet-Med Expenses
Increase Decrease
SC 19.39 2.76
HC 18.13 1.33
YH 13.00 3.17
YS 15.74 Standard for vet-med Expenses
Feedlot New 14.98 3.61
Feedlot Old 18.15 Standard for vet-med Expenses
Snow Sum 0.10
In weight 0.014
Out price 0.04
Calves have higher vet-med expenses due to longer days on feed, more pulses of CTC and more implants administered. The old feedlot location has higher vet-med expenses due to greater percentage of calves being fed in the old pens vs the new pens.
Higher snow fall causes higher vet-med expenses. This may be due to increased respiratory or other health problems. We are surprised that rain sum wasn’t significant in this variable. That may be due to more calves, with higher vet-med expenses, are fed in snow season vs rainy season. Yearlings are primarily fed in the rainy season.
For every pound heavier in weight, we reduce vet-med expenses $0.014/hd. For example, our calf fed steers had mean in weight of 627 lbs and mean vet-med expense of $19.39/hd. If we brought in 700 lb calves instead, then the vet-med expense should be adjusted to $ 1.02 more per head or $18.37/hd.
For every $1/cwt more out price, we increase vet-med expenses $0.04/hd. This may be due because we are getting paid more for the cattle so we want to make sure they go to harvest! If we are getting $1.15 for cattle but can see we will get $1.18, vet-med expenses will increase from $19.39/hd to $19.51/hd so it is minimal impact, but significant.
We also evaluated death loss. Table 9 shows the impacts on death loss.
High rain fall and deep snow increase death loss similarly. What does 1.17% to 1.98% deads cost the feedlot? This change in death loss equates to $0.015/lb of gain higher total cost of gain and reduces profit per head by $15.70. The moisture causes poor pen conditions that can cause injuries and more sickness as we saw by increased vet-med expenses. We also have erratic individual feed intakes that will cause digestive deads. Again it is interesting that the snow depth has more impact than the sum of snow.
By implementing more intake and more bedding during rain and snow events we may be able to reduce increased death loss. We may also need to increase roughage level in rations during these weather events to help reduce the increased death loss.
Until we can implement the management and ration changes and show they help reduce death loss, projections should be adjusted for death loss accordingly.
81

Table 9.
Item Means
Change in Percent Death Loss
Increase Decrease
Rain Sum High 1.17 0.81 High vs Low
Rain Sum Moderate 0.94 Not significant High vs Moderate
Rain Sum Low 0.36 0.58 Moderate vs Low
Snow Depth High 1.18 0.63 High vs Low
Snow Depth Moderate 0.75 0.43 High vs Moderate
Snow Depth Low 0.55 Not significant Moderate vs Low
Snow Depth 0.11
Sign Rain Event* 0.06
In weight 0.002
Ft2/hd 0.002
Corn Price 0.14
Out Price 0.01
*Significant Rain event is a day with 0.5” or greater rainfall.
The heavier in weight the lower the death loss we are not sure why. As we increase square footage available to the cattle we increase death loss. Again we are not sure why.
As corn price and out price increase, we increase death loss. We saw that as corn price increases we decrease DMI and improve feed conversion indicating that we are pushing the cattle to perform. This may be why we have an increased death loss. Vet-med expense was the only other factor that impacted out price. An increase in vet-meds is indicative of more sickness, thus our increased death loss may be more of a function of sickness not environmental factors.
Net return is main bottom line to success of a feedlot, it takes into account all the factors we’ve been evaluating and puts the economic factors to it. Table 10 shows the impacts on Net Return ($/hd). Net return does not include hedging, just the economics of the cattle.
Net return provides us another look at the question of how much less should we pay for heifers. When we take the ADG figure minus the F/G figure we have very similar number to the net return difference between heifers and steer calves. We figured $19.13/cwt on ADG - $5.15/cwt based on feed conversion which equates to $13.98/cwt, which should be paid back from steer price for heifers. Similarly if we take $83.58 difference in net return between heifers and steer calves and divide by 600 lbs we get $13.93/cwt.
Using the same math for yearling heifers we figured $12.66/cwt is what we should pay back for heifers based on ADG and feed conversion. If we take $103.45 the difference in return between yearling heifer and steers and divide by 850 lbs we get $12.17/cwt, basically the same number.
Net return was different between new and old yard. Other parameters that impacted new and old yard was explained by calf vs yearling data. However with net return that is not true. The sum of calf net return is $125.82/hd while yearling sum is $145.45/hd. The difference is $19.63/hd more for yearlings. Thus the new yard should have greater net return. However the old yard has $54.23/hd greater return. So other parameters are impacting net return between new and old location of pens.
82

Table 10.
Items Means
Change in Net Return
Increase Decrease
SC 104.70 Heifer vs Steer calves 83.58
HC 21.12
YH 21.00 Heifer vs Steer Yearling 103.45
YS 124.45
Feedlot New 40.70 New vs Old -54.23
Feedlot Old 94.93
Rain Sum High 11.56 High vs Low 128.43
Rain Sum Moderate 51.92 High vs Moderate 40.36
Rain Sum Low 139.98 Moderate vs Low 88.07
Snow Sum High -184.71 High vs Low 511.19
Snow Sum Moderate 61.69 High vs Moderate 246.41
Snow Sum Low 326.47 Moderate vs Low 264.78
Snow Depth High -33.76 High vs Low 204.85
Snow Depth Moderate 66.13 High vs Moderate 99.90
Snow Depth Low 171.08 Moderate vs Low 104.95
Snow Days High 247.15 364.51 High vs Low
Snow Days Moderate 73.67 173.47 High vs Moderate
Snow Days Low -117.36 191.04 Moderate vs Low
Snow Sum 20.46
Avg TMAX 18.16
Sign Snow Event* 64.12
In weight 0.86
Ft2/hd 0.52
Corn price 27.86
In price 2.24
Out price 2.6
The new pens typically have 258 ft2/hd while the old pens are at 184 ft2/hd. For every ft2 more/hd we have $0.52/hd greater net return. The difference between new and old ft2 is 74 ft2/hd at $0.52/hd more return, which equals $38.48/hd greater net return for new yard. So the greater net return for new yard is due to feeding yearlings ($19.63/hd greater net return vs calves) and for providing more square footage ($38.48/hd), which equates to $58.11/hd and the new vs old yard had $54.23/hd greater return!
Rain fall has significant impact on net return. For high to moderate rainfall level compared to low rain fall we have $84.39/hd loss. This is explained by the performance loss we’ve seen by rain fall for DMI, ADG ($71.03) and feed conversion ($16.03). When we account for the losses we previous
83

figured that equates to $87.33/hd loss which is very similar to what we see on net return. I used today’s market price to figure loss on pounds so that is likely where our numbers are off. Rain certainly impacts DMI, ADG and feed conversion thus the feedlot’s bottom line.
Snow depth has significant impact on net return as well. For high and moderate snow depth compared to low depth, we have $152.38/hd loss. This is partially explained by DMI, ADG ($69.58) and feed conversion ($16.03) for total of $85.61/hd loss. Only 56.2% of the loss is accounted for by performance. Using LWG equations and holding intake the same (because snow depth didn’t impact DMI), we find the snow depth increases NEm cost 14%. We should bed cattle more, remove snow better and possibly increase intakes when we have snow depth of greater than 0.5” to help alleviate the strain on the cattle.
The snow data looks off for snow days. But we have to look at all snow categories to see complete picture of snow’s impact on net return. High to moderate snow sum (10 or greater”) had $378.80/hd loss on net return. Snow depth of high to moderate (0.5 or greater” on ground) had $152.38/hd loss on net return. While high to moderate snow days (2 or greater days with 2” or more of snow fall) had $268.99/hd greater profit. We are not sure why this one is profit. If we take the 3 snow parameters, that equates to $262.19/hd loss in net return.
Similarly if we look at the regression values, for every inch of snow we decrease net return $20.46/hd. We have average of 30” of snow for high to moderate snow fall. This equates to $613.80/hd loss! But for every snow day (greater than 2” of snow fell that day), we increase net return $64.12/cwt. We had average of 6.5 snow days which equates to $416.78/hd return! The sum result of snow on net return is $197.02/hd loss.
For every $1/bu higher corn price net return decreases $27.68/hd. Small part of this decrease is due to higher death loss when corn price is higher. The rest is likely due to higher cost of gain due to corn price.
For every $1/cwt increase incoming price, net return decreases $2.24/hd. For calves the difference in minimum and maximum in price was $148.50/cwt and for yearlings $156.80/cwt. Thus net return equates to $341.94/hd loss due to difference in the incoming price. But for every $1/cwt increase incoming price, DMI increased .01 lbs. For calf fed this equates to $97.52/hd greater return. Also for every $1/cwt increase incoming price, ADG increased .002 lbs which equates to $74.36/hd greater return for total of $171.88 greater return. Thus it appears that pure economics and not performance is driving the loss on net return for incoming price.
For every $1/cwt increase in outgoing price, net return increases $2.60/hd. There was less spread in outgoing price, the difference between minimum and maximum outgoing price was $143.61/cwt on average for steer calves ($77.11/cwt) and yearling steers ($210.11/cwt). Thus net return increases $373.39/hd. Pure economics, as incoming price goes up, and out price goes down, we have a loss. As incoming price comes down and out price goes up we have equal profit!
The main question left asked by Blac-X Feedlot, “Do we need to build a building? Do we have enough bad weather days to pay for a building?”
I figured high rain had $0.03/lb of gain higher feed cost (due to f/g difference). On average cattle were fed 193 days when in high rain category. We had average of 3.34 lb ADG * 193 days * 214 hd (average # hd /closeout) * 39 (# closeouts total with high rain) * $0.03/lb = $161,399.95 lost in the 10 years.
I then took the impact of snow on feed conversion, $0.029/lb of gain. On average cattle were fed 202 days when had high snow depth. We take our 3.34 ADG * 202 days* 214 hd (average # hd/closeout) * 43 (# closeouts total with high snow depth) * $0.029 = $180,043.75 lost in 10 years due to snow.
84

I then accounted for losses on ADG. High rain causes 0.464 lb loss/day. We have 193 days on feed average during high rain * 214 hd * 39 * .464 lbs = 747,401 lbs lost * $1.18 in today’s prices = $881,933.16 lost in the 10 years.
Accounted for the losses on ADG due to snow. That equated out to be 0.503 lbs less per day of high snow. We have 199 days (average DOF with high snow) * 214 hd * 78 (# closeouts with high snow) * 0.503 lbs lost = 1,670,819 lbs @ $1.18 = $1,971,566.50 lost in 10 years.
Accounted for increased death loss due to high rain at 0.805% which equates to $0.016/lb of gain higher TCOG. Have 193 days (average for high rain) * 39 (# closeouts with high rain) * 214 hd * 3.43 ADG * $0.016/lb = $88,399.50 lost over 10 years.
Accounted for increased death loss due to high snow at 0.629% which equates to $0.015/lb of gain higher TCOG. Have 199 days (avg for high snow) * 78 (# closeouts) * 214 hd * 3.43 ADG * $0.015/lb of gain = $ 170,901.87 lost over 10 years.
I did the same calculations for impact of moderate vs low for all parameters except for death loss which had no difference for moderate snow depth vs low snow depth.
The moderate category resulted in $187,511.50/yr loss due to weather events. The total loss per year is, $ 532,935.96. Cost about $1000/hd space to build a slat barn * 2500 hd = $2,500,000. So it’d take 4.7 years to pay for slat barn.
Cost about $850/hd space to build a monoslope bed pack barn * 2500 hd = $2,125,000. So it’d take 4 years to pay for building. This is figuring just the building cost.
Blac-X feedlot doesn’t need a building. They could add small shed to the pens to help alleviate the negative impacts on performance from rain and snow.
Conclusion
We were surprised temperature did not impact performance. We believe that is due to cattle’s ability to recover from shorter periods of cold and heat stress.
We were also surprised that location within the feedlot did not have more impact. However, this indicates that Blac-X feedlot does excellent job at bunk management and maintenance of all pens.
Rain and snow depth have largest impact on cattle performance. We now have parameters that help us state, yes the weather did cause the bad closeout.
Rain and snow events didn’t impact performance much, indicating that it’s the moisture at one point in time vs the number of times they get rain or snow.
Feedlots can now make adjustments to projections or explain performance on a closeout based on this data:
If you have or if you are predicted to have > 15” of rain fall throughout the feeding period you can make the following adjustments to projection or see these results on your closeout: ADG will decrease by 0.46 lbs, feed conversion will increase 0.45 (6.04 to 6.49) and death loss may increase 0.81%.
If you have 5 – 15” of rain fall during the feeding period you can make the following adjustments: ADG decrease 0.28 lbs, feed conversion decrease by 0.27 (6.04 to 6.31), and death loss may increase 0.58%.
85

If you have greater than 24” of snow fall during the feeding period you can make the following adjustments: DMI will decrease 0.96 lbs, and ADG will decease 0.5 lbs (3.4 to 2.9).
If you have 10-24” of snow during the feeding period you can make the following adjustments: DMI will decrease about 0.7 lbs and ADG will decrease about 0.39 lbs (3.4 to 3.01).
If you have snow cover of greater than 1.5” you can make the following adjustments: Worse feed conversion by 0.43 (6.04 to 6.33) and may increase death loss 0.63%.
If you have 0.5 to 1.5” of snow cover you will hurt feed conversion by 0.29 (6.04 to 6.33).
I thank Blac-X Feedlot for keeping excellent records at their feedlot and for sharing the data. There is a wealth of knowledge we gained from this data set and we are still learning from it. Having this knowledge will help us improve performance at their feedlot and other lots.
86

U of M Research Update:
Effects of Flies on Dairy Cattle Welfare and Productivity Brad Heins, PhD Associate Professor, Organic Dairy Management West Central Research & Outreach Center, University of Minnesota, Morris, MN
Fly control is always a hot topic with dairy producers because there are not a lot of viable options to alleviate fly pressure. Three important blood sucking pest flies on dairy cattle in the Upper Midwest are the stable fly, horn fly, and face fly. Stable flies develop as maggots in a wide array of decomposing organic matter, including soiled animal bedding and soiled feed debris that accumulates wherever cattle are confined. Dairy farm surveys indicate calf hutch bedding is a prominent source of stable flies around dairies, and choice of bedding material can minimize (pine shavings and sawdust contained fewer flies than straw) stable fly production. More recently, it has also become apparent that feed debris and manure that accumulate during winter are also important sources of stable flies, especially where overwintered debris piles remain intact into the following summer. The horn fly is a second kind of biting fly that attacks cattle. The horn fly and face fly develop in fresh cattle dung pats and nowhere else, so they are troublesome to organic herds when pastured. Horn fly control leads to increased milk production and calf growth. Unlike other kinds of flies that just visit cattle for brief moments, adult horn flies reside on their host animals, which makes then especially vulnerable to control. Horn flies, stable flies, and face flies on dairy cows can cause a 10 to 30% reduction in milk production and increased somatic cell counts in milk. Furthermore, these flies can reduce pasture feed intake, cause pinkeye, and may spread disease from one animal to another. At the University of Minnesota West Central Research and Outreach Center dairy, we have been evaluating a unique method (Spalding Cow-Vac™) for controlling pasture flies. The Cow-Vac are compatible with organic and grazing dairying, because a trap can be positioned at the entrance to a milking parlor, where cows come and go twice per day. During the summer of 2015, we evaluated the efficacy of the Cow-Vac in on-farm organic dairy production systems to control horn flies, stable flies, and face flies. The study partnered with eight organic dairy farms in Minnesota, and herds ranged from 30 to 350 cows in size. The results of fly counts and milk production for the presence or absence of the Cow-Vac on farms are in the accompanying table (Table 1). Horn fly numbers on cows were reduced by 44% on farm in the presence of a Cow-Vac compared to the absence of a Cow-Vac. Stable fly and face fly numbers were similar on farm whether the Cow-Vac was present or absent on farms. Milk production was similar for farms with the Cow-Vac compared to without the CowVac. In summary, these results indicate the Cow-Vac was effective in reducing horn fly numbers on cows and reduced horn fly growth rates during the pasture season in organic dairy production systems.
107

Table 1. Results of fly counts and milk production for the presence or absence of the CowVac.
CowVac Present CowVac Absent
Horn fly (fly/side) 11.4 20.5*
Stable fly (fly/leg) 5.4 7.1
Face fly (fly/cow) 1.0 1.0
Milk (lb/d) 34.2 33.7
Fat (lb/d) 2.9 2.9
Protein (lb/d) 2.2 2.4
Somatic cell count 315 322
* Significant difference of absence of CowVac compared to presence of CowVac
108

The Role of Diet in Determining Omega-3 Concentrations in Beef or Milk Haley Larson Research Assistant, Department of Animal Science University of Minnesota, St. Paul, MN
Take Home Message
Lipid transformation by rumen microbial processes of lipolysis and biohydrogenation alter 85 to100% of dietary omega 3 fatty acids.
Decreased ruminal pH causes inhibition of enzymes involved in lipid transformation, shifting certain microbial groups’ energy source away from lipids.
Monensin decreased lipolysis without impacting overall VFA production, demonstrating a shift in microbial metabolic processes.
As omega 3 supplementation increases, there is a decrease in efficiency of absorption by the animal, but omega 3 fatty acids deposited in meat or milk product increase.
At the current market price of flaxseed, beef cattle fed flaxseed for omega 3 enhancement would need a 42% premium above live market price to break even.
Increases in consumer willingness to pay are observed when the product is viewed to have health associated benefits.
Introduction Numerous studies have proven that omega-3 fatty acid concentrations in beef and milk products are directly impacted by diet (Wood et al., 2004). Alpha linolenic acid (ALA) is the most common dietary form of omega-3 fed to cattle. In fresh grasses, approximately 50% to 75% of total fatty acids (FA) are linolenic acid (Hawke, 1973). Unlike grasses, corn-based crops, which make up a majority of conventional Midwestern feedlot and dairy diets, are high in linoleic acid, an omega-6 fatty acid. Comparisons of omega-3 and omega-6 concentrations in both beef and milk have extensively proven that dietary concentration of omega-3s (particularly ALA) is a primary driver for the resulting omega-3 concentrations in beef or milk products. A study conducted by Cherfaoui et al. (2011) determined that the long-chain polyunsaturated fatty acids (PUFA) associated with human health benefits, such as eicosapentaenoic acid (EPA; 25:5n-3) and docosahexaenoic acid (DHA; 22:6n-3), can be synthesized in bovine liver, adipose, and muscle tissues if supplied with post-ruminal alpha linolenic acid (ALA; 18:3). This observation led them to conclude that any ALA that leaves the rumen unaltered has a beneficial impact on omega-3 concentrations in meat and milk products. Increasing ALA content in the diet with grass feeding can shift this ratio in meat products from 6-7:1 to 2:1 (Nuernberg et al., 2005). Greater omega-3 concentrations of meat and milk led some consumer groups to begin classifying omega-3 enriched meat and milk products as “functional foods”. However, although omega-3 content of the milk or meat product may be increased, the amount of omega 3s consumed from that product is not enough to be considered a significant intake source for omega-3. Instead the increase in omega-3 concentration simply helps balance the omega-6 to omega-3 ratio of the consumers diet, which human dietitians recommend should be around 4:1 (Daley et al., 2010). A typical American diet has an omega-6 to omega-3 ratio of around 15-20:1 (Simopoulos, 2006) mainly due to American’s high consumption of grain based products. The increased demand by consumers for omega-3 enriched products has led to a trend in cattle
111

feeding research to understand the most effective method to incorporate omega-3 fatty acids from the diet into meat or milk. Ruminal Lipid Transformations Most often when consumed by the animal, ALA is converted from an unsaturated structure to the saturated FA stearic acid (18:0) by rumen bacteria (Wilde and Dawson, 1966). This transformation occurs via two major processes in the rumen, lipolysis and biohydrogenation. During lipolysis, microbial lipases work to breakdown lipids by hydrolyzing ester linkages within lipid structures to release fatty acids and expose a free carboxyl group (Garton et al., 1961; Dawson et al., 1977). The presence of this free carboxyl group on a fatty acid is imperative for the next transformation process, biohydrogenation. The carboxyl group serves as an electronegative region for the lipase enzyme to bind hydrogen. When H is bound, there is a shift of electrons allowing isomerization to occur and saturation of double bonds to proceed (Harfoot and Hazelwood, 1988). Thus, transformation from the unsaturated to saturated form is complete. Each phase of lipid transformation has two distinct groups of bacteria involved, Group A and B, as classified by Kemp and Lander (1984). Group A hydrogenates polyunsaturated fatty acids to trans 18:1 isoforms, while Group B hydrogenates the trans 18:1 isoform to stearic acid (18:0). Three primary theories on biohydrogenation have evolved to explain the purpose of lipid transformation in the rumen ecosystem. One theory stemmed from observations by Hazelwood and Dawson (1979), showing that group A bacteria had the ability to incorporate trans-isoforms of linolenic or linoleic acids into membrane lipids. Therefore the idea was suggested that the biohydrogenation pathway served a role in the utilization of dietary fatty acids to synthesize membranes by certain bacterial species. However since these species make up such a small fraction of the total microbial population, it is unrealistic to think supporting this small group is the reason behind such a significant rumen process (Harfoot and Hazelwood, 1988). Even more debated is the theory suggested by Lennarz (1966) that biohydrogenation serves as a hydrogen disposal for bacteria requiring a reduced environment. Since the unsaturated bonds do serve as a hydrogen sink, this theory does hold merit. However, Harfoot and Hazelwood (1988) discredit this theory, citing methanogenesis as a much more efficient process for disposal of excess reducing power (i.e.- hydrogen). Perhaps the most widely known theory for the purpose of biohydrogenation is as a role in the detoxification of fatty acids (Kemp and Lander, 1984). Unsaturated fatty acids have been shown to inhibit many microorganisms, including rumen bacteria (Nieman, 1954). By hydrogenating unsaturated fatty acids, these are converted to a form useable by the rumen microbes and the inhibitory effects associated with unsaturated forms is decreased. Regardless of which theory is most reliable, all theories lead to the conclusion that biohydrogenation has a crucial role in maintaining the rumen ecosystem. Just as biohydrogenation helps maintain the rumen, the rumen environment also helps regulate the biohydrogenation pathway. In other words, depending upon certain conditions, there is a variable percentage of dietary PUFA that passes through the rumen without being saturated. It is estimated that approximately 85-100% of dietary ALA is biohydrogenated in the rumen, with 0-15% passing through unchanged (Doreau and Ferlay, 1994). Impact of Differences in Dietary Structure of Polyunsaturated Fatty Acids Based on dietary source, the structure of fat can vary immensely, in turn altering the efficiency of its rate of breakdown. Most cereal or concentrate sources store lipids in the form of triglycerides while fat from forage sources is predominantly found within the chloroplast membrane components as galactolipids, sulpholipids, and phospholipids. These lipids differ from triglycerides because they can only bind 2 fatty acid chains rather than 3 in triglycerides. Thus, energy content per mass is higher in cereals than forages.
112

Both triglycerides and forage lipids are hydrolyzed by enzymes of rumen microorganisms (Garton et al., 1958; Dawson et al., 1977). Based on the form in which it is stored, hydrolization of fats by rumen microbes varies. Triglycerides are hydrolyzed by Anaerovibrio lipolytica, but not phospholipids or galactolipids (Hobson and Mann, 1961; Prins et al., 1975). Therefore A. lipolytica has a primary role in lipolysis of cereal based lipids. On the other hand, Butyrivibrio fibrisolvens is the most active producer of phospholipase enzymes, establishing its role in lipolysis of forage-derived fat sources (Hazelwood and Dawson, 1975). Impact of pH on Post-ruminal ALA Based on dietary inclusion of concentrates and forages, the rumen microbial population will shift production of fermentation end products, which can lead to differences in ruminal pH. Decreases in ruminal pH can lead to decreased rates of lipolysis and biohydrogenation of PUFA (Loor et al., 2003; Nevel and Demeyer, 1996). As shown in Table 1, there is a definite impact of ruminal pH on both lipid transformation processes once ruminal pH drops to a borderline acidotic level.
Table 1. Influence of pH on lipolysis and biohydrogenation of linoleic and linolenic acid in vitro.
Freed Fatty Acids (mg) Disappearance (%)
pH 18:2 18:3 18:2 18:3
6.78 ± 0.04 16.53a 2.16a 94.6a 100.0a
6.34 ± 0.07 15.97a 2.04a 97.8a 100.0a 5.98 ± 0.06 15.16a 2.01a 95.2a 100.0a 5.56 ± 0.06 9.61b 1.21b 80.5ab 89.9b
5.22 ± 0.06 4.36c 0.48c 59.5b 68.8b
xyzLiinoleic acid = 18:2; linolenic acid (ALA) = 18:3; Freed fatty acids = FA liberated from TAG as representative of lipolysis; disappearance (%) of FA as consequence of biohydrogenation abcDiffering superscripts indicate significance p < 0.05
(Van Nevel and Demeyer, 1996)
Two major theories have since emerged to explain changes in biohydrogenation rate associated with lowered pH. One theory suggests the pH-sensitivity of lipolytic bacteria as a primary cause for depression of hydrogenated FA products in the rumen. Lipolytic bacterial species, Anaerovibrio lipolytica, had decreased growth at pH 5.7 and complete inhibition at pH 5.3 (Hobson, 1965). In vitro, Butyrivibrio fibrisolvens exhibited a 25% decrease in yield at pH 5.75 and was completely inhibited at pH 5.5 (Russell and Dombrowski, 1980). By inhibiting growth of these species, lipid breakdown to free fatty acids (FFA) will not occur as readily; additionally, hydrogenation of FFA is also inhibited. However, in a study conducted by Mackie et al. (1978), A. lipolytica was not eliminated from the microbial population when donor cattle were adapted from a low to high concentrate diet. These results cast doubt as to whether or not viable counts of lipolytic bacteria could be a primary indicator of lipase activity. Results from older studies demonstrated that activity of lipase enzymes was highest at pH 7.4 but it was reduced 50% if pH dropped to 6.6 (Henderson, 1971). Because a decrease in rumen pH is regularly associated with increased inclusion of concentrates in a diet, the decrease in lipase activity became associated with the changes in microflora based on diet composition (Gerson et al., 1985; Latham et al., 1972). Theory one would explain this reduction in activity as an inhibition of the rumen microflora. Results from in vitro studies, demonstrated a secondary theory that the reduction in lipase activity associated with changes in dietary composition was due to a shift in the metabolic processes of microbes. High concentrations of carbohydrates, particularly glucose, reduced bacterial production of lipase under aerobic conditions (Papon and Talon, 1988; Jaeger et al., 1994).
113

The impact of rumen pH on biohydrogenation rate is of great interest when observing the wide spectrum of diets consumed by cattle. Figure 1 shows the differences in rumen pH over a 24-h period when cattle are fed fresh grass, a 90% grain based diet supplemented with ALA or an ALA-unsupplemented 90% grain based diet (Larson et al., unpublished).
Figure 1. Average ruminal pH of dairy steers over 24 h period fed either grass or grain based diet.
If applying the findings from data by Van Nevel and Demeyer (1996), the average pH for the 24 h-period (Table 2) would suggest no treatment effects on lipolysis or biohydrogenation. However, from Figure 1 it is apparent that ruminal pH of grain-fed cattle spent more time below 6, which could result in lower total amount of biohydrogenated C18:3. This observation gave rise to the hypothesis that grain-fed animals, subjected to depression in ruminal pH, may be better at incorporating omega-3 fatty acids into end products.
Table 2. Impact of diet on average rumen pH over 24 h digestion period.
Treatment
Finishing Ration
Finishing Ration + ALA supplement Grass Based Diet
pH 6.08a 6.04a 6.59b
*Differing superscripts indicate significance p < 0.05 (Larson et al., unpublished)
Effect of Ionophores and Antimicrobials on Biohydrogenation of ALA In addition to the vast differences in ruminal pH, it must also be considered that many grain-based diets are supplemented with ionophores. Ionophores and other antimicrobials have been hypothesized to alter the amount of PUFA deposited in meat and milk products due to an impact on microbial lipolysis and biohydrogenation (Fellner et al., 1997; Marmer et al., 1985; Van Nevel and Demeyer, 1995). Marmer et al. (1985) determined that inclusion of monensin did not change the quantity of lipid and fatty acid content in tissue of steers, but did demonstrate decreased saturated fatty acid content and increased unsaturated fatty acid content. Within the adipose deposits of monensin-supplemented cattle, the composition of unsaturated fatty acids deposited showed a significant increase in trans-octadecenoic acids, a product of the first steps of biohydrogenation.
5
5.5
6
6.5
7
7.5
0 5 10 15 20 25
pH
Hours Post Feeding
Grass
Grain Supplemented
Grain Unsupplemented
* p < 0.05○ P > 0.05; P < 0.10
* * *
* * * *
○
○
114

Due to overall increase of unsaturated fatty acids and decrease of saturated fatty acids, when monensin was consumed, it was hypothesized there was decreased biohydrogenation. Zinn (1988) determined that dietary inclusion of monensin increased oleic acid (18:1) by 34% and decreased stearic acid by 11% (18:0) in the duodenal chyme of steers fed highly digestible finishing diets. Fellner et al. (1997) observed similar results where hydrogenation of linoleic (C18:2) to stearic acid was decreased; flows of oleic and linoleic also increased when ionophores were included in the diet. These results suggest that the first step in biohydrogenation is not inhibited to the same extent as the final saturation step. Because monensin mainly inhibits growth of gram-positive bacteria, these results are surprising. Group A bacteria involved in the conversion of linoleic acid (18:2) to oleic acid (18:1) are classified as gram negative (Butyrvibrio fibrisolvens). Furthermore, group B bacteria (Fusocillus and Clostridium proteoclasticum species) which hydrogenate oleic acid to stearic acid, are also classified as gram negative. Therefore, negative if monensin plays a role in modulating populations of these bacteria, it may not be as a direct result of its effect known on gram positive bacteria. Research to date on ionophore effects on unsaturated fatty acids has been focused on the inhibition of biohydrogenation. However, Van Nevel and Demeyer (1995) widened this perspective by suggesting that ionophores and other antimicrobials inhibit lipolysis to a greater extent than biohydrogenation. This response demonstrates that increases in omega-3 flows from the rumen of ionophore-fed cattle is not simply explained by an inhibition of bacteria. Rather, it demonstrates the ability of gram-negative bacteria to shift their metabolic processes when rumen environment is altered by dietary ionophores. Instead of breaking down fat as an energy source, lipolytic bacteria shift to alternative sources of energy therefore allowing more unsaturated fatty acids to pass through the rumen unchanged. However not all antimicrobial additives are effective for inhibiting lipolysis in the rumen. Data presented in Table 3 shows the effects of a range of antimicrobial additives on lipolysis and volatile fatty acid (VFA) production. For certain compounds such as Salinomycin sodium, lincomycin hydrochloride, oxytetracycline, tirginiamycin, and mentronidazole, an increased inhibition of lipolysis is paired with an increased inhibition of VFA production. These findings suggest that these antimicrobial products inhibit the rumen microbes themselves. However for additives such as amoxicillin, avoparcin, lasalocid sodium, and monensin an increase in inhibition of lipolysis is not accompanied by a decrease in VFA production. Thus these four particular products are most advantageous for increasing flows of polyunsaturated fatty acids from the rumen without major alteration of ruminal fermentation.
Table 3. Effect of antimicrobial additives on inhibition of lipolysis and VFA production.
Inhibition of
Additive Bacteria affected Lipolysis (%) VFA Production
(%)
Amoxicillin Broad Spectrum 18.2 6.4
Avoparcin Gram positive 10.4 3.9
Salinomycin sodium Gram positive 20.1 12.2
Lincomycin hydrochloride Anaerobic gram positive 14.5 14.8
Lasalocid sodium (Bovatec) Gram positive 19.3 6.3
Monensin (Rumensin) Gram positive 16.7 8.7
Terramycin Broad spectrum 15.7 17.4
Virginiamycin Gram positive 16.2 14.5
Mentronidazole Gram negative 9.1 10.4
*(Van Nevel and Demeyer, 1995)
115

Omega-3 Deposition in Meat or Milk As chain length of a fatty acid increases from 12 C to 18 C there is an increase in its apparent digestibility by the animal. A survey of published literature found that digestibility of fatty acids can range from 55% to 92%, depending upon factors such as chain length and degree of unsaturation (Demeyer and Doreau, 1999). For example, within 18 C chain FA with zero, one, two, or three bonds, apparent digestibility values were determined to be 77%, 85%, 83%, or 76% respectively. However, the authors made an important note, within this data set the digestibility value for C18:1 included all of the biohydrogenation isomers, which perhaps increase the digestibility value reported. Additionally, the value for C18:3 may have been inaccurately portrayed due to low dietary inclusions (Glasser et al., 2008). These digestibility values demonstrate that even if fatty acids escape ruminal biohydrogenation, there is no guarantee that it will be fully utilized by the animal. Since animals are unable to synthesize significant amounts of PUFAs at tissue deposition site, all long chain unsaturated fatty acids found in blood stream are of dietary origin or have been mobilized from body stores (Demeyer and Doreau, 1999). Thus dietary inclusion of omega-3s, has a direct impact on their concentration in meat or milk products. Regardless of the exact value of digestibility, it is clear there is a large amount of variability in the amount of omega-3 FAs deposited; the majority of which is explained by diet. As shown in Table 4, at greater concentrate inclusion there is greater efficiency in utilization of dietary supplied C18:3. However these data only represents efficiency of absorption, not the efficiency of incorporation into meat or milk products. Thus the challenge to ruminant nutritionists to increase omega-3 concentrations in meat and milk products presented earlier, now involves more than just the manipulation of ruminal fermentation patterns.
Table 4. Effect of three diets fed to sheep on ruminal biohydrogenation and absorption of linolenic acid (C18:3).
Hay : Concentrate
Fresh Grass 75:25 30:70
FA intake (g/100g DM) 2.38 0.88 0.88
C18:3 intake (g/d) 14.00 0.85 0.46
C18:3 % total FA 56.20 8.80 4.50
C18:3 hydrogenation (%) 96.0 93.0 87.0
C18:3 Presented at Sm. Intestine (g) 0.57 0.06 0.06
C18:3 absorbed (g/d) 0.49 0.04 0.05
Biohydrogenation escapex 4.10% 7.05% 10.87%
Absorption Efficiencyx 85.9% 66.6% 83.3%
Efficiency of Utilizationx 3.50% 4.71% 9.05%
*(Bauchart D. and Poncet C., unpublished data) published in (Chilliard et al., 2000) xBiohydrogenation escape = C18:3 presented at small intestine / C18:3 in diet; absorption efficiency = C18:3 absorbed / C18:3 presented at small intestine; Efficiency of utilization = biohydrogenation escape x absorption efficiency
Whether an omega-3 fatty acid is incorporated into meat or milk, significantly alters the efficiency of deposition. When absorbed, the body typically will package long chain fatty acids into HDL as the preferential lipoprotein for 90% of blood lipids. Uptake of HDL differs by tissue with adipose tissue taking up HDL much more efficiently than the mammary gland. There is a portion PUFA that are taken up by the mammary gland to ensure fluidity in milk (Demeyer and Doreau, 1999). However as depicted in Figure 2, the efficiency of incorporation of C18:3 into milk decreases as supply presented to the small intestine increases. Thus indicating that the mammary gland is able to selectively incorporate which fatty acids are required in milk fat when larger FA quantities are present. Even
116

though efficiency of incorporation may decrease there still is a general increase in C18:3 within milk fat as the amount of C18:3 presented to the small intestine increases.
Figure 2. Efficiency of transferring C18:3 from abomasum or small intestine of dairy cow to milk (Chilliard et al., 1991; Christenson et al., 1993; Drackley et al., 1992; LaCount et al., 1994; Litherland et al., 2005; Ottou et al., 1995).
However, as explained previously, most of ALA does not reach the small intestine in its original form. Instead, it is biohydrogenated to various isoforms. Certain isoforms of linoleic and linolenic acid, including trans-10, cis-12 conjugated linoleic acid (CLA), exerted a negative influence on total milk fat yield (Peterson et al., 2003). In a study conducted by Loor et al. (2004), ALA was added to low or high concentrate diets. Both the high concentrate diet (75% inclusion) as well as high concentrate plus ALA decreased milk fat percent and yield. Therefore, management of the amount of biohydrogenation isoforms synthesized is critical in order to avoid milk fat depression when supplementing polyunsaturated fatty acids. Fatty acids not incorporated into milk fat accumulate in adipose tissue deposits within viscera, subcutaneously, inter- or intra- muscularly. The composition of adipose tissue deposits, specifically those in beef, are directly reflective of the fatty acid profile presented to the small intestine following ruminal digestion (Demeyer and Doreau, 1999). Lipids are selectively deposited in various adipose deposits based on weight and growth stage of the animal. As weight increases, subcutaneous fat will increase and concentration of unsaturated fatty acids will increase within adipose deposits (Moloney, 2002). In finishing cattle, subcutaneous fat is the primary deposition site for unsaturated fatty acids while intramuscular fat is the primary deposition site for saturated fat. In contrast, in lean animals, subcutaneous fat is primarily made up of saturated fats while intramuscular fat accumulates more unsaturated fat. Because there is less fat in a lean animal, unsaturated FAs incorporated into phospholipid membranes make up a greater percentage of the total fat, especially in areas such as intramuscular fat where very little fat is present at that point in time (Demeyer and Doreau, 1999). Although no major inhibitory mechanisms for increasing omega-3 concentrations in meat are known, justification for the supplementation of dietary FA is challenging since majority of the omega-3s are deposited within dissectible fat and not directly consumed. Economic Benefits for Cattle Producers At present, there are no monetary incentives for producers raising omega-3 enriched beef at the packing plant. There are certain groups within the U.S. that specifically market omega-3 enriched
0
10
20
30
40
50
60
70
80
90
100
0 20 40 60 80 100
Tran
sfer
Eff
icie
ncy
, %, (
milk
C1
8:3
/in
fuse
d
C1
8:3
)
Infused C18:3 (g/d)
Chilliard et al., 1991
Christenson et al., 1993
Drackley et al., 1992
LaCount et al., 1994
Litherland et al., 2005
Ottou et al., 1995
117
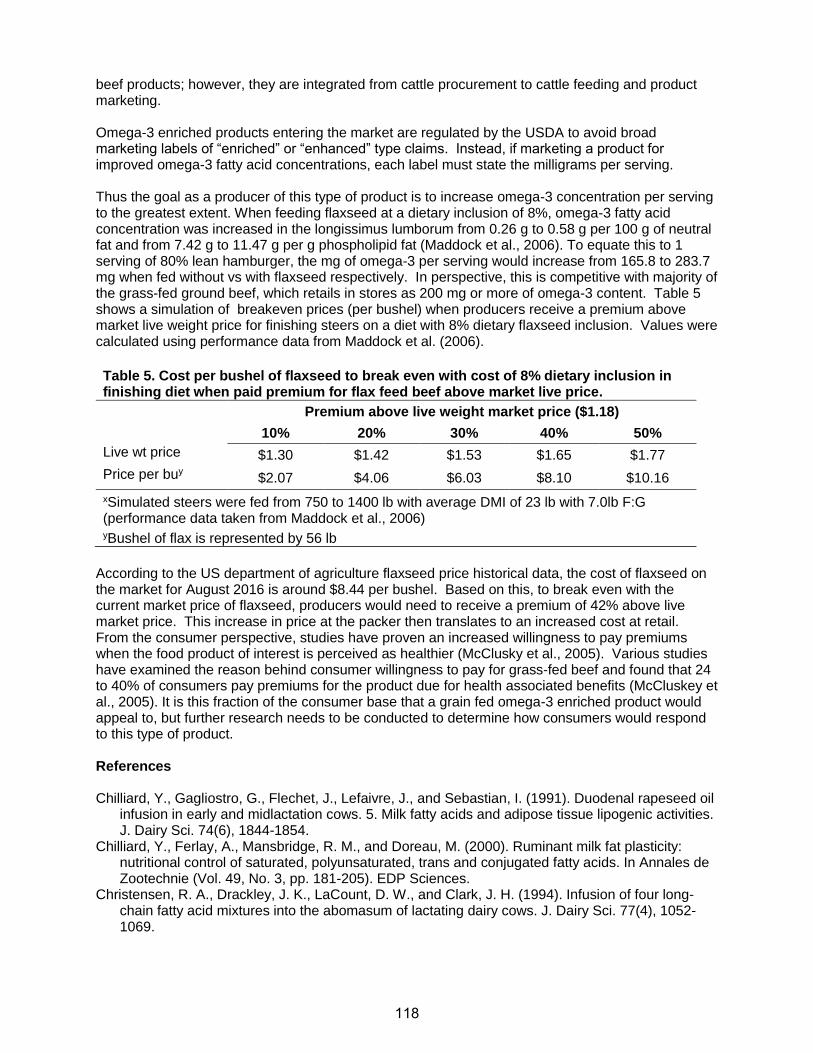
beef products; however, they are integrated from cattle procurement to cattle feeding and product marketing. Omega-3 enriched products entering the market are regulated by the USDA to avoid broad marketing labels of “enriched” or “enhanced” type claims. Instead, if marketing a product for improved omega-3 fatty acid concentrations, each label must state the milligrams per serving. Thus the goal as a producer of this type of product is to increase omega-3 concentration per serving to the greatest extent. When feeding flaxseed at a dietary inclusion of 8%, omega-3 fatty acid concentration was increased in the longissimus lumborum from 0.26 g to 0.58 g per 100 g of neutral fat and from 7.42 g to 11.47 g per g phospholipid fat (Maddock et al., 2006). To equate this to 1 serving of 80% lean hamburger, the mg of omega-3 per serving would increase from 165.8 to 283.7 mg when fed without vs with flaxseed respectively. In perspective, this is competitive with majority of the grass-fed ground beef, which retails in stores as 200 mg or more of omega-3 content. Table 5 shows a simulation of breakeven prices (per bushel) when producers receive a premium above market live weight price for finishing steers on a diet with 8% dietary flaxseed inclusion. Values were calculated using performance data from Maddock et al. (2006).
Table 5. Cost per bushel of flaxseed to break even with cost of 8% dietary inclusion in finishing diet when paid premium for flax feed beef above market live price.
Premium above live weight market price ($1.18)
10% 20% 30% 40% 50%
Live wt price $1.30 $1.42 $1.53 $1.65 $1.77
Price per buy $2.07 $4.06 $6.03 $8.10 $10.16
xSimulated steers were fed from 750 to 1400 lb with average DMI of 23 lb with 7.0lb F:G (performance data taken from Maddock et al., 2006) yBushel of flax is represented by 56 lb
According to the US department of agriculture flaxseed price historical data, the cost of flaxseed on the market for August 2016 is around $8.44 per bushel. Based on this, to break even with the current market price of flaxseed, producers would need to receive a premium of 42% above live market price. This increase in price at the packer then translates to an increased cost at retail. From the consumer perspective, studies have proven an increased willingness to pay premiums when the food product of interest is perceived as healthier (McClusky et al., 2005). Various studies have examined the reason behind consumer willingness to pay for grass-fed beef and found that 24 to 40% of consumers pay premiums for the product due for health associated benefits (McCluskey et al., 2005). It is this fraction of the consumer base that a grain fed omega-3 enriched product would appeal to, but further research needs to be conducted to determine how consumers would respond to this type of product. References Chilliard, Y., Gagliostro, G., Flechet, J., Lefaivre, J., and Sebastian, I. (1991). Duodenal rapeseed oil
infusion in early and midlactation cows. 5. Milk fatty acids and adipose tissue lipogenic activities. J. Dairy Sci. 74(6), 1844-1854.
Chilliard, Y., Ferlay, A., Mansbridge, R. M., and Doreau, M. (2000). Ruminant milk fat plasticity: nutritional control of saturated, polyunsaturated, trans and conjugated fatty acids. In Annales de Zootechnie (Vol. 49, No. 3, pp. 181-205). EDP Sciences.
Christensen, R. A., Drackley, J. K., LaCount, D. W., and Clark, J. H. (1994). Infusion of four long-chain fatty acid mixtures into the abomasum of lactating dairy cows. J. Dairy Sci. 77(4), 1052-1069.
118
Daley, C. A., Abbott, A., Doyle, P. S., Nader, G. A., and Larson, S. (2010). A review of fatty acid profiles and antioxidant content in grass-fed and grain-fed beef. Nutrition J. 9(1), 10.
Dawson, R. M. C., Hemington, N., and Hazlewood, G. P. (1977). On the role of higher plant and microbial lipases in the ruminal hydrolysis of grass lipids. Br. J. Nutrition 38(02), 225-232.
Demeyer, D., and Doreau, M. (1999). Targets and procedures for altering ruminant meat and milk lipids. Proceedings of the Nutrition Society 58(03), 593-607.
Doreau, M., and Ferlay, A. (1994). Digestion and utilisation of fatty acids by ruminants. Animal Feed Sci. and Tech. 45(3), 379-396.
Drackley, J. K., Klusmeyer, T. H., Trusk, A. M., and Clark, J. H. (1992). Infusion of long-chain fatty acids varying in saturation and chain length into the abomasum of lactating dairy cows. J. Dairy Sci. 75(6), 1517-1526.
Fellner, V., Sauer, F. D., and Kramer, J. K. G. (1997). Effect of nigericin, monensin, and tetronasin on biohydrogenation in continuous flow-through ruminal fermenters. J. Dairy Sci. 80(5), 921-928.
Garton, G. A., Hobson, P. N., and Lough, A. K. (1958). Lipolysis in the rumen. Nature 182, 1511-1512.
Garton, G. A., Lough, A. K., and Vioque, E. (1961). Glyceride hydrolysis and glycerol fermentation by sheep rumen contents. Microbiology 25(2), 215-225.
Gerson, T., John, A., and King, A. S. D. (1985) The effects of dietary starch and fibre on the in vitro rates of lipolysis and hydrogenation by sheep rumen digesta. J. Agric. Sci. 105, 27-30.
Glasser, F., Schmidely, P., Sauvant, D., and Doreau, M. (2008). Digestion of fatty acids in ruminants: A meta-analysis of flows and variation factors: 2. C18 fatty acids. Animal 2:691-704.
Harfoot, C. G. and Hazlewood, G. P. 1988. Lipid metabolism in the rumen. Pages 285-322 in P. N. Hobson, ed. The rumen microbial ecosystem. Elsevier Applied Science, New York, NY.
Hazlewood, G. P. and Dawson, R. M. C. (1975). Isolation and properties of a phospholipid-hydrolysing bacterium from ovine rumen fluid. J. Gen. Microbiol. 89, 163-74.
Hazlewood, G. and Dawson, R. M. C. (1979). Characteristics of a lipolytic and fatty acid-requiring Butyrivibrio sp. isolated from the ovine rumen. J. Gen. Microbiol. 112, 15-27.
Hawke, J. C. 1973. Lipids. Pages 213-263 in G. W. Butler and R. W. Bailey, eds. Chemistry and biochemistry of herbage. Vol. 1, Academic Press, New York, NY.
Henderson, C. (1971) A study of the lipase produced by Anaerovibrio lipolytica, a rumen bacterium. J. Gen. Microbiol. 65, 81-89.
Hobson, P. N. (1965). Continuous culture of some anaerobic and facultatively anaerobic rumen bacteria. J. Gen. Microbiol. 38, 167-180.
Hobson, P. N. and Mann, S. O. (1961). The isolation of glycerol-fermenting and lipolytic bacteria from the rumen of the sheep. J. Gen. Microbiol, 25, 227-40.
Jaeger, K. E., Ransac, S., Dijkstra, B. W., Colson, C., van Heuvel, M., Misset, O. (1994) Bacterial lipases. FEMS Microbiol. Rev. 15, 29-63.
Kemp, P., and Lander, D. J. Hydrogenation in vitro of α-linolenic acid to stearic acid by mixed cultures of pure strains of rumen bacteria. J. Gen. Microbiol. 1984;130:527-533
LaCount, D. W., Drackley, J. K., Laesch, S. O., and Clark, J. H. (1994). Secretion of oleic acid in milk fat in response to abomasal infusions of canola or high oleic sunflower fatty acids. J. Dairy Sci. 77(5), 1372-1385.
Latham, M. J., Storry, J. E., and Sharpe, M. E. (1972) Effect of low roughage diets on the microflora and lipid metabolism in the rumen. Appl. Microbiol. 24, 871-877
Lennarz, W. J. (1966). Lipid metabolism in the bacteria. Adv. Lipid Res., 4, 175-225. Litherland, N. B., Thire, S., Beaulieu, A. D., Reynolds, C. K., Benson, J. A., and Drackley, J. K.
(2005). Dry matter intake is decreased more by abomasal infusion of unsaturated free fatty acids than by unsaturated triglycerides. J. Dairy Sci. 88(2), 632-643.
Loor, J. J., Hoover, W. H., Miller-Webster, T. K., Herbein, J. H., and Polan, C. E. (2003). Biohydrogenation of unsaturated fatty acids in continuous culture fermenters during digestion of orchardgrass or red clover with three levels of ground corn supplementation. J. Dairy Sci. 81(6), 1611-1627.
119

Loor, J. J., Ferlay, A., Ollier, A., Doreau, M., and Chilliard, Y. (2005). Relationship among trans and conjugated fatty acids and bovine milk fat yield due to dietary concentrate and linseed oil. J. Dairy Sci. 88(2), 726-740.
Mackie, R. I., Gilchrist, F. M. C., Robberts, A. M., Hannah, P. E., and Schwartz, H. M. (1978) Microbiological and chemical changes in the rumen during the stepwise adaptation of sheep to high concentrate diets. J. Agric. Sci. Camb. 90, 241-254
Maddock, T. D., Bauer, M. L., Koch, K. B., Anderson, V. L., Maddock, R. J., Barceló-Coblijn, G., Murphy, E. J., and Lardy, G. P. (2006). Effect of processing flax in beef feedlot diets on performance, carcass characteristics, and trained sensory panel ratings. J. Dairy Sci. 84(6), 1544-1551.
Marmer, W. N., Maxwell, R. J., and Wagner, D. G. (1985). Effects of dietary monensin on bovine fatty acid profiles. J. Agric. and Food Chem. 33(1), 67-70.
McCluskey, J. J., Wahl, T. I., Li, Q., and Wandschneider, P. R. (2005). US grass-fed beef: marketing health benefits. J. Food Distribution Res. 36(3), 1.
Moloney, A. P., and Teagasc, D. (2002). The fat content of meat and meat products. Meat Processing–Improving Quality, 137-153.
Nieman C. Influence of trace amounts of fatty acids on the growth of microorganisms. Bacteriological Reviews. 1954;18(2):147-163.
Nuernberg, K., Dannenberger, D., Nuernberg, G., Ender, K., Voigt, J., Scollan, N. D., and Richardson, R. I. (2005). Effect of a grass-based and a concentrate feeding system on meat quality characteristics and fatty acid composition of longissimus muscle in different cattle breeds. Livest. Production Sci. 94(1), 137-147.
Ottou, J. F., Doreau, M., and Chilliard, Y. (1995). Duodenal infusion of rapeseed oil in midlactation cows. 6. Interaction with niacin on dairy performance and nutritional balance. J. Dairy Sci. 78(6), 1345-1352.
Papon, M., and Talon, R. (1988) Factors affecting growth and lipase production by meat lactobacilli strains and Brochothrix thermosphacta. J. Appl. Bacteriol. 64, 107-115
Peterson, D. G., Matitashvili, E. A., and Bauman, D. E. (2003). Diet-induced milk fat depression in dairy cows results in increased trans-10, cis-12 CLA in milk fat and coordinate suppression of mRNA abundance for mammary enzymes involved in milk fat synthesis. J. Nutrition 133(10), 3098-3102.
Prins, R. A., Lankhorst, A., Van der Meer, P., and Van Nevel, C. J. (1975). Some characteristics of Anaerovibrio lipolytica, a rumen lipolytic organism. Ant. van Leeuwenhoek J. Microbiol. Serol., 41, 1-11.
Russell, J. B., and Dombrowski, D. B. (1980) Effect of pH on the efficiency of growth by pure cultures of rumen bacteria in continuous culture. Appl. Environ. Microbiol. 37, 537-543
Simopoulos, A. P. (2006). Evolutionary aspects of diet, the omega-6/omega-3 ratio and genetic variation: nutritional implications for chronic diseases. Biomed. and Pharmacotherapy 60(9), 502-507.
Van Nevel, C. J., and Demeyer, D. I. (1996). Influence of pH on lipolysis and biohydrogenation of soybean oil by rumen contents in vitro. Reproduction Nutrition Dev. 36(1), 53-63.
Van Nevel, C., and Demeyer, D. I. (1995). Lipolysis and biohydrogenation of soybean oil in the rumen in vitro: Inhibition by antimicrobials. J. Dairy Sci. 78(12), 2797-2806.
Wilde, P. F., and Dawson, R. M. C. (1966). The biohydrogenation of alpha-linoleic acid and oleic acid by rumen micro-organisms. Biochem. J. 98, 469-475.
Wood, J. D., Richardson, R. I., Nute, G. R., Fisher, A. V., Campo, M. M., Kasapidou, E., Sheard, P. R., and Enser, M. (2004). Effects of fatty acids on meat quality: a review. Meat Sci. 66(1), 21-32.
Zinn, R. A. (1988). Comparative feeding value of supplemental fat in finishing diets for feedlot steers supplemented with and without monensin. J. Anim. Sci. 66(1), 213-227.
120

Evaluation of Corn Silage Digestibility and its Use in Ration Formulation Lawrence R. Jones, PhD American Farm Products, Inc
Joanne Siciliano-Jones, PhD FARME Institute, Inc
Abstract Corn silage is a complex feed providing three types of carbohydrates: rapidly fermented (i.e., starch), slower fermented carbohydrates (NDFd30), and a gut fill component (i.e., NDFu30). These carbohydrates usually represent 86% of the corn silage dry matter. The NDF portion has been characterized into that which is fermented in 30 hours (NDFd30) and that which is not (NDFu30). The NDFd30 portion supports production of milk fat while the NDFu30 portion acts as gut fill. The other major carbohydrate component (starch) generally supports milk production through propionic and lactic acid production. Starch digestibility is generally described as % digested in 7 hours. Starch digestion in corn silage will almost always be higher than starch digestibility in corn meal and will generally increase with time ensiled. Corn silage digestibility values should be used to estimate rumen available carbohydrate (NDFd30 + digestible starch) without violating gut fill (NDFu30) in a diet. Most diets for high producing Holstein cows will contain around 5 pounds (+/- 1) of NDFu30. Forage NDFd30 will support acetate and butyrate production while digestible starch will support lactic and propionic acid production. An accurate assessment of corn silage value should consider the economic values of starch, crude protein and digestible fiber. However, using commodity values as a proxy for these values will underestimate the value of corn silage due to its effect on the ruminal fermentation. The corn silage starch will be more digestible and the digestible fiber will likely have a higher residency time (“chew factor”). Simply as a quick evaluation, a RFC-Fill index has been developed for corn silage. High corn silage diets are feasible but require special attention. 1) Corn silage should not be cut such that more than 10% of the ration is on the top pan of the Penn State Separator. 2) Increasing corn silage while removing alfalfa might result in low K diets that can impact performance. 3) High corn silage diets have the potential to supply higher than optimal levels of corn oil resulting in an incomplete biohydrogentation of fatty acids in the rumen. Even low levels of certain unsaturated fatty acids have led to milk fat depression issues. Introduction In the beginning of the 19th century (circa 1809), a proximate system of nutrient analysis was developed at the Weende Experimental Station in Germany (Figure 1). Except for the characterization of the carbohydrate portion, this proximate analysis has held true. For corn silage, the proximate analysis system leads to a very interesting observation. The ash, fat, and protein portion of the corn plant is relatively consistent. For example, consider 6964 corn silage samples from the upper Midwest submitted to Cumberland Valley Analytical Services from 9/1/2015 until 8/3/2016. Ash content was 3.3% (± 0.72), protein content was 7.8 (± 1.1), and fat content was 3.1 (± 0.34). Consequently, the remaining carbohydrate portion of corn silage is approximately 86%.
121

According to Van Soest (1964), the early feed chemists thought that the fiber portion represented the indigestible part of the feed. The discovery of the digestibility of fiber (Henneberg and Stohmann, 1860) shattered the theoretical model upon which the proximate system of analysis was based. The carbohydrate portion of feeds was further defined by Goering and VanSoest (1970) who developed the NDF fiber system. In their system, NDF contains hemicellulose, cellulose and lignin, while the remaining carbohydrate has been termed non-fibrous carbohydrate (NFC). However, with this new carbohydrate characterization, NDF + NFC still represents about 86% of the corn silage dry matter.
Figure 1. Weende proximate analysis system developed in the early 19th century.
NDF + NFC ≈ 86% Corn silage can be broadly described as a mixture of plant and grain; the majority of the plant material is NDF while the grain material is mainly NFC. As one proportion increases, the other must decrease. This observation is important in describing corn silage. For example, a high starch corn silage must have a lower NDF content. Likewise, a high NDF corn silage, must have lower starch. This leads us directly to the fact that corn breeders cannot select for one of these traits without affecting the other. This point is also important when evaluating drought stressed corn. Corn that has impaired ear development, will have the same carbohydrate content (% DM) as a well-developed corn plant. However, in the former case, the carbohydrate will be in the form of NDF instead of starch. Depending on grain market conditions and fiber digestibility, this high NDF corn silage might be extremely valuable when viewed from a fiber perspective. In a later section, the importance of digestible fiber from forage will be discussed. NDF Digestibility When NDF enters the rumen, there is a period of time before the rumen bugs (bacteria and protozoa) can begin to break it down. This is known as the lag phase. The lag phase can be very short (minutes) or longer (hours) depending on the fiber composition of the plant material. Once digestion begins, the easily digested part of the fiber disappears quickly; this is the “fast pool”. Next, the rumen bugs work on the more resistant material which digests more slowly. This is called the “slow pool”. Although we separate these pools for calculation purposes, in the rumen their digestion overlaps with digestion of the slow pool starting before digestion of the fast pool is complete. Finally, there is a portion of the fiber that cannot be digested in the rumen, which is called the “indigestible pool”. In general, fiber digestion in the rumen is described as a 4 phase decay curve: lag, fast pool, slow pool, and indigestible pool.
122

Understanding fiber digestion is complicated by the fact that while rumen bugs are trying to digest fiber, there is competing passage out of the rumen. This is a lot like a bathtub where water is running in (intake), the drain is open (passage out) and the level of water is determined by residency time. Sometimes fiber particles that are highly digestible (beet pulp, soy hulls) may escape the rumen before the bacteria can fully digest the fiber. Passage rate out of the rumen will determine how much energy is derived from the fiber, as well as how much space the fiber occupies. Unfortunately, measuring passage rate for a dairy ration is very difficult but has a large impact on estimates of digested fiber as well as the metabolizable protein produced by rumen bugs.
Figure 2. M. B. Hall, 2014 USDA-ARS.
Almost all estimates of fiber digestion are conducted in the laboratory (in vitro) without the influence of passage rate or other real-world factors that can affect fiber digestion, such as an acidotic rumen. Laboratory estimates of fiber digestion should be considered optimal values; actual digestion in the cow may be significantly lower. NDFu30 Using in vitro analysis, NDFu30 is defined as the amount of NDF remaining after 30 hours of incubation. This estimate is independent of rumen environment including passage rate. For hybrid development purposes, this variable should be expressed as a percent of NDF. In our corn silage samples, the average NDFu30 (%NDF) was 43.8%. However, for nutritional purposes, this variable should be express as a percent of DM. Again in our corn silage database, the average NDFu30 (%DM) was 17.5%. Since 2013 (Jones and Siciliano-Jones, 2014), we have argued that NDFu30 as a percent of DM is an indicator of gut fill. Our thought is that fiber remaining in the rumen after the mean residency time of 30 hours will occupy space. Until this material passes, it will act as a filler, restricting feed intake. There are competing measurements for estimating gut fill (e.g., NDFu240). However, these measurements lack the intrinsic characteristic of directly corresponding to mean rumen retention time.
Digestion%
0
100
24 30 48Hour of Fermentation
Lag
Maximum Digestion
Indigestible
Potentially digestible
123

NDFd30 The other portion of the NDF is fermented during a 30-hour incubation. Historically, NDFd30 was expressed as a percent of NDF. Oba and Allen (1999) documented the relationship between fiber digestibility and intake. For our corn silage database, the NDFd30 (% NDF) was 56.2%. Again, from a selection perspective, NDFd30 (%NDF) is important for evaluating corn hybrids. The NDFd30 pool size determines its nutritional impact; therefore, NDFd30 should be expressed as % DM in ration evaluation. Digestible NDF from forage plays an important role in the production of acetate and butyrate for the production of milk fatty acids as well as metabolizable protein. For our database, this average NDFd30 (% DM) was 26.3%. Starch The NFC portion of corn silage is generally starch (~72%), fermentation acids (~8%), soluble fiber (~10%) and other short-chain rapidly fermentable carbohydrates (~10%). Except for starch, NFC is rapidly digested. Corn starch is bound to a protein matrix which influences its digestion. The common measurement for starch digestibility is a 7-hour digestion index after drying and grinding to 4 mm. Starch digestibility has been shown to increase during the ensiling process. Because corn silage is usually harvested before full kernel maturity, starch in corn silage is more digestible than starch in corn meal. As the corn plant matures beyond 35% whole plant moisture, starch content will increase, but starch digestibility will decrease. Starch digestibility in well fermented corn silage will generally increase about 10 percentage units above its value at harvest. For our corn silage database which has unknown maturity and duration of ensiling, the 7-h starch digestibility was 74%. What is value of corn silage Corn silage has four major facets in influencing rations: crude protein, digested fiber, undigested fiber, and starch. Some of these components are negatively related (digested vs undigested fiber, fiber vs starch). In our corn silage dataset, the proportions are 7.8%, 22.6%, 17.6%, and 33%, respectively. For rapid, qualitative evaluation of corn silage, Jones and Siciliano-Jones (2015) proposed a ratio of digested fiber plus starch divided by undigested fiber called RFC-fill index. For our corn silage dataset, this ratio is (22.6 + 33)/17.6 , or 3.8. It is suggested that values between 3 and 5 are standard while values above or below are more problematic. Low values indicate that gut fill will be a problem relative to carbohydrate levels. High values indicate carbohydrate load may be unusually elevated with high feeding levels. In a more complete analysis, the economic value of digestible fiber and starch should be considered. Furthermore, the crude protein content of corn silage (8%) should not be overlooked. However, several significant factors are often overlooked in traditional feed valuation systems. First, the starch digestibility of corn silage is usually much higher than corn meal. Estimating the price of starch in corn meal and applying that to corn silage significantly underestimates the value of corn silage. Second, estimating the value of NDFd30 from by-products such as soy hulls also severely underestimates the value of corn silage. The true value of NDFd30 is a function of retention time. Using corn silage digestibility to design diets Let’s start by remembering that there is no requirement for starch in a dairy cow ration. Instead of meeting a requirement, corn silage carbohydrate is used to support milk and milk components while not limiting intake. In 1988, Nocek and Russell (1988) introduced the notion of Rumen
124

Available Carbohydrate (RAC) which can be estimated from the combination of NFC and digestible NDF. Looking only at the forage component of the diet, there are three guidelines: 1) do not exceed the NDFu30 (lbs) threshold; 2) meet the guideline for NDFd30 (lbs); meet the guideline for NFC (lbs). Previously, Jones and Siciliano-Jones (2014) proposed generic forage guidelines of 5 pounds NDFu30, 7 pounds NDFd30, and 13 pounds NFC for a high producing Holstein animal. In this scenario, the NDFd30 (% NDF) is 58%. NDFu30 is included in the guidelines as a gut fill indicator. The specific gut fill capacity is herd dependent as it is influenced by particle size (changing residency time) and low rumen pH (less fiber digestion). Diets that include low levels of NDFu30 are probably not healthy diets. Using the typical corn silage from the database described above, we might expect an inclusion of 28 pounds of corn silage based on gut fill, if it is the only forage (5 # NDFu30/.175). This corn silage will also provide 7.4 pounds of NDFd30 and 13.1 pounds of NFC. Strictly from a carbohydrate perspective, this corn silage is a nice forage base for a ration. This calculation also led to the observation that a highly digestible corn silage may not be appropriate for a 100% corn silage diet. For example, consider a BMR corn silage with 38% NDF and a 65% NDFd (% NDF). On a dry matter basis, NDFd30 is 24.7%, the NDFu30 is 13.3%, the NFC will likely be 48% and the starch will be 34.5%. The inclusion of this corn silage, based on gut fill, can be 37.5 pounds which will provide 9.3 pounds NDFd30, and 12.9 pounds of NFC. Compared to the previous example, there are 1.7 extra pounds of carbohydrate coming from the corn silage. This difference will have a large impact on the overall ration. High corn silage diets Recently, there has been a movement toward higher corn silage diets. When considering the harvest cost, nutritional value, and gut fill aspects, corn silage is almost always a better value than haylage. The main driving forces are the higher yields and lower harvest cost for corn silage, as well as a generally lower gut fill for corn silage compared to haylage. However, high corn silage diets do present potential risks. High corn silage diets are also low haylage diets. Particularly if the hayage being replaced is alfalfa, there may be significant cation exchange capacity lost with the removal of the alfalfa. High corn silage diets also have the potential to be low in potassium. High corn silage diets have the potential to be high in rumen active oil, especially if combined with high moisture corn. High levels of corn oil have the potential to interfere with rumen bio-hydrogenation, resulting in milk fat depression. Dr. Barbano at Cornell University has shown that an increase in milk unsaturated fatty acids results in reduced milk fat as well as reduced milk protein. High corn silage diets have also brought into question the practice of long particle length corn silage (e.g., Shredlage). There are two important questions for ration structure; 1) will cows sort the feed? and 2) is there enough physically effective fiber? Using the Penn State Separator, a common guideline is to have less than 10% of the ration on the top pan. When a high corn silage diet is comprised with Shredlage (> 20 mm), it is difficult to meet this guideline. The term Physically Effective NDF (peNDF) was developed to describe chewing activity and ruminal function (Mertens, 1997). peNDF is defined as all NDF that larger than that passing through a 1.18 inch opening. Consequently, an extreme increase in length of corn silage may not actually provide more peNDF.
125

References Goering. H. K. and P. J. Van Soest. 1970. Forage Fiber Analyses (Apparatus, reagents, procedures,
and some applications). USDA-ARS Agric Handbook No. 379. US Govt. Printing Office, Washington, D.C. 20 pp.
Jones, L. R. and J. Siciliano-Jones, 2014a. New Forage index aids in dairy ration formulation. Feedstuffs 86:53.
Jones, L. R. and J. Siciliano-Jones. 2014b. Forage analysis considers gut fill. Feedstuffs 86, 29:18-19.
Jones, L. R. and J. Siciliano-Jones. 2015. Index useful for ranking silage samples. Feedstuffs 87, 30. Mertens, D.R. 1997. Creating a system of meeting the fiber requirements of dairy cows. J. Dairy Sci.
80:1463-1481. Nocek and Russell, 1988. Protein and Energy as an Integrated System. Relationship of Ruminal
Protein and Carbohydrate availability to Microbial Synthesis and Milk Production. J. Dairy Sci. 71:2070-2107
Oba, M. and M. S. Allen. 1999. Evaluation of the importance of the digestibility of neutral detergent fiber from forages: Effect on dry matter intake and milk yield of dairy cows. J. Dairy Sci. 82:589-596.
Van Soest , P. J. 1964. Symposium on Nutrition and Forage and Pastures: New Chemical Procedures for Evaluating Forages. J. Anim. Sci. 23: 3: 838-845.
126

U of M Research Update:
Feeding and Management for 6,000 Pounds of Milk Production per Robot in a Robotic Milking System Marcia Endres, Professor Department of Animal Science, University of Minnesota, St. Paul MN
Jim Salfer, Dairy Extension Educator University of Minnesota Extension, St. Cloud, MN
Automatic or robotic milking systems (RMS) are being adopted by dairy producers in the upper Midwest USA at a relatively fast rate. Profit margins in the US are usually tight; therefore dairy operations need to be very efficient. Total daily milk yield per robot has been suggested to be an important characteristic to assess the efficiency of RMS. We visited 52 RMS dairy farms in Minnesota and Wisconsin to collect housing and management information and remotely collected daily data from the RMS software for approximately 18 months. Forty farms had exclusively free flow cow traffic. The number of cows per robot box was 70.3 ± 14.1 and it was greater for guided flow compared to free flow RMS farms (75.0 vs. 65.5 cows per robot). There was a significant correlation between yield per cow and yield per RMS in our study (r = 0.83). Using a subset of 32 farms with exclusively free flow cow traffic and no pasture access, we found that average number of milkings per day was positively associated with productivity per robot. Milking speed also had a strong association with increased milk production whereas average refused and failed visits had a negative association with yield per RMS. As would be expected kg of concentrate fed per 100kg of milk produced was negatively associated with both yield per RMS and per cow, as this would be an indication of the decreased efficiency of concentrate utilization. However, average concentrate fed per cow per day was positively associated with milk production with farms feeding more concentrate generally obtaining higher production. Average residual feed (feed not dispensed from the concentrate feeder due to a lack of visits to the RMS) was negatively associated with milk yield per cow. Length of exit lane from the RMS was positively associated with milk yield per cow and farms with mattresses had lower milk yield per RMS than farms with deep bedded stalls and waterbeds. We suggest that a couple of key factors to achieve high milk per robot per day include high milk production and reduced box time per cow. High production per cow results from increased fetching of early lactation cows, excellent transition cow program that results in higher peak milk yields, well balanced diets (both partial mixed ration and RMS pellets), and high reproductive efficiency. To minimize box time per cow, producers should select for cows that milk and attach fast, keep RMS equipment in top working condition, singe udders and trim tail switches.
129

U of M Research Update:
Lipid Oxidation Measures Chi Chen, PhD Departments of Animal Science and Food Science and Nutrition University of Minnesota, St. Paul, MN
Abstract In this study, the kinetics of aldehyde formation in heated frying oils was characterized by 2-hydrazinoquinoline derivatization, liquid chromatography–mass spectrometry (LC–MS) analysis, principal component analysis (PCA), and hierarchical cluster analysis (HCA). The aldehydes contributing to time-dependent separation of heated soybean oil (HSO) in a PCA model were grouped by the HCA into three clusters (A1, A2, and B) on the basis of their kinetics and fatty acid precursors. The increases of 4-hydroxynonenal (4-HNE) and the A2-to-B ratio in HSO were well-correlated with the duration of thermal stress. Chemometric and quantitative analysis of three frying oils (soybean, corn, and canola oils) and French fry extracts further supported the associations between aldehyde profiles and fatty acid precursors and also revealed that the concentrations of pentanal, hexanal, acrolein, and the A2-to-B ratio in French fry extracts were more comparable to their values in the frying oils than other unsaturated aldehydes. All of these results suggest the roles of specific aldehydes or aldehyde clusters as novel markers of the lipid oxidation status for frying oils or fried foods.
175

U of M Research Update:
Hazard Analysis in Feed Ingredients for FSMA Compliance Jessica Evanson, DVM, MPH Veterinary Public Health & Preventive Medicine Resident Center for Animal Health & Food Safety, University of Minnesota
Carie Alexander, DVM, MPH, DACVPM Veterinary Public Health & Preventive Medicine Resident Center for Animal Health & Food Safety, University of Minnesota
Background In 2011, The Food Safety Modernization Act was passed requiring animal food manufacturers to conduct a hazard analysis for their facilities. In addition, manufacturers will be required to assess the severity if the hazard were to occur and the probability that the hazard will occur. Objective To evaluate biological, chemical, and physical contamination events and deficiencies for the probability to occur as known or reasonably foreseeable hazards in animal food and ingredients, and the associated severity. Methods A search was conducted to document the occurrence of potential hazards in animal food through the use of PubMed, CABI, and the FDA recall website. Data from these resources were collected and entered into an Excel spreadsheet. Scoring matrices were developed to calculate probability and severity scores for each hazard by product and species. Outcome An interactive database will provide science based input for manufacturers to support hazard identification, in addition to plant specific experience and data, for their food safety plan development.
176

U of M Research Update:
Seeding Year Yield and Forage Nutritive Value of Reduced Lignin and Conventional Alfalfa Varieties Subject to Diverse Cutting Treatments A.M. Grev1, M.S. Wells2, K.L. Martinson3, and C.C. Sheaffer4
1Graduate Research Assistant, Department of Animal Science, University of Minnesota 2Assistant Professor, Department of Agronomy and Plant Genetics, University of Minnesota 3Associate Professor, Department of Animal Science, University of Minnesota 4Professor, Department of Agronomy and Plant Genetics, University of Minnesota
Reduced lignin alfalfa varieties have potential to provide increased management flexibility and to increase the feeding value of alfalfa for livestock animals. The objectives were to determine the seeding year yield and forage nutritive value of a reduced lignin alfalfa variety (‘HarvXtra’) and conventional varieties when subject to diverse cutting treatments. The experimental design was a randomized complete block with a split plot arrangement of treatments. Whole plots were four cutting treatments, which included ‘Standard’ (S; 60d + 30d + 30d), ‘Standard + Fall’ (SF; 60d + 30d + 30d + Fall), ‘Standard + Delay’ (SD; 60d + 37d + 37d), and ‘Delay + Fall’ (DF; 67d + 45d + Fall). Sub plots were four alfalfa varieties, which included ‘54R02’, ‘DKA43-22RR’, ‘HarvXtra’, and ‘WL355RR’. The experiment was seeded in late April 2015 at two locations in Minnesota. At each harvest date, plots were first hand-sampled to determine plant maturity and forage nutritive value and then mechanically harvested and weighed to determine yield. Data was analyzed using the Proc Mixed procedure of SAS, with statistical significance set at P ≤ 0.05. Cutting treatment by variety interactions were not significant; therefore, the main effects of cutting treatment and variety are reported separately. Yield is reported as seasonal cumulative yield, and forage nutritive values are reported for the second harvest. At Rochester, cutting treatments SF and DF had greater DM yields (≥ 6.8 mt/ha) than cutting treatment S (5.9 mt/ha). Yield for varieties ‘DKA43-22RR’ and ‘54R02’ (≥ 6.8 mt/ha) were higher compared to ‘HarvXtra’ (6.1 mt/ha). At St. Paul, yields for cutting treatments SF and DF (9.8 mt/ha) were greater than SD and S (≤ 8.3 mt/ha). There was no difference in yield among varieties at St. Paul. At Rochester, neutral detergent fiber (NDF) and acid detergent fiber (ADF) was higher for the DF cutting treatment compared to all other cutting treatments. At St. Paul, the SD and DF cutting treatments had the greatest NDF and ADF concentrations. At both locations, crude protein (CP) content for cutting treatments S and SF was greater than for SD and DF, and NDF digestibility (NDFD) was higher for cutting treatments SF and S compared to DF. There were no differences in NDF or CP concentrations between alfalfa varieties at either location. At Rochester, all conventional alfalfa varieties had higher ADF concentrations (≥ 34.6%) compared to ‘HarvXtra’ (32.5%). At St. Paul, concentrations of ADF were greater for ‘54R02’ (32.1%) compared to ‘HarvXtra’ (29.7%). At both locations, ‘HarvXtra’ had greater NDFD (41.9%) compared to all other varieties (38.4%). Cutting treatments and alfalfa varieties affected both yield and forage nutritive values and should be considered when making management decisions.
226

Using Glyphosate Testing to Sell Professional Services, Supplements, or a Completely New Feed Program G. Pusillo, BS, MS, PhD, PAS, ACAN, AAFS INTI Service Corp.
T. Purevjav, PhD INTI Service Corp.
Glyphosate; the active ingredient in Roundup and other weed killing formulations; is a broad-spectrum, post emergence, non-selective herbicide. Concerns about contamination of human foods with Glyphosate and all the problems associated with it, are spilling into the horse health and nutrition world. A growing number of Equine veterinarians and horse feed sales representatives, are converting entire stables and training facilities to new horse products and services all because of a specific ELISA “glyphosate” test, and their personal interpretation on the resulting test values. There are currently no standards set up by the USDA or FDA to test for glyphosate in incoming ingredients or in finish products of horse feeds. Feed companies are not required to test their horse feeds for glyphosate levels. The amount of glyphosate in a plant depends on a variety of situations that no feed company has control over once a product containing glyphosate is used by a farmer. There are over 750 products containing glyphosate for sale in the United States; most horse nutrition professionals working for reputable feed companies follow all current USDA and FDA guidelines in their purchasing of ingredients and manufacturing of finished products. Testing commercial horse feeds in an attempt to recommend changing one brand of feed for another, based solely on a specific ELISA “glyphosate” test alone is irresponsible. Currently, no published horse data exists to indicate a correlation between specific glyphosate test results in a feed, and a diagnosed problem in a horse. The ELISA assay that is being sold to test for residues of glyphosate was developed originally by Monsanto, and that ELISA was validated for water and may result in false positives at very low levels (ppm) when not validated for feed matrices. References Baylis, A.D. 2000. Why glyphosate is a global herbicide: strengths, weaknesses and prospects. Pest
Manag. Sci. 56:299-308. Kolpin, D.W., E.M. Thurman, E.A. Lee, M.T. Meyer, E.T. Furlong and S.T. Glassmeyer. 2006.
Urbancontributions of glyphosate and its degradate AMPA to streams in the United States. Sci. Total Environ. 354:191-197.
Roundup herbicide bulletin Number 1; 1980. Monsanto Agricultural Products Company: St. Louis, MO.
WHO, Summary Report from the May 2016 Joint FAO/WHO Meeting on Pesticide Residues (JMPR), Geneva, Switzerland, 2016.
WHO. Data Sheets on Pesticides: Glyphosate; International Programme on Chemical Safety, World Health Organization, Food and Agriculture Organization: Geneva, Switzerland, 1996.
229