Practical Applications of Measurement to Addiction Research (“Why do we care?”) Michael L....
39
Practical Applications of Measurement to Addiction Research (“Why do we care?”) Michael L. Dennis, Ph.D. Chestnut Health Systems, Bloomington, IL Presentation at NIH Pre-session of the International Conference on Outcome Measurement, September 10, 2008, Rockville, MD. This presentation supported by National Institute on Drug Abuse (NIDA) grant no R37 DA11323 and Center for Substance Abuse Treatment (CSAT), Substance Abuse and Mental Health Services Administration (SAMHSA) contract 270-07-019. The opinions are those of the author and do not reflect official positions of the consortium or government. Available on line at www.chestnut.org/LI/Posters or by contacting Joan Unsicker at 720 West Chestnut, Bloomington, IL 61701, phone: (309) 827-6026, fax: (309) 829-4661, e-Mail: [email protected]
-
Upload
anabel-campbell -
Category
Documents
-
view
216 -
download
0
Transcript of Practical Applications of Measurement to Addiction Research (“Why do we care?”) Michael L....
Practical Applications of Measurement to Addiction Research (“Why do we care?”)
Michael L. Dennis, Ph.D. Chestnut Health Systems, Bloomington, IL
Presentation at NIH Pre-session of the International Conference on Outcome Measurement, September 10, 2008, Rockville, MD. This presentation supported by National Institute on Drug Abuse (NIDA) grant no R37 DA11323 and Center for Substance Abuse Treatment (CSAT), Substance Abuse and Mental Health Services Administration (SAMHSA) contract 270-07-019. The opinions are those of the author and do not reflect official positions of the consortium or government. Available on line at www.chestnut.org/LI/Posters or by contacting Joan Unsicker at 720 West Chestnut, Bloomington, IL 61701, phone: (309) 827-6026, fax: (309) 829-4661, e-Mail: [email protected]

Objectives are to...
Examine why more traditional clinical trials type researchers need to care about measurement
Provide explicit practical examples of how addressing measurement in Addiction Research can help improve it

Since the early 1960s, Jacob Cohen and colleagues has suggest that clinical trials research should: Focus on Statistical power, which is
- the probability of finding what you are looking for given that it is there
Combine data from multiple clinical trials into meta analyses, which can be used as - a more stable estimate of truth
- to evaluate the accuracy of our early estimates and how methods can be improved

In a review of over 200 meta analyses of medical, social and legal studies published between 1960-1990, Lipsey consistently found Less than a third of the individual articles coded even
mentioned- the statistical power of their core contrast
- reliability, validity, or sensitivity of their outcome measure
That relative to final effect size estimated from the meta analysis, the studies averaged less than 50% power- in other words, it was more accurate to flip a coin than to use a
statistical test the way they were being used “on average” in the published literature

Movement to Improve the Methodological Quality of Clinical Trials Research
In 1993 a group of 30 experts (medical journal editors, clinical trialists, epidemiologists, and methodologists) met in Ottawa to try to identify methodological gaps in the literature
In 1996 this growing group issued the Consolidated Standards of Reporting Trials (CONSORT; www.consort-statement.org)
Since 2000, NIH has required DSMB on all Phase 3 and multi-site phase 2 studies (Notice OD-00-38) – which also push CONSORT
Today virtually every major medical, psychiatric, psychological, criminological, and social journal has signed onto CONSORT

Basic ways to increase power
Increase sample size Increase observations Target a higher severity/less heterogeneous sample Increase implementation Reduce measurement error Reduce unexplained variance (which may be systematic) More accurately model error and unexplained variance in
analysis
While the most common approach, these are also the
most expensive and logistically difficult to do
Today’s focus

Observed Effect Size as a function of “True” effect size (Cohen’s d) and reliability of dependent variable
0.00
0.10
0.20
0.30
0.40
0.50
0.60
0.70
0.80
0.901.
00
0.90
0.80
0.70
0.60
0.50
0.40
0.30
0.20
0.10
Reliability of Dependent Variable
Obs
erve
d E
ffec
t Siz
e (O
bser
ved
d)
d=.2d=.4d=.8
True Effect Size
No Measurement Error
“Observed” Effect size goes down with lower
reliability

Sample size required for 80% power as a function of “True” effect size (Cohen’s d) and reliability of dependent variable
0100200300400500600700800900
10001.
00
0.90
0.80
0.70
0.60
0.50
0.40
0.30
0.20
0.10
Reliability of Dependent Variable
n pe
r gr
oup
for
80%
pow
er
d=.2d=.4d=.8
True Effect Size
A reliability of .7 doubles sample size
requirements
Increasing reliability
from .4 to .7 cuts sample
size requirements by over 50%

Unclear time periods Badly worded double negatives Constantly changing response sets Difficult to use (or time consuming) response sets Behavior/trait that varied in a range (disturbance) Abstract concepts not defined well by a single
question
Some of common source of discordant answers in test-retest questions that can be readily addressed are:

-0.39
-0.25
-0.24
-0.10
-0.04
-0.03
-0.03
-0.6 -0.4 -0.2 0
Proportion of Inconsistencies (100%)*
Duration (in Minutes)*
Denial/Misrepresentation (Staff Rating)*
Context Effect (Staff Report)
Proportion of MissingData (100%)
Atypicalness (Outfit in Logits)
Randomness (Infit in Logits)
<- Cohen's da
\a Cohen's d (Post Certification - Pre Certification)/Pooled STD* p<.05
Impact of Comprehensive Data Collection Protocol Certification on Measurement Issues
Source: GAIN coordinating center

-0.80
-0.60
-0.40
-0.20
0.00
0.20
0.40
0.60
0 10 20 30 40 50 60 70 80 90 100
Staff Experience
Goo
d <
--Z
-Sco
re -
-> B
ad
Inconsistencies
Missing
Randomness
Atypicalness
Duration
Denial/Misrep.
Major improvement over the first 15
interviews
Most improvements have occurred by 60
interviews
Source: GAIN coordinating center
Staff Experience Matters as well

Impact of the Number of Observations on Reliability Across Observations by Initial Reliability in a Wave
0.0
0.1
0.2
0.3
0.4
0.5
0.6
0.7
0.8
0.9
1.01 2 3 4 5 6 7 8 9 10 11 12 13 14 15 17 18
0.9
0.8
0.7
0.6
0.5
0.4
0.3
0.2
0.1
R in wave
Observations
Rel
iabi
lity
Acr
oss
OIb
serv
atio
ns
Two observations (e.g., pre & post test) more reliable than post only
The lower the reliability, the longer it takes to reach a point of
diminishing returns on more observations

Some examples of increasing reliability with multiple observations Baseline observation to separate individual differences Multiple observations to separate trajectories Multiple observations nested within a hierarchical structure
(e.g., patients within staff or site) Blood pressure, lung capacity, motivation, readiness to
change, attitudes or other things that tend to vary in a range (aka disturbance)
Redoing a urine or BAC test when unexpected reading or it is contested by participant
Redoing a positive HIV test for confirmation
Identify Cut Points Where a Question Like “Peak Use” Is Likely to Become Unreliable
Below Cut Point, r2=22,
Above Cut Point, r2=.050
10
20
30
40
0 10 20 30 40
Above Cut point
Below 20 JointCut Point
Linear (Below 20Joint Cut Point)
Linear (Above Cutpoint)
Peak Joints Reported at time 1 on GAIN
Peak Joints Reported at Time 2 on Form 90
Source: Dennis et al 2004
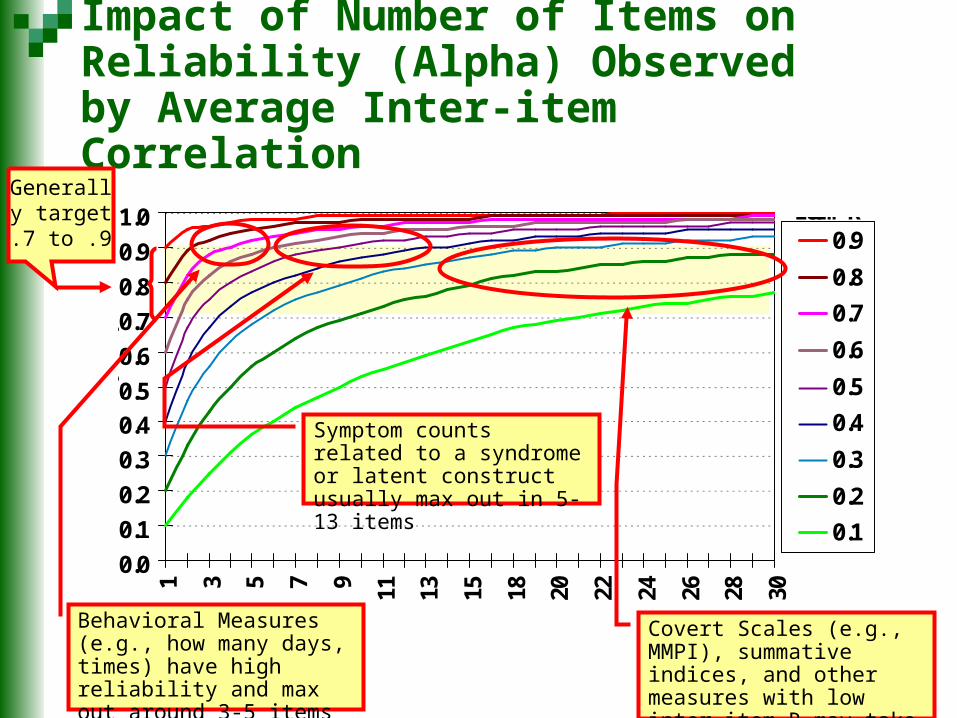
Impact of Number of Items on Reliability (Alpha) Observed by Average Inter-item Correlation
0.0
0.1
0.2
0.3
0.4
0.5
0.6
0.7
0.8
0.9
1.0
1 3 5 7 9 11 13 15 18 20 22 24 26 28 30
0.9
0.8
0.7
0.6
0.5
0.4
0.3
0.2
0.1
Avg Item R
Number of Items
Rei
labl
ity
(Alp
ha)
Generally target .7 to .9
Behavioral Measures (e.g., how many days, times) have high reliability and max out around 3-5 items
Covert Scales (e.g., MMPI), summative indices, and other measures with low inter item R may take 30 items (or more)
Symptom counts related to a syndrome or latent construct usually max out in 5-13 items
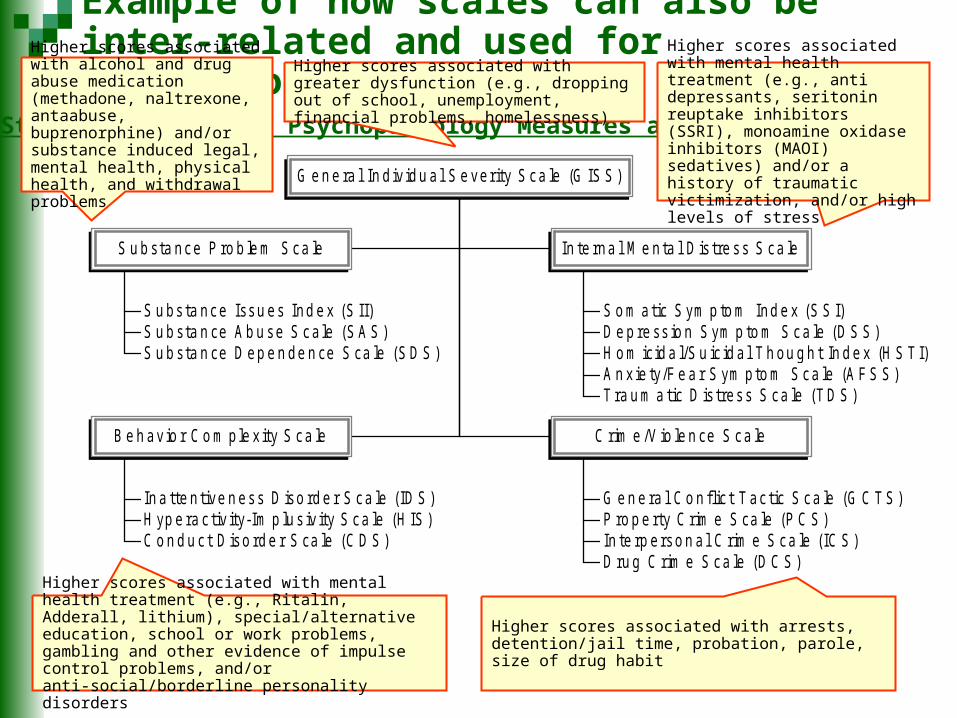
Structure of GAIN’s Psychopathology Measures and Validity Checks
Example of how scales can also be inter-related and used for validation
S u bs ta nce Issu es Ind e x (S II)S u b sta n ce A b u se S ca le (S A S )S u b sta n ce D ep e n de n ce S ca le (S D S )
S u b sta nce P ro b le m S ca le
S o m atic S ym p to m Ind e x (S S I)D e p re ss io n S ym p to m S ca le (D S S )H o m icid a l/S u ic id a l T h ou g h t In d e x (H S T I)A n x ie ty/F e a r S ym pto m S ca le (A F S S )T ra u m a tic D is tress S ca le (T D S )
In te rna l M e n ta l D is tre ss S ca le
In a tte n tive n ess D iso rd e r S ca le (ID S )H yp e ra c tiv ity-Im p lu s iv ity S ca le (H IS )C o n d u c t D is o rd e r S ca le (C D S )
B e h av io r C o m p le x ity S c a le
G e n e ra l C o n flic t T ac tic S ca le (G C T S )P ro p e rty C rim e S ca le (P C S )In te rp e rso n a l C rim e S ca le (IC S )D ru g C rim e S ca le (D C S )
C rim e /V io le n ce S ca le
G e n e ra l In d iv id u a l S e verity S ca le (G IS S )
Higher scores associated with alcohol and drug abuse medication (methadone, naltrexone, antaabuse, buprenorphine) and/or substance induced legal, mental health, physical health, and withdrawal problems
Higher scores associated with greater dysfunction (e.g., dropping out of school, unemployment, financial problems, homelessness)
Higher scores associated with mental health treatment (e.g., anti depressants, seritonin reuptake inhibitors (SSRI), monoamine oxidase inhibitors (MAOI) sedatives) and/or a history of traumatic victimization, and/or high levels of stress
Higher scores associated with mental health treatment (e.g., Ritalin, Adderall, lithium), special/alternative education, school or work problems, gambling and other evidence of impulse control problems, and/or anti-social/borderline personality disorders
Higher scores associated with arrests, detention/jail time, probation, parole, size of drug habit

Key Advantages of Creating Scalesand Indices for Clinical Research
One of the lowest cost ways to reduce measurement error and increase statistical power
Reduce clinical omissions and backtracking for validity checks
Increase conceptual robustness, interpretability and make it easier to explain to others
Facilitates profiling over a large number of items
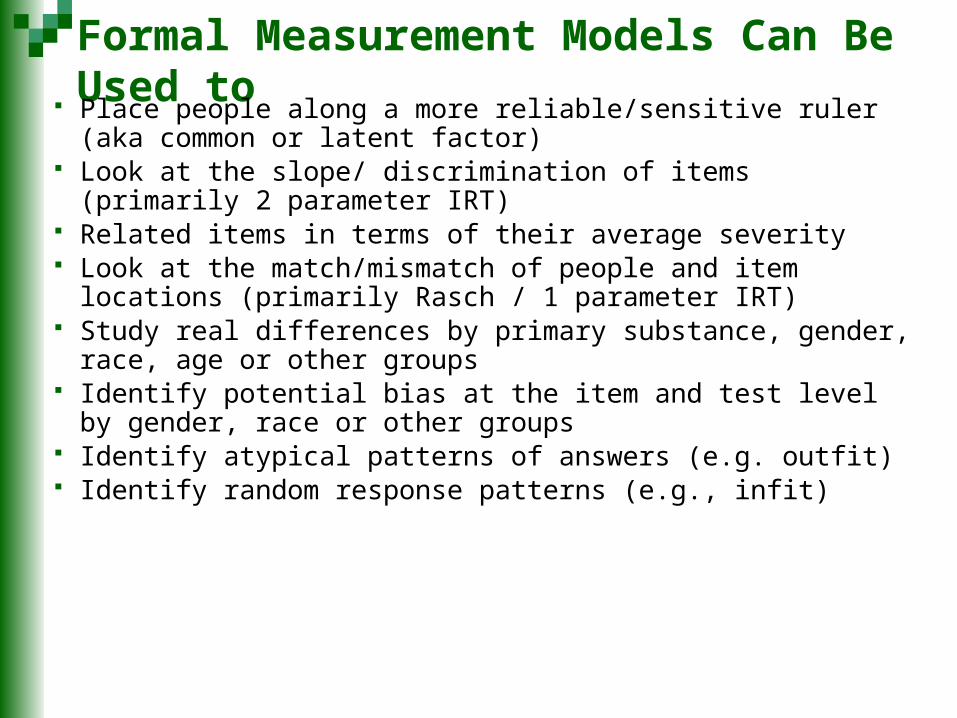
Formal Measurement Models Can Be Used to Place people along a more reliable/sensitive ruler (aka common or
latent factor) Look at the slope/ discrimination of items (primarily 2 parameter IRT) Related items in terms of their average severity Look at the match/mismatch of people and item locations (primarily
Rasch / 1 parameter IRT) Study real differences by primary substance, gender, race, age or other
groups Identify potential bias at the item and test level by gender, race or
other groups Identify atypical patterns of answers (e.g. outfit) Identify random response patterns (e.g., infit)

Note you can also create a summary measures across different sources of data
Source: Lennox et al 2006 (CFI=.98)

Impact of Item Discrimination (aka steepness of slope) on Sample Size Requirements
0100200300400500600700800900
1000
0.5 1.0 1.5 2.0 2.5
n pe
r gr
oup
for
80%
pow
er
d=.2 (50 items)
d=.4 (10 items)
d=.8 (10 items)
True Effect Size(number of items)
Flat<-Average Item Discrmination/slope -> Steep IRT focuses on
better use of items with low / range of
discrimination
Rasch focuses on finding high discrimination items so that differences
between items can be ignored
16-36% reduction in sample
size

Why Use Rasch and IRT?
Raw, Rasch and IRT scales generally correlated over .95 and vary by less than 5% in sample size requirements
The big advantage of going to Rasch and IRT are that they can be used to:- reduce scale length (aka cost) through computer adaptive
interviewing (as just described by Dr. Riley)- explore and test assumptions about how items are related to each
other- explore and test assumptions how items/ scales vary by subgroups- identify people with atypical presentations- identify people who appear to be responding randomly

Example: Evaluating the Substance Use Disorders (SUD) Concept
Much of our conceptual basis of addiction comes from Jellnick’s 1960 “disease” model of adult alcoholism
Edwards & Gross (1976) codified this into a set of bio-psycho-social symptoms related to a “dependence” syndrome
In practice, they are typically complemented by a set of separate “abuse” symptoms that represent other key reasons why people enter treatment
DSM 3, 3R, 4, 4TR, ICD 8, 9, & 10, and ASAM’s PPC1 and PPC2 all focus on this syndrome
Note that these symptoms are only correlated about .4 to .6 with “use” (e.g., ASI, SFS) or “problem” scales (e.g., MAST, DAST, CAGE) more commonly used in treatment research

DSM (GAIN) Symptoms of Dependence (3+ Symptoms)
Physiologicaln. Tolerance (you needed more alcohol or drugs to get high or found that the
same amount did not get you as high as it used to?)p. Withdrawal (you had withdrawal problems from alcohol or drugs like
shaking hands, throwing up, having trouble sitting still or sleeping, or that you used any alcohol or drugs to stop being sick or avoid withdrawal problems?)
Non-physiologicalq. Loss of Control (you used alcohol or drugs in larger amounts, more often or
for a longer time than you meant to?) r. Unable to Stop (you were unable to cut down or stop using alcohol or drugs?) s. Time Consuming (you spent a lot of your time either getting alcohol or drugs,
using alcohol or drugs, or feeling the effects of alcohol or drugs?)t. Reduced Activities (your use of alcohol or drugs caused you to give up,
reduce or have problems at important activities at work, school, home or social events?)
u. Continued Use Despite Personal Problems (you kept using alcohol or drugs even after you knew it was causing or adding to medical, psychological or emotional problems you were having?)

DSM (GAIN) Symptoms of Abuse (1+ symptoms)
h. Role Failure (you kept using alcohol or drugs even though you knew it was keeping you from meeting your responsibilities at work, school, or home?)
j. Hazardous Use (you used alcohol or drugs where it made the situation unsafe or dangerous for you, such as when you were driving a car, using a machine, or where you might have been forced into sex or hurt?)
k. Legal problems (your alcohol or drug use caused you to have repeated problems with the law?)
m.Continued Use after Legal/Social Problems (you kept using alcohol or drugs even after you knew it could get you into fights or other kinds of legal trouble?)

On-Going Debates About SUD Concept
• Formal assumption that symptoms of “physiological dependence” (either tolerance or withdrawal) are markers of high severity
• Debate about whether “abuse” symptoms should be dropped, thought of as early dependence, or thought of as moderate/high severity markers that warrant treatment even in the absence of a full syndrome
• Debate about whether to treat diagnostic orphans (1-2 symptoms of dependence) as abuse or continue to ignore them
• Concern about whether the current symptoms (which were based primarily on adult data) are appropriate for use with adolescents
• Concern about the sensitivity to change

Conrad et al 2007 Data Source and Methods
Data from 2474 Adolescents, 344 Young Adults and 661 Adults interviewed between 1998 and 2005 with the Global Appraisal of Individual Needs (GAIN; Dennis et al 2003)
Participants recruited at intake to Early Intervention, Outpatient, Intensive Outpatient, Short, Moderate & Long term Residential, Corrections Based and Post Residential Outpatient Continuing Care as part of 72 local evaluations around the U.S. and pooled into a common data set
Analysis here focuses on the GAIN Substance Use Disorder Scale (SUDS) with symptoms of dependence and abuse overall and by substance. The rating scale is 3=past month, 2=past 2-12 months, 1=more than a year ago and 0=never.
Analyses done with a combination of Winsteps and Facets

The GAIN’s Substance Problem Scale (SPS)
DSM-IV Clinical Diagnosis categories and courser specifiers (Kappa of .5 to .7)
Epidemiological Lifetime, Past Year and/or Past Month Diagnosis categories (Kappa of .5 to .7)
Dimensional Symptom counts for lifetime, past year and/or past month with internal consistencies of .8 to .9 (test retest of .7 to .9)

Sample Characteristics
Adolescents: <18 (n=2474)
Young Adult: 18-25
(n=344)
Adults: 26+
(n=661)
Male 74% 58% 47%
Caucasian 48% 54% 29%
African American 18% 27% 63%
Hispanic 12% 7% 2%
Average Age 15.6 20.2 37.3
Substance Disorder 85% 82% 90%
Internal Disorder 53% 62% 67%
External Disorder 63% 45% 37%
Crime/Violence 64% 51% 34%
Residential Tx 31% 56% 74%
Current CJ/JJ invol. 69% 74% 45%
Note: all significant, p < .01

Item Relationships Across SubstancesR
asch
Sev
erit
y M
easu
re
Des
p.P
H/M
H (
+0.
10)
Giv
e u
p a
ct. (
+0.
05)
Can
't s
top
(+
0.05
)
Tim
e C
on
s. (
-0.2
1)
Lo
ss o
f C
on
tro
(-0
.10)
Haz
ard
ou
s (-
0.03
)
Des
pit
e L
egal
(+
0.10
)
Ro
le F
ailu
re (
-0.1
2)
Fig
hts
/tro
ub
. (0.
17)
-0.60
-0.40
-0.20
0.00
0.20
0.40
0.60
0.80Tim
e Con
s
Role F
ailur
e
Fights/
troub
.
Loss
of C
ontro
l
Hazar
dous
Tolera
nce
Can't s
top
Give u
p ac
t.
Desp.
PH/MH
Despit
e Le
gal
With
draw
al
To
lera
nce
(0.
00)
Wit
hd
raw
al (
+0.
34)
Physiological Sx:While Withdrawal is
High severity, Tolerance is only
Moderate
Dependence Sx: Other dependence Symptoms
spread over continuum
Abuse Sx: Abuse Symptoms are also
spread over continuum
1st dimension explains 75% of variance (2nd explains 1.2%)Average Item Severity (0.00)

Symptom Severity Varied by Drug
Easier to endorse
hazardous use for
ALC/CAN
Ras
ch S
ever
ity
Mea
sure
ALC
ALC
ALC
ALCALC
ALC
ALC
AMP
AMP
AMPAMP
AMP
AMP
CAN
CAN
CAN
CAN
COC COC
COC
OPI
OPIOPI
OPI
OPI
ALC
ALC ALC
ALC
AMP
AMP
AMP
AMP
AMP
CAN
CAN
CAN
CAN
CAN
CAN
CAN
COC
COCCOC
COC
COC
COCCOC
COC
OPI
OPI OPIOPI
OPI
OPI
-0.60
-0.40
-0.20
0.00
0.20
0.40
0.60
0.80Tim
e Con
s.
Role F
ailur
e
Fights/
troub
.
Loss
of C
ontro
l
Hazar
dous
Tolera
nce
Can't s
top
Give u
p ac
t.
Desp.
PH/MH
Despit
e Le
gal
With
draw
al
AVG (0.00)
ALC (-0.44)
AMP (+0.89)
CAN (-0.67)
COC (-0.22)
OPI (+0.44)
Easier to endorse fighting/ trouble for ALC/CAN
Easier to endorse time consuming for CAN
Easier to endorse
moderate Sx for
COC/OPI
Easier to endorse
despite legal problem for ALC/CAN
Easier to endorse
Withdrawal for
AMP/OPI
Withdrawal much less likely for CAN

Symptom Severity Varied Even More By AgeR
asch
Sev
erit
y M
easu
re
<18 <18
<18
<18
<18
18-25
18-25
18-25
18-25
18-25
18-25
26+
26+
26+
26+
26+
26+
26+
26+
26+
26+
26+<18<18
<18
<18
<18
<18
18-25
18-25
18-25
18-25
18-25
-1
-0.8
-0.6
-0.4
-0.2
0
0.2
0.4
0.6
0.8
1
1.2
1.4
1.6
1.8Tim
e Con
s.
Role F
ailur
e
Fights/
troub
.
Loss
of C
ontro
l
Hazar
dous
Tolera
nce
Can't s
top
Give u
p ac
t.
Desp.
PH/MH
Despit
e Le
gal
With
draw
al
<18
18-25
26+
Age
Adults more likely to endorse most symptomsMore likely to lead to
fights among Adol/YAHazardous use more
likely among Adol/YA
Continued use in spite of legal problems more likely among Adol/YA

Comparing Substances
Amp 0.88
Opi 0.43
Coc -0.21
Alc -0.44
Can -0.66
-1.2-1.0-0.8-0.6-0.4-0.20.00.20.40.60.81.01.21.41.6
TimeG
et
Respo
n
Troub
le
Longe
r
Unsafe
Mor
eAOD
Cutdow
n
GivupA
cs
Med
prob
s
Law With
draw
l
Avg.S
x. Sev
.

Rasch Severity by Past Month Status
-3.50
-3.00
-2.50
-2.00
-1.50
-1.00
-0.50
0.00
0.50
1.00
1.50
2.00
None DiagnosticOrphan in early
remission
DiagnosticOrphan
Lifetime SUD
in early remission
LifetimeSUD in CE
45+ days
Abuse Only
DependenceOnly
BothAbuse
and Dependence
Ras
ch S
ever
ity
Mea
sure
Diagnostic Orphans (1-2 dependence symptoms)
are lower, but still overlap with other clinical groups

Severity by Past Year Symptom Count
-4.00-3.50-3.00-2.50-2.00-1.50-1.00-0.500.000.501.001.502.00
0 1 2 3 4 5 6 7 8 9 10 11
Ras
ch S
ever
ity
Mea
sure
1. Better Gradation2. Still a lot of overlap in range
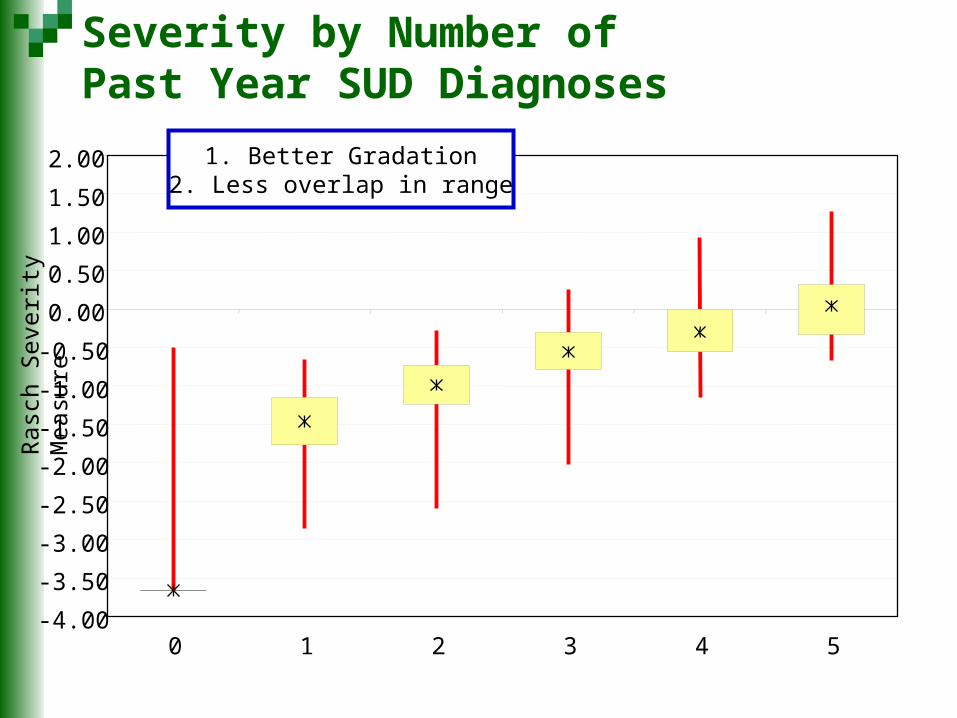
Severity by Number of Past Year SUD Diagnoses
Ras
ch S
ever
ity
Mea
sure
-4.00
-3.50
-3.00
-2.50
-2.00
-1.50
-1.00
-0.50
0.00
0.50
1.00
1.50
2.00
0 1 2 3 4 5
1. Better Gradation2. Less overlap in range

Severity by Weighted (past month=2, past year=1)
Number of Substance x SUD Symptoms
Ras
ch S
ever
ity
Mea
sure
-4.00-3.50-3.00-2.50-2.00-1.50-1.00-0.500.000.501.001.502.00
0 1-4 5-8 9-12 13-16 17-20 21-24 25-30 31-40 41+
1. Better Gradation2. Much less overlap in range

Average Severity by Age
-4.00
-3.50
-3.00
-2.50
-2.00
-1.50
-1.00
-0.50
0.00
0.50
1.00
1.50
2.00
Adolescent (<18) Young Adult (18-25) Adult (26+)
1. Average goes up with age2. Complete overlap in range3. Narrowing of distribution on higher severity at older ages

Construct Validity (i.e., does it matter?)
Fre
que
ncy
Of U
se
Pa
st W
eek
With
dra
wal
Em
otio
na
l P
robl
em
s
Re
cove
ry
En
viro
nmen
t
So
cia
l Ris
k
DSM diagnosis \a 0.47 0.40 0.32 0.30 0.30
Symptom Count Continuous \b 0.48 0.43 0.39 0.32 0.31
Weighted Drug x Symptom \c,d 0.26 0.27 0.19 0.29 0.09
\a Categorized as Past year physiology dependence, non-physiological dependence, abuse, other\b Raw past year symptom count (0-11)\c Symptoms weighted by recency (2=past month, 1=2-12 months ago, 0=other)\d Symptoms by drug (alcohol, amphetamine, cannabis, cocaine, opioids)
Past year Symptomcount didbetter than
DSM
Weighted Symptom Rasch \c 0.57 0.46 0.39 0.39 0.32
Rasch does
a little Betterstill
Weighted symptom by drug count severity did
WORSE

Implications for SUD Concept “Tolerance” is not a good marker of high severity; withdrawal (and
substance induced health problems are) “Abuse” symptoms are consistent with the overall syndrome and represent
moderate severity or “other reasons to treat in the absence of the full blown syndrome”
Diagnostic orphans are lower severity, but relevant Pattern of symptoms varies by substance and age, but all symptoms are
relevant “Adolescents” experienced the same range of symptoms, though they (and
young adults) were particularly more likely to be involved with the law, use in hazardous situations, and to get into fights at lower severity
Symptom Counts appear to be more useful than the current DSM approach to categorizing severity
While weighting by recency & drug delineated severity, it did not improve construct validity