Pra Manual
56
Participatory Rural Appraisal (PRA) Manual
-
Upload
0105496038 -
Category
Documents
-
view
81 -
download
2
Transcript of Pra Manual
Participatory Rural Appraisal
(PRA) Manual

FOOD AND
AGRICULTURE
ORGANISATION OF
THE UNITED NATIONS
GCP/RLA/167/ECSFA 2006 ST. LUCIA
PARTICIPATORY RURAL APPRAISAL (PRA) MANUAL
prepared by Rufina PaulNational Consultant Rural
Sociologist/Extensionist
PROJECT TITLE:* Assistance to improve agricultural
production and productivity by promoting technology adaptation

IV PARTICIPATORY RURAL APPRAISAL MANUAL
VPARTICIPATORY RURAL APPRAISAL MANUAL
Table of Contents
PREFACE . . . . . . . . . . . . . . . . . . . . . . . . . . . . . . . . . . . . . . . . . . . . . 1WHY PRA? . . . . . . . . . . . . . . . . . . . . . . . . . . . . . . . . . . . . . . . . . . . . 2PRINCIPLES OF PRA . . . . . . . . . . . . . . . . . . . . . . . . . . . . . . . . . . . . . . 3ANTICIPATED OUTPUTS OF PRA PROCESS . . . . . . . . . . . . . . . . . . . . . . . . . 4DEFINING KEY AREAS FOR INVESTIGATION . . . . . . . . . . . . . . . . . . . . . . . . . 5CONSIDERATIONS IN DEVELOPING THE PRA METHODOLOGY . . . . . . . . . . . . . . 6PRA TOOLS . . . . . . . . . . . . . . . . . . . . . . . . . . . . . . . . . . . . . . . . . . . . 8 1. Brainstorming . . . . . . . . . . . . . . . . . . . . . . . . . . . . . . . . . . . . . . 9 2. Focus Group . . . . . . . . . . . . . . . . . . . . . . . . . . . . . . . . . . . . . . . 9 3. Priority Grid . . . . . . . . . . . . . . . . . . . . . . . . . . . . . . . . . . . . . . . 10 4. Transects / Maps . . . . . . . . . . . . . . . . . . . . . . . . . . . . . . . . . . . . 12 5. Resource Mapping . . . . . . . . . . . . . . . . . . . . . . . . . . . . . . . . . . . 13 6. Crop Calendar . . . . . . . . . . . . . . . . . . . . . . . . . . . . . . . . . . . . . 15 7. Constraints Analysis . . . . . . . . . . . . . . . . . . . . . . . . . . . . . . . . . . 17 8. Opportunity Matrix . . . . . . . . . . . . . . . . . . . . . . . . . . . . . . . . . . . 19 9. Stakeholder Analysis . . . . . . . . . . . . . . . . . . . . . . . . . . . . . . . . . . 20 10. Venn Diagrams . . . . . . . . . . . . . . . . . . . . . . . . . . . . . . . . . . . . . 21 11. Gender Analysis . . . . . . . . . . . . . . . . . . . . . . . . . . . . . . . . . . . . 21 12. Time Budget Analysis . . . . . . . . . . . . . . . . . . . . . . . . . . . . . . . . . . 22 13. Analysis of the Relations of Production . . . . . . . . . . . . . . . . . . . . . . . . 23 14. Genderised Logical Framework (Logframe) . . . . . . . . . . . . . . . . . . . . . . 24 15. Trend Analysis . . . . . . . . . . . . . . . . . . . . . . . . . . . . . . . . . . . . . 25 16. Role Play . . . . . . . . . . . . . . . . . . . . . . . . . . . . . . . . . . . . . . . . 26 17. Case Studies . . . . . . . . . . . . . . . . . . . . . . . . . . . . . . . . . . . . . . 27 18. Resource Flow . . . . . . . . . . . . . . . . . . . . . . . . . . . . . . . . . . . . . 28 19. Wealth Ranking . . . . . . . . . . . . . . . . . . . . . . . . . . . . . . . . . . . . . 29 20. Crop Budgeting . . . . . . . . . . . . . . . . . . . . . . . . . . . . . . . . . . . . . 30 CONCLUSION . . . . . . . . . . . . . . . . . . . . . . . . . . . . . . . . . . . . . . . . . 32REFERENCES . . . . . . . . . . . . . . . . . . . . . . . . . . . . . . . . . . . . . . . . . 33APPENDICES . . . . . . . . . . . . . . . . . . . . . . . . . . . . . . . . . . . . . . . . . . 34APPENDIX 01 . . . . . . . . . . . . . . . . . . . . . . . . . . . . . . . . . . . . . . . . . . 35APPENDIX 02 . . . . . . . . . . . . . . . . . . . . . . . . . . . . . . . . . . . . . . . . . . 37APPENDIX 03 . . . . . . . . . . . . . . . . . . . . . . . . . . . . . . . . . . . . . . . . . . 39APPENDIX 03 . . . . . . . . . . . . . . . . . . . . . . . . . . . . . . . . . . . . . . . . . . 41APPENDIX 03 . . . . . . . . . . . . . . . . . . . . . . . . . . . . . . . . . . . . . . . . . . 43APPENDIX 04 . . . . . . . . . . . . . . . . . . . . . . . . . . . . . . . . . . . . . . . . . . 45APPENDIX 05 . . . . . . . . . . . . . . . . . . . . . . . . . . . . . . . . . . . . . . . . . . 46
1 PARTICIPATORY RURAL APPRAISAL MANUAL
Preface
According to St. Lucia’s National Agricultural Policy, the Government’s core strategies to promote growth and socio-economic development
involve the fostering of a commercialized and agri-entrepreneurial approach to farming. Towards this end, Government will pursue, among other policy measures, the strengthening of the agricultural research system and technology adoption, to ensure that policy and strategies are more responsive to farmers’ needs.
Adoption of technologies is heavily influenced by the perceptions, knowledge, creativity and competence of farmers. Gender issues are also important factors that need to be considered. In effect, socio-cultural factors like these greatly influence decision-making, choices, actions and outcomes in the sector.
The FAO project which is geared towards: Assistance to improve agricultural production and productivity by promoting technology adaptation, duly recognizes the prevalence of less than adequate management of the land resource base, the presence of “diseased” soils, unsanitary farm conditions and consequent low agricultural productivity levels. Plant nutrition and plant health are indispensible to the process of realizing optimal productivity at the level of the farm household’s cropping subsystems and also to the overall farming system of which they
are a part. Historically, technology validation and transfer methodologies were mainly focused on the adoption of new techniques and practices. Little attention was paid to the constraints faced by farmers and their households or to the inherent mitigating factors within either the policy, bio-physical or socio-economic environment.
This manual takes account of the experience of the Participatory Rural Appraisal (PRA) exercise conducted by FAO in collaboration with the Extension Division within the Ministry of Agriculture, Lands, Fisheries and Forestry in St. Lucia in June 2009. The objective of this undertaking was to diagnose the constraints and opportunities related to the adoption of integrated soil management, plant nutrition and plant health systems. It therefore engaged key stakeholders in the assessment of resource endowments and availability and the intensity of production and productivity of selected farm models.
The training approach and materials in this manual records the methodologies to be employed in determining the situation, needs, constraints, motivation and opportunities for farmers and their households. This manual also presents the PRA “tools” that, if adopted, can greatly assist in identifying deep-seated problems, as well as opportunities which impact on the pace of technology adaptation and transfer within the agricultural sector of St. Lucia.
2PARTICIPATORY RURAL APPRAISAL MANUAL
WHY PRA?
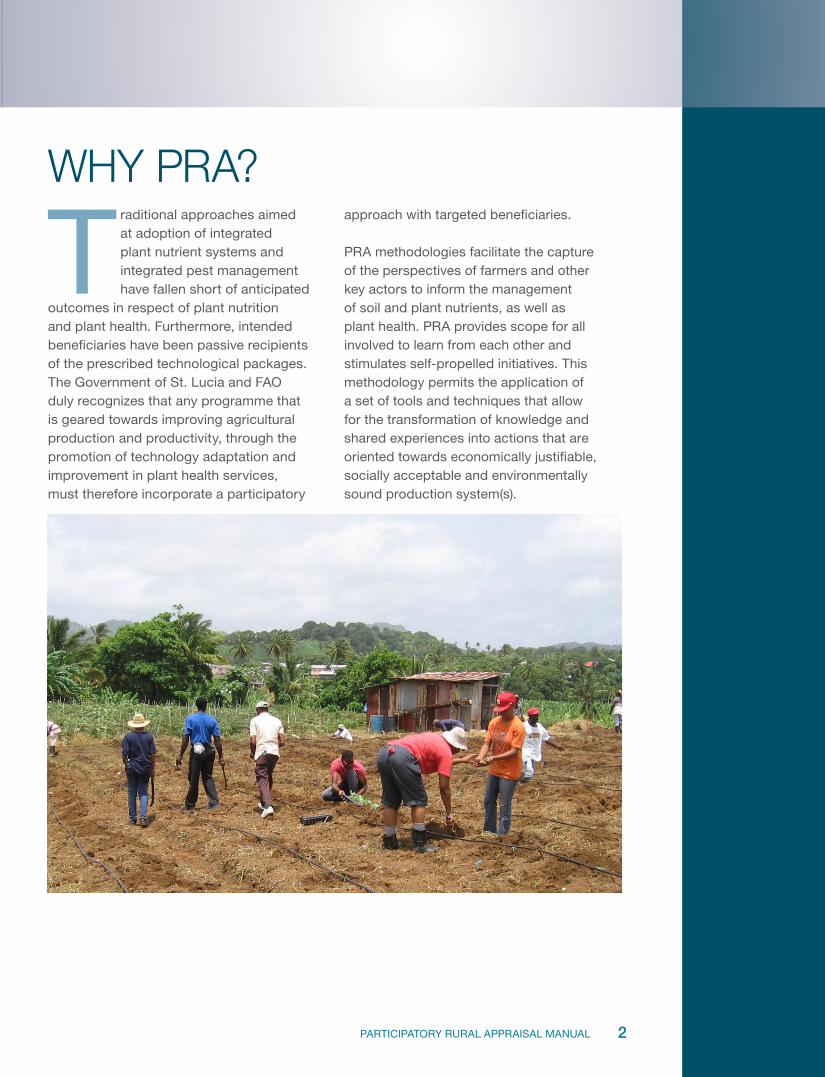
Traditional approaches aimed at adoption of integrated plant nutrient systems and integrated pest management have fallen short of anticipated
outcomes in respect of plant nutrition and plant health. Furthermore, intended beneficiaries have been passive recipients of the prescribed technological packages. The Government of St. Lucia and FAO duly recognizes that any programme that is geared towards improving agricultural production and productivity, through the promotion of technology adaptation and improvement in plant health services, must therefore incorporate a participatory
approach with targeted beneficiaries.
PRA methodologies facilitate the capture of the perspectives of farmers and other key actors to inform the management of soil and plant nutrients, as well as plant health. PRA provides scope for all involved to learn from each other and stimulates self-propelled initiatives. This methodology permits the application of a set of tools and techniques that allow for the transformation of knowledge and shared experiences into actions that are oriented towards economically justifiable, socially acceptable and environmentally sound production system(s).
3 PARTICIPATORY RURAL APPRAISAL MANUAL
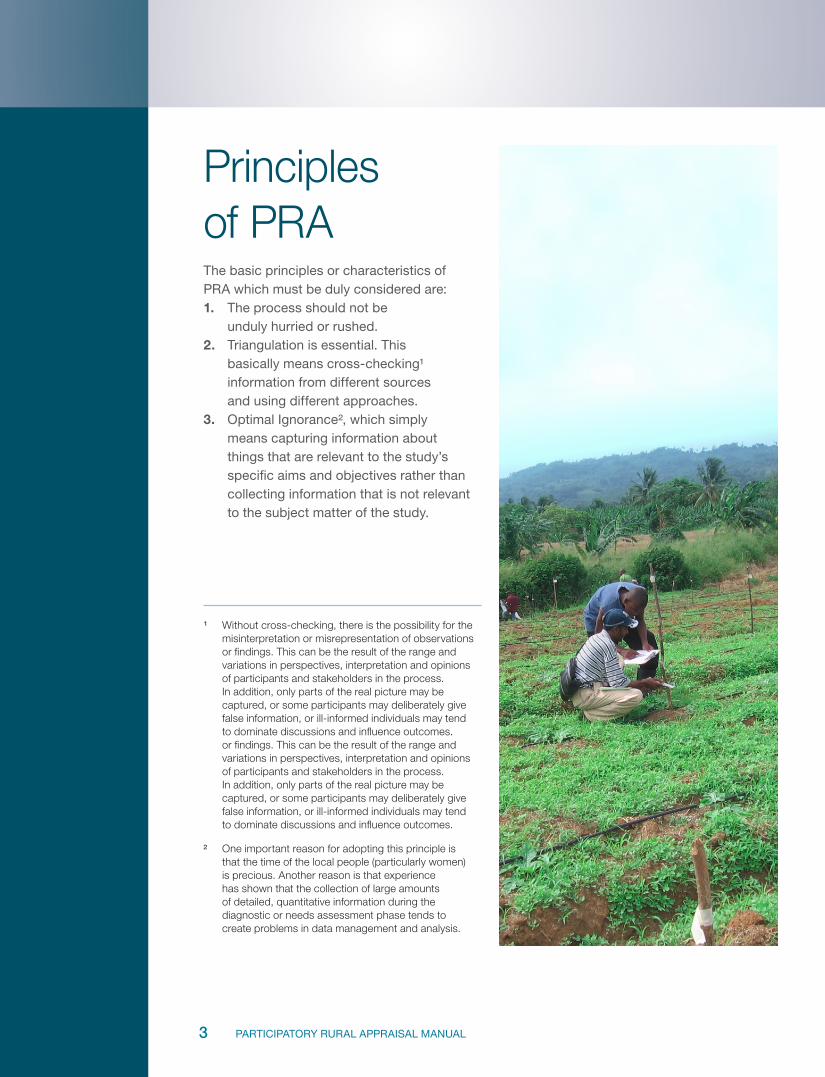
Principles of PRA The basic principles or characteristics of PRA which must be duly considered are:1 . The process should not be
unduly hurried or rushed.2 . Triangulation is essential. This
basically means cross-checking1 information from different sources and using different approaches.
3 . Optimal Ignorance2, which simply means capturing information about things that are relevant to the study’s specific aims and objectives rather than collecting information that is not relevant to the subject matter of the study.
1 Without cross-checking, there is the possibility for the misinterpretation or misrepresentation of observations or findings. This can be the result of the range and variations in perspectives, interpretation and opinions of participants and stakeholders in the process. In addition, only parts of the real picture may be captured, or some participants may deliberately give false information, or ill-informed individuals may tend to dominate discussions and influence outcomes. or findings. This can be the result of the range and variations in perspectives, interpretation and opinions of participants and stakeholders in the process. In addition, only parts of the real picture may be captured, or some participants may deliberately give false information, or ill-informed individuals may tend to dominate discussions and influence outcomes.
2 One important reason for adopting this principle is that the time of the local people (particularly women) is precious. Another reason is that experience has shown that the collection of large amounts of detailed, quantitative information during the diagnostic or needs assessment phase tends to create problems in data management and analysis.
4PARTICIPATORY RURAL APPRAISAL MANUAL
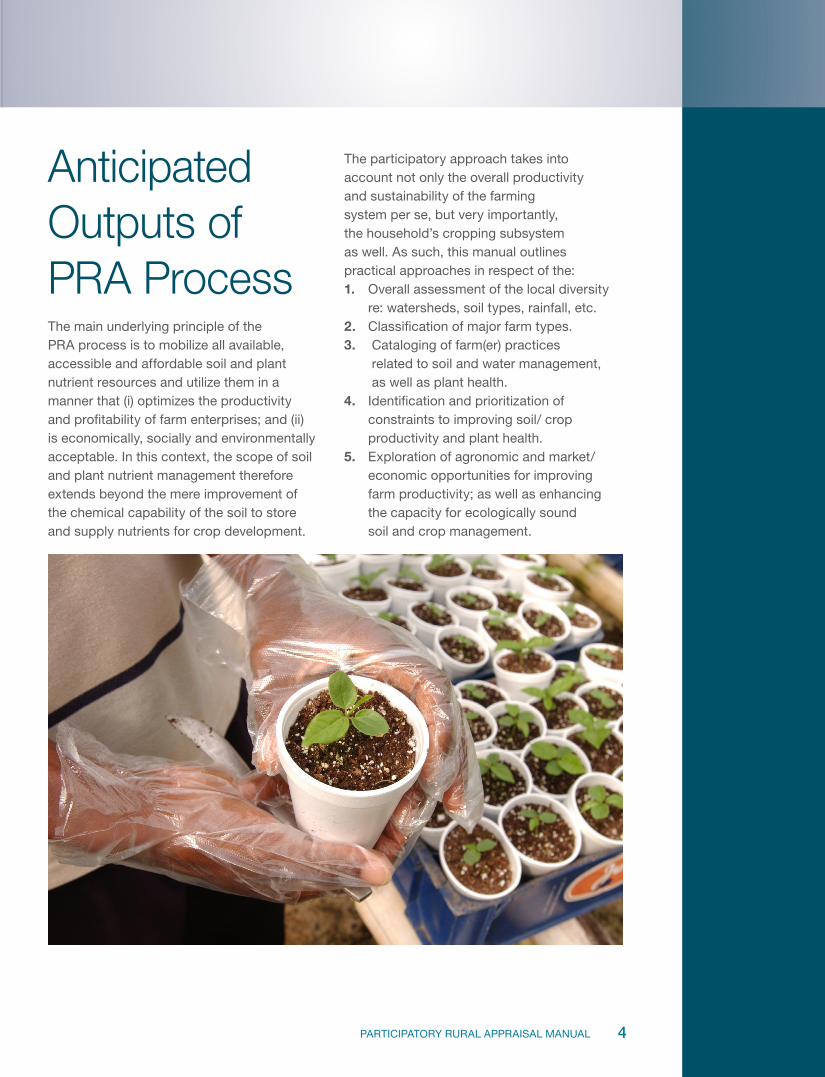
Anticipated Outputs of PRA ProcessThe main underlying principle of the PRA process is to mobilize all available, accessible and affordable soil and plant nutrient resources and utilize them in a manner that (i) optimizes the productivity and profitability of farm enterprises; and (ii) is economically, socially and environmentally acceptable. In this context, the scope of soil and plant nutrient management therefore extends beyond the mere improvement of the chemical capability of the soil to store and supply nutrients for crop development.
The participatory approach takes into account not only the overall productivity and sustainability of the farming system per se, but very importantly, the household’s cropping subsystem as well. As such, this manual outlines practical approaches in respect of the:1 . Overall assessment of the local diversity
re: watersheds, soil types, rainfall, etc.2 . Classification of major farm types.3 . Cataloging of farm(er) practices
related to soil and water management, as well as plant health.
4 . Identification and prioritization of constraints to improving soil/ crop productivity and plant health.
5 . Exploration of agronomic and market/economic opportunities for improving farm productivity; as well as enhancing the capacity for ecologically sound soil and crop management.
5 PARTICIPATORY RURAL APPRAISAL MANUAL
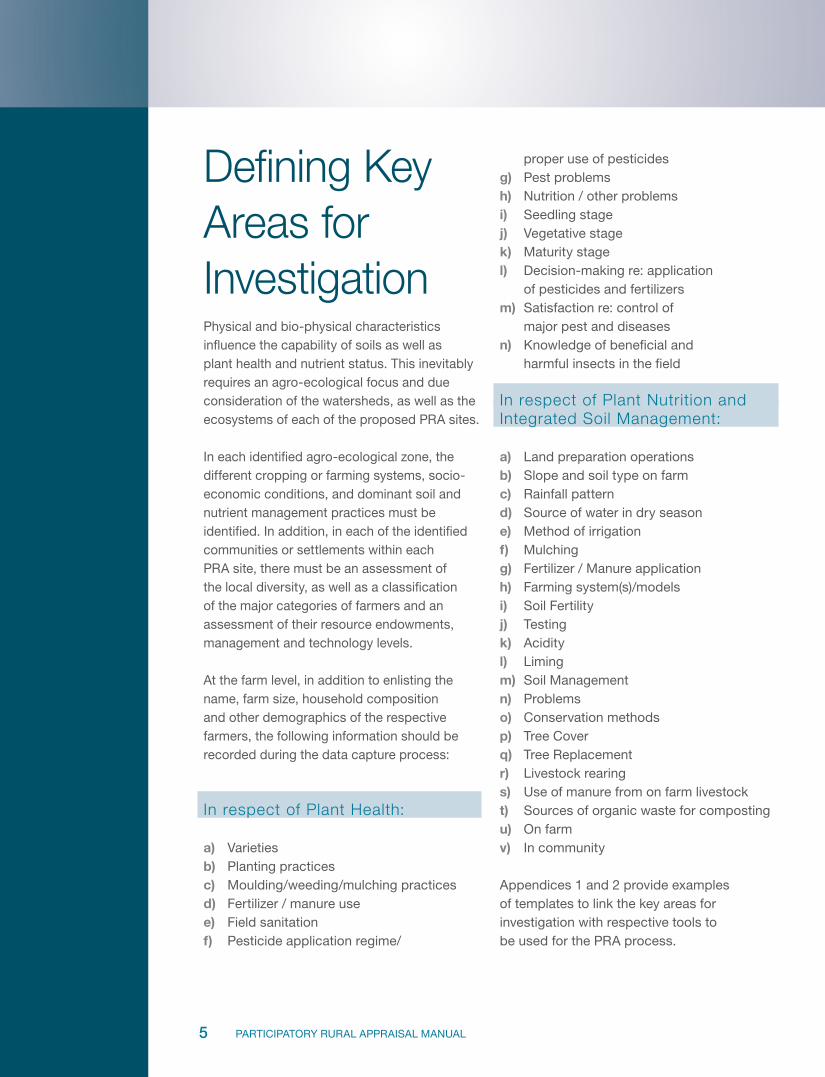
Defining Key Areas for InvestigationPhysical and bio-physical characteristics influence the capability of soils as well as plant health and nutrient status. This inevitably requires an agro-ecological focus and due consideration of the watersheds, as well as the ecosystems of each of the proposed PRA sites.
In each identified agro-ecological zone, the different cropping or farming systems, socio-economic conditions, and dominant soil and nutrient management practices must be identified. In addition, in each of the identified communities or settlements within each PRA site, there must be an assessment of the local diversity, as well as a classification of the major categories of farmers and an assessment of their resource endowments, management and technology levels.
At the farm level, in addition to enlisting the name, farm size, household composition and other demographics of the respective farmers, the following information should be recorded during the data capture process:
In respect of Plant Health:
a) Varietiesb) Planting practices c) Moulding/weeding/mulching practicesd) Fertilizer / manure usee) Field sanitationf) Pesticide application regime/
proper use of pesticidesg) Pest problemsh) Nutrition / other problemsi) Seedling stagej) Vegetative stagek) Maturity stagel) Decision-making re: application
of pesticides and fertilizers m) Satisfaction re: control of
major pest and diseasesn) Knowledge of beneficial and
harmful insects in the field
In respect of Plant Nutrition and Integrated Soil Management:
a) Land preparation operationsb) Slope and soil type on farm c) Rainfall patternd) Source of water in dry seasone) Method of irrigation f) Mulchingg) Fertilizer / Manure applicationh) Farming system(s)/modelsi) Soil Fertilityj) Testingk) Acidityl) Limingm) Soil Management n) Problemso) Conservation methodsp) Tree Coverq) Tree Replacementr) Livestock rearings) Use of manure from on farm livestockt) Sources of organic waste for compostingu) On farmv) In community
Appendices 1 and 2 provide examples of templates to link the key areas for investigation with respective tools to be used for the PRA process.
6PARTICIPATORY RURAL APPRAISAL MANUAL
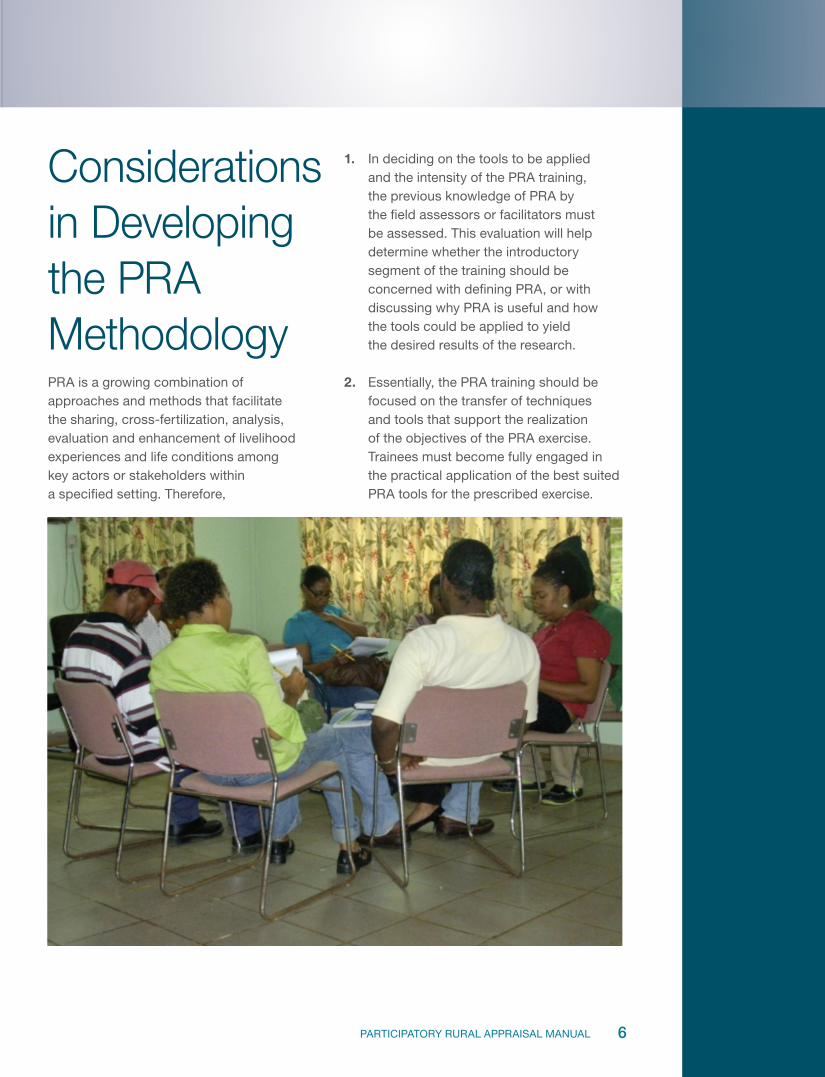
Considerations in Developing the PRA MethodologyPRA is a growing combination of approaches and methods that facilitate the sharing, cross-fertilization, analysis, evaluation and enhancement of livelihood experiences and life conditions among key actors or stakeholders within a specified setting. Therefore,
1 . In deciding on the tools to be applied and the intensity of the PRA training, the previous knowledge of PRA by the field assessors or facilitators must be assessed. This evaluation will help determine whether the introductory segment of the training should be concerned with defining PRA, or with discussing why PRA is useful and how the tools could be applied to yield the desired results of the research.
2 . Essentially, the PRA training should be focused on the transfer of techniques and tools that support the realization of the objectives of the PRA exercise. Trainees must become fully engaged in the practical application of the best suited PRA tools for the prescribed exercise.
7 PARTICIPATORY RURAL APPRAISAL MANUAL
However, PRA is more than a collection of techniques. It is a general approach, the effectiveness of which depends heavily on the attitude of practitioners. It will only work well if practitioners listen to and respect the views of the people who live the particular circumstance(s) being studied.
3 . The PRA team must be facilitators of a process wherein participants are catalysed to become subjects rather than objects of the process. Therefore, facilitators of the PRA process need to:• Accept that there is no monopoly
of wisdom and knowledge.• Listen to farmers and respect their
knowledge, experiences, opinions and perceptions, as well be tolerant of their attitudes and customs.
• Create the ambience conducive to gaining the trust of the farmers and their willingness to share their knowledge and experiences.
• Be flexible in the scheduling of PRA activities and provide opportunities for problem-solving and learning, in response to the felt needs of farmers and their respective households and communities.
4 . PRA enables participants to take part in presenting their own information, drawing their own conclusions and offering their own analyses and solutions. In the final analysis, PRA facilitators should become redundant and the participants and their constituents empowered to manage the change process effectively.
5 . When defining an appropriate PRA tool kit, each PRA team should determine the tools appropriate for use in their respective site(s) or situations; having taken full consideration of the time, human, technological and other resources
accessible. Visual techniques are part of the suite of techniques used in PRA.
6 . The PRA team(s) must ensure the following in order to guarantee the successful implementation of the PRA exercise, namely:• Effective Communication
Proper training of participants• Adequate transportation • Participant commitment
and co-operation • Time management • Group effort / Team work• Proper selection / sampling • Clear objectives • Proper planning • Well defined outputs / key
areas for investigation.
7 . The research area should represent a particular agro-ecological zone or production system and must take account of the farming community’s interest and commitment to this process.
8 . Having determined the set of variables to be investigated, a major challenge is deciding which participatory methodologies and techniques would facilitate the capture of the minimum set of data and information required. In this regard, there is the need for due diligence in determining the approach to the training and the set of tools that are best suited for the prescribed investigations. • Appendix 3 presents a sample matrix
for the scheduling of a PRA process in accordance with key areas for investigation. Each PRA team must schedule their respective activities and ensure compliance with the overall framework for the implementation of the PRA exercise, in order to guarantee achievement of the required outputs.
8PARTICIPATORY RURAL APPRAISAL MANUAL
PRA ToolsThe following PRA tools are applicable to the process of capturing information relating to the key areas for investigation with regard to plant health, nutrition and soil management:
1 . Brainstorming
2 . Focus Groups
3 . Priority Grid
4 . Transects/ Maps
5 . Resource Mapping
6 . Crop Calendar
7 . Constraints Analysis
8 . Opportunity Matrix
9 . Stakeholder Analysis
10 . Venn Diagram
11 . Gender Analysis
12 . Time Budgeting
13 . Access and Control Profiles / Analysis
of the Relations of (Re)production
14 . Genderised Logical Frame (Logframe)
15 . Trend Analysis
16 . Role Play
17 . Case Studies
18 . Resource Flows
19 . Wealth Ranking
8PARTICIPATORY RURAL APPRAISAL MANUAL
9 PARTICIPATORY RURAL APPRAISAL MANUAL
1. Brainstorming
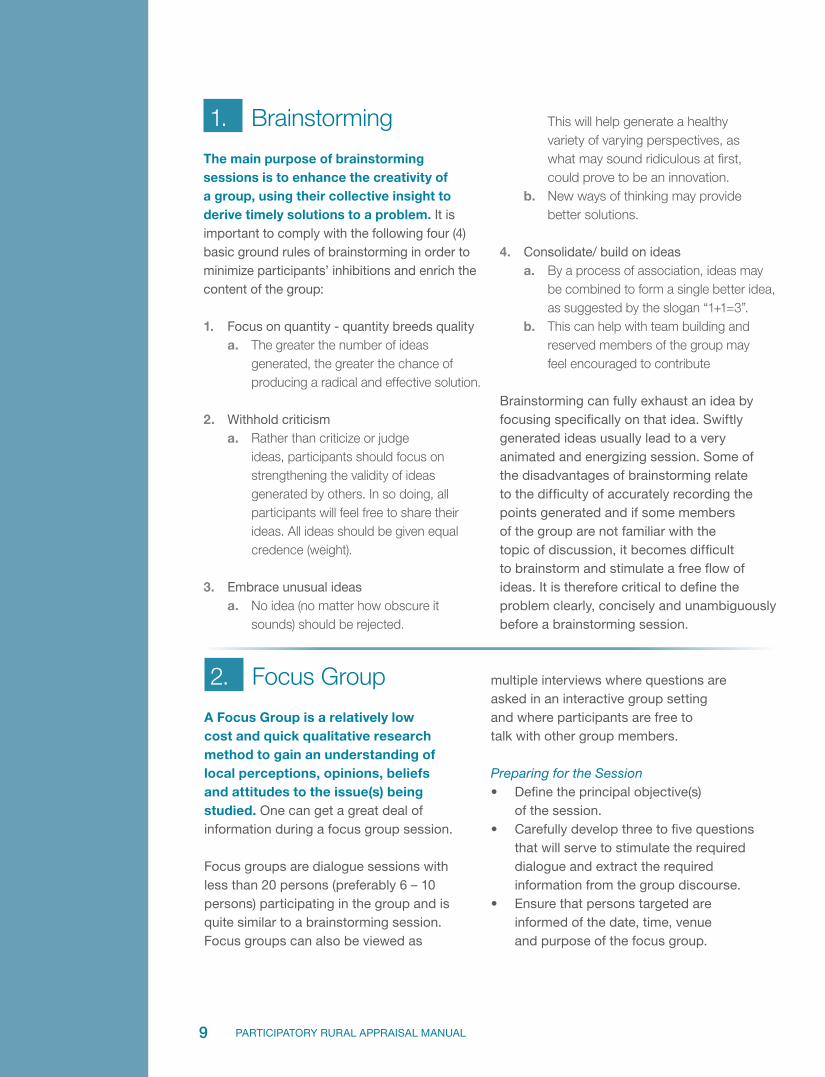
The main purpose of brainstorming sessions is to enhance the creativity of a group, using their collective insight to derive timely solutions to a problem. It is important to comply with the following four (4) basic ground rules of brainstorming in order to minimize participants’ inhibitions and enrich the content of the group:
1 . Focus on quantity - quantity breeds quality a . The greater the number of ideas
generated, the greater the chance of producing a radical and effective solution.
2 . Withhold criticisma . Rather than criticize or judge
ideas, participants should focus on strengthening the validity of ideas generated by others. In so doing, all participants will feel free to share their ideas. All ideas should be given equal credence (weight).
3 . Embrace unusual ideas a . No idea (no matter how obscure it
sounds) should be rejected.
This will help generate a healthy variety of varying perspectives, as what may sound ridiculous at first, could prove to be an innovation.
b . New ways of thinking may provide better solutions.
4 . Consolidate/ build on ideasa . By a process of association, ideas may
be combined to form a single better idea, as suggested by the slogan “1+1=3”.
b . This can help with team building and reserved members of the group may feel encouraged to contribute
Brainstorming can fully exhaust an idea by focusing specifically on that idea. Swiftly generated ideas usually lead to a very animated and energizing session. Some of the disadvantages of brainstorming relate to the difficulty of accurately recording the points generated and if some members of the group are not familiar with the topic of discussion, it becomes difficult to brainstorm and stimulate a free flow of ideas. It is therefore critical to define the problem clearly, concisely and unambiguously before a brainstorming session.
2. Focus Group
A Focus Group is a relatively low cost and quick qualitative research method to gain an understanding of local perceptions, opinions, beliefs and attitudes to the issue(s) being studied. One can get a great deal of information during a focus group session.
Focus groups are dialogue sessions with less than 20 persons (preferably 6 – 10 persons) participating in the group and is quite similar to a brainstorming session.Focus groups can also be viewed as
multiple interviews where questions are asked in an interactive group setting and where participants are free to talk with other group members.
Preparing for the Session• Define the principal objective(s)
of the session.• Carefully develop three to five questions
that will serve to stimulate the required dialogue and extract the required information from the group discourse.
• Ensure that persons targeted are informed of the date, time, venue and purpose of the focus group.
10PARTICIPATORY RURAL APPRAISAL MANUAL
• Touch base with them to ensure their participation and assist, where necessary, to guarantee their participation.
• Choose a venue that is easily accessible to all participants and comfortable for the session that should last no more than two (2) hours. Ensure adequate air flow and configure sitting so that all participants can see each other.
• Make provisions for name tags (first name basis) as well refreshments.
• Plan to record the session with either an audio or audio-video recorder. Don’t count on your memory. If this isn’t practical, involve a co-facilitator who is there to take notes.
Ground Rules • Always reference the key issues to be
investigated, to determine what problem or need is being addressed by the information exchanges during the session.
• All participants should be encouraged to speak. However, it is very important to keep the discussions focused on the issue(s) to be researched; while maintaining the momentum of the discourse and ensuring closure on questions raised.
Facilitating the Session• The major goal of facilitation is
collecting useful information to
meet the objective(s) of meeting. • Introduce yourself and the co-
facilitator, if applicable. • Get the permission of the participants
to record the proceedings.• Ensure even participation. If one or two
people are dominating the meeting, seek the indulgence of the other participants. Consider using a round-table approach, by going from one person to the next soliciting responses to the question(s).
• If domination by a few persons continues, seek the guidance of the group on how to ensure equity re: participation.
• In closing the session, outline the main thrust of the discussion and highlight the key issues raised and the recommendation that could be immediately pursued at the individual, household or community level.
• Thank participants for coming and adjourn the session.
Immediately After Session• Ensure that all key issues for
investigation were covered.• Make proper notes and write down all
salient observations made during the session. For example, where did the session occur and when, what was the nature of participation in the group? Were there any unexpected occurrences or revelations during the session?
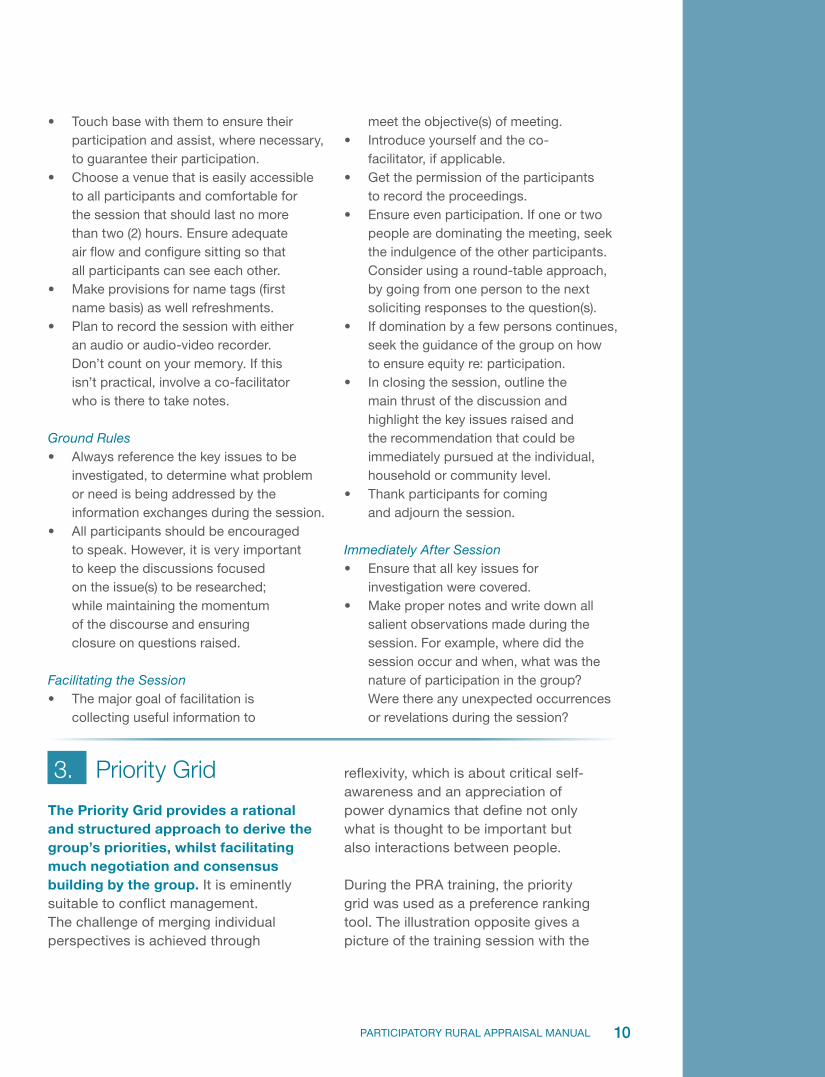
3. Priority Grid
The Priority Grid provides a rational and structured approach to derive the group’s priorities, whilst facilitating much negotiation and consensus building by the group. It is eminently suitable to conflict management. The challenge of merging individual perspectives is achieved through
reflexivity, which is about critical self-awareness and an appreciation of power dynamics that define not only what is thought to be important but also interactions between people.
During the PRA training, the priority grid was used as a preference ranking tool. The illustration opposite gives a picture of the training session with the
11 PARTICIPATORY RURAL APPRAISAL MANUAL
priority grid, using the flooring of the packing shed at Anse Ger in Micoud3.
Steps to Developing a Priority Grid1. Brainstorm issues that require
prioritization / ranking.2. Consolidate into concise
themes/ issues for ranking.3. Avoid ambiguity and safeguard the
integrity of all themes/ issues 4. Employ a pairwise ranking scheme.
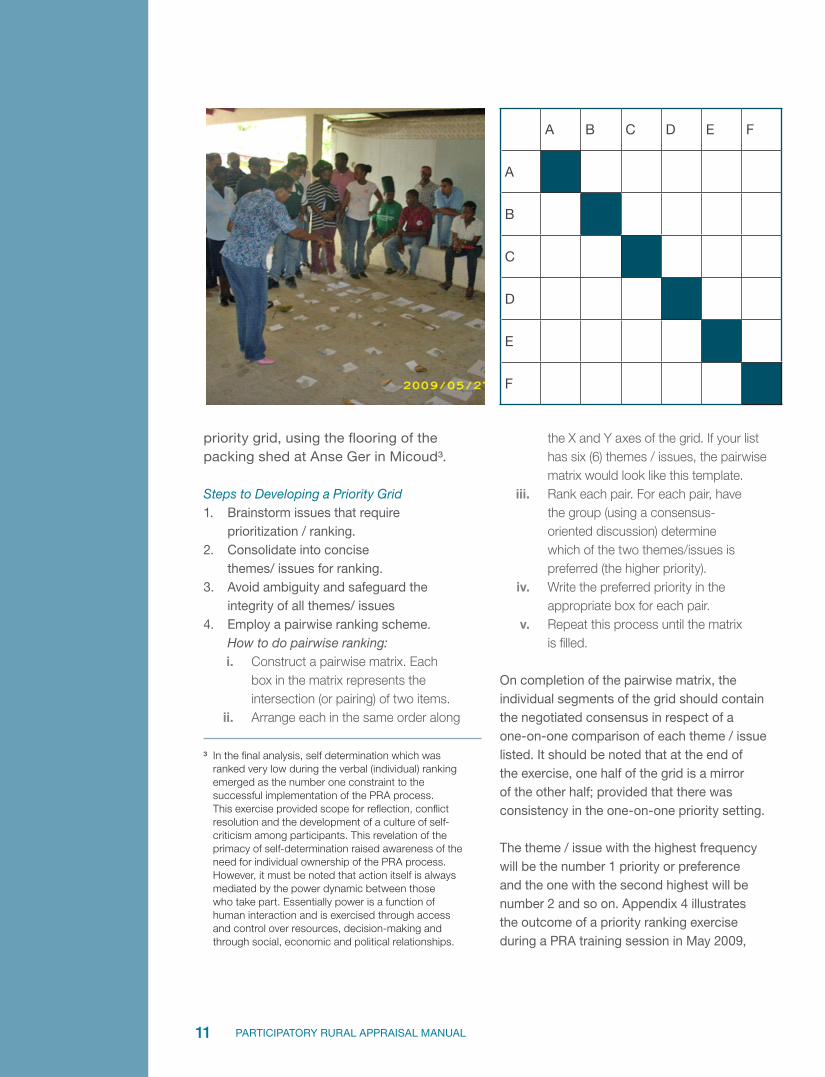
How to do pairwise ranking:i . Construct a pairwise matrix. Each
box in the matrix represents the intersection (or pairing) of two items.
ii . Arrange each in the same order along
3 In the final analysis, self determination which was ranked very low during the verbal (individual) ranking emerged as the number one constraint to the successful implementation of the PRA process. This exercise provided scope for reflection, conflict resolution and the development of a culture of self-criticism among participants. This revelation of the primacy of self-determination raised awareness of the need for individual ownership of the PRA process. However, it must be noted that action itself is always mediated by the power dynamic between those who take part. Essentially power is a function of human interaction and is exercised through access and control over resources, decision-making and through social, economic and political relationships.
the X and Y axes of the grid. If your list has six (6) themes / issues, the pairwise matrix would look like this template.
iii . Rank each pair. For each pair, have the group (using a consensus-oriented discussion) determine which of the two themes/issues is preferred (the higher priority).
iv . Write the preferred priority in the appropriate box for each pair.
v . Repeat this process until the matrix is filled.
On completion of the pairwise matrix, the individual segments of the grid should contain the negotiated consensus in respect of a one-on-one comparison of each theme / issue listed. It should be noted that at the end of the exercise, one half of the grid is a mirror of the other half; provided that there was consistency in the one-on-one priority setting.
The theme / issue with the highest frequency will be the number 1 priority or preference and the one with the second highest will be number 2 and so on. Appendix 4 illustrates the outcome of a priority ranking exercise during a PRA training session in May 2009,
A B C D E F
A
B
C
D
E
F
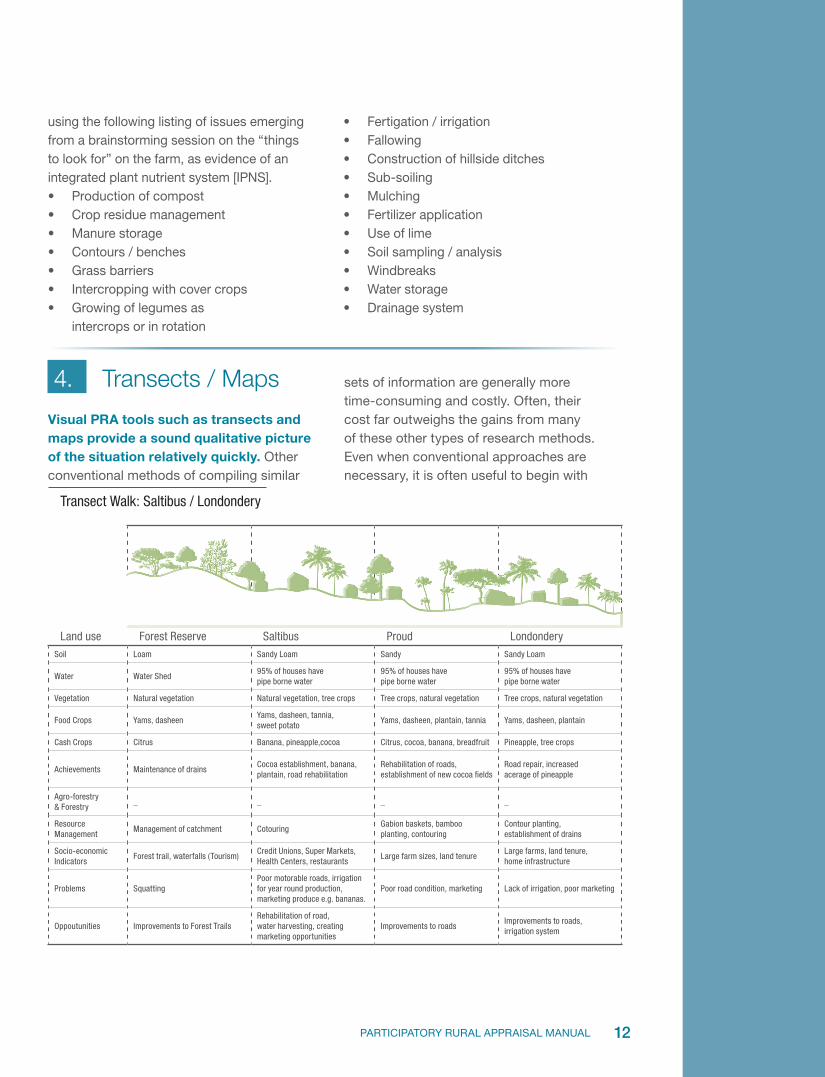
Transect Walk: Saltibus / Londondery
Land use Forest Reserve Saltibus Proud LondonderySoil Loam Sandy Loam Sandy Sandy Loam
Water Water Shed95% of houses have pipe borne water
95% of houses have pipe borne water
95% of houses have pipe borne water
Vegetation Natural vegetation Natural vegetation, tree crops Tree crops, natural vegetation Tree crops, natural vegetation
Food Crops Yams, dasheenYams, dasheen, tannia, sweet potato
Yams, dasheen, plantain, tannia Yams, dasheen, plantain
Cash Crops Citrus Banana, pineapple,cocoa Citrus, cocoa, banana, breadfruit Pineapple, tree crops
Achievements Maintenance of drainsCocoa establishment, banana, plantain, road rehabilitation
Rehabilitation of roads, establishment of new cocoa fields
Road repair, increased acerage of pineapple
Agro-forestry & Forestry
_ _ _ _
Resource Management
Management of catchment CotouringGabion baskets, bamboo planting, contouring
Contour planting, establishment of drains
Socio-economic Indicators
Forest trail, waterfalls (Tourism)Credit Unions, Super Markets, Health Centers, restaurants
Large farm sizes, land tenureLarge farms, land tenure, home infrastructure
Problems SquattingPoor motorable roads, irrigation for year round production, marketing produce e.g. bananas.
Poor road condition, marketing Lack of irrigation, poor marketing
Oppoutunities Improvements to Forest TrailsRehabilitation of road, water harvesting, creating marketing opportunities
Improvements to roadsImprovements to roads, irrigation system
12PARTICIPATORY RURAL APPRAISAL MANUAL
using the following listing of issues emerging from a brainstorming session on the “things to look for” on the farm, as evidence of an integrated plant nutrient system [IPNS]. • Production of compost• Crop residue management• Manure storage• Contours / benches• Grass barriers• Intercropping with cover crops• Growing of legumes as
intercrops or in rotation
• Fertigation / irrigation• Fallowing• Construction of hillside ditches• Sub-soiling• Mulching• Fertilizer application• Use of lime• Soil sampling / analysis• Windbreaks• Water storage• Drainage system
4. Transects / Maps
Visual PRA tools such as transects and maps provide a sound qualitative picture of the situation relatively quickly. Other conventional methods of compiling similar
sets of information are generally more time-consuming and costly. Often, their cost far outweighs the gains from many of these other types of research methods. Even when conventional approaches are necessary, it is often useful to begin with
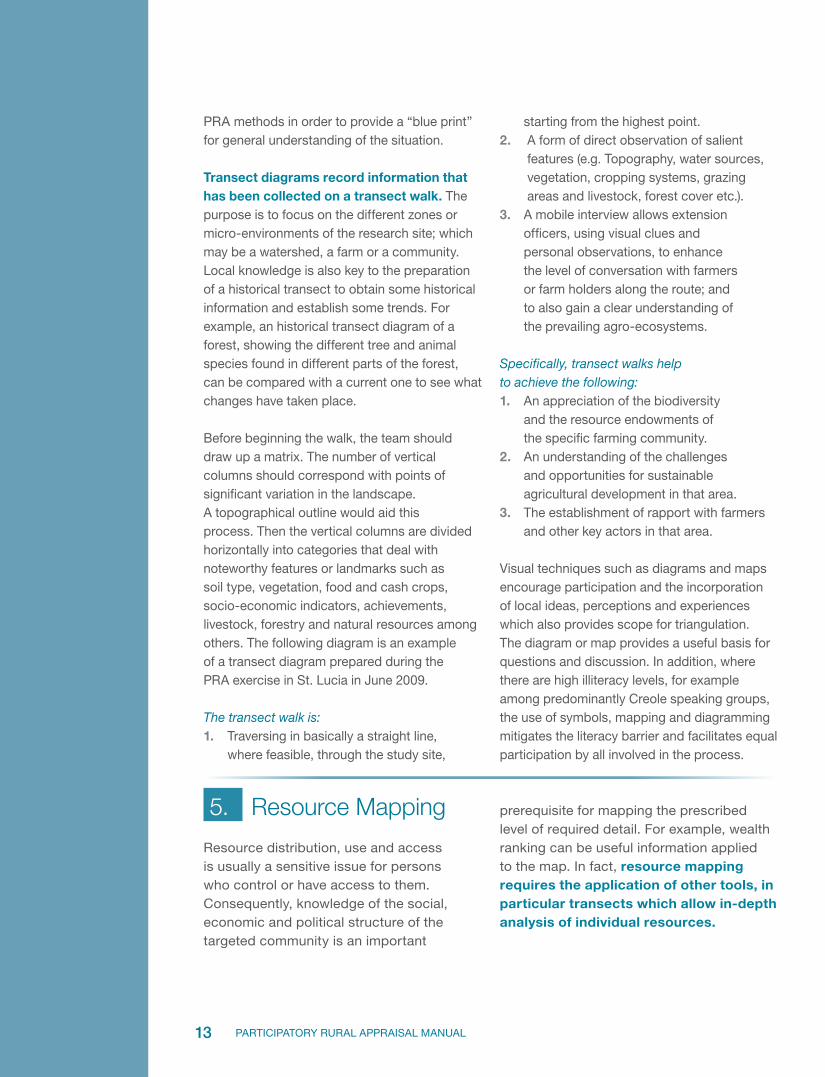
13 PARTICIPATORY RURAL APPRAISAL MANUAL
PRA methods in order to provide a “blue print” for general understanding of the situation.
Transect diagrams record information that has been collected on a transect walk. The purpose is to focus on the different zones or micro-environments of the research site; which may be a watershed, a farm or a community. Local knowledge is also key to the preparation of a historical transect to obtain some historical information and establish some trends. For example, an historical transect diagram of a forest, showing the different tree and animal species found in different parts of the forest, can be compared with a current one to see what changes have taken place.
Before beginning the walk, the team should draw up a matrix. The number of vertical columns should correspond with points of significant variation in the landscape. A topographical outline would aid this process. Then the vertical columns are divided horizontally into categories that deal with noteworthy features or landmarks such as soil type, vegetation, food and cash crops, socio-economic indicators, achievements, livestock, forestry and natural resources among others. The following diagram is an example of a transect diagram prepared during the PRA exercise in St. Lucia in June 2009.
The transect walk is: 1 . Traversing in basically a straight line,
where feasible, through the study site,
starting from the highest point.2 . A form of direct observation of salient
features (e.g. Topography, water sources, vegetation, cropping systems, grazing areas and livestock, forest cover etc.).
3 . A mobile interview allows extension officers, using visual clues and personal observations, to enhance the level of conversation with farmers or farm holders along the route; and to also gain a clear understanding of the prevailing agro-ecosystems.
Specifically, transect walks help to achieve the following:1 . An appreciation of the biodiversity
and the resource endowments of the specific farming community.
2 . An understanding of the challenges and opportunities for sustainable agricultural development in that area.
3 . The establishment of rapport with farmers and other key actors in that area.
Visual techniques such as diagrams and maps encourage participation and the incorporation of local ideas, perceptions and experiences which also provides scope for triangulation. The diagram or map provides a useful basis for questions and discussion. In addition, where there are high illiteracy levels, for example among predominantly Creole speaking groups, the use of symbols, mapping and diagramming mitigates the literacy barrier and facilitates equal participation by all involved in the process.
5. Resource Mapping
Resource distribution, use and access is usually a sensitive issue for persons who control or have access to them. Consequently, knowledge of the social, economic and political structure of the targeted community is an important
prerequisite for mapping the prescribed level of required detail. For example, wealth ranking can be useful information applied to the map. In fact, resource mapping requires the application of other tools, in particular transects which allow in-depth analysis of individual resources.
14PARTICIPATORY RURAL APPRAISAL MANUAL
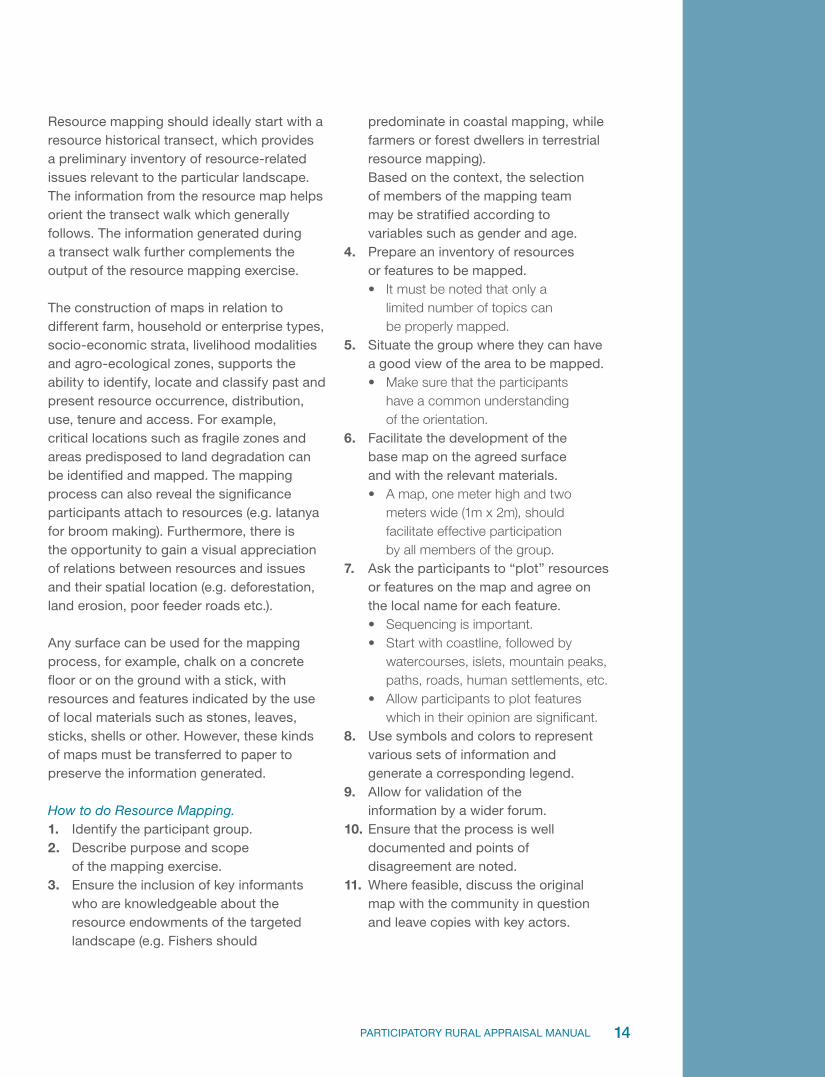
Resource mapping should ideally start with a resource historical transect, which provides a preliminary inventory of resource-related issues relevant to the particular landscape. The information from the resource map helps orient the transect walk which generally follows. The information generated during a transect walk further complements the output of the resource mapping exercise.
The construction of maps in relation to different farm, household or enterprise types, socio-economic strata, livelihood modalities and agro-ecological zones, supports the ability to identify, locate and classify past and present resource occurrence, distribution, use, tenure and access. For example, critical locations such as fragile zones and areas predisposed to land degradation can be identified and mapped. The mapping process can also reveal the significance participants attach to resources (e.g. latanya for broom making). Furthermore, there is the opportunity to gain a visual appreciation of relations between resources and issues and their spatial location (e.g. deforestation, land erosion, poor feeder roads etc.).
Any surface can be used for the mapping process, for example, chalk on a concrete floor or on the ground with a stick, with resources and features indicated by the use of local materials such as stones, leaves, sticks, shells or other. However, these kinds of maps must be transferred to paper to preserve the information generated.
How to do Resource Mapping.1 . Identify the participant group.2 . Describe purpose and scope
of the mapping exercise.3 . Ensure the inclusion of key informants
who are knowledgeable about the resource endowments of the targeted landscape (e.g. Fishers should
predominate in coastal mapping, while farmers or forest dwellers in terrestrial resource mapping). Based on the context, the selection of members of the mapping team may be stratified according to variables such as gender and age.
4 . Prepare an inventory of resources or features to be mapped.• It must be noted that only a
limited number of topics can be properly mapped.
5 . Situate the group where they can have a good view of the area to be mapped.• Make sure that the participants
have a common understanding of the orientation.
6 . Facilitate the development of the base map on the agreed surface and with the relevant materials. • A map, one meter high and two
meters wide (1m x 2m), should facilitate effective participation by all members of the group.
7 . Ask the participants to “plot” resources or features on the map and agree on the local name for each feature. • Sequencing is important.• Start with coastline, followed by
watercourses, islets, mountain peaks, paths, roads, human settlements, etc.
• Allow participants to plot features which in their opinion are significant.
8 . Use symbols and colors to represent various sets of information and generate a corresponding legend.
9 . Allow for validation of the information by a wider forum.
10 . Ensure that the process is well documented and points of disagreement are noted.
11 . Where feasible, discuss the original map with the community in question and leave copies with key actors.
15 PARTICIPATORY RURAL APPRAISAL MANUAL
Produced maps will vary based on the specific purpose of the exercise; as well as the perspectives, vision, experiences and knowledge of the participants. Consequently, resources or issues of significance to a particular group may appear exaggerated in
4. Due to the nature of the PRA, the genderised crop calendar was more appropriate. In other situations, instead of a genderised crop calendar, a genderised
size or color compared to issues or resources of lesser significance which might be under-represented. Resource mapping is a good starting point for participatory problem analysis and planning. Gender resource mapping is a variation which highlights women’s
CROP CALENDARS
Vegetables
Farm location: La Haut Farm size: 3 acres
Land Tenure: Owned
Household size: 2 Adult Male: 1 Adult Female: 1
DRY SEASON RAINY SEASON
Crops Jan Feb Mar Apr May June July Aug Sept Oct Nov Dec
Cucumber(two crop cycle)
lp/p w/ml/f lp/p w/ml/f
pm h/m pm
h/m
Cabbage
lp/p
pm pm/w/ml/f
h/m
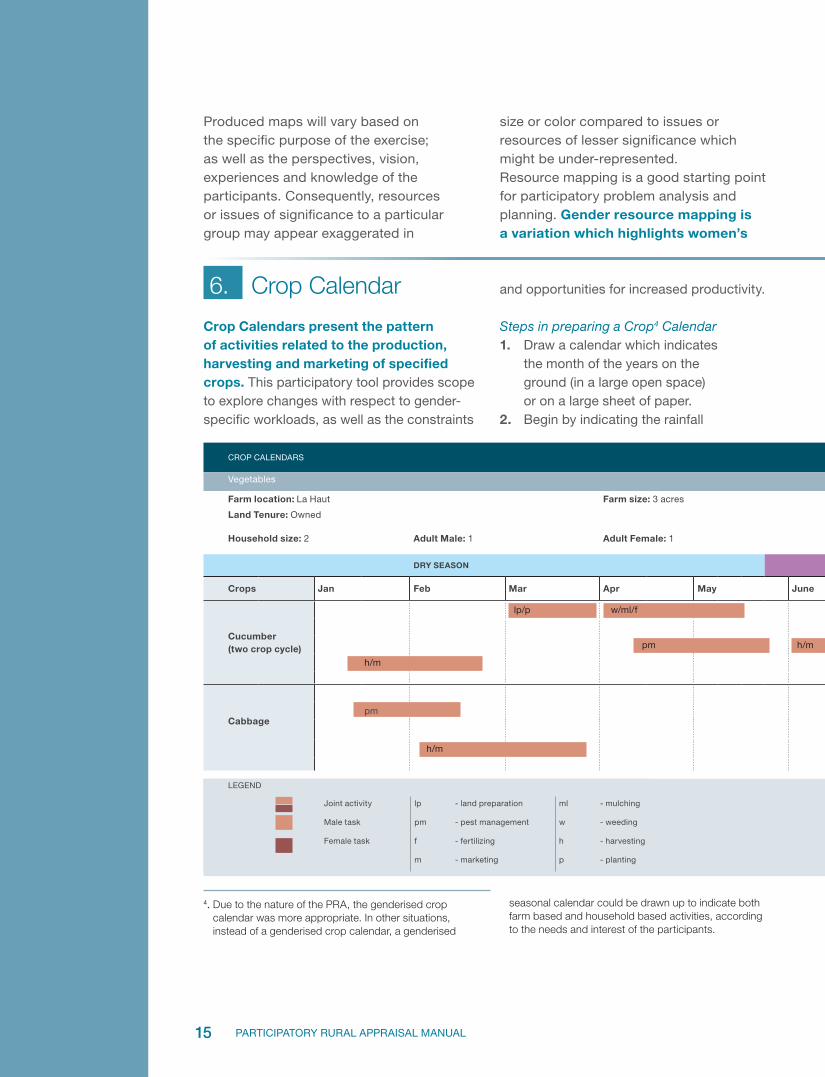
6. Crop Calendar
Crop Calendars present the pattern of activities related to the production, harvesting and marketing of specified crops. This participatory tool provides scope to explore changes with respect to gender-specific workloads, as well as the constraints
and opportunities for increased productivity.
Steps in preparing a Crop4 Calendar1 . Draw a calendar which indicates
the month of the years on the ground (in a large open space) or on a large sheet of paper.
2 . Begin by indicating the rainfall
seasonal calendar could be drawn up to indicate both farm based and household based activities, according to the needs and interest of the participants.
LEGEND
Joint activity lp - land preparation ml - mulching
Male task pm - pest management w - weeding
Female task f - fertilizing h - harvesting
m - marketing p - planting
16PARTICIPATORY RURAL APPRAISAL MANUAL
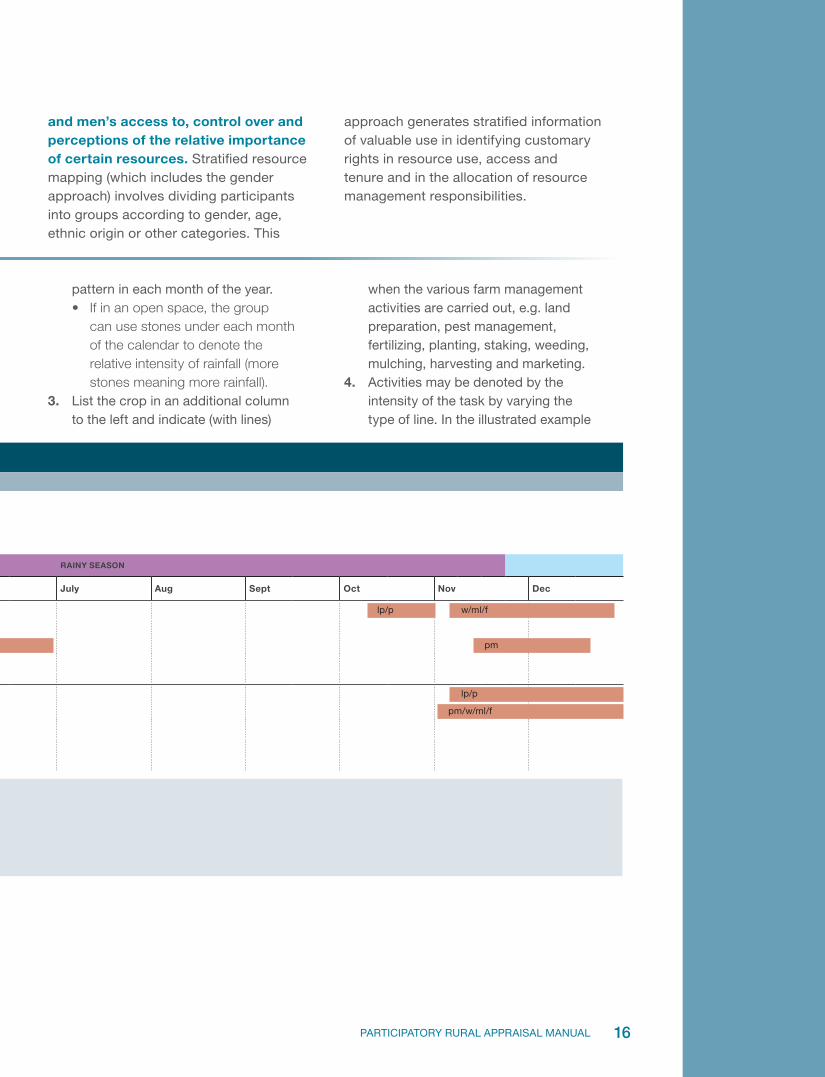
CROP CALENDARS
Vegetables
Farm location: La Haut Farm size: 3 acres
Land Tenure: Owned
Household size: 2 Adult Male: 1 Adult Female: 1
DRY SEASON RAINY SEASON
Crops Jan Feb Mar Apr May June July Aug Sept Oct Nov Dec
Cucumber(two crop cycle)
lp/p w/ml/f lp/p w/ml/f
pm h/m pm
h/m
Cabbage
lp/p
pm pm/w/ml/f
h/m
and men’s access to, control over and perceptions of the relative importance of certain resources. Stratified resource mapping (which includes the gender approach) involves dividing participants into groups according to gender, age, ethnic origin or other categories. This
approach generates stratified information of valuable use in identifying customary rights in resource use, access and tenure and in the allocation of resource management responsibilities.
pattern in each month of the year.• If in an open space, the group
can use stones under each month of the calendar to denote the relative intensity of rainfall (more stones meaning more rainfall).
3 . List the crop in an additional column to the left and indicate (with lines)
when the various farm management activities are carried out, e.g. land preparation, pest management, fertilizing, planting, staking, weeding, mulching, harvesting and marketing.
4 . Activities may be denoted by the intensity of the task by varying the type of line. In the illustrated example
LEGEND
Joint activity lp - land preparation ml - mulching
Male task pm - pest management w - weeding
Female task f - fertilizing h - harvesting
m - marketing p - planting
17 PARTICIPATORY RURAL APPRAISAL MANUAL
of a crop calendar below, continuous activity is illustrated by a solid line, intermittent activities are indicated by broken lines and a heavy black line may be used to show intense activity.
5 . Indicate which are joint activities, i.e. performed by both women and men, which are male or female tasks. The symbols used are indicated in the legend for the crop calendar below.
6 . After completing one crop, develop another calendar for another crop and repeat the steps.• If there is any livestock, use the
calendar in a similar manner for each type of livestock e.g. poultry, pigs, goats, sheep, cattle etc.
While the calendar is being created, encourage participants to probe and check information and encourage debate. On completion of the calendar, the group should further discuss what the calendar reveals to them. The group discussion can be facilitated through brainstorming and collective decision-making to identify and
prioritize issues. Some of these include: 1 . Who is doing what type work? 2 . Are women working harder than
the men or vice versa?3 . Is pest and weed control, fertilizing,
being done at the right time?4 . Was the harvesting period too short?5 . Is there scope to do other activities or
can some activities be done differently?6 . Are the resources available
being used properly?7 . Can improved technology be adopted?
An album of calendars addressing the range of commodities in a particular context, e.g. an agricultural region, will provide diagrammatic representations and a “temporal dimension” of the various activities, constraints and opportunities that influence the livelihoods of farm households. The categorization of production and marketing activities by season, month, frequency and gender also provides a useful reference guide for a gender- aware approach to project planning and output evaluation, as well as agricultural policy analysis and formulation.
7. Constraints Analysis
A constraint is a situation or a factor that determines what will not happen. These limitations, imposed by nature or by humankind, prevent the realization of goals and targets, by not permitting certain actions to be taken. Constraints occur at different levels: farm, community, region or district as well as nationally and internationally.
Some constraints have few causes and can be easily and quickly eliminated. These elastic types of constraints do not therefore preclude actions, alternatives, consequences, and objectives in the short term. Other
constraints have many fundamental causes and a network of influences. These rigid types of constraints are usually more difficult to deal with and require a coherent set of actions in the medium to long term. It is useful to distinguish short, medium and long-term constraints. For example, poor drainage may a constraint in the short term, however low yields may be a medium-term problem; while insecure land tenure and soil degradation could pose problems in the long term. Constraints analysis is a methodology for mapping a critical path of actions required to create an enabling environment for sustainable livelihood systems.
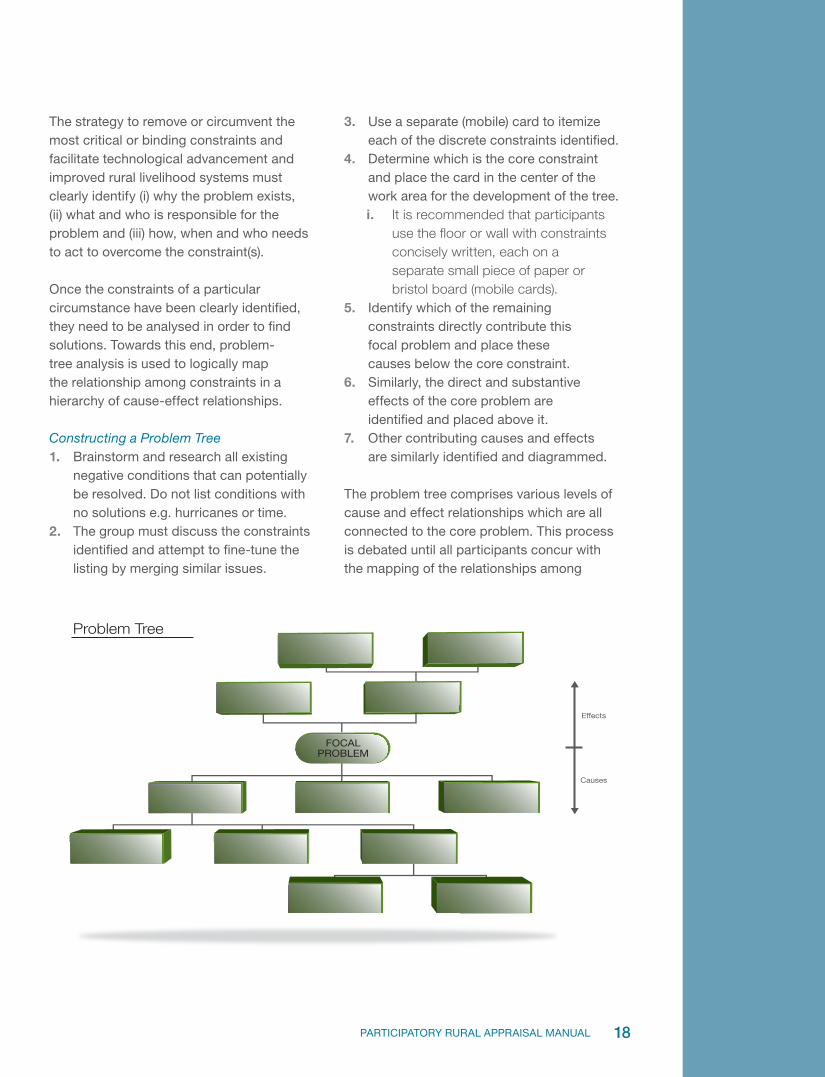
FOCALPROBLEM
Problem Tree
Effects
Causes
18PARTICIPATORY RURAL APPRAISAL MANUAL
The strategy to remove or circumvent the most critical or binding constraints and facilitate technological advancement and improved rural livelihood systems must clearly identify (i) why the problem exists, (ii) what and who is responsible for the problem and (iii) how, when and who needs to act to overcome the constraint(s).
Once the constraints of a particular circumstance have been clearly identified, they need to be analysed in order to find solutions. Towards this end, problem-tree analysis is used to logically map the relationship among constraints in a hierarchy of cause-effect relationships.
Constructing a Problem Tree1 . Brainstorm and research all existing
negative conditions that can potentially be resolved. Do not list conditions with no solutions e.g. hurricanes or time.
2 . The group must discuss the constraints identified and attempt to fine-tune the listing by merging similar issues.
3 . Use a separate (mobile) card to itemize each of the discrete constraints identified.
4 . Determine which is the core constraint and place the card in the center of the work area for the development of the tree.i . It is recommended that participants
use the floor or wall with constraints concisely written, each on a separate small piece of paper or bristol board (mobile cards).
5 . Identify which of the remaining constraints directly contribute this focal problem and place these causes below the core constraint.
6 . Similarly, the direct and substantive effects of the core problem are identified and placed above it.
7 . Other contributing causes and effects are similarly identified and diagrammed.
The problem tree comprises various levels of cause and effect relationships which are all connected to the core problem. This process is debated until all participants concur with the mapping of the relationships among
19 PARTICIPATORY RURAL APPRAISAL MANUAL
the constraints identified by the group. Once the problem tree has been constructed, its validity must be tested. To do this, each constraint is examined systematically to determine whether or not it can be resolved through the efforts of the individual farm
household, the farming community or the region. The reformulation of the constraints into positive desirable conditions or opportunities, constitutes the transition to an objectives tree and the start of the formatting of an opportunity matrix.
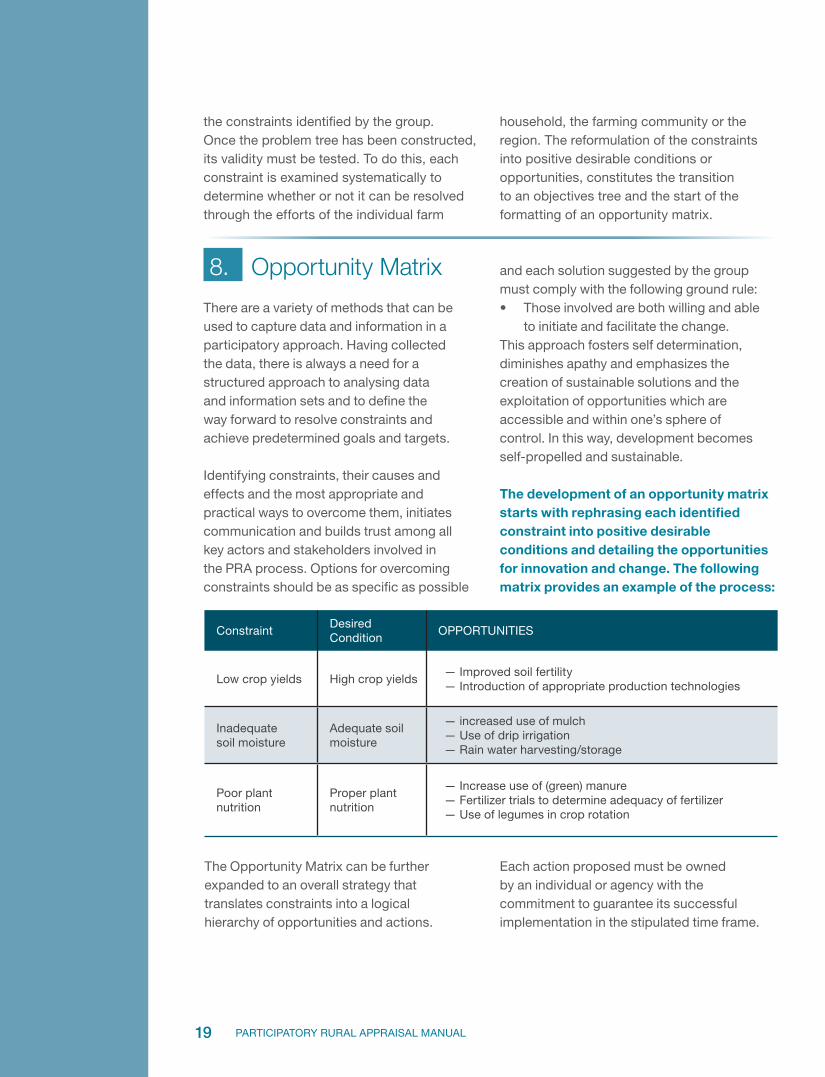
ConstraintDesired Condition
OPPORTUNITIES
Low crop yields High crop yields— Improved soil fertility — Introduction of appropriate production technologies
Inadequate soil moisture
Adequate soil moisture
— increased use of mulch — Use of drip irrigation — Rain water harvesting/storage
Poor plant nutrition
Proper plant nutrition
— Increase use of (green) manure — Fertilizer trials to determine adequacy of fertilizer — Use of legumes in crop rotation
8. Opportunity Matrix
There are a variety of methods that can be used to capture data and information in a participatory approach. Having collected the data, there is always a need for a structured approach to analysing data and information sets and to define the way forward to resolve constraints and achieve predetermined goals and targets. Identifying constraints, their causes and effects and the most appropriate and practical ways to overcome them, initiates communication and builds trust among all key actors and stakeholders involved in the PRA process. Options for overcoming constraints should be as specific as possible
and each solution suggested by the group must comply with the following ground rule:• Those involved are both willing and able
to initiate and facilitate the change.This approach fosters self determination, diminishes apathy and emphasizes the creation of sustainable solutions and the exploitation of opportunities which are accessible and within one’s sphere of control. In this way, development becomes self-propelled and sustainable.
The development of an opportunity matrix starts with rephrasing each identified constraint into positive desirable conditions and detailing the opportunities for innovation and change. The following matrix provides an example of the process:
The Opportunity Matrix can be further expanded to an overall strategy that translates constraints into a logical hierarchy of opportunities and actions.
Each action proposed must be owned by an individual or agency with the commitment to guarantee its successful implementation in the stipulated time frame.
20PARTICIPATORY RURAL APPRAISAL MANUAL
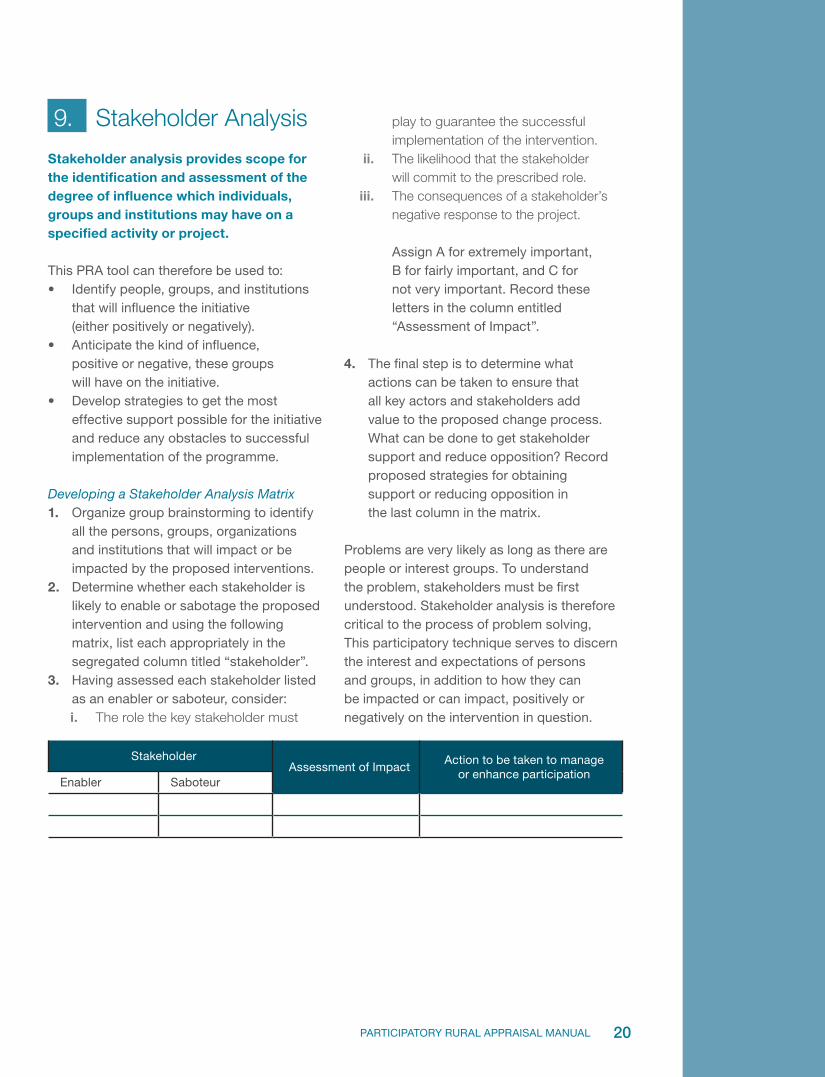
9. Stakeholder Analysis
Stakeholder analysis provides scope for the identification and assessment of the degree of influence which individuals, groups and institutions may have on a specified activity or project. This PRA tool can therefore be used to: • Identify people, groups, and institutions
that will influence the initiative (either positively or negatively).
• Anticipate the kind of influence, positive or negative, these groups will have on the initiative.
• Develop strategies to get the most effective support possible for the initiative and reduce any obstacles to successful implementation of the programme.
Developing a Stakeholder Analysis Matrix1 . Organize group brainstorming to identify
all the persons, groups, organizations and institutions that will impact or be impacted by the proposed interventions.
2 . Determine whether each stakeholder is likely to enable or sabotage the proposed intervention and using the following matrix, list each appropriately in the segregated column titled “stakeholder”.
3 . Having assessed each stakeholder listed as an enabler or saboteur, consider: i . The role the key stakeholder must
StakeholderAssessment of Impact
Action to be taken to manage or enhance participation
Enabler Saboteur
play to guarantee the successful implementation of the intervention.
ii . The likelihood that the stakeholder will commit to the prescribed role.
iii . The consequences of a stakeholder’s negative response to the project.
Assign A for extremely important, B for fairly important, and C for not very important. Record these letters in the column entitled “Assessment of Impact”.
4 . The final step is to determine what actions can be taken to ensure that all key actors and stakeholders add value to the proposed change process. What can be done to get stakeholder support and reduce opposition? Record proposed strategies for obtaining support or reducing opposition in the last column in the matrix.
Problems are very likely as long as there are people or interest groups. To understand the problem, stakeholders must be first understood. Stakeholder analysis is therefore critical to the process of problem solving, This participatory technique serves to discern the interest and expectations of persons and groups, in addition to how they can be impacted or can impact, positively or negatively on the intervention in question.
21 PARTICIPATORY RURAL APPRAISAL MANUAL
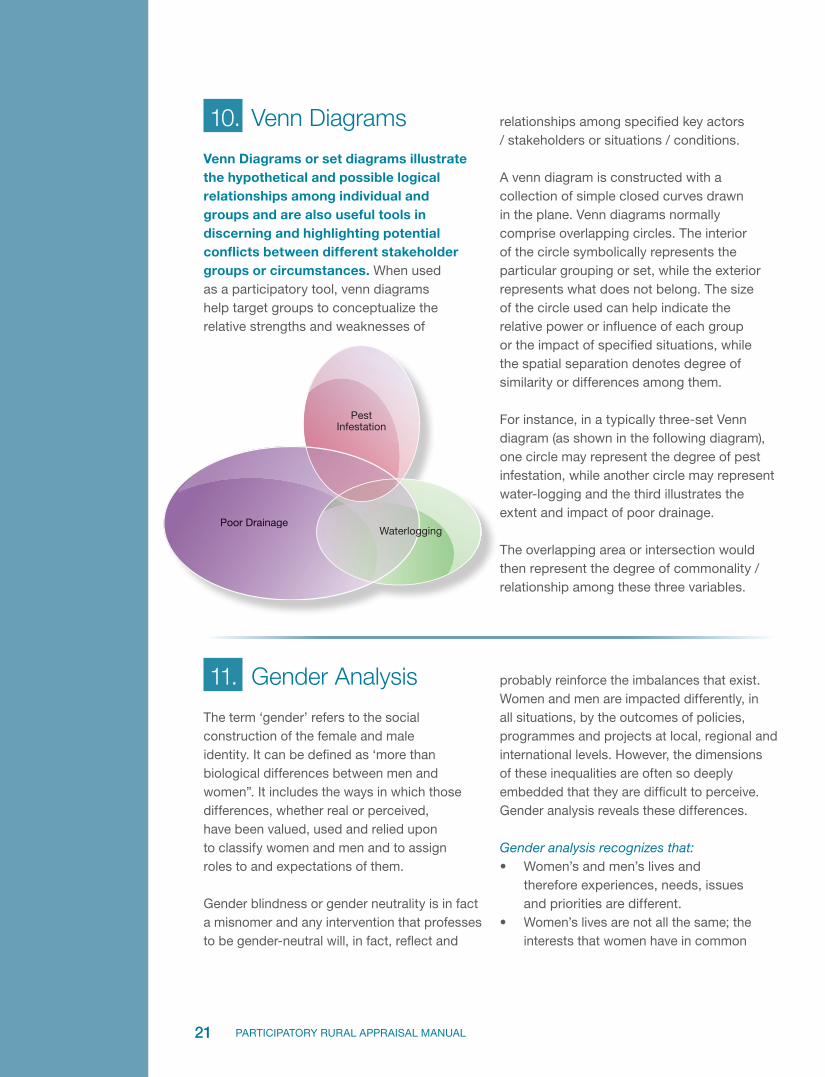
10. Venn Diagrams
Venn Diagrams or set diagrams illustrate the hypothetical and possible logical relationships among individual and groups and are also useful tools in discerning and highlighting potential conflicts between different stakeholder groups or circumstances. When used as a participatory tool, venn diagrams help target groups to conceptualize the relative strengths and weaknesses of
relationships among specified key actors / stakeholders or situations / conditions.
A venn diagram is constructed with a collection of simple closed curves drawn in the plane. Venn diagrams normally comprise overlapping circles. The interior of the circle symbolically represents the particular grouping or set, while the exterior represents what does not belong. The size of the circle used can help indicate the relative power or influence of each group or the impact of specified situations, while the spatial separation denotes degree of similarity or differences among them. For instance, in a typically three-set Venn diagram (as shown in the following diagram), one circle may represent the degree of pest infestation, while another circle may represent water-logging and the third illustrates the extent and impact of poor drainage.
The overlapping area or intersection would then represent the degree of commonality / relationship among these three variables.
PestInfestation
Poor DrainagePoooor DraainnaaggeeWaterlogging
11. Gender Analysis
The term ‘gender’ refers to the social construction of the female and male identity. It can be defined as ‘more than biological differences between men and women”. It includes the ways in which those differences, whether real or perceived, have been valued, used and relied upon to classify women and men and to assign roles to and expectations of them.
Gender blindness or gender neutrality is in fact a misnomer and any intervention that professes to be gender-neutral will, in fact, reflect and
probably reinforce the imbalances that exist. Women and men are impacted differently, in all situations, by the outcomes of policies, programmes and projects at local, regional and international levels. However, the dimensions of these inequalities are often so deeply embedded that they are difficult to perceive. Gender analysis reveals these differences.
Gender analysis recognizes that: • Women’s and men’s lives and
therefore experiences, needs, issues and priorities are different.
• Women’s lives are not all the same; the interests that women have in common
22PARTICIPATORY RURAL APPRAISAL MANUAL
may be determined as much by their social position or their ethnic identity as by the fact they are women.
• Women’s life experiences, needs, issues and priorities are different for different ethnic groups.
• The life experiences, needs, issues, and priorities vary for different groups of women (dependent on age, ethnicity, disability, income levels, employment status, marital status, sexual orientation and whether they have dependants).
• Different strategies may be necessary to achieve equitable outcomes for women and men and different groups of women.
Gender equality is based on the premise that women and men should be treated in the same way. This fails to recognize that equal treatment will not produce equitable results, because women and men have different life experiences. However, gender equity takes into consideration the differences in women’s and men’s lives and recognizes that different approaches may be needed to produce outcomes that are equitable.
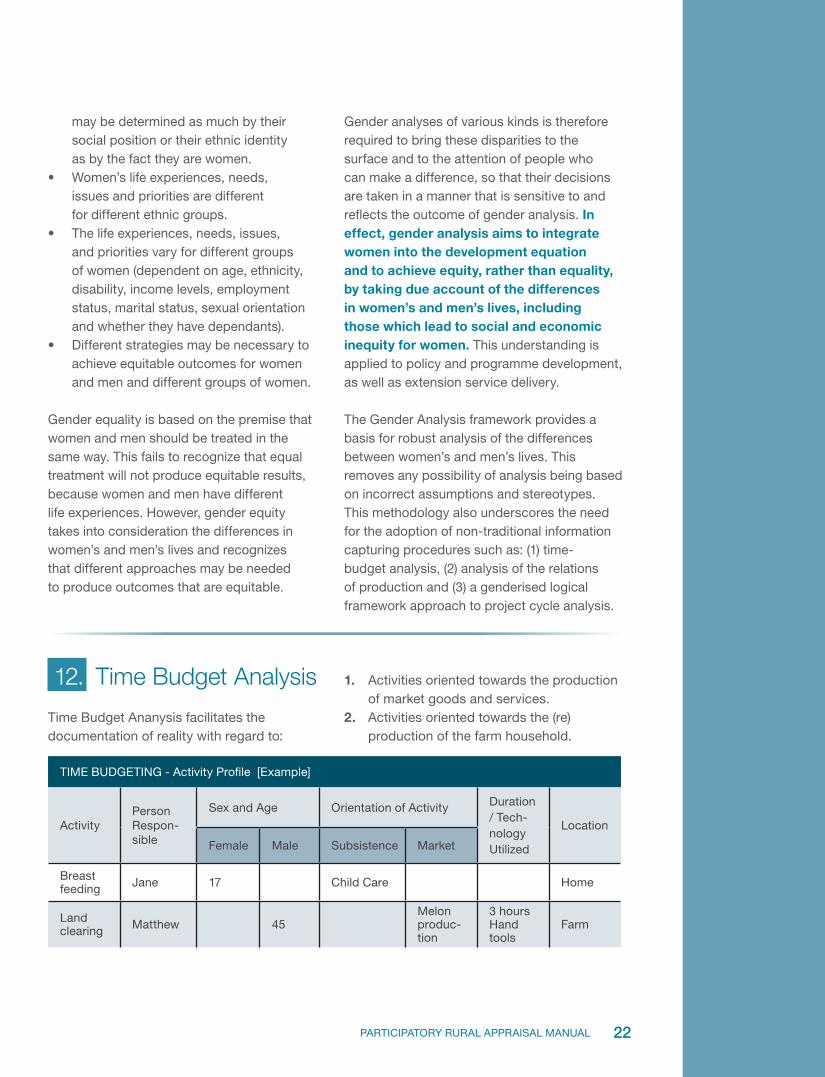
TIME BUDGETING - Activity Profile [Example]
ActivityPerson Respon-sible
Sex and Age Orientation of Activity Duration / Tech-nology Utilized
Location
Female Male Subsistence Market
Breast feeding Jane 17 Child Care Home
Land clearing Matthew 45
Melon produc-tion
3 hours Hand tools
Farm
Gender analyses of various kinds is therefore required to bring these disparities to the surface and to the attention of people who can make a difference, so that their decisions are taken in a manner that is sensitive to and reflects the outcome of gender analysis. In effect, gender analysis aims to integrate women into the development equation and to achieve equity, rather than equality, by taking due account of the differences in women’s and men’s lives, including those which lead to social and economic inequity for women. This understanding is applied to policy and programme development, as well as extension service delivery.
The Gender Analysis framework provides a basis for robust analysis of the differences between women’s and men’s lives. This removes any possibility of analysis being based on incorrect assumptions and stereotypes. This methodology also underscores the need for the adoption of non-traditional information capturing procedures such as: (1) time-budget analysis, (2) analysis of the relations of production and (3) a genderised logical framework approach to project cycle analysis.
12. Time Budget Analysis
Time Budget Ananysis facilitates the documentation of reality with regard to:
1 . Activities oriented towards the production of market goods and services.
2 . Activities oriented towards the (re)production of the farm household.
23 PARTICIPATORY RURAL APPRAISAL MANUAL
The approach, as exemplified in the following matrix, facilitates better understanding of : • Who does what activities?• How much time is spent
on these activities?• Where is the location of these activities?• Where do they take place?
According to a UNIFEM publication5, time use budget surveys have revealed the
failure of conventional labour statistics to capture the extent, range and complexity of activities in which individuals engage. This is particularly so in developing countries, such as CARICOM member states, and among women for whom multi-tasking is common. Time use studies therefore provide scope for the capture of invaluable information relating to the dynamics of the reproductive/care economy and the informal market segments of the economy.
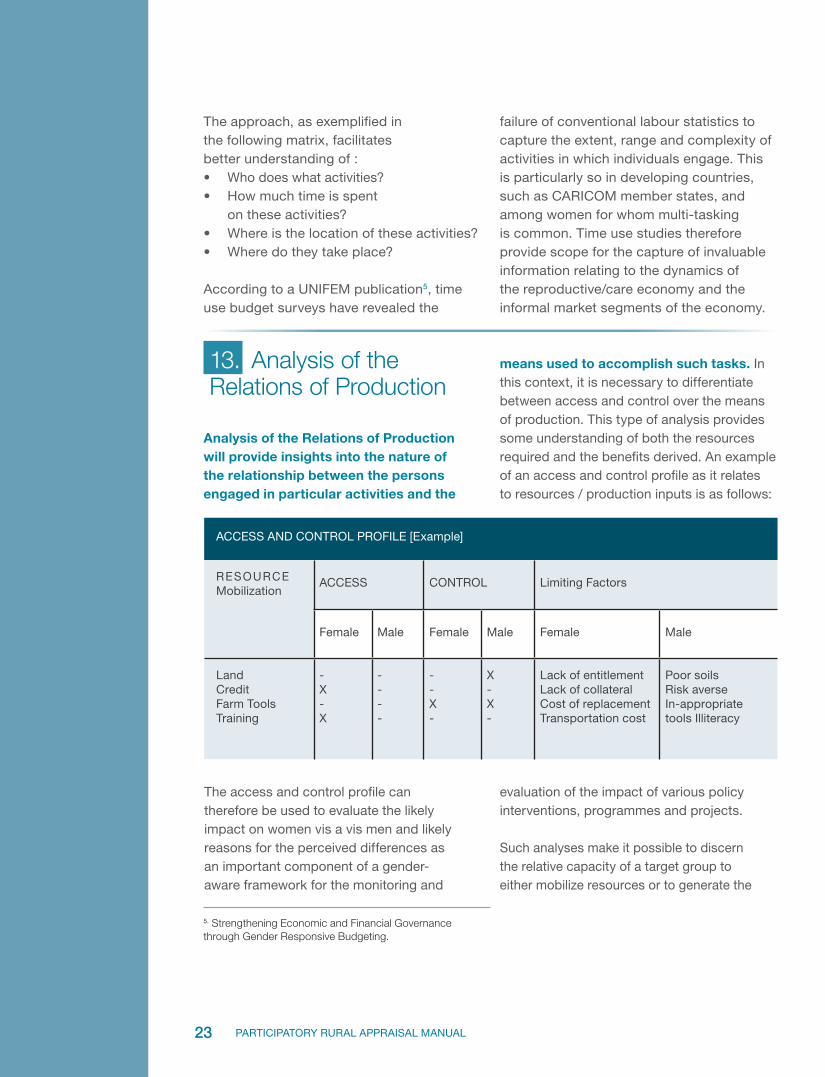
ACCESS AND CONTROL PROFILE [Example]
R E S O U R C E Mobilization
ACCESS CONTROL Limiting Factors
Female Male Female Male Female Male
LandCreditFarm ToolsTraining
- X - X
- - - -
- -X-
X- X-
Lack of entitlement Lack of collateral Cost of replacement Transportation cost
Poor soils Risk averse In-appropriate tools Illiteracy
13. Analysis of the Relations of Production
Analysis of the Relations of Production will provide insights into the nature of the relationship between the persons engaged in particular activities and the
means used to accomplish such tasks. In this context, it is necessary to differentiate between access and control over the means of production. This type of analysis provides some understanding of both the resources required and the benefits derived. An example of an access and control profile as it relates to resources / production inputs is as follows:
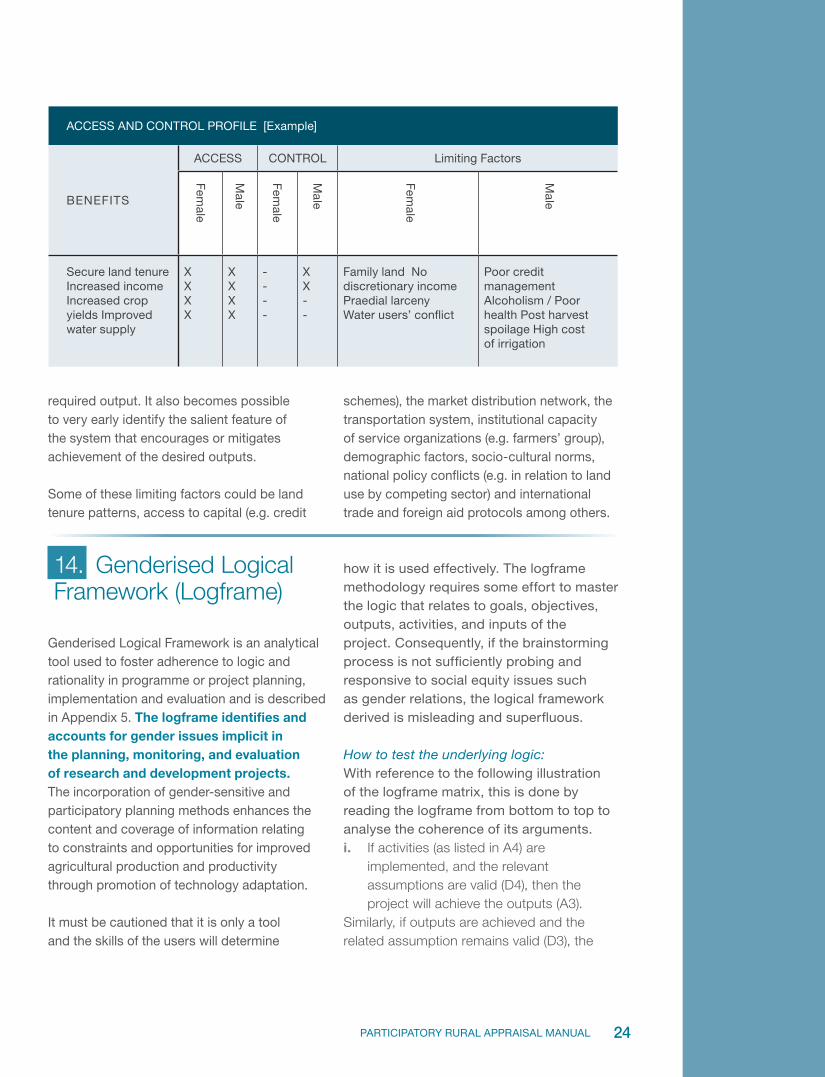
The access and control profile can therefore be used to evaluate the likely impact on women vis a vis men and likely reasons for the perceived differences as an important component of a gender-aware framework for the monitoring and
evaluation of the impact of various policy interventions, programmes and projects.
Such analyses make it possible to discern the relative capacity of a target group to either mobilize resources or to generate the
5. Strengthening Economic and Financial Governance through Gender Responsive Budgeting.
24PARTICIPATORY RURAL APPRAISAL MANUAL
required output. It also becomes possible to very early identify the salient feature of the system that encourages or mitigates achievement of the desired outputs. Some of these limiting factors could be land tenure patterns, access to capital (e.g. credit
ACCESS AND CONTROL PROFILE [Example]
B E N E F I T S
ACCESS CONTROL Limiting Factors
Female
Male
Female
Male
Female
Male
Secure land tenure Increased income Increased crop yields Improved water supply
XX X X
X X X X
----
XX - -
Family land No discretionary income Praedial larceny Water users’ conflict
Poor credit management Alcoholism / Poor health Post harvest spoilage High cost of irrigation
schemes), the market distribution network, the transportation system, institutional capacity of service organizations (e.g. farmers’ group), demographic factors, socio-cultural norms, national policy conflicts (e.g. in relation to land use by competing sector) and international trade and foreign aid protocols among others.
14. Genderised Logical Framework (Logframe)
Genderised Logical Framework is an analytical tool used to foster adherence to logic and rationality in programme or project planning, implementation and evaluation and is described in Appendix 5. The logframe identifies and accounts for gender issues implicit in the planning, monitoring, and evaluation of research and development projects. The incorporation of gender-sensitive and participatory planning methods enhances the content and coverage of information relating to constraints and opportunities for improved agricultural production and productivity through promotion of technology adaptation.
It must be cautioned that it is only a tool and the skills of the users will determine
how it is used effectively. The logframe methodology requires some effort to master the logic that relates to goals, objectives, outputs, activities, and inputs of the project. Consequently, if the brainstorming process is not sufficiently probing and responsive to social equity issues such as gender relations, the logical framework derived is misleading and superfluous.
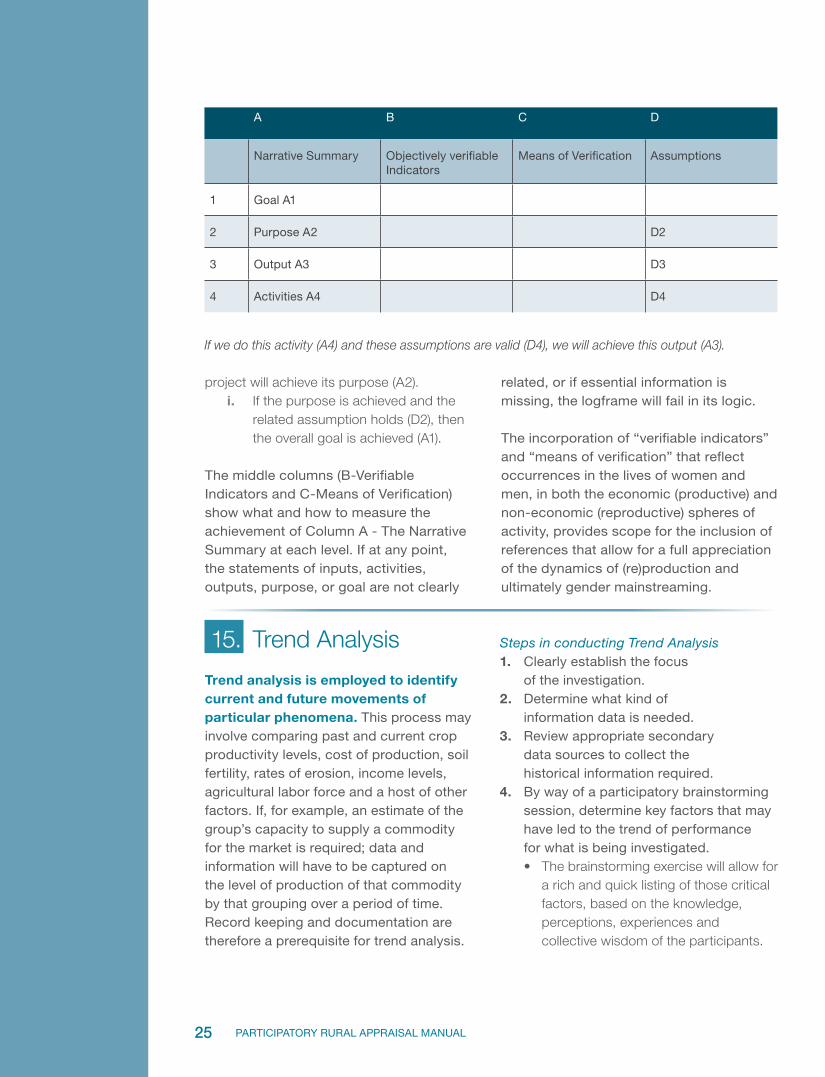
How to test the underlying logic: With reference to the following illustration of the logframe matrix, this is done by reading the logframe from bottom to top to analyse the coherence of its arguments. i . If activities (as listed in A4) are
implemented, and the relevant assumptions are valid (D4), then the project will achieve the outputs (A3).
Similarly, if outputs are achieved and the related assumption remains valid (D3), the
25 PARTICIPATORY RURAL APPRAISAL MANUAL
project will achieve its purpose (A2). i . If the purpose is achieved and the
related assumption holds (D2), then the overall goal is achieved (A1).
The middle columns (B-Verifiable Indicators and C-Means of Verification) show what and how to measure the achievement of Column A - The Narrative Summary at each level. If at any point, the statements of inputs, activities, outputs, purpose, or goal are not clearly
related, or if essential information is missing, the logframe will fail in its logic. The incorporation of “verifiable indicators” and “means of verification” that reflect occurrences in the lives of women and men, in both the economic (productive) and non-economic (reproductive) spheres of activity, provides scope for the inclusion of references that allow for a full appreciation of the dynamics of (re)production and ultimately gender mainstreaming.
15. Trend Analysis
Trend analysis is employed to identify current and future movements of particular phenomena. This process may involve comparing past and current crop productivity levels, cost of production, soil fertility, rates of erosion, income levels, agricultural labor force and a host of other factors. If, for example, an estimate of the group’s capacity to supply a commodity for the market is required; data and information will have to be captured on the level of production of that commodity by that grouping over a period of time. Record keeping and documentation are therefore a prerequisite for trend analysis.
Steps in conducting Trend Analysis1 . Clearly establish the focus
of the investigation.2 . Determine what kind of
information data is needed.3 . Review appropriate secondary
data sources to collect the historical information required.
4 . By way of a participatory brainstorming session, determine key factors that may have led to the trend of performance for what is being investigated. • The brainstorming exercise will allow for
a rich and quick listing of those critical factors, based on the knowledge, perceptions, experiences and collective wisdom of the participants.
A B C D
Narrative Summary Objectively verifiable Indicators
Means of Verification Assumptions
1 Goal A1
2 Purpose A2 D2
3 Output A3 D3
4 Activities A4 D4
If we do this activity (A4) and these assumptions are valid (D4), we will achieve this output (A3).
Mean Maximum Minimum
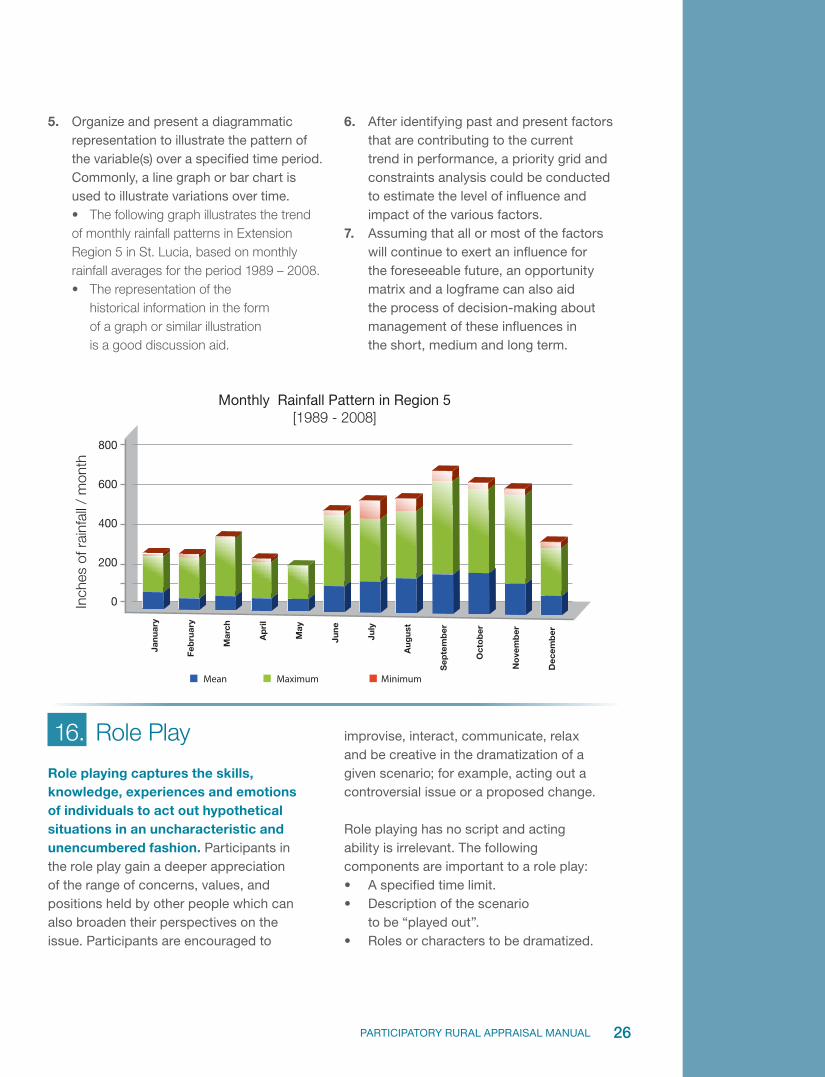
Monthly Rainfall Pattern in Region 5[1989 - 2008]
Inch
es o
f rai
nfal
l / m
onth
Jan
uar
y
Feb
ruar
y
Mar
ch
Ap
ril
May
Jun
e
July
Au
gu
st
Sep
tem
ber
Oct
ob
er
No
vem
ber
Dec
emb
er
800
600
400
200
0
26PARTICIPATORY RURAL APPRAISAL MANUAL
16. Role Play
Role playing captures the skills, knowledge, experiences and emotions of individuals to act out hypothetical situations in an uncharacteristic and unencumbered fashion. Participants in the role play gain a deeper appreciation of the range of concerns, values, and positions held by other people which can also broaden their perspectives on the issue. Participants are encouraged to
5 . Organize and present a diagrammatic representation to illustrate the pattern of the variable(s) over a specified time period. Commonly, a line graph or bar chart is used to illustrate variations over time. • The following graph illustrates the trend of monthly rainfall patterns in Extension Region 5 in St. Lucia, based on monthly rainfall averages for the period 1989 – 2008.• The representation of the
historical information in the form of a graph or similar illustration is a good discussion aid.
6 . After identifying past and present factors that are contributing to the current trend in performance, a priority grid and constraints analysis could be conducted to estimate the level of influence and impact of the various factors.
7 . Assuming that all or most of the factors will continue to exert an influence for the foreseeable future, an opportunity matrix and a logframe can also aid the process of decision-making about management of these influences in the short, medium and long term.
improvise, interact, communicate, relax and be creative in the dramatization of a given scenario; for example, acting out a controversial issue or a proposed change.
Role playing has no script and acting ability is irrelevant. The following components are important to a role play: • A specified time limit.• Description of the scenario
to be “played out”. • Roles or characters to be dramatized.
27 PARTICIPATORY RURAL APPRAISAL MANUAL
• The story line or plot and subplots.• Face-to-face and eye-to-eye contact.• Trust among members of the “cast”.• People are likely to be a bit reserved
if they are not familiar or comfortable with each other and have not developed a sense of mutual trust.
• Inference(s) to be drawn or lessons to be learnt (the message in the story).
• Participants’ evaluation of the presentation.
— A thorough debriefing must follow a role play to provide participants with the opportunity to assess emerging issues, as well as the rationale for particular stands and decisions taken.
— Exploration of the issues raised and the outcome
Apart from role playing being an interactive and creative way to help people see a problem from another perspective, it also serves to build bridges between people, as it allows them to step out of their typical roles into other uncharacteristic roles. This can sometimes contradict personal values, norms and goals. Participants who have either a difficulty acknowledging
other interests, or appear to favor a particular position or are unable to see the problem in context, need encouragement to become engaged in the process.
Role playing can be very effective in the following situations:• as an ice-breaker• to diffuse conflict or tension • to jump-starts a lifeless group • to help people get to know each
other at meetings or conferences• to bring expert opinion to
bear on a problem• to explore and improve on
interviewing techniquesThe facilitator must provide reassurance and support to participants that may be uncomfortable playing roles that negate their true feelings and real values. Caution must also be taken to kept the session focused on its intended purpose, though the outcome maybe unpredictable. Enthusiasm and interest among participants can be sustained by providing assurance of the link between role play and participation to manage the real issues and decisions at stake.
17. Case Studies
Case studies entail an in-depth investigation of targeted individuals, groups and/or events. A case study may also be a written description of a hypothetical situation that provides scope for analysis and discussion. The goal or purpose of the case study must be clearly defined in order to determine the best way to undertake the specified research.
Steps in conducting a Case Study1 . Clearly define problem statement.2 . Articulate research purpose,
objective(s) and expected outputs.3 . Design the approach to
carrying out the study.a . A blue print to the process of
implementing the case study must take account of the following:— What questions to study?— What data are relevant? — What data to collect?— How to analyze that data?
4 . Determine the tools to be used for data / information capture.
5 . Use participatory data / information analysis tools to structure the findings.
28PARTICIPATORY RURAL APPRAISAL MANUAL
6 . Organize a participatory evaluation session with research subject(s) to review and validate the findings.
7 . Describe answers to the initial set of questions.
Typically, a case study is primarily a qualitative research method that focuses on the subject of the research in order to gain an understanding of the myriad of factors that influence or impact a particular phenomenon or situation. This approach differs from quantitative methods of research, like a survey, which focus on the questions of who, what, where, how much, how many, and archival analysis, which provides a historical context.
Case studies are the preferred strategy when seeking answers to how or why questions. Visualization is especially useful where the majority of persons are illiterate. Pictorial methods such as grids, matrices, charts, maps, role plays, mobile cards and transects are tools that can also be used to build trust, support communication and teamwork. Effective case study analysis requires vigilance to manage the collection of excessive unnecessary data and information. Effective communication, time management and teamwork are essential to case study work which is an unusually iterative process, with much effort devoted to triangulation, and can be quite time consuming.
18. Resource Flow
Resource Flows facilitate a deep understanding of the interactions among components of a farming system. The negation of these relationships often lead to poor “fit” of technologies which can generate increased capacity for agricultural production and enhance productivity.
A farming system, which is the result of a complex interaction of number of interdependent components, is generally driven by the overall goal of security of the farm household’s livelihood. Farming systems are therefore closely linked with livelihood systems managed by farm households, and are a complex combination of resources influenced by environmental, political, and economic, institutional and social factors.
Once the different components of the relevant system are identified, an idea of the potential interactions between components can be gained by tracking the
flow of resources between the different components, in a spatial or temporal fashion. Resources can include land, labour, finance, farm inputs and outputs.
The resource flow diagrams are conceptual models of the spatial dimension of resource transfers within a particular farming system. At the commodity or plot level, the resources of interest are usually nutrients. At the farm level, the resource flows relate to various farm enterprise types. The farm enterprise type is denoted by the commodity that is most profitable or of greatest significance in the opinion of the farmer for her/his household.
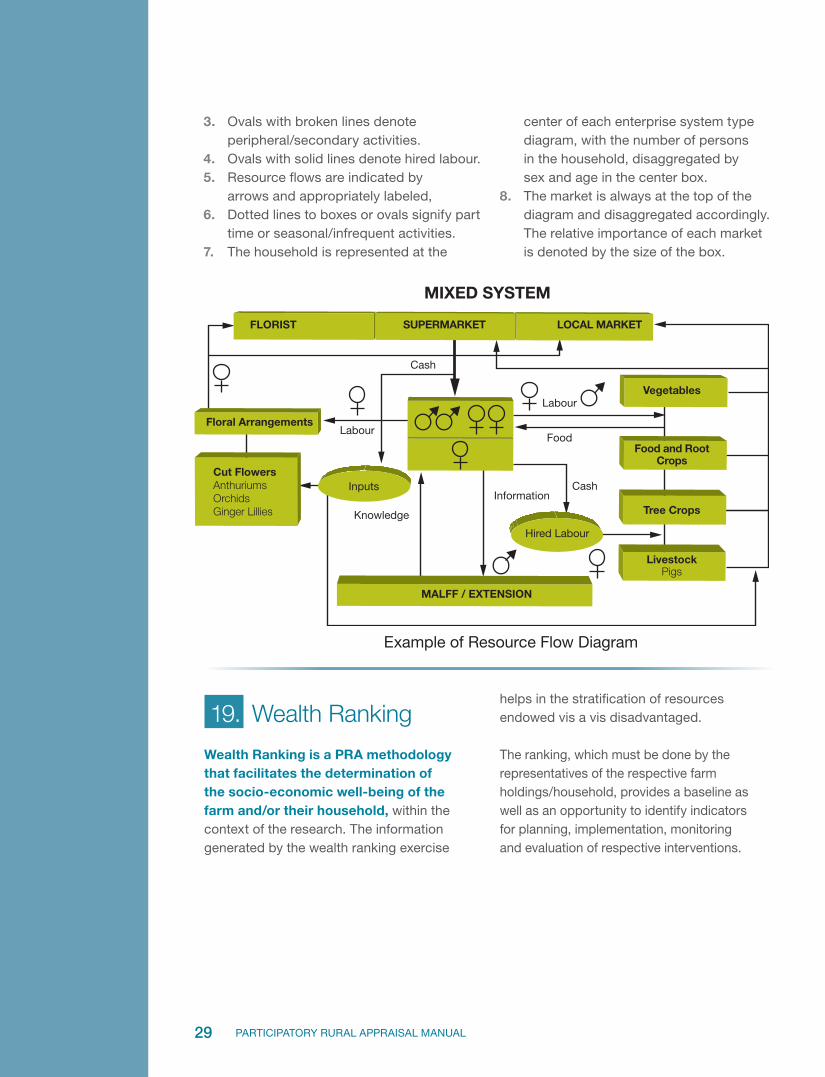
Developing Resource Flow diagram1 . By convention, the relative importance
{in the opinion of the farmer} of an enterprise within the particular farm system is denoted by the size of the box.
2 . Boxes denoting the economic enterprises are placed on the one side and the “subsistence” enterprises on the other.
MIXED SYSTEM
FLORIST
Cash
Cash
Labour
Inputs
Knowledge
Information
Hired Labour
MALFF / EXTENSION
LivestockPigs
Floral Arrangements
Cut FlowersAnthuriumsOrchidsGinger Lillies
LabourVegetables
FoodFood and Root
Crops
Tree Crops
SUPERMARKET LOCAL MARKET
Example of Resource Flow Diagram
29 PARTICIPATORY RURAL APPRAISAL MANUAL
3 . Ovals with broken lines denote peripheral/secondary activities.
4 . Ovals with solid lines denote hired labour.5 . Resource flows are indicated by
arrows and appropriately labeled,6 . Dotted lines to boxes or ovals signify part
time or seasonal/infrequent activities.7 . The household is represented at the
center of each enterprise system type diagram, with the number of persons in the household, disaggregated by sex and age in the center box.
8 . The market is always at the top of the diagram and disaggregated accordingly. The relative importance of each market is denoted by the size of the box.
19. Wealth Ranking
Wealth Ranking is a PRA methodology that facilitates the determination of the socio-economic well-being of the farm and/or their household, within the context of the research. The information generated by the wealth ranking exercise
helps in the stratification of resources endowed vis a vis disadvantaged.
The ranking, which must be done by the representatives of the respective farm holdings/household, provides a baseline as well as an opportunity to identify indicators for planning, implementation, monitoring and evaluation of respective interventions.
30PARTICIPATORY RURAL APPRAISAL MANUAL
Procedures in using Wealth Ranking:8 . Brain storm and list wealth indicators6
or the different features of the farm or household that indicate capacity for advancement.
9 . Categorize the farms or households into rich or resource endowed, average or moderately resourced and poor or poorly resourced. Take note of the processes
6. It must be noted that material possessions may not be the best judge of wealth, since debt in the form of loans and mortgages may not be disclosed and are not easily discernible.
7. Revenue less expenses equates to net earnings.
and the difficulties encountered as well as the lessons learnt in conducting the wealth ranking exercise.
Appendix 6 describes the use of the wealth ranking methodology to determine the farmers’ ability to effectively manage their land and to carry out the practices that favour plant health and soil nutrition/management.
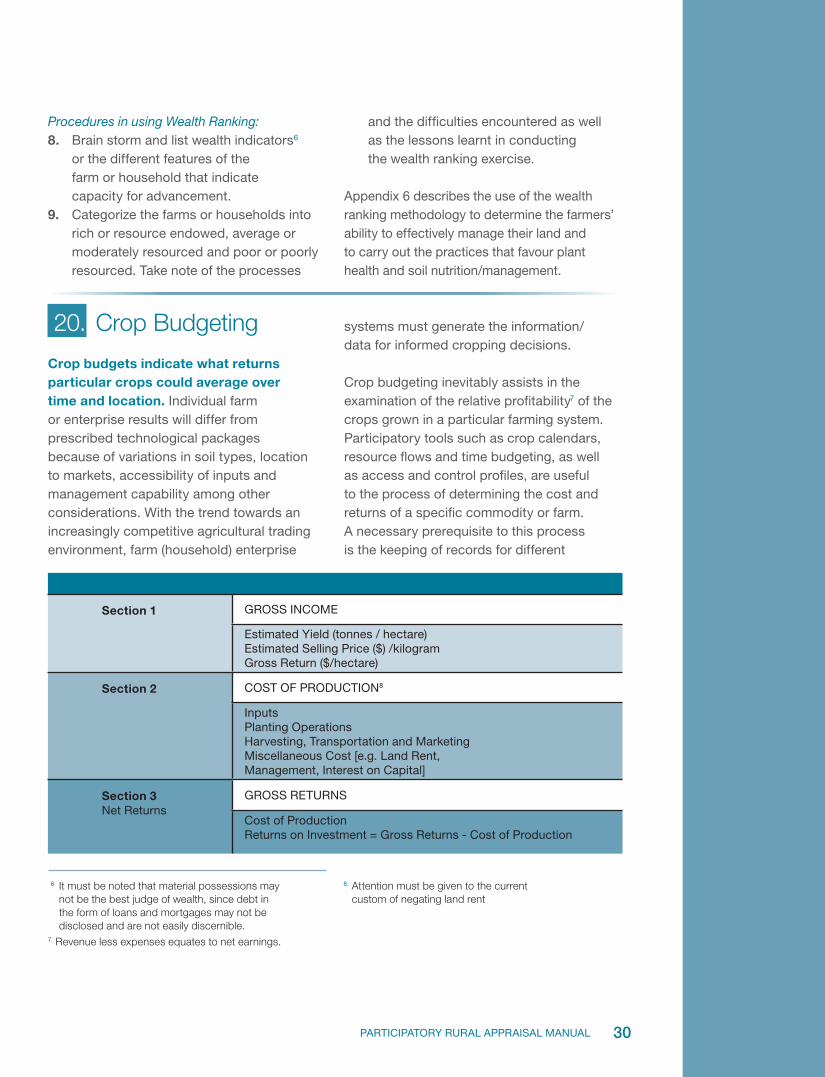
20. Crop Budgeting
Crop budgets indicate what returns particular crops could average over time and location. Individual farm or enterprise results will differ from prescribed technological packages because of variations in soil types, location to markets, accessibility of inputs and management capability among other considerations. With the trend towards an increasingly competitive agricultural trading environment, farm (household) enterprise
systems must generate the information/data for informed cropping decisions.
Crop budgeting inevitably assists in the examination of the relative profitability7 of the crops grown in a particular farming system. Participatory tools such as crop calendars, resource flows and time budgeting, as well as access and control profiles, are useful to the process of determining the cost and returns of a specific commodity or farm. A necessary prerequisite to this process is the keeping of records for different
Section 1 GROSS INCOME
Estimated Yield (tonnes / hectare)Estimated Selling Price ($) /kilogramGross Return ($/hectare)
Section 2 COST OF PRODUCTION8
InputsPlanting OperationsHarvesting, Transportation and MarketingMiscellaneous Cost [e.g. Land Rent, Management, Interest on Capital]
Section 3Net Returns
GROSS RETURNS
Cost of ProductionReturns on Investment = Gross Returns - Cost of Production
8. Attention must be given to the current custom of negating land rent
31 PARTICIPATORY RURAL APPRAISAL MANUAL
categories of farm (household) expenditure and income. Crop budget formats vary. Some are complex, others are relatively simple. The following outlines the sections of the template used to derive the budgets which are summarized in Appendix 7.
Crop budgeting gives a reflection of the level of technology employed and provides scope for an assessment of options that could inform the level of production and productivity. As evident in Appendix 7, the use of a matrix allows comparisons
of expenditure and income from various production and marketing activities as it relates to the cultivation of various crops.
Crop budgets also allow for an assessment of the level of investment in improved commodity production and marketing technologies, for example: irrigation and packaging. In conjunction with the constraints / opportunity analyses tool, crop budgets reveal the level of efficiency and efficacy within the farming systems and the opportunities for sustainable farming systems and livelihood approaches.
32PARTICIPATORY RURAL APPRAISAL MANUAL
ConclusionThe PRA emphasizes flexible learning which is adaptable to the pace set by the learners and trainers and tailored to needs expressed by the participants themselves in order to enable development practitioners, government officials, and local people to work together to plan context appropriate programmes. There is no argument that the PRA tools described in this manual faciliate a process of information sharing, analysis, and action among stakeholders. The 20 participatory techniques elaborated in this manual can therefore help to ‘break the silence’ of the poor and disadvantaged segments of our society. Furthermore, PRA recognizes the value of popular collective knowledge and wisdom and legitimizes the knowledge and information shared by the people themselves.
Invariably, the myriad of constraints emerging from any PRA exercise, signal symptoms of deep seated inefficiencies at the policy, institutional and farm levels. Inevitably, this makes the call for the development of a rational programme that engages all key actors in a process that considers the varied realities, perspectives and aspirations of stakeholders. Towards this end, farmers must be encouraged to take ownership of the change process that is geared towards the realization of economically justifiable, socially acceptable and environmentally sound agricultural production systems. Consequently, participatory programming provides scope for the unlocking of potential competence and optimizing available resource use in order to improve plant nutrition and plant health; while safeguarding the integrity of the scarce land resource base in St. Lucia.
32PARTICIPATORY RURAL APPRAISAL MANUAL
33 PARTICIPATORY RURAL APPRAISAL MANUAL
References1 . FAO. 2000. Guidelines for Participatory
Diagnosis of Constraints and Opportunities for Soil and Plant Nutrient Management - FAO Publication: AGL/MISC/30/2000.
2 . FAO. 2000. Training Manual on Training in Participatory Rural Appraisal for Front Line Extension Officers in the Ministry of Agriculture, Fisheries and Forestry - FAO / University of Florida publication, June 2000, June 2005.
3 . Ministry of Agriculture, Lands, Forestry and Fisheries, St. Lucia Policy Brief (Draft) – National Agricultural Policy [2009 – 2015]
4 . FAO. ECLAC. 2005: Agricultural Transformation and Gender Considerations in Caribbean Economies - FAO/ECLAC publication prepared by Rufina Paul, December 2005, (available at http://www.eclac.cl/publicaciones/xml/1/26011/R.85.pdf.)

34PARTICIPATORY RURAL APPRAISAL MANUAL
Appendices
34PARTICIPATORY RURAL APPRAISAL MANUAL
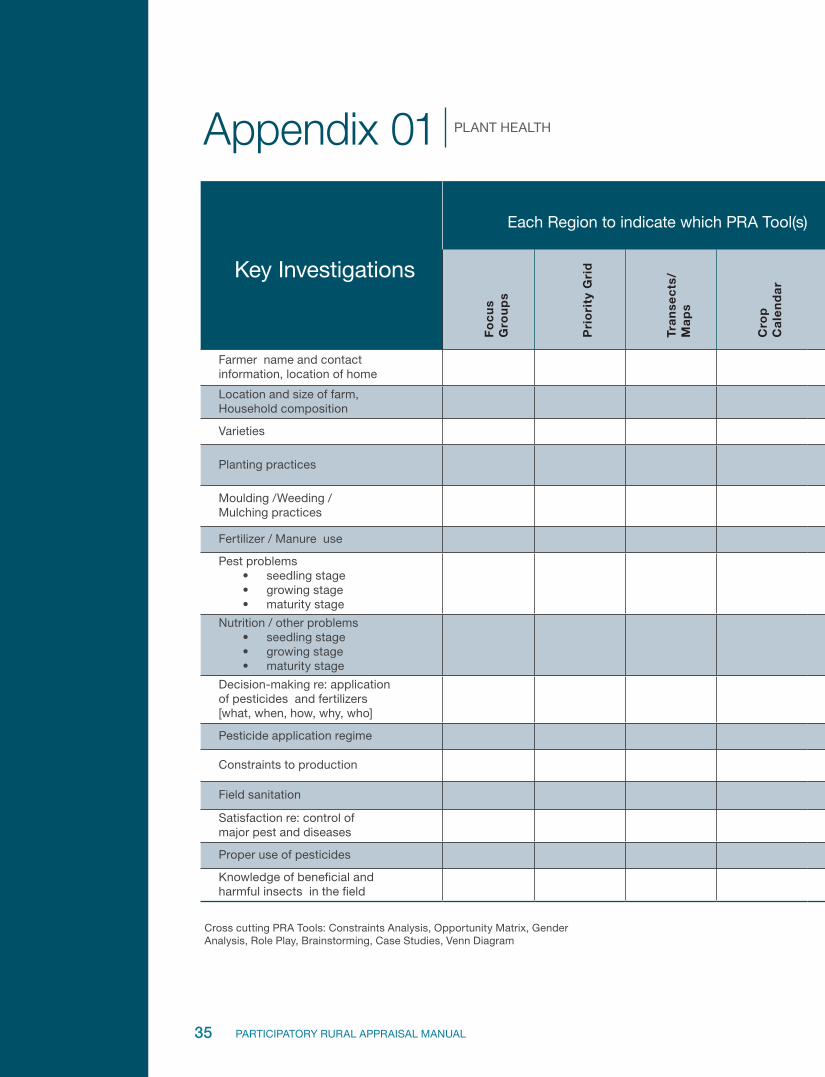
35 PARTICIPATORY RURAL APPRAISAL MANUAL
Key Investigations
Each Region to indicate which PRA Tool(s) are applicable in respect of each key area of investigation during the PRA Exercise
Fo
cu
s G
rou
ps
Pri
ori
ty G
rid
Tra
nse
cts
/ M
ap
s
Cro
p
Ca
len
da
r
Sta
ke
ho
lde
r A
na
lysi
s
Tre
nd
A
na
lysi
s
Re
sou
rce
Flo
ws
Ac
ce
ss a
nd
C
on
tro
l P
rofi
les
Cro
p
Bu
dg
eti
ng
Fa
rm /
R
eso
urc
e /
M
ap
pin
g
Sta
ke
ho
lde
r A
na
lysi
s
Farmer name and contact information, location of home
Location and size of farm, Household composition
Varieties
Planting practices
Moulding /Weeding / Mulching practices
Fertilizer / Manure use
Pest problems• seedling stage• growing stage• maturity stage
Nutrition / other problems• seedling stage• growing stage• maturity stage
Decision-making re: application of pesticides and fertilizers [what, when, how, why, who]
Pesticide application regime
Constraints to production
Field sanitation
Satisfaction re: control of major pest and diseases
Proper use of pesticides
Knowledge of beneficial and harmful insects in the field
Appendix 01 PLANT HEALTH
Cross cutting PRA Tools: Constraints Analysis, Opportunity Matrix, Gender Analysis, Role Play, Brainstorming, Case Studies, Venn Diagram
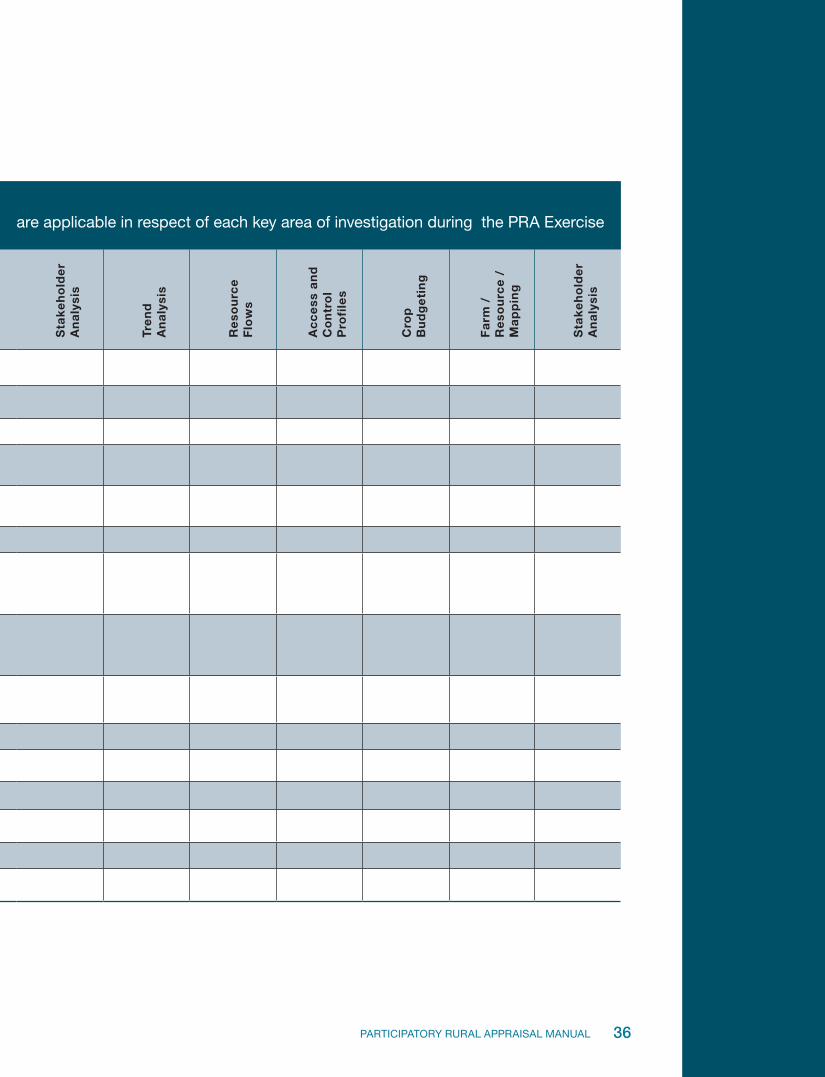
36PARTICIPATORY RURAL APPRAISAL MANUAL
Key Investigations
Each Region to indicate which PRA Tool(s) are applicable in respect of each key area of investigation during the PRA Exercise
Fo
cu
s G
rou
ps
Pri
ori
ty G
rid
Tra
nse
cts
/ M
ap
s
Cro
p
Ca
len
da
r
Sta
ke
ho
lde
r A
na
lysi
s
Tre
nd
A
na
lysi
s
Re
sou
rce
Flo
ws
Ac
ce
ss a
nd
C
on
tro
l P
rofi
les
Cro
p
Bu
dg
eti
ng
Fa
rm /
R
eso
urc
e /
M
ap
pin
g
Sta
ke
ho
lde
r A
na
lysi
s
Farmer name and contact information, location of home
Location and size of farm, Household composition
Varieties
Planting practices
Moulding /Weeding / Mulching practices
Fertilizer / Manure use
Pest problems• seedling stage• growing stage• maturity stage
Nutrition / other problems• seedling stage• growing stage• maturity stage
Decision-making re: application of pesticides and fertilizers [what, when, how, why, who]
Pesticide application regime
Constraints to production
Field sanitation
Satisfaction re: control of major pest and diseases
Proper use of pesticides
Knowledge of beneficial and harmful insects in the field
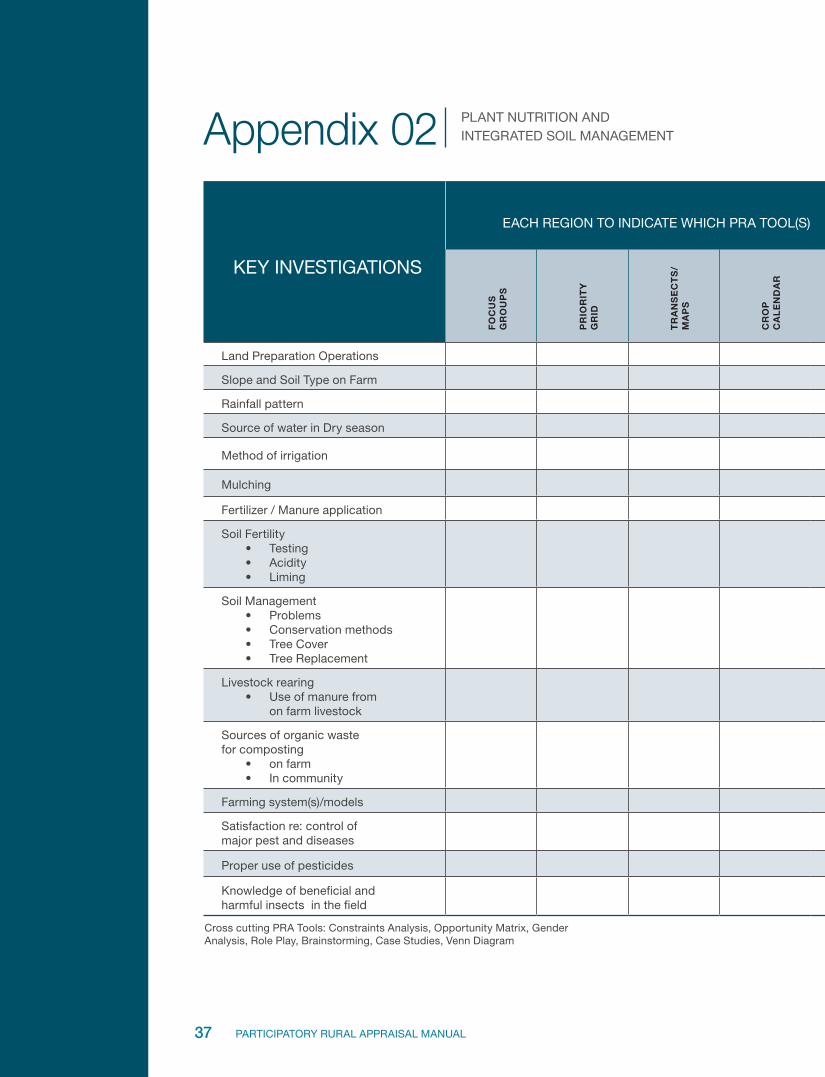
37 PARTICIPATORY RURAL APPRAISAL MANUAL
KEY INVESTIGATIONS
EACH REGION TO INDICATE WHICH PRA TOOL(S) ARE APPLICABLE IN RESPECT OF EACH KEY AREA OF INVESTIGATION DURING THE PRA EXERCISE
FO
CU
S
GR
OU
PS
PR
IOR
ITY
G
RID
TR
AN
SE
CT
S/
MA
PS
CR
OP
C
AL
EN
DA
R
STA
KE
HO
LD
ER
A
NA
LYS
IS
TR
EN
D
AN
ALY
SIS
RE
SO
UR
CE
F
LO
WS
AC
CE
SS
AN
D
CO
NT
RO
L P
RO
FIL
ES
CR
OP
B
UD
GE
TIN
G
FAR
M /
R
ES
OU
RC
E /
M
AP
PIN
G
STA
KE
HO
LD
ER
A
NA
LYS
IS
Land Preparation Operations
Slope and Soil Type on Farm
Rainfall pattern
Source of water in Dry season
Method of irrigation
Mulching
Fertilizer / Manure application
Soil Fertility• Testing• Acidity• Liming
Soil Management • Problems• Conservation methods• Tree Cover• Tree Replacement
Livestock rearing• Use of manure from
on farm livestock
Sources of organic waste for composting
• on farm• In community
Farming system(s)/models
Satisfaction re: control of major pest and diseases
Proper use of pesticides
Knowledge of beneficial and harmful insects in the field
Appendix 02 PLANT NUTRITION AND INTEGRATED SOIL MANAGEMENT
Cross cutting PRA Tools: Constraints Analysis, Opportunity Matrix, Gender Analysis, Role Play, Brainstorming, Case Studies, Venn Diagram
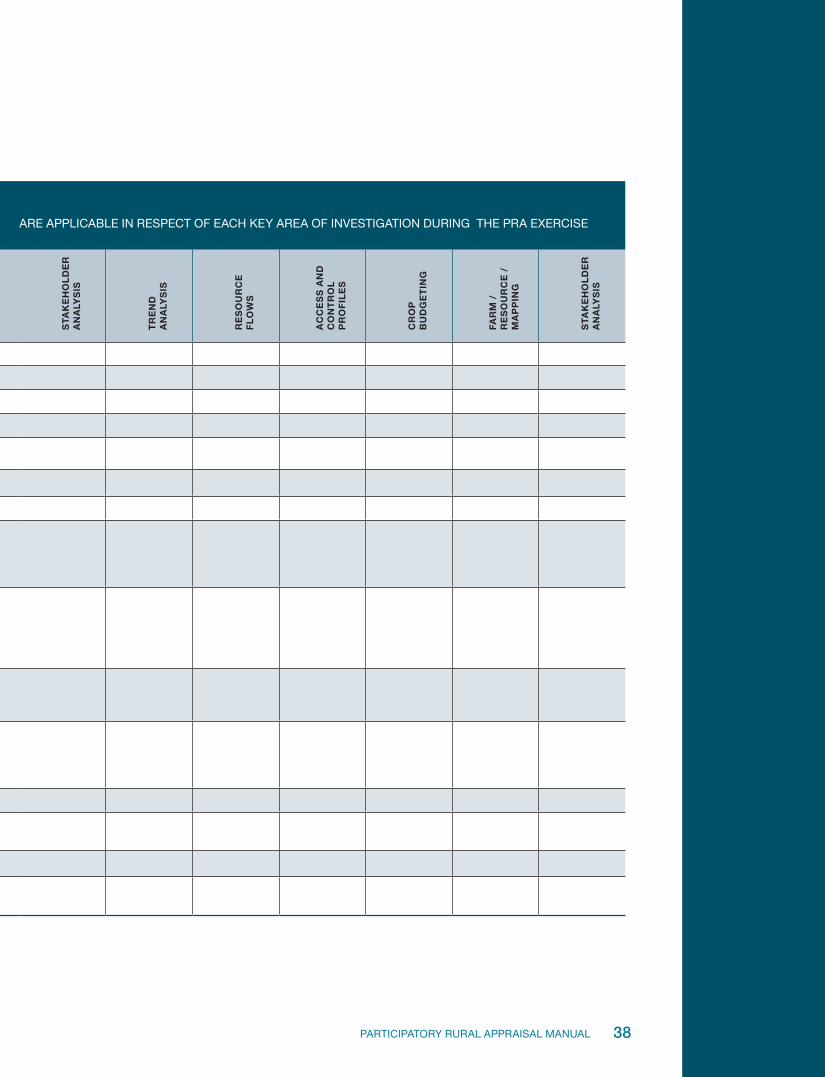
38PARTICIPATORY RURAL APPRAISAL MANUAL
KEY INVESTIGATIONS
EACH REGION TO INDICATE WHICH PRA TOOL(S) ARE APPLICABLE IN RESPECT OF EACH KEY AREA OF INVESTIGATION DURING THE PRA EXERCISE
FO
CU
S
GR
OU
PS
PR
IOR
ITY
G
RID
TR
AN
SE
CT
S/
MA
PS
CR
OP
C
AL
EN
DA
R
STA
KE
HO
LD
ER
A
NA
LYS
IS
TR
EN
D
AN
ALY
SIS
RE
SO
UR
CE
F
LO
WS
AC
CE
SS
AN
D
CO
NT
RO
L P
RO
FIL
ES
CR
OP
B
UD
GE
TIN
G
FAR
M /
R
ES
OU
RC
E /
M
AP
PIN
G
STA
KE
HO
LD
ER
A
NA
LYS
IS
Land Preparation Operations
Slope and Soil Type on Farm
Rainfall pattern
Source of water in Dry season
Method of irrigation
Mulching
Fertilizer / Manure application
Soil Fertility• Testing• Acidity• Liming
Soil Management • Problems• Conservation methods• Tree Cover• Tree Replacement
Livestock rearing• Use of manure from
on farm livestock
Sources of organic waste for composting
• on farm• In community
Farming system(s)/models
Satisfaction re: control of major pest and diseases
Proper use of pesticides
Knowledge of beneficial and harmful insects in the field
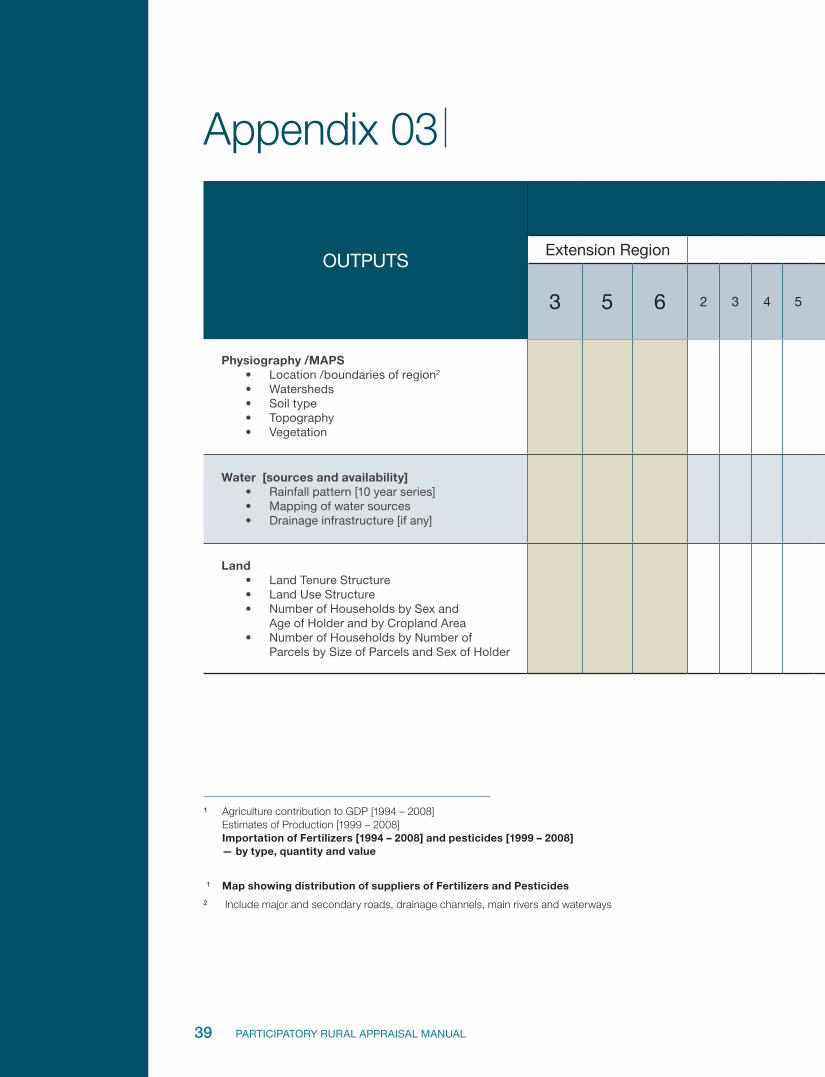
39 PARTICIPATORY RURAL APPRAISAL MANUAL
OUTPUTS
PRA PROCESS1
Extension Region June July
3 5 6 2 3 4 5 8 9 10 11 12 15 16 17 18 19 22 23 24 25 26 29 30 1 2
Physiography /MAPS• Location /boundaries of region2
• Watersheds • Soil type • Topography• Vegetation
Water [sources and availability]• Rainfall pattern [10 year series]• Mapping of water sources • Drainage infrastructure [if any]
Land• Land Tenure Structure• Land Use Structure• Number of Households by Sex and
Age of Holder and by Cropland Area• Number of Households by Number of
Parcels by Size of Parcels and Sex of Holder
1 Agriculture contribution to GDP [1994 – 2008] Estimates of Production [1999 – 2008] Importation of Fertilizers [1994 – 2008] and pesticides [1999 – 2008] — by type, quantity and value
1 Map showing distribution of suppliers of Fertilizers and Pesticides
2 Include major and secondary roads, drainage channels, main rivers and waterways
Appendix 03
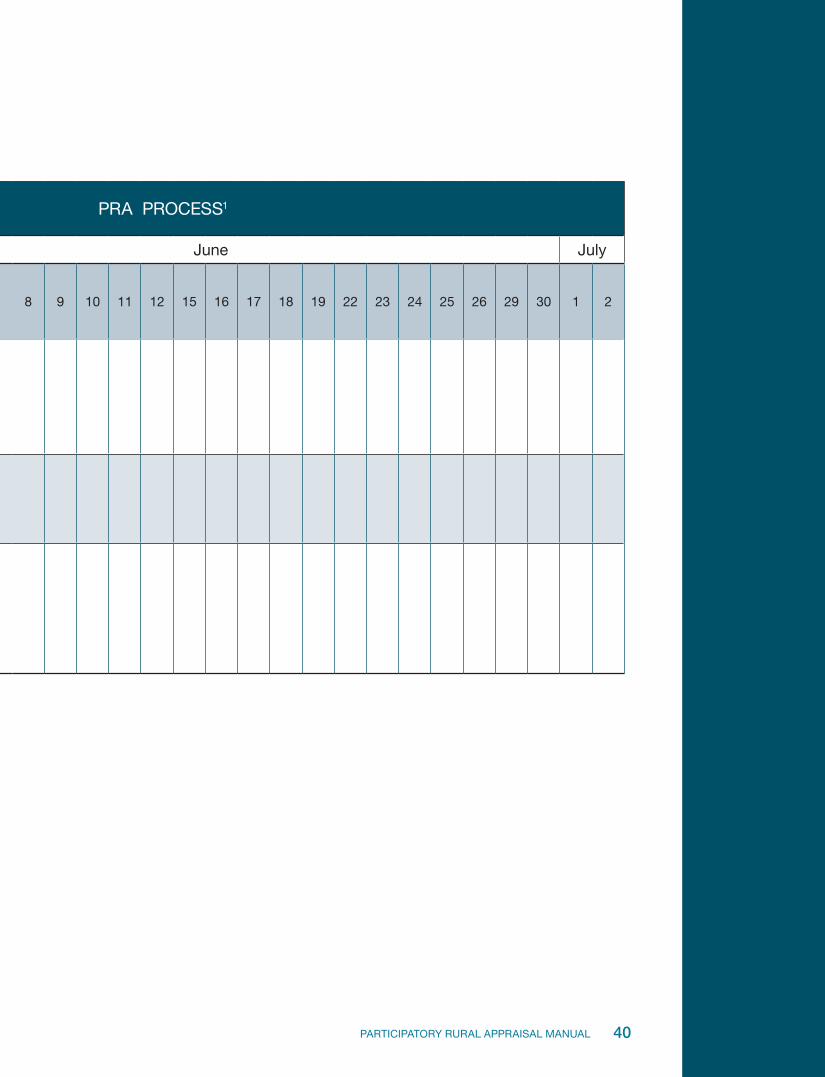
40PARTICIPATORY RURAL APPRAISAL MANUAL
OUTPUTS
PRA PROCESS1
Extension Region June July
3 5 6 2 3 4 5 8 9 10 11 12 15 16 17 18 19 22 23 24 25 26 29 30 1 2
Physiography /MAPS• Location /boundaries of region2
• Watersheds • Soil type • Topography• Vegetation
Water [sources and availability]• Rainfall pattern [10 year series]• Mapping of water sources • Drainage infrastructure [if any]
Land• Land Tenure Structure• Land Use Structure• Number of Households by Sex and
Age of Holder and by Cropland Area• Number of Households by Number of
Parcels by Size of Parcels and Sex of Holder
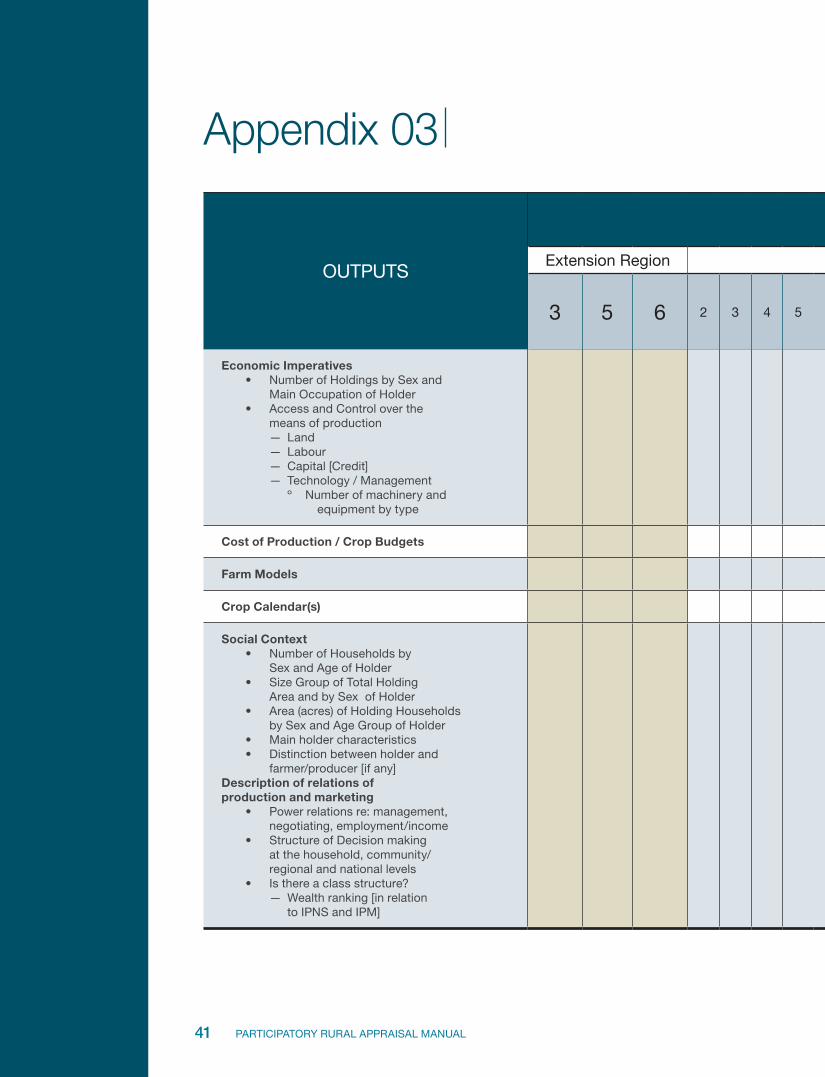
41 PARTICIPATORY RURAL APPRAISAL MANUAL
OUTPUTS
PRA PROCESS1
Extension Region June July
3 5 6 2 3 4 5 8 9 10 11 12 15 16 17 18 19 22 23 24 25 26 29 30 1 2
Economic Imperatives• Number of Holdings by Sex and
Main Occupation of Holder• Access and Control over the
means of production — Land— Labour— Capital [Credit] — Technology / Management
º Number of machinery and equipment by type
Cost of Production / Crop Budgets
Farm Models
Crop Calendar(s)
Social Context • Number of Households by
Sex and Age of Holder • Size Group of Total Holding
Area and by Sex of Holder • Area (acres) of Holding Households
by Sex and Age Group of Holder• Main holder characteristics• Distinction between holder and
farmer/producer [if any]Description of relations of production and marketing
• Power relations re: management, negotiating, employment/income
• Structure of Decision making at the household, community/regional and national levels
• Is there a class structure?— Wealth ranking [in relation
to IPNS and IPM]
Appendix 03
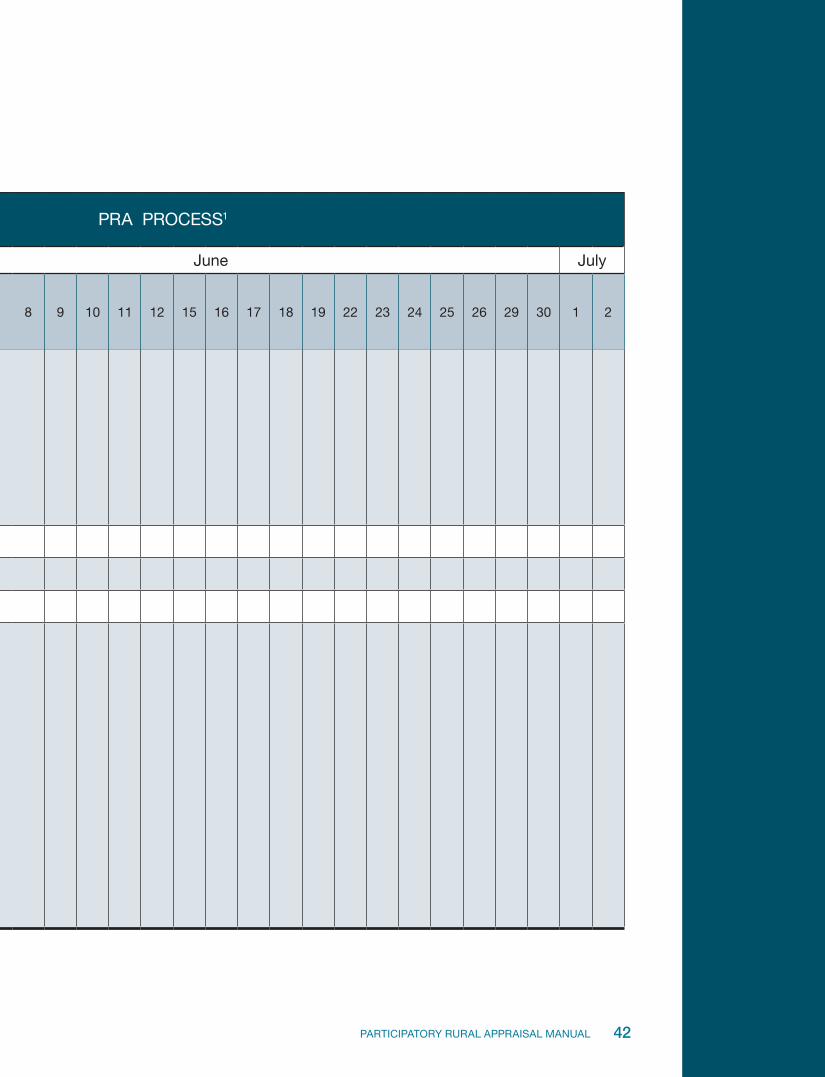
42PARTICIPATORY RURAL APPRAISAL MANUAL
OUTPUTS
PRA PROCESS1
Extension Region June July
3 5 6 2 3 4 5 8 9 10 11 12 15 16 17 18 19 22 23 24 25 26 29 30 1 2
Economic Imperatives• Number of Holdings by Sex and
Main Occupation of Holder• Access and Control over the
means of production — Land— Labour— Capital [Credit] — Technology / Management
º Number of machinery and equipment by type
Cost of Production / Crop Budgets
Farm Models
Crop Calendar(s)
Social Context • Number of Households by
Sex and Age of Holder • Size Group of Total Holding
Area and by Sex of Holder • Area (acres) of Holding Households
by Sex and Age Group of Holder• Main holder characteristics• Distinction between holder and
farmer/producer [if any]Description of relations of production and marketing
• Power relations re: management, negotiating, employment/income
• Structure of Decision making at the household, community/regional and national levels
• Is there a class structure?— Wealth ranking [in relation
to IPNS and IPM]
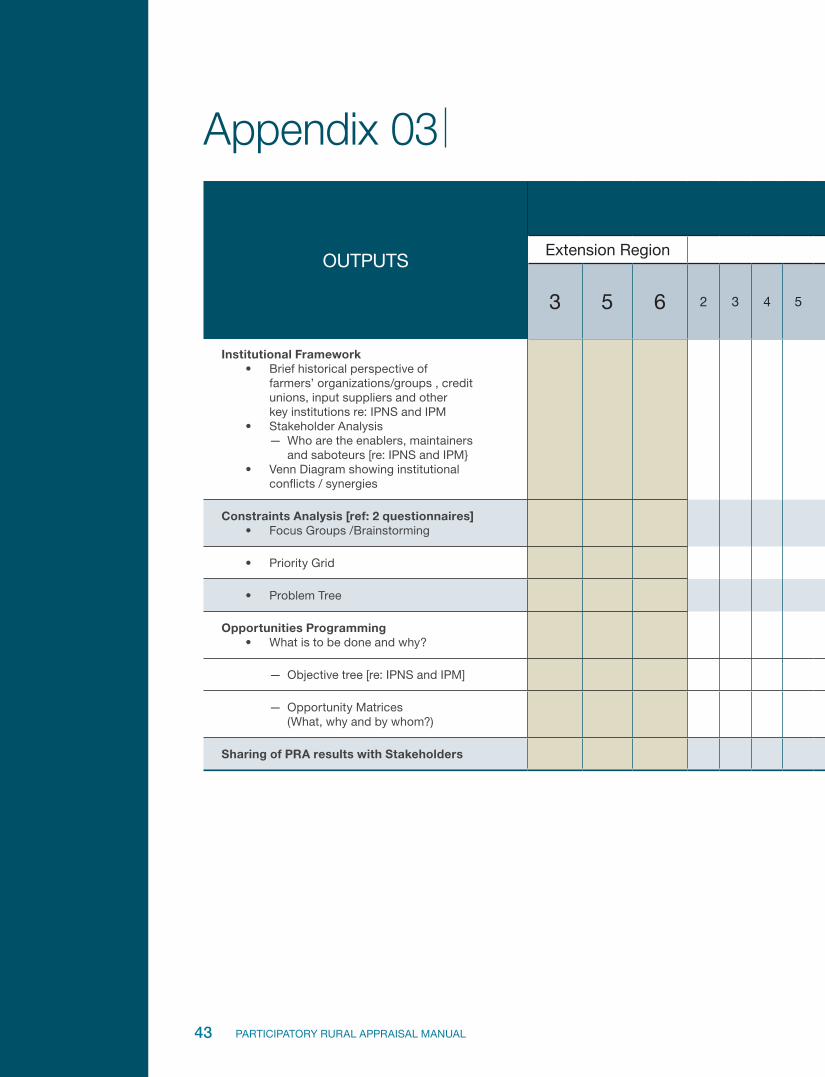
43 PARTICIPATORY RURAL APPRAISAL MANUAL
OUTPUTS
PRA PROCESS1
Extension Region June July
3 5 6 2 3 4 5 8 9 10 11 12 15 16 17 18 19 22 23 24 25 26 29 30 1 2
Institutional Framework• Brief historical perspective of
farmers’ organizations/groups , credit unions, input suppliers and other key institutions re: IPNS and IPM
• Stakeholder Analysis— Who are the enablers, maintainers
and saboteurs [re: IPNS and IPM}• Venn Diagram showing institutional
conflicts / synergies
Constraints Analysis [ref: 2 questionnaires]• Focus Groups /Brainstorming
• Priority Grid
• Problem Tree
Opportunities Programming • What is to be done and why?
— Objective tree [re: IPNS and IPM]
— Opportunity Matrices (What, why and by whom?)
Sharing of PRA results with Stakeholders
Appendix 03
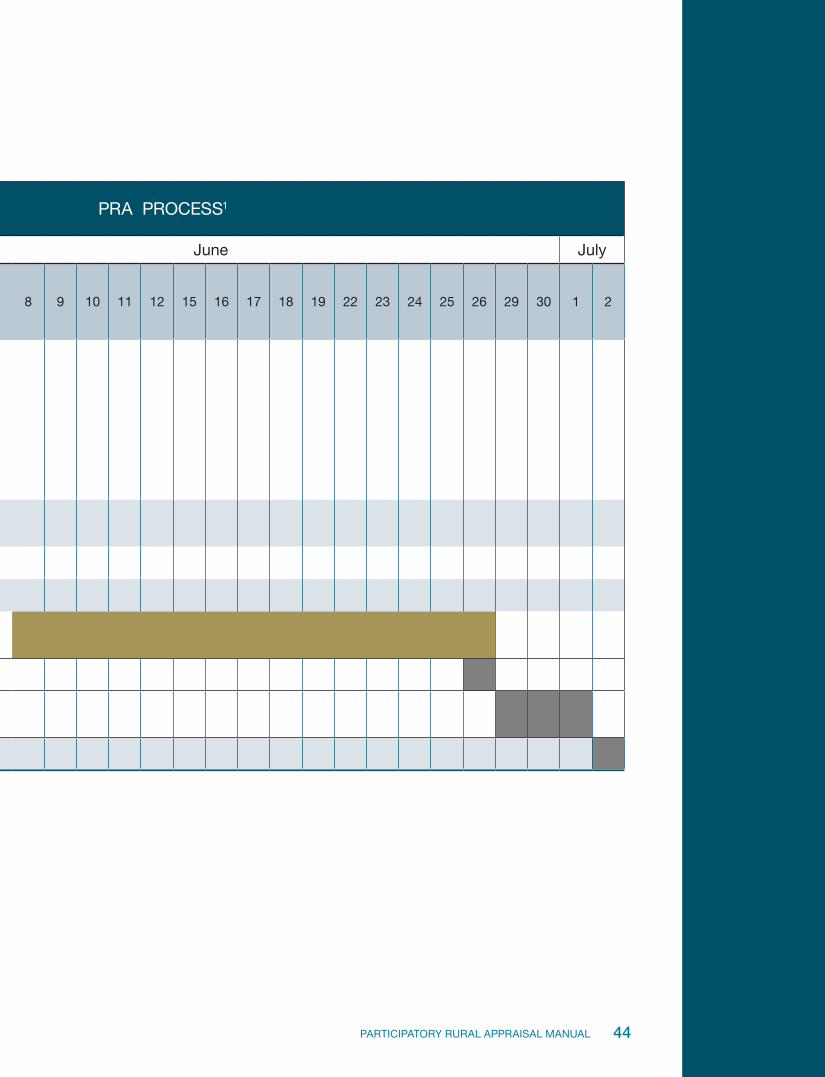
44PARTICIPATORY RURAL APPRAISAL MANUAL
OUTPUTS
PRA PROCESS1
Extension Region June July
3 5 6 2 3 4 5 8 9 10 11 12 15 16 17 18 19 22 23 24 25 26 29 30 1 2
Institutional Framework• Brief historical perspective of
farmers’ organizations/groups , credit unions, input suppliers and other key institutions re: IPNS and IPM
• Stakeholder Analysis— Who are the enablers, maintainers
and saboteurs [re: IPNS and IPM}• Venn Diagram showing institutional
conflicts / synergies
Constraints Analysis [ref: 2 questionnaires]• Focus Groups /Brainstorming
• Priority Grid
• Problem Tree
Opportunities Programming • What is to be done and why?
— Objective tree [re: IPNS and IPM]
— Opportunity Matrices (What, why and by whom?)
Sharing of PRA results with Stakeholders
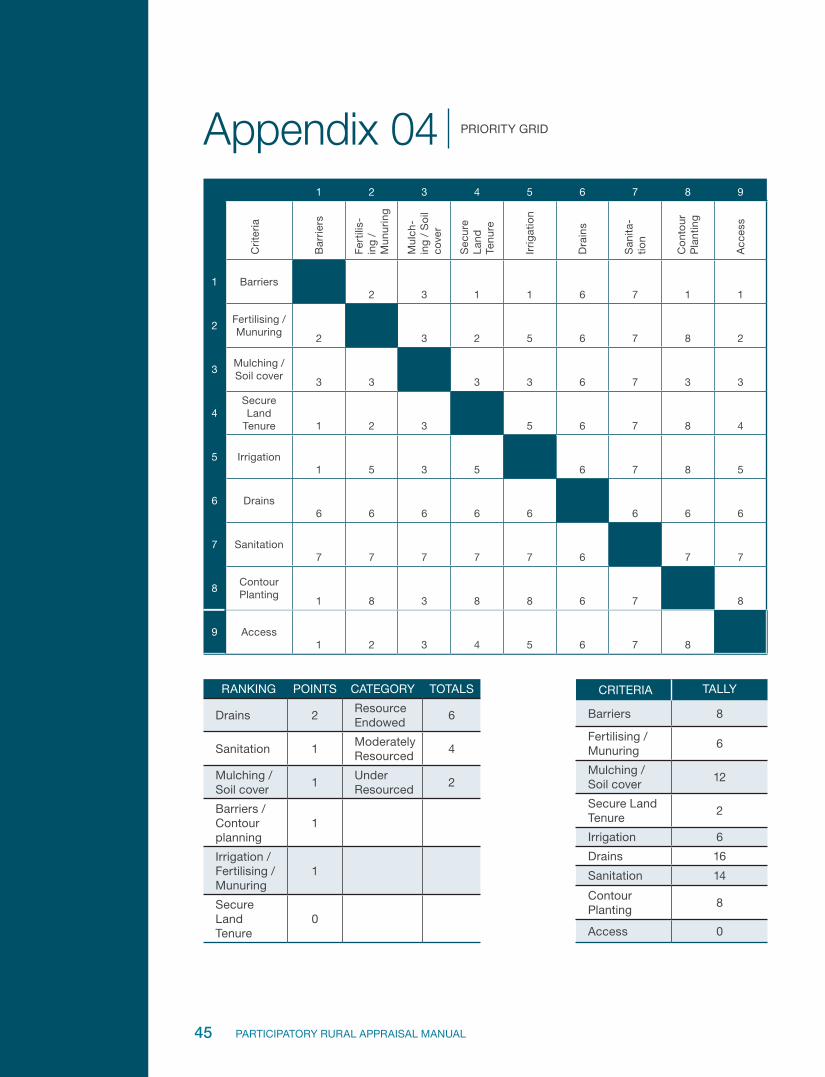
45 PARTICIPATORY RURAL APPRAISAL MANUAL
1 2 3 4 5 6 7 8 9
Cri
teri
a
Bar
rier
s
Fert
ilis-
ing
/ M
unur
ing
Mul
ch-
ing
/ S
oil
cove
r
Sec
ure
Lan
d
Tenu
re
Irri
gat
ion
Dra
ins
San
ita-
tion
Co
nto
ur
Pla
ntin
g
Acc
ess
1 Barriers2 3 1 1 6 7 1 1
2Fertilising / Munuring
2 3 2 5 6 7 8 2
3Mulching / Soil cover
3 3 3 3 6 7 3 3
4Secure Land
Tenure 1 2 3 5 6 7 8 4
5 Irrigation1 5 3 5 6 7 8 5
6 Drains6 6 6 6 6 6 6 6
7 Sanitation7 7 7 7 7 6 7 7
8Contour Planting
1 8 3 8 8 6 7 8
9 Access1 2 3 4 5 6 7 8
Appendix 04 PRIORITY GRID
RANKING POINTS CATEGORY TOTALS
Drains 2Resource Endowed
6
Sanitation 1Moderately Resourced
4
Mulching / Soil cover
1Under Resourced
2
Barriers / Contour planning
1
Irrigation / Fertilising / Munuring
1
Secure Land Tenure
0
CRITERIA: TALLY
Barriers 8
Fertilising / Munuring
6
Mulching / Soil cover
12
Secure Land Tenure
2
Irrigation 6
Drains 16
Sanitation 14
Contour Planting
8
Access 0
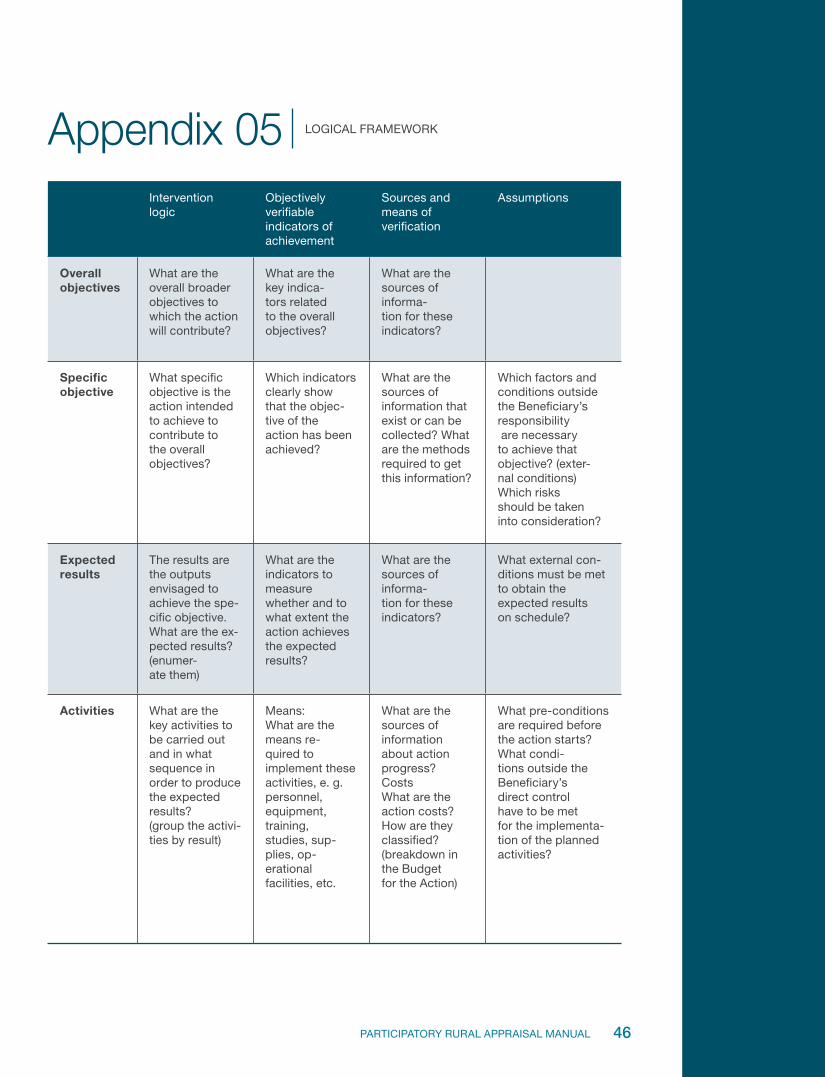
46PARTICIPATORY RURAL APPRAISAL MANUAL
Appendix 05 LOGICAL FRAMEWORK
Interventionlogic
Objectively verifiableindicators of achievement
Sources and means ofverification
Assumptions
Overallobjectives
What are the overall broaderobjectives to which the actionwill contribute?
What are the key indica-tors relatedto the overall objectives?
What are the sources ofinforma-tion for these indicators?
Specificobjective
What specific objective is theaction intended to achieve tocontribute to the overall objectives?
Which indicators clearly showthat the objec-tive of theaction has been achieved?
What are the sources ofinformation that exist or can becollected? What are the methodsrequired to get this information?
Which factors and conditions outsidethe Beneficiary’s responsibility are necessary to achieve thatobjective? (exter-nal conditions)Which risks should be takeninto consideration?
Expectedresults
The results are the outputs envisaged toachieve the spe-cific objective.What are the ex-pected results?(enumer-ate them)
What are the indicators to measurewhether and to what extent theaction achieves the expectedresults?
What are the sources ofinforma-tion for these indicators?
What external con-ditions must be metto obtain the expected resultson schedule?
Activities What are the key activities to be carried outand in what sequence in order to producethe expected results?(group the activi-ties by result)
Means:What are the means re-quired toimplement these activities, e. g.personnel, equipment, training,studies, sup-plies, op-erationalfacilities, etc.
What are the sources ofinformation about actionprogress?CostsWhat are the action costs?How are they classified?(breakdown in the Budget for the Action)
What pre-conditions are required beforethe action starts?What condi-tions outside the Beneficiary’sdirect control have to be metfor the implementa-tion of the plannedactivities?

47 PARTICIPATORY RURAL APPRAISAL MANUAL

48PARTICIPATORY RURAL APPRAISAL MANUAL

49 PARTICIPATORY RURAL APPRAISAL MANUAL

50PARTICIPATORY RURAL APPRAISAL MANUAL