
Ppt seminar
59
-
Upload
jau-junagadh-gujarat-india -
Category
Data & Analytics
-
view
32 -
download
1
Transcript of Ppt seminar


“Effect of Chemical Composition of Plant Residues on Nitrogen Mineralization in
Soil”
Presented By:Vikram Singh
M.Sc. (Agri.) Soil Science studentReg. No: 2010115095
Major Guide :Dr. J. N. Nariya
ProfessorDept. of Agril. Chem. and
Soil ScienceJAU , Amreli
Minor Guide: Dr. P. K. Chovatia
Associate ProfessorDepartment of Agronomy
JAU , Junagadh
3
Contents…Introduction
Facts about nitrogen
Transformation of nitrogen in soil
Chemical composition of plant residues
Decomposition rates of crop residues
Research finding
Conclusion
Use of plant residues as organic nutrient source is relatively simple for the farmers compared to the application of manure. Incorporating plant residues into agricultural soils can sustain organic carbon content, improve soil physical properties, enhance biological activities and increase nutrient availability.In the short-term, incorporation of plant residues provides the energy and nutrients for microbial growth and activity, acts as a driving force for the mineralization-immobilization processes in the soil and is a source of nitrogen (N) for plants .In the long-term, incorporation of crop residues is important for the maintenance of organic C and N stocks in the nutrient pool of arable soils. The N availability from these residues depends on the amount of N mineralized or immobilized during decomposition.
4
Introduction
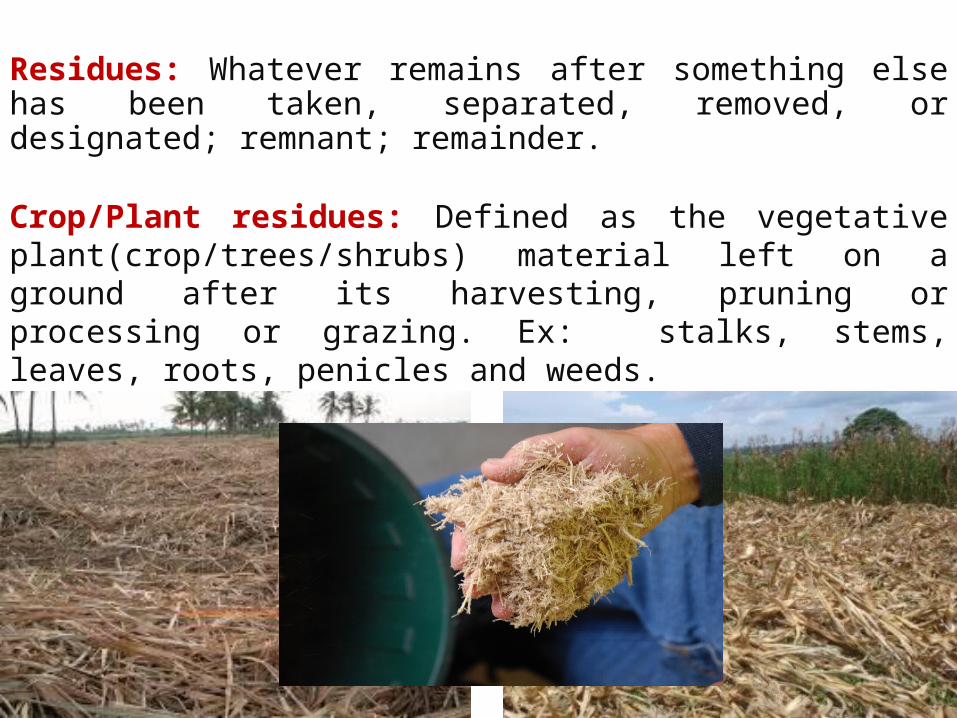
Residues: Whatever remains after something else has been taken, separated, removed, or designated; remnant; remainder.
Crop/Plant residues: Defined as the vegetative plant(crop/trees/shrubs) material left on a ground after its harvesting, pruning or processing or grazing. Ex: stalks, stems, leaves, roots, penicles and weeds.
5
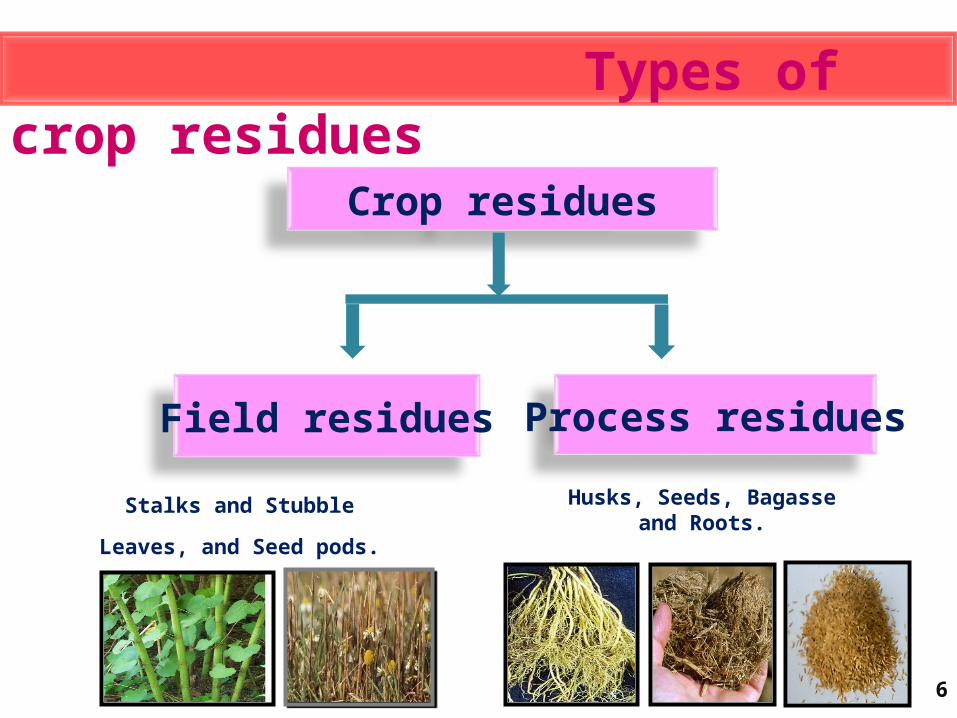
Crop residues
Field residues Process residues
Types of crop residues
Stalks and Stubble Leaves, and Seed pods.
Husks, Seeds, Bagasse and Roots.
6
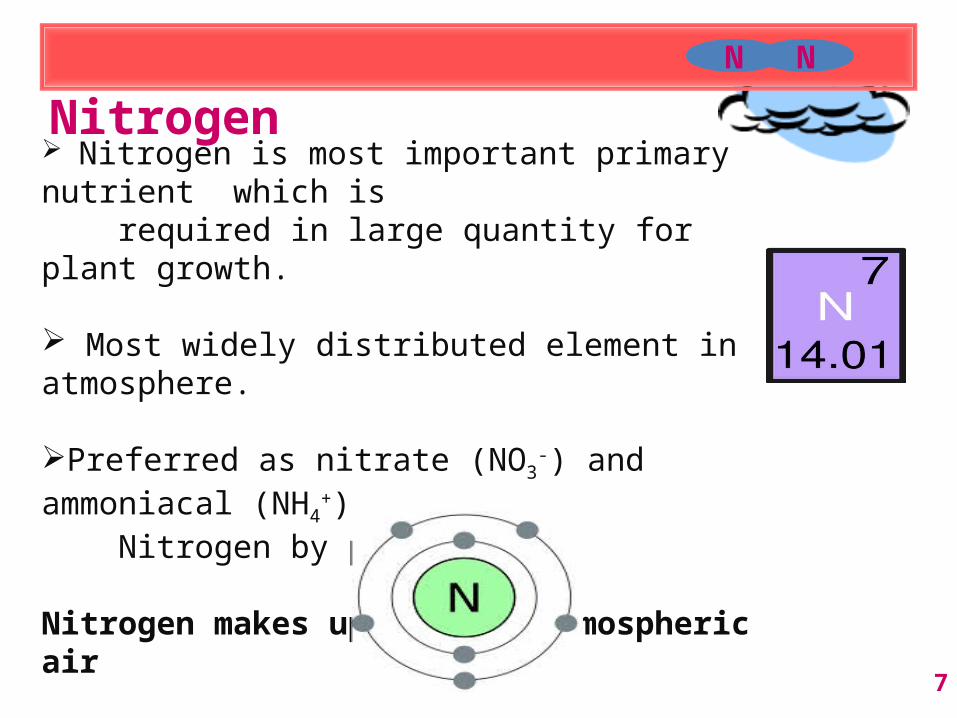
Nitrogen
Nitrogen is most important primary nutrient which is required in large quantity for plant growth.
Most widely distributed element in atmosphere.
Preferred as nitrate (NO3-) and ammoniacal (NH4
+) Nitrogen by plants.
Nitrogen makes up 78 % of atmospheric air
N N
7

Very small amount of soil nitrogen is available to plants. Total nitrogen in furrow slice(0-15 cm) soils generally varies from 0.02 to 0.44 per cent by weight.
Role of NitrogenAn essential constituent of proteins and is present in many compounds of great physiological importance in plant metabolism
Is an integral part of chlorophyll.
Imparts vigorous vegetative growth and dark green colour to plants.
Governs utilization of potassium, phosphorus and other elements.
Facts about nitrogen
8

Sources of Nitrogen :• Fertilizers• Organic manures• Plant residues• Bio-fertilizers• Green manure• Rain water• Bacterial nitrogen fixation
9

Transformation of Nitrogen in soils
Various pathways of N transformation
Mineralization
Immobilization
Fixation in soil
Losses of N( Volatilization)
• Nitrogen in crop residue become available after mineralization
• Available nitrogen includes NH4+ and NO3
-
10
Mineralization
“Process by which nitrogen in organic
compounds is converted to inorganic ammonium and
nitrate ions carried out by micro-organisms.”
11
Mineralization process operates through three reactions
namely:
1.Aminisation
2.Ammonification , and
3.Nitrification

1. Aminisation:
Process of release of amines and amino acids from combined N
compounds (proteins).
Proteins R-NH2 + CO2 + Energy + Other products(Amines)
HeterotrophicMicro-organisms
12
Organic NR-NH2
(Amine) NH4
+
(Ammonium) NO2
-
(Nitrite) NO3
-
(Nitrate)
Aminization Ammonification Nitrification

Aminisation occurs both in aerobic and anaerobic condition
End products
(NH4)2 SO4 H2O, and CO2Under aerobic condition
Under anaerobic condition NH3, NH2 -, CO2
, organic acids, H2S etc
13

2.Ammonification
Process of reduction of amines to ammonical compounds.
R-NH2 + HOHNH3 + R-OH + energy
H2O
NH4 + OH-
14
Under anaerobic condition (due to more hydrogen)Org.N NH4
+ -N Lack of O2 in soil

Under aerobic condition the process continues
NH4+ -N NO3
- -N
NO2- -N
Nitrification
3. Nitrification
15
Process of microbial oxidation of ammonical nitrogen to nitrate form of nitrogen.

16
Fig. 01: Sketch of three different process types regarding the effects of returning plant residues on soil inorganic nitrogen over the
limited experimental period.
Chen et al. (2014) France

17
Fig. 2. Diagram illustrating some processes in the nitrogen cycle in soils.
HawaiiJonathan (2006)
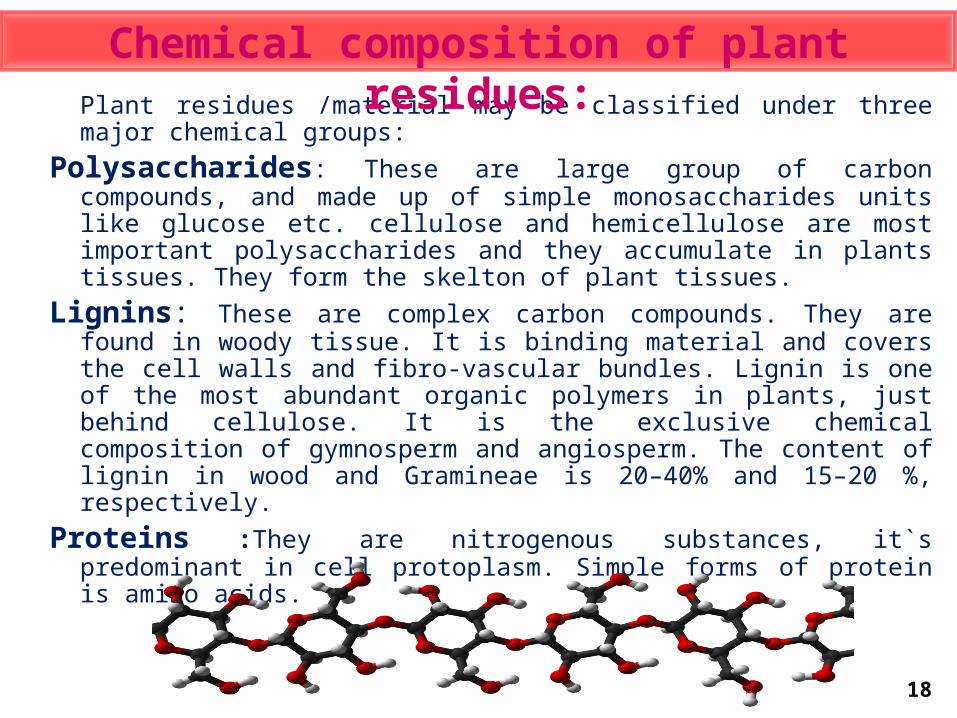
Plant residues /material may be classified under three major chemical groups:
Polysaccharides: These are large group of carbon compounds, and made up of simple monosaccharides units like glucose etc. cellulose and hemicellulose are most important polysaccharides and they accumulate in plants tissues. They form the skelton of plant tissues.
Lignins: These are complex carbon compounds. They are found in woody tissue. It is binding material and covers the cell walls and fibro-vascular bundles. Lignin is one of the most abundant organic polymers in plants, just behind cellulose. It is the exclusive chemical composition of gymnosperm and angiosperm. The content of lignin in wood and Gramineae is 20–40% and 15–20 %, respectively.
Proteins :They are nitrogenous substances, it`s predominant in cell protoplasm. Simple forms of protein is amino acids.
18
Chemical composition of plant residues:

19
Fig 3: Composition of Plant Materials
Source: Brady And Wail (2012)
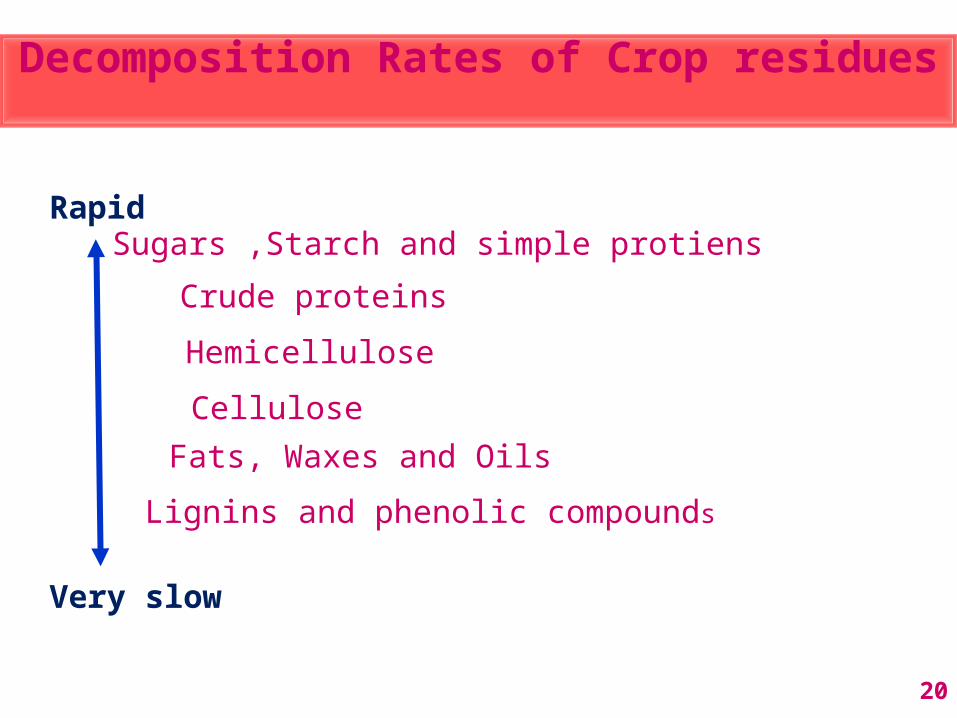
Rapid
Very slow
Sugars ,Starch and simple protiens
Crude proteins
Hemicellulose
CelluloseFats, Waxes and Oils
Lignins and phenolic compounds
20
Decomposition Rates of Crop residues

Resource quality category
Resource quality parameters (g kg-1)
Nitrogen supplying capacity
High quality N >25Lignin <150
Polyphenol <40
High and immediate
Intermediate-high quality
N >25Lignin >150
Polyphenol >40
Delayed, short or long term
Intermediate-low quality
(Short-term)
N<25lignin<150
polyphenol <40
Low–short term immobilization
Low quality(Long-term)
N <25Lignin >150
Polyphenol >40
Very low and possible long term immobilization
Mohanty et al. (2013) 21 NAAS, New Delhi

22Source: Brady And Wail (2012)
Research findings
23

24
Carbon and nitrogen mineralization potential of biofuel crop(Jatropha curcas L.)
residues in soil
CASE STUDY- 01

Soil location pH EC(ds/m) CaCO3 (%)
O.C C/N Total N (g/kg)
Available N (mg/kg)
Texture
Inside –canopy soil 7.41 0.14 0.92 0.67 9.57 0.72 47.6 Loam
Outside –canopy soil
7.31 0.11 0.92 0.60 8.57 0.72 41.3 Loam
TABLE:2..Characteristics of soil used for incubation study
Chaudhary et al.(2014) 25Bhavnagar ,Gujarat

26
Jatropha residues
C (%) N (%) C/N Cellulose (%)
Hemi cellulose (%)
Lignin (%)
Phenolics (mg/g)
Cake 46 3.30 13.94 14.44 12.46 1.25 1.91
Leaf 43 1.22 35.25 8.96 17.71 5.48 3.32
Fruit shell 42 0.98 42.86 6.85 15.78 1.82 0.46
Chaudhary et al. (2014)
Bhavnagar ,Gujarat

Chaudhary et al. (2014) 27Bhavnagar ,Gujarat

Chaudhary et al. (2014)
28Bhavnagar ,Gujarat

Rate at day
C N Cellulose Hemicellulose Lignin Phenolic C/N ratio
1 0.95 0.97 0.94 -0.91 -0.59 0.01 -0.94
9 0.95 0.97 0.94 -0.92 -0.61 -0.02 -0.94
21 0.96 0.99 0.95 -0.93 -0.61 -0.01 -0.96
33 0.97 0.99 0.96 -0.93 -0.61 0.01 -0.96
64 0.98 0.99 0.98 -0.88 -0.52 0.11 -0.98
94 0.99 0.99 0.98 -0.85 -0.48 0.17 -0.98
29Chaudhary et al. (2014) Bhavnagar ,Gujarat
30
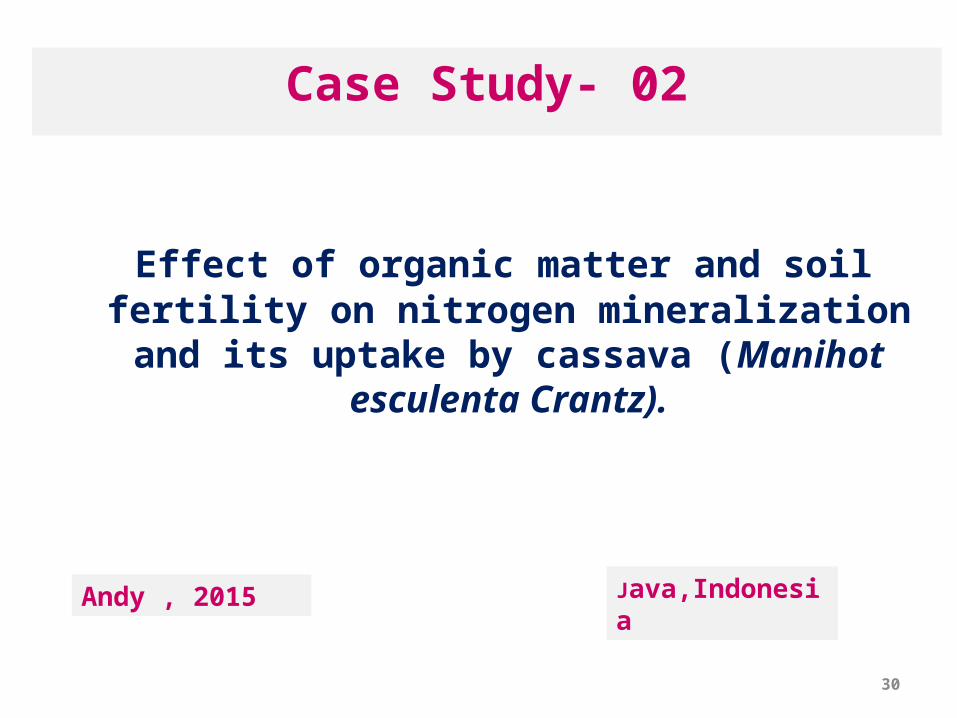
Case Study- 02
Effect of organic matter and soil fertility on nitrogen mineralization and its uptake by cassava (Manihot
esculenta Crantz).
Andy , 2015 Java,Indonesia
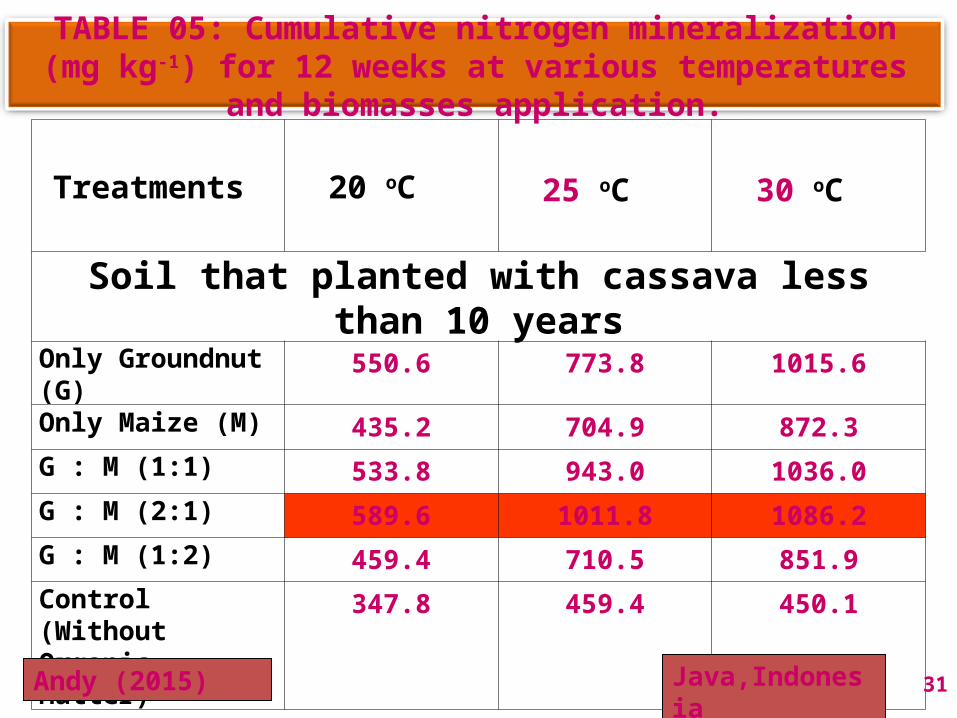
Treatments 20 oC 25 oC 30 oC
Soil that planted with cassava less than 10 yearsOnly Groundnut (G) 550.6 773.8 1015.6
Only Maize (M) 435.2 704.9 872.3G : M (1:1) 533.8 943.0 1036.0G : M (2:1) 589.6 1011.8 1086.2G : M (1:2) 459.4 710.5 851.9Control (Without Organic Matter)
347.8 459.4 450.1
TABLE 05: Cumulative nitrogen mineralization (mg kg-1) for 12 weeks at various temperatures and biomasses application.
Andy (2015) Java,Indonesia 31

32
Treatments 20 oC 25 oC 30 oC Soil that planted with cassava more than 30 years
Only Groundnut (G)
496.6 738.4 747.7
Only Maize (M) 388.7 556.1 638.0
G : M (1:1) 444.5 634.3 638.0
G : M (2:1) 526.4 738.4 783.1
G : M (1:2) 375.7 647.3 758.9
Control (Without Organic Matter)
264.1 437.1 394.3
TABLE:6..Cumulative nitrogen mineralization (mg kg-1) for 12 weeks at various temperatures and biomasses application.
Andy (2015) Java,Indonesia

33
Case Study-03
Effect of Chemical Composition of Plant Residues on Nitrogen Mineralization
Srinivas et al.(2006) CRIDA, Hyderabad

Srinivas et al.(2006) CRIDA, Hyderabad 34
TABLE 07: Chemical composition of different tree residues.
Plant residues C(%) N% Lignin%
Polyphenol%
C/N Lignin/N
Polyphenol/N
Lignin+Polyphenol/N
C.calothyrsus 41.5 2.46 7.21 7.04 a 16.9 2.93 2.86 5.79
C.siamea 42.1 2.07 7.64 3.88 20.3 3.69 1.88 5.57
D.sissoo 40.1 2.42 8.69 2.44 16.6 3.59 1.01 4.60
G.sepium 40.9 3.16 6.84 2.02 12.9 2.16 0.64 2.80
H.binata 40.1 1.91 10.21 3.74 21.0 5.35 1.96 7.31
L.leucocephala 39.5 3.59 6.87 3.10 11.0 1.92 0.87 2.78
P.juliflora 40.7 1.96 8.29 4.02 20.7 4.23 2.05 6.28
T. indica 41.3 1.62 10.15 4.83 b 25.6 6.29 2.99 9.28

35
Plant residues
C % N % Lignin%
Polyphenol%
C/N Lignin/N
Polyphenol/N
Lignin+Polyphenl/N
Caster 41.2 0.95 6.07 0.74 43.4 6.39 0.78 7.17
Horse gram 39.5 1.22 5.36 1.68 32.4 4.39 1.38 5.77
Paddy 40.4 0.48 5.19 0.61 84.2 10.81 1.27 12.08
Pearl millet 42.1 0.84 6.24 0.49 50.1 7.43 0.58 8.01
Sorghum 39.8 0.55 6.81 0.55 72.4 12.38 1.00 13.38
Sugarcane 43.0 0.51 7.54 0.37 84.3 14.78 0.73 15.51
Sunflower 40.2 1.06 8.10 0.82 37.9 7.64 0.77 8.42
TABLE 08: Chemical composition of different crop residues
Srinivas et al.(2006) CRIDA,Hyderabad

Fig:6..Plant residue quality and nitrogen mineralization
36
G.sepium
C. siamea
PaddySugarcane
L.leucocephala C. cajan
Srinivas et al.(2006) CRIDA,Hyderabad

FIG:7.. Relationships between residue quality parameters and N mineralization for All residues
37Srinivas et al.(2006) CRIDA,Hyderabad

38
Case Study-04
Impact of the addition of different plant residues on nitrogen mineralization–immobilization turnover and carbon content of a soil incubated under laboratory
conditions
Abbasi et al. (2015) (PAKISTAN)

g kg-1
Plant residues (Treatments)
Plant organs
Total N
Total C
Lignin(LG)
Polyphenols(PP)
C /N LG /N
PP /N
LG+PP /N
Glycine max shoot 35.2 447 11 13.1 12.7 0.3 0.4 0.7Glycine max Root 12.8 466 29 26.9 36.4 2.3 2.1 4.4Zea mays Shoot 9.6 472 41 29.5 49.2 4.3 3.1 7.3Zea mays Root 4.0 486 48 31.4 121.5 12.0 7.9 19.9Trifolium repens Shoot 27.4 397 13 18.0 14.4 0.4 0.6 1.1
Trifolium repens Root 16.0 423 21 20.2 26.4 1.3 1.2 2.5
Populus euramericana Leaves 20.8 435 3453.8
20.9 1.6 2.6 4.2
Robinia pseudoacacia Leaves 33.3 404 28 32.3 12.1 0.8 1.0 1.8
Elaeagnus umbellata leaves 34.7 418 32 38.7 12.1 0.9 1.1 2.0
LSD (p= 0.05) - 3.14 14.16 4.53 3.77
TABLE:9..Mean biochemical composition of the plant residues used in the experiment
39Abbasi et al. (2015) Pakistan

Days after plant-residue additionTreatments 0 7 14 21 28 42 60 80 100 120 CD
(p=0.05)mg Nkg-1soil
Control 13.7 13.9 12.9 17.1 30.9 65.9 63.1 75.6 77.7 51.7 2.88T1 14.8 39.2 49.2 76.8 96.7 158.1 165.2 174.1 188.7 160.9 7.90T2 13.7 8.1 5.2 8.3 11.8 13.8 28.4 50.4 49.4 27.7 8.15T3 13.7 7.4 6.2 6.9 10.5 23.1 21.2 36.1 46.7 21.0 5.34T4 14.3 7.4 9.4 7.7 8.8 15.3 22.2 21.4 32.4 26.4 4.30T5 14.1 19.0 21.6 55.5 62.5 86.8 127.6 150.8 145.8 93.3 7.31T6 15.5 8.2 5.2 23.9 34.0 85.3 98.0 149.9 130.2 85.8 9.46T7 13.0 5.7 4.1 8.6 22.6 55.5 73.1 106.8 87.3 66.9 8.39T8 13.9 7.4 9.2 23.6 46.6 91.3 111.0 138.9 127.8 93.7 7.83T9 12.9 9.4 14.5 25.3 51.1 80.1 92.7 140.0 116.4 93.5 6.88
CD (p =0.05)
2.43 4.77 3.12 5.11 7.63 8.23 6.37 9.23 8.27 7.34
TABLE:10..Mean changes in the concentration of total mineral N of a soil amended with different plant residues and incubated at 25 0C under controlled laboratory conditions during a 120-day period .
40
T1-Glycine max shoot, T2-Glycine max root;T3-Zea mays shoot, T4-Zea mays root; T5-Trifolium repens shoot;
T6 -Trifolium repens rootT7 -Populus euramericana leaves; T8-Robinia pseudoacacia leaves; T9-Elaeagnus umbellata leaves.
Abbasi et al. (2015) Pakistan
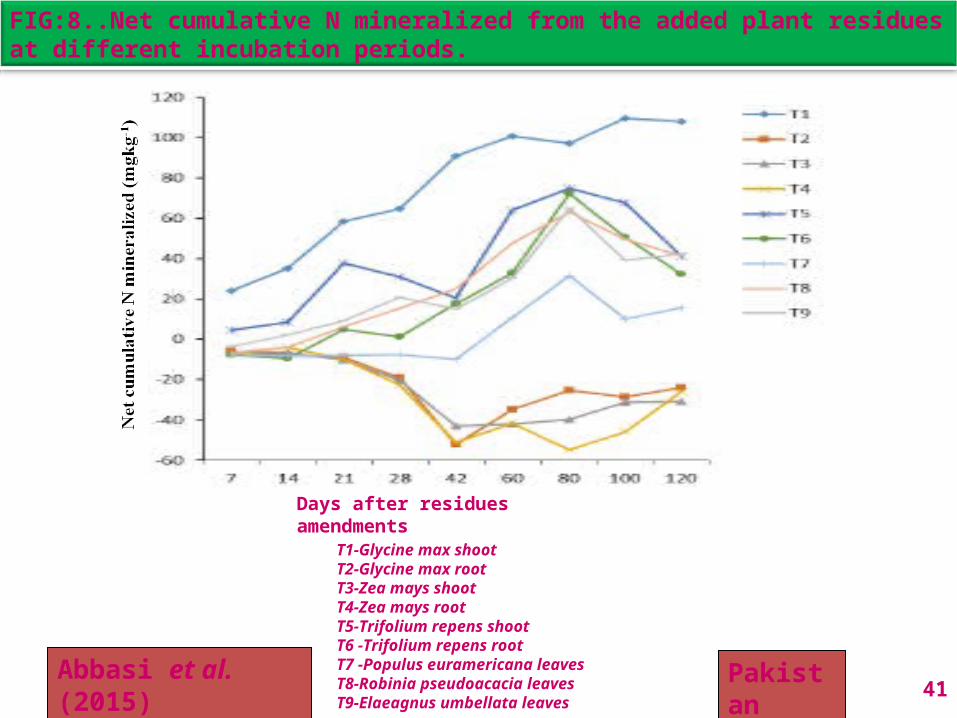
FIG:8..Net cumulative N mineralized from the added plant residues at different incubation periods.
41
T1-Glycine max shootT2-Glycine max rootT3-Zea mays shootT4-Zea mays rootT5-Trifolium repens shootT6 -Trifolium repens rootT7 -Populus euramericana leaves T8-Robinia pseudoacacia leavesT9-Elaeagnus umbellata leaves
Days after residues amendments
Abbasi et al. (2015) Pakistan

42
Singh And Kumar (2006)
HAU, Hisar
Case Study-05

Legumes residues
OC (g/kg) Total N g/kg C:N ratio Lignin (g/kg)
Polyphenols (g/kg)
Black gram 428 23.3 18.4 75.0 22.4
Cluster bean 452 18.2 24.8 80.0 44.4
Cowpea 446 21.4 20.8 71.2 27.6
Green gram 416 26.0 16.0 54.1 30.9
Sesbania 440 22.6 19.5 73.9 26.7
Soyabean 462 21.4 21.6 61.2 35.7
Sunhemp 438 20.1 21.8 64.3 32.2
43Singh And Kumar (2006)
HAU, Hisar
TABLE:11..Characteristics of legumes residues

FIG:9..Commulative Nitrogen Mineralization
44Singh And Kumar (2006)
HAU, Hisar

TABLE:12..Cumulative net N mineralized and amounts of added N mineralized from legume residues after 56 days of incubation
periodLegumes residues Net N mineralized (mg/kg) Amount of added N
mineralized (%)
Hisar Karnal Hisar Karnal
Black gram 84 87 72.1 74.7
Cluster bean 53 55 58.2 60.4
Cowpea 71 73 66.4 68.2
Green gram 96 99 73.8 76.1
Sesbania 74 76 65.5 67.3
Soyabean 75 77 70.1 72
sunhemp 65 67 64.7 66.7
45Singh And Kumar (2006)
HAU, Hisar

46
Oglesby And Fownes (2002) Hawaii
Case Study-06
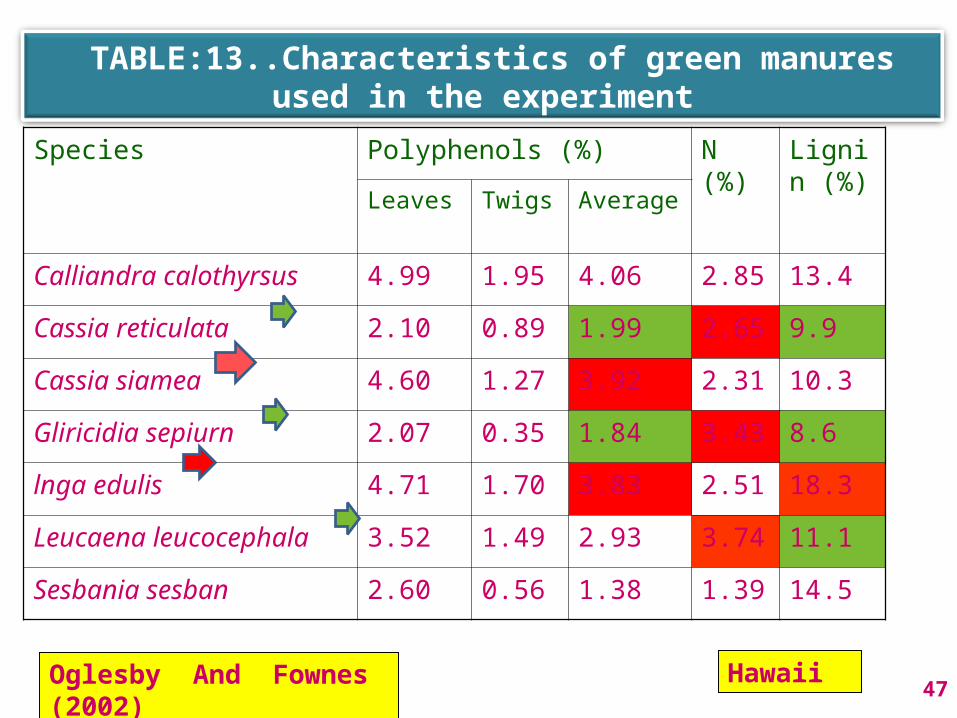
TABLE:13..Characteristics of green manures used in the experiment
Species Polyphenols (%) N (%) Lignin (%)Leaves Twigs Average
Calliandra calothyrsus 4.99 1.95 4.06 2.85 13.4
Cassia reticulata 2.10 0.89 1.99 2.65 9.9
Cassia siamea 4.60 1.27 3.92 2.31 10.3
Gliricidia sepiurn 2.07 0.35 1.84 3.43 8.6
lnga edulis 4.71 1.70 3.83 2.51 18.3
Leucaena leucocephala 3.52 1.49 2.93 3.74 11.1
Sesbania sesban 2.60 0.56 1.38 1.39 14.5
47Oglesby And Fownes (2002) Hawaii
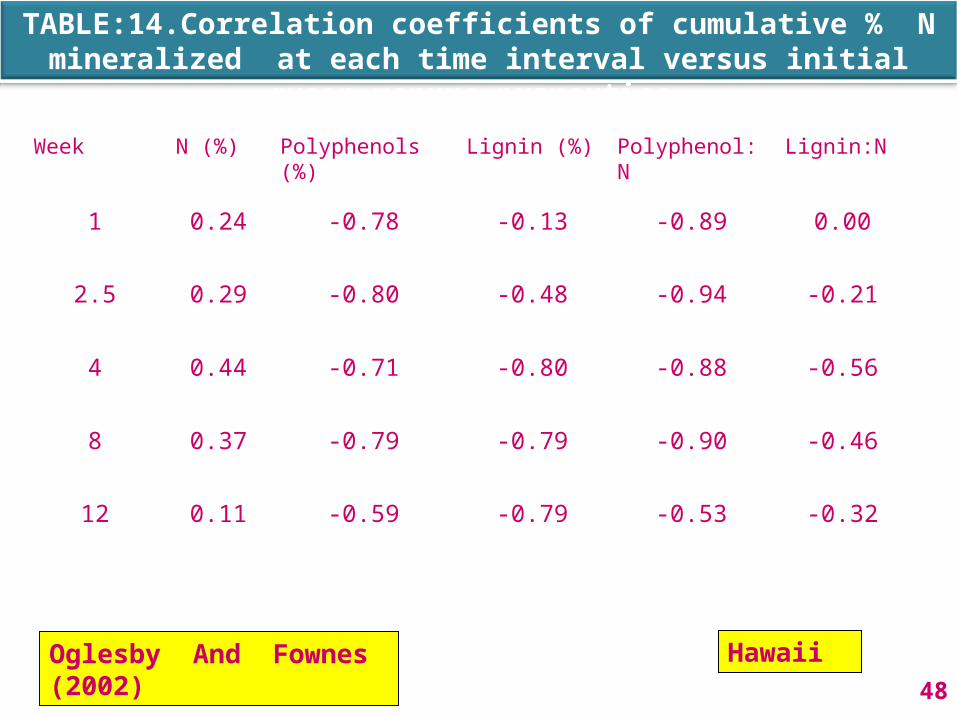
Week N (%) Polyphenols (%) Lignin (%) Polyphenol:N Lignin:N
1 0.24 -0.78 -0.13 -0.89 0.00
2.5 0.29 -0.80 -0.48 -0.94 -0.21
4 0.44 -0.71 -0.80 -0.88 -0.56
8 0.37 -0.79 -0.79 -0.90 -0.46
12 0.11 -0.59 -0.79 -0.53 -0.32
TABLE:14.Correlation coefficients of cumulative % N mineralized at each time interval versus initial green manure properties.
48Oglesby And Fownes (2002) Hawaii
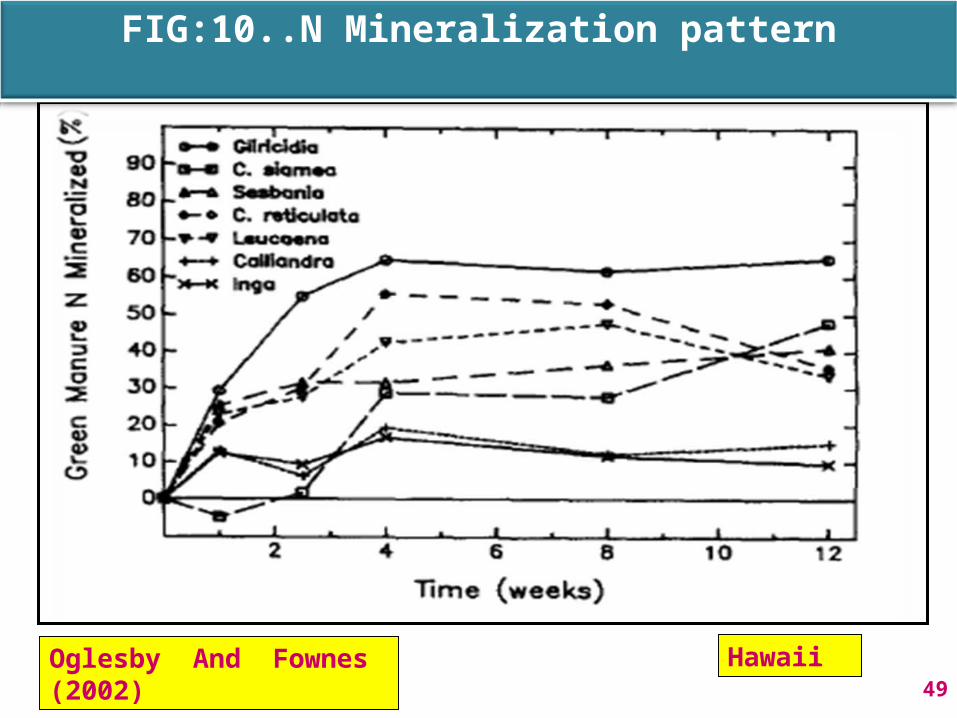
49
FIG:10..N Mineralization pattern
Oglesby And Fownes (2002) Hawaii

50
FIG:11..Relationship between N mineralized at 8 weeks and Polyphenol : N ratio (Y = 79.4 - 39.5X, n = 7, r 2 = 0.81).
Oglesby And Fownes (2002) Hawaii
51
Mafongoya et al. (2008) Florida
Case Study-07
Mineralization of nitrogen from decomposing leaves of multipurpose trees as affected by their chemical
composition

TABLE:15..Chemical composition of leaves of MPT species (on oven-dry matter basis).
Mafongoya et al.(2008)
Florida 52
Treatment Ng/Kg
NDF-Ng/Kg
Ligning/Kg
SP phenol g/Kg
Acacia angustissima 25b 19a 143b 122b
Gliricidia sepium 18c 9d 111c 23d
Flemingia macrophylla 18c 11c 193a 105b
Sesbania sesban 28ab 5c 67d 112b
Calliandra calothyrsus 27ab 12b 114c 154a
Cajanus cajan 31a 12b 140b 42d
Leucaena leucocephala 31a 11c 120c 122b
Acacia+sesbania 27b 12b 105c 117b
Cajanus+sesbania 30a 9d 104c 77c
Values followed by different letters in each column are significantly different from each other at P~0.05 using Duncan’s Multiple Range Test.
NDF-N=neutral detergent fraction),SP= Soluble polyphenols

53
FIG:12.. N mineralization pattern
Mafongoya et al. (2008) Florida
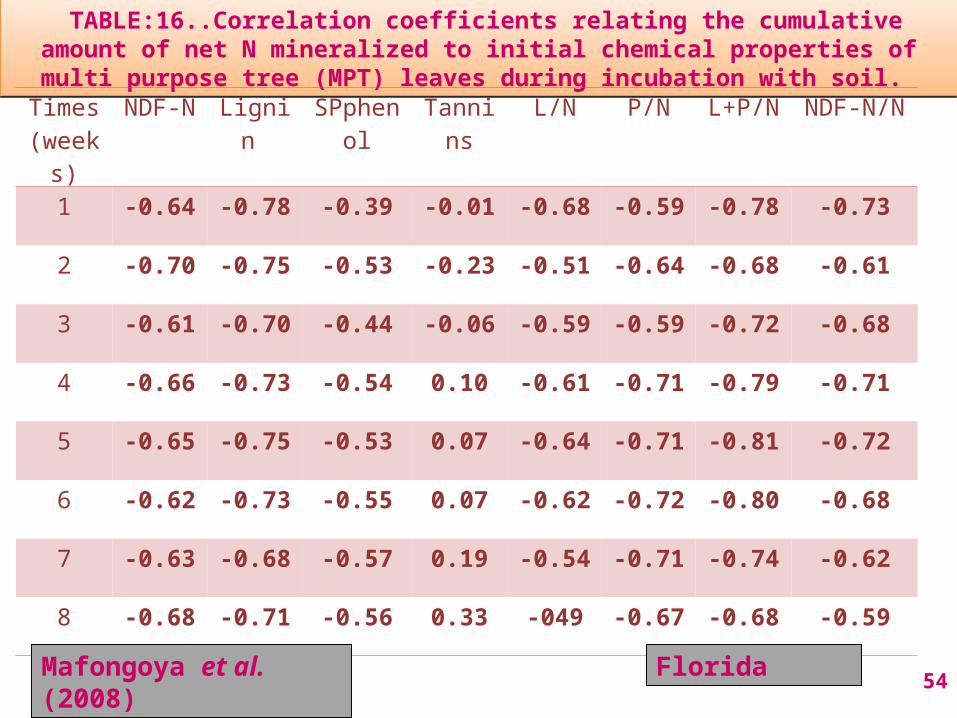
TABLE:16..Correlation coefficients relating the cumulative amount of net N mineralized to initial chemical properties of multi purpose tree (MPT) leaves during incubation with
soil.
54
Times(weeks)
NDF-N Lignin SPphenol Tannins L/N P/N L+P/N NDF-N/N
1 -0.64 -0.78 -0.39 -0.01 -0.68 -0.59 -0.78 -0.73
2 -0.70 -0.75 -0.53 -0.23 -0.51 -0.64 -0.68 -0.61
3 -0.61 -0.70 -0.44 -0.06 -0.59 -0.59 -0.72 -0.68
4 -0.66 -0.73 -0.54 0.10 -0.61 -0.71 -0.79 -0.71
5 -0.65 -0.75 -0.53 0.07 -0.64 -0.71 -0.81 -0.72
6 -0.62 -0.73 -0.55 0.07 -0.62 -0.72 -0.80 -0.68
7 -0.63 -0.68 -0.57 0.19 -0.54 -0.71 -0.74 -0.62
8 -0.68 -0.71 -0.56 0.33 -049 -0.67 -0.68 -0.59
Mafongoya et al. (2008) Florida

55
Nitrogen Mineralization from Soil Amended with Gliricidia and Nitrogen Mineralization from Soil Amended with Gliricidia and Sorghum Residues:Sorghum Residues:
Case Study-08
ICRISAT, HydrabadSridevi et al. (2006)

TABLE:17..Residue fractionation:
Residue Soluble fractions (% )
Fiber (%)
N g kg-1 C/N
Sorghum straw 21.4 78.6 5.32 77.3
Glyricidia prunings 53.3 46.7 28.60 13.4
56
ICRISAT, HydrabadSridevi et al. (2006)

Amendment N added(mg/ kg)
Incubation period in days N mineralized after 90 days (% of added)
0 5 15 30 45 60 75 90
Control - 7.84
14.46
24.31
31.44
35.28
37.63
39.19
40.42
-
Sorghum straw
24.39 7.84
4.52 12.41
19.91
25.15
30.33
34.17
39.06
5.6
Gliricidia prunings
24.39 7.84
12.58
32.5
44.86
51.29
56.75
60.31
62.04
88.6
57ICRISAT, HydrabadSridevi et al. (2006)
Table:18..Nitrogen mineralization

58
N concentration and C:N ratio are sound criteria for predicting nitrogen release in few crop residues while in other residues polyphenol/N ratio, ( lignin + polyphenol ) to N ratio play a role in percent N mineralized.
The composition of residues in terms of soluble and fiber fractions determines whether and to what extent, N is immobilized or mineralized.
The decomposition and nutrient release rates of residues are often regulated by environmental factors, such as temperature and soil moisture, and biochemical composition of plant materials and their interaction. The biochemical composition or quality parameters such as total N concentration, lignin (LG), polyphenols (PP), carbon : nitrogen (C/N) ratio, LG/ N, PP /N and (LG, C, PP) /N ratios are useful indicators that control decomposition and N release of added plant residues.
Conclusion of seminar

59