PPS Coordinators & Rehab Council Educational Program ... Pre 081513.pdf · PPS Coordinators & Rehab...
23
August 15, 2013 Atlanta, GA Census Development Strategies for IRFs & IRUs PPS Coordinators & Rehab Council Educational Program
Transcript of PPS Coordinators & Rehab Council Educational Program ... Pre 081513.pdf · PPS Coordinators & Rehab...
August 15, 2013
Atlanta, GA
Census Development Strategies for IRFs & IRUs
PPS Coordinators & Rehab Council Educational Program
1
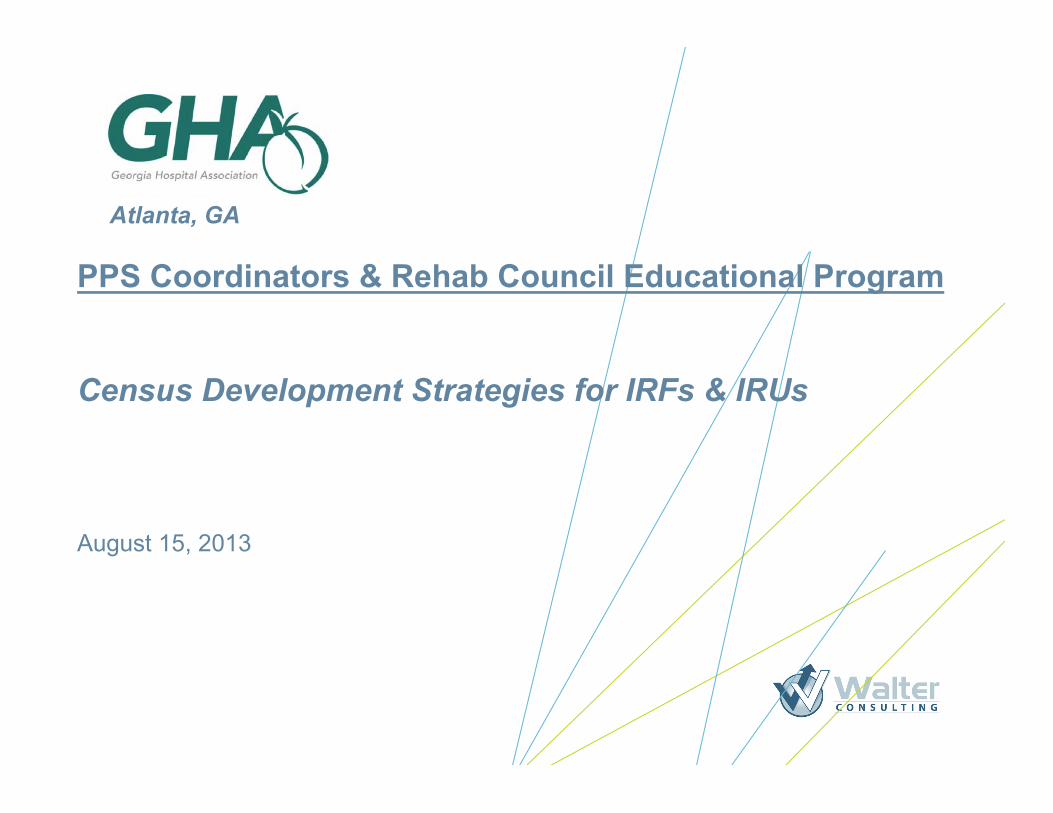
Ø Speaker Introduction
Ø Assess IRF/IRU opportunities – Are we getting everything we can get?
Ø Review financial impact of census development
Ø Review common barriers to successful census development
Ø Case studies
Ø Q&A
Focus of Today’s Session

n Over one-third of the +/- 100 freestanding NFP IRFs nationally
n Multiple proprietary IRFs and systems
n Major academic medical centers and integrated health systems
n Community hospitals and faith-based organizations
n Freestanding and hospital-based SNFs
n Freestanding and hospital-based HHAs
n Proprietary and NFP LTCHs
n Clients in 40+ states
n Other
2
National Rehab and Post-acute Consulting Experience
Post-acute Clients

IRF Volume Has Greatest Impact to Financial Performance
3
2011 IRF Medicare Margin by Bed Size (a,b)
(a) March 2013 MedPAC Report to Congress (b) MedPAC estimate of 9.6 percent FY 2011 margin & 8.5 percent FY 2013 for all providers
-10.3% -3.2%
6.9% 9.6%
18.5%
-15.0%
-10.0%
-5.0%
0.0%
5.0%
10.0%
15.0%
20.0%
1-10 Beds
11-21 Beds
22-59 Beds All Providers
60+ Beds
There is a dramatic correlation between
IRF bed size/ADC and Operating Margin!

IRF Financial Pressures Likely to Continue Into The Future
n Because Medicare is largest IRF payor, modest reimbursement increases that do not keep pace with inflation present significant challenges for provider
4
Annual Inflation
Projections Base Year Year 1 Year 2 Year 3 Year 4 Year 5
Net Revenue $1,000 1.8% $1,018 $1,036 $1,055 $1,074 $1,093 Expenses $950 3.5% $983 $1,018 $1,053 $1,090 $1,128 Net Income $50 $35 $19 $2 -$16 -$35 Operating Margin 5.0% 3.4% 1.8% 0.2% -1.5% -3.2%
While expense management is critical, Top Line revenue growth (i.e., volume) will be critical for long-term success
Impact of Revenue Adjustments Remaining Lower Than Expense Adjustments
Expenses
Net Revenue
$900
$950
$1,000
$1,050
$1,100
$1,150
Year 1 Year 2 Year 3 Year 4 Year 5
IRF/IRU providers must ensure that they are capturing every possible referral to maintain a strong financial position

Discharge All Best Practices (b) Disposition Medicare (a) Low High IRF 3.2% 4.0% 6.0% SNF 17.3% 12.0% 15.0% HHA 16.0% 22.0% 24.0% LTCH 1.0% 1.5% 2.0% Hospice 2.1% 2.5% 3.0% Total 39.6% 42.0% 50.0%
(a) Source: MedPAC June 2008 Annual Data Book. (b) Source: Walter Consulting.
2006 Na'onal Post-‐acute U'liza'on Rates
Rehabilitation and Post-Acute Utilization Rates
5
Nationally, approximately 3.0 – 3.5 percent of all Medicare acute care discharges utilize IRF/IRU services post-discharge Best Practice standards of aggressive providers, however, suggest actual potential between 4 – 6 percent Medicare utilization critical benchmark, because +/- 65 percent of all IRF/IRU discharges are Medicare
While IRF admissions have decreased since 2006, Medicare acute care admissions have also
decreased, so the percentage has remained fairly consistent (3.4%)
Source: March 2013 MedPAC Report to Congress

Where is IRF Utilization Headed Post-Healthcare Reform?
6
Market Discharge Disposition
Discharges SNF IRF LTCH HHA Hospice Total
Health System A - Texas Medicare 35,000 12.4% 5.1% 10.2% 13.4% 3.1% 44.2% Medicare HMO 12,000 11.0% 3.2% 3.9% 16.9% 3.2% 38.2%
Health System B - Arizona Medicare 8,700 12.8% 5.6% 1.0% 16.6% 7.4% 43.4% Medicare HMO 8,000 12.9% 3.0% 0.5% 17.7% 5.5% 39.6%
Health System C - Illinois Medicare 12,000 23.4% 6.5% 2.0% 18.6% 3.3% 53.8% Medicare HMO 3,000 21.1% 4.0% 0.5% 22.2% 3.2% 53.0%
2012 Post-acute Utilization – Three Sample Markets and Health Systems
n When bundled payments or other shared-risk financial models are in place, IRF utilization likely to mimic Medicare Advantage health plans that are currently at full financial risk…

7
Acute Care Inpatient Rehabilitation % Acute Medicare Discharges to IRF
Discharges Admissions ADC Hospital Beds Medicare Total ADC Beds Medicare Total Medicare Total
1 Hospital 1 124 1,402 3,152 41.6 25 145 212 5.2 7.5 10.4% 2 Hospital 2 237 4,285 11,230 149.0 29 409 646 14.6 23.0 9.5% 3 Hospital 3 497 4,394 15,063 232.8 29 413 629 14.7 22.4 9.4% 4 Hospital 4 328 3,760 8,593 139.0 20 273 396 9.7 14.1 7.3% 5 Hospital 5 287 3,372 12,694 169.3 28 240 421 8.5 15.0 7.1% 6 Hospital 6 560 10304 32432 491.4 58 674 1041 24.0 37.1 6.5% 7 Hospital 7 249 3,154 9,153 120.0 20 192 309 6.8 11.0 6.1% 8 Hospital 8 253 4,732 10,027 156.0 22 261 425 9.3 15.1 5.5% 9 Hospital 9 513 8,816 28,023 358.2 50 449 970 16.0 34.6 5.1%
10 Hospital 10 258 4,253 11,680 154.4 18 200 348 7.1 12.4 4.7% 11 Hospital 11 432 4,973 15,986 243.1 18 226 430 8.0 15.3 4.5% 12 Hospital 12 267 3,398 11,432 185.4 11 144 249 5.1 8.9 4.2% 13 Hospital 13 489 5,262 25,099 290.3 25 219 488 7.8 17.4 4.2% 14 Hospital 14 278 3,346 12,232 175.2 20 135 311 4.8 11.1 4.0% 15 Hospital 15 162 2,343 7,211 74.1 15 92 155 3.3 5.5 3.9% 16 Hospital 16 376 4,365 12,027 160.1 24 167 274 6.0 9.8 3.8% 17 Hospital 17 526 6,997 25,572 330.3 30 244 619 8.7 22.0 3.5% 18 Hospital 18 602 8,376 24,052 416.5 46 246 834 8.8 29.7 2.9% 19 Hospital 19 230 5,555 10,798 127.2 20 162 253 5.8 9.0 2.9% 20 Hospital 20 364 3,482 7,951 91.3 20 101 136 3.6 4.8 2.9% 21 Hospital 21 202 2,532 7,827 100.8 33 56 180 2.0 6.4 2.2% 22 Hospital 22 370 5,709 18,828 250.8 20 114 242 4.1 8.6 2.0% 23 Hospital 23 572 11,209 35,075 471.4 20 195 448 6.9 16.0 1.7% 24 Hospital 24 403 2,257 13,008 210.9 17 37 166 1.3 5.9 1.7% 25 Hospital 25 774 9,416 24,553 318.3 24 111 251 4.0 8.9 1.2%
Total: State 9,353 127,692 393,698 5,457.3 642 5,506 10,432 196.1 371.6 4.3% Note: One GA IRU not included, as most of its admissions come from external referrals. Source: FY 2011 and FY 2012 Provider Medicare Cost Reports.
2011 – 2012 Estimated Georgia Rehabilitation Utilization by Hospitals With IRFs/IRUs
Data notes: Ø IRF ALOS based upon reported patient days, and assumes a 13.0 ALOS Ø % Medicare Discharges to IRF assumes all hospital discharges to IRF were placed in the hospital IRF, and that all Medicare IRF
admissions came from host hospital

Sample Internal IRF Demand Models
8
ALOS ADC Bed Need (a) Diagnosis Admits Low High Low High Low High
Neurology 304 16 - 18 13.3 - 15.0 16 - 18 Orthopedics 207 10 - 14 5.7 - 7.9 7 - 9 Brain Injury 46 17 - 20 2.1 - 2.5 3 - 3 Non-Traumatic SCI 38 17 - 19 1.8 - 2.0 2 - 2 Traumatic SCI 35 25 - 28 2.4 - 2.7 3 - 3 Mjr Mltp Trm 34 20 - 23 1.9 - 2.2 2 - 3 Cardiology 39 10 - 12 1.1 - 1.3 1 - 2 Pulmonology 28 10 - 14 0.8 - 1.1 1 - 1 Other Medical 116 12 - 14 3.8 - 4.4 4 - 5
Total 847 14 - 17 32.8 - 39.1 39 - 46 (a) Assumes 85% occupancy.
Memorial Hospital Internal IRF Demand Projections
Ideally, it would be best to identify an estimated volume by diagnosis (and by target hospital), to establish target admissions for each program Tracking mechanism should also be in place to make adjustments when actual admissions lags target potential

Sample External IRF Demand Model
n Also helpful to understand the total service area IRF demand - Are there potential referrals outside of your hospital? - Are there enough (surplus) of IRF beds in the area?
9
Ortho Neuro SCI BI Other Medical Total County Admits Beds Admits Beds Admits Beds Admits Beds Admits Beds Admits Beds PSA County 1 151 6 210 11 36 2 47 2 190 8 634 29 County 2 225 9 319 16 54 3 72 4 287 12 957 44 PSA Total 376 15 529 27 90 5 119 6 477 20 1,591 73 SSA County 3 101 4 125 7 30 2 33 2 124 5 413 20 County 4 40 2 55 3 11 1 12 0 51 2 169 8 County 5 30 1 40 2 7 0 9 0 37 2 123 5 County 6 39 2 56 3 9 1 12 0 50 2 166 8 County 7 19 1 24 1 5 0 6 0 23 1 77 3 SSA Total 229 10 300 16 62 4 72 2 285 12 948 44 Total 605 25 829 43 152 9 191 8 762 32 2,539 117
Memorial Hospital – External Market IRF Demand Projections

What Will You Do To Increase IRF Census?
FY 2013 Base Rate $14,343 Avg CMI (a) 1.26 Avg Payment $18,072 Est. Cost (assumes 8% margin) $16,717 Est. Variable Cost (b) $8,358 Est. ContribuKon Margin $9,714 Est. Margin PPD (c) $747 Est. Annual Impact of 1 ADC $272,734 (a) Source: erehabdata (b) Assumes cost structure is 50/50, fixed/variable (c) Assumes 13.0 ALOS (erehabdata)
10
What could you do TODAY to get 2 more admissions this month?
Est. FY 2013 Impact of 1 Occupied Bed Nationally, every 1.0 increase in IRF ADC drives $250K-$300K to the bottom line
With a 13.0 ALOS, this equates to 28 admissions/year, or just over 2.0 admissions/month For smaller programs with a current margin less than 8.0 percent, the impact may be greater because they probably have a higher percentage of fixed costs, and the true, incremental “cost” of having 1 additional patient is not high
11
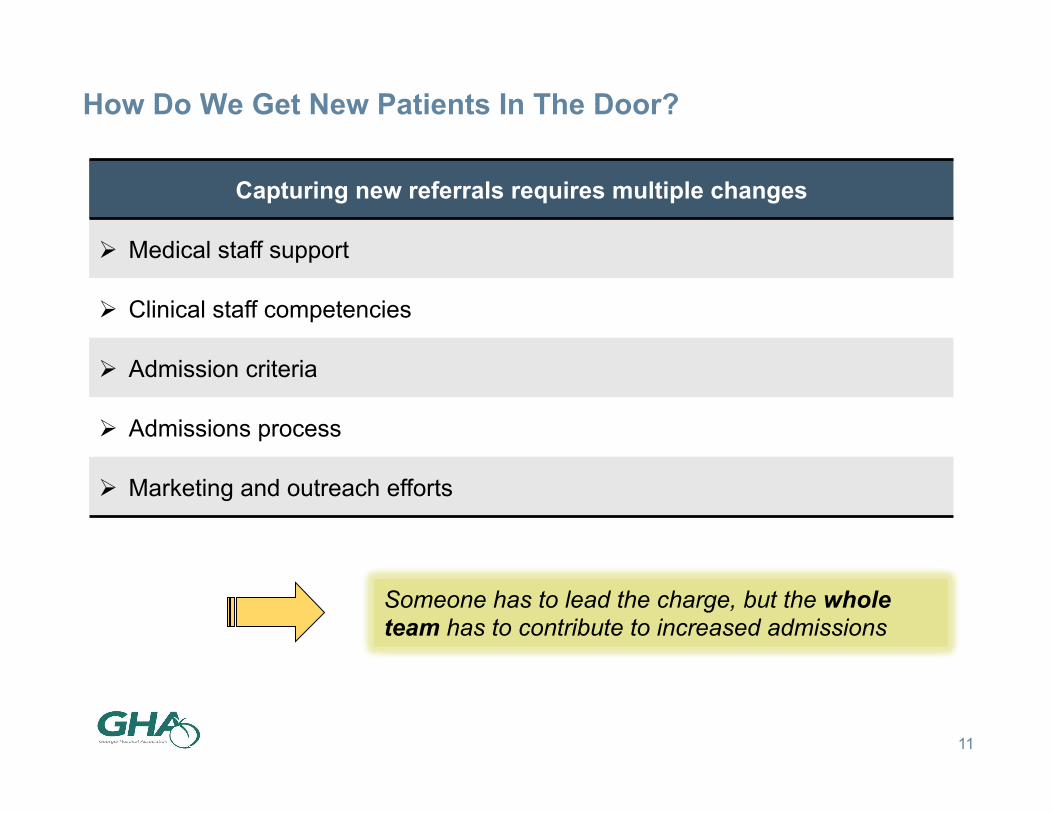
How Do We Get New Patients In The Door?
Capturing new referrals requires multiple changes
Ø Medical staff support
Ø Clinical staff competencies
Ø Admission criteria
Ø Admissions process
Ø Marketing and outreach efforts
Someone has to lead the charge, but the whole team has to contribute to increased admissions

A Good Place To Start Is A Review Of Annual FIM Report
12
A review of FIM/Outcomes report can tell you how your FIM changes and outcomes compare to your peers, but can also potentially identify marketing opportunities
FIM Measure Facility Reg’l Nat’l Potential Opportunity
Days Onset 14.3 11.4 11.7
• Days Onset longer than peer group suggests: 1. Your acute care hospital is incurring unnecessary LOS 2. You are losing IRU referrals to other providers – probably
SNF programs
CMI 1.23 1.28 1.30
• CMI that is too low suggests possibility to pick up add’l stroke or other higher acuity patients
• CMI that is too high suggests potential to admit add’l orthopedics and/or debility patients
Admit FIM 61.0 58.4 59.4 • Admit FIM higher than average suggests not admitting patients quickly enough & possible losses to SNF or other providers
ALOS 12.5 13.7 13.5
• ALOS lower than peer group suggests potential to admit more high acuity patients
• ALOS significantly higher than peer group suggests potential to admit lower acuity patients (if CMI also high)
60% Compliance 88.5% 64.0% 65.0% • High compliance suggests ability to increase additional
medically appropriate non-compliant admissions
All FIM data must be reviewed simultaneously, however, so that any single item is not misinterpreted
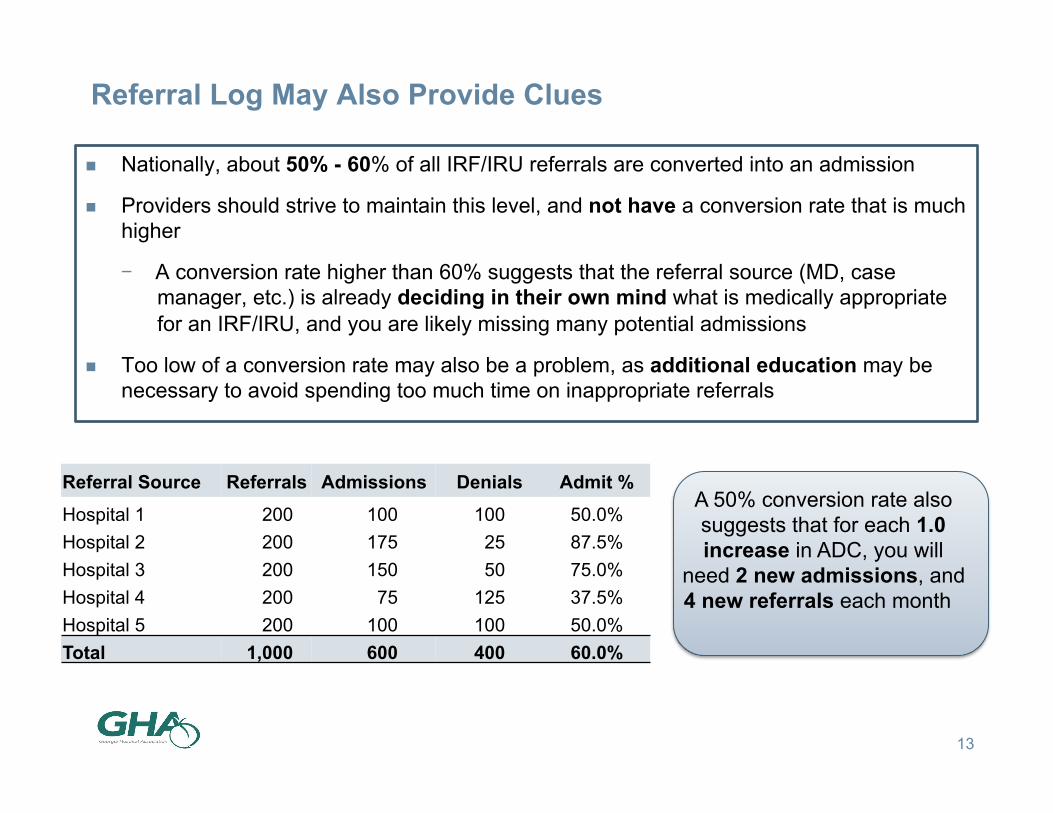
Referral Log May Also Provide Clues
n Nationally, about 50% - 60% of all IRF/IRU referrals are converted into an admission
n Providers should strive to maintain this level, and not have a conversion rate that is much higher
- A conversion rate higher than 60% suggests that the referral source (MD, case manager, etc.) is already deciding in their own mind what is medically appropriate for an IRF/IRU, and you are likely missing many potential admissions
n Too low of a conversion rate may also be a problem, as additional education may be necessary to avoid spending too much time on inappropriate referrals
13
Referral Source Referrals Admissions Denials Admit % Hospital 1 200 100 100 50.0% Hospital 2 200 175 25 87.5% Hospital 3 200 150 50 75.0% Hospital 4 200 75 125 37.5% Hospital 5 200 100 100 50.0% Total 1,000 600 400 60.0%
A 50% conversion rate also suggests that for each 1.0 increase in ADC, you will
need 2 new admissions, and 4 new referrals each month

Medical Staff Coverage
14
Census development should be part of Medical Director’s roles and responsibilities Ø Is this a responsibility specifically identified in the contract? Ø Where does the Medical Director and other PM&R physicians bonus/
incentive compensation come from?
Ensure sufficient specialty coverage to admit higher acuity patients Ø HB-units are generally able to ensure specialty coverage more easily
What does the referral market perceive about the clinical competencies of your program?
Ø Comfort level of current PM&R staff in managing higher acuity patients Ø Ability to minimize acute care bounce-backs Ø Ability to arrange for necessary diagnostics, etc. Ø Access to medical specialties

Clinical Staff Competencies
15
Higher acuity patient populations may require infusing more robust medical/surgical skills for nursing staff
Sicker patients are not necessarily the “fun” patients for therapy staff – these patients are more of a challenge
Nursing and therapy services need to be joined at the hip Ø What is the mix of CRRNs on staff?
May require added education and justification as to “why this patient was ever admitted”
Once the patient is in the door, the IRF/IRU has to “walk the walk” to ensure that referral source (MD, hospital, case
mangers, etc.) sends the next patient

16
Admission Criteria and Admissions Process
Dos Don’ts
Clearly define who you will take (may wish to also define who you will not take)
Screen patients “Out” and not “In”
If multiple physicians admit, assure that admission criteria is consistently applied
Have many unwritten admission rules that are not included in written criteria
Set response times and commit to them – no ambiguities
Use one patient type as a reason to Never admit another patient with a similar profile
Open the referral funnel as much as possible – 1-800-Rehab
Make your case management/discharge planning function part of the referring hospital responsibility

17
Marketing and Outreach
n It is critical to adopt a “marketing/sales” approach to census development
- Deploy enough “liaison” staff to actively pursue referrals (their job should not be “answering the phone”)
- Understand what you have taught your referral sources and what it will take to re-train their thinking
- Determine how much risk you are willing to take – too much caution angers the market
- When referrals are denied, make sure the referral source knows why – do not leave them angry
- Be in control of the referral process – open the funnel and do not let referral sources make the decisions for you

18
Case Study #1
(a) Assumes 13.5 day ALOS
Current Admissions 300 Compliant Cases 225 Compliance Percent 75% Target Compliance 65% Potential Admissions 345 Potential Increase 45 Percent Increase 15.4% Increase ADC (a) 1.7 Incremental Operating Income $450,000
Ø Mid-size acute care hospital in Northeast with 20-bed IRU Ø IRU ADC = 12.0 Ø 90+ percent of IRU admissions come from host hospital Ø High compliance, with relatively few “Other Medical” or Miscellaneous cases
Community Hospital – FY 2012 IRF Market Assessment
Findings Opportunity identified to admit 40 – 50 non-ortho/
neuro patients, mostly cardiac and pulmonary patients with general
debility, with significant financial impact

19
Case Study #2
% of Acute Pts Discharged to PAC PAC Program Medicare Medicare Advantage IRF 2.0% 3.1% SNF 21.0% 18.0% LTCH 1.3% 0.7% HHA 19.5% 18.8% Hospice 4.0% 3.7%
Ø Three-hospital health system in Midwest – 750 total beds (all 15-20 min apart) Ø 40-bed IRU in 400-bed academic medical center Ø IRU program historically had very low risk tolerance for potential denials
University Hospital – FY 2012 IRF Market Assessment
Medicare and Medicare Advantage population
similar diagnostically, but MA Case Managers
actually utilizing IRU at a higher rate than
Medicare FFS patients,
Findings Market Assessment showed potential to double Medicare IRU admissions,
increasing ADC by 8.0 - 10.0 patients, and Operating Income by > $2.0 million

Conclusions
20
For most Georgia IRF/IRU providers there appear to be IRF/IRU census development opportunities TODAY
Additionally, IRFs/IRUs should remain strong components of the health system continuum as financial incentives shift under health reform initiatives
Long-term success, however, will require planning and a disciplined approach to census development
Ø Doing more of the same will get you more of the same
Critical components 1. Assess the market to know exactly where opportunities exist 2. Quantify census and financial opportunities to get health system
support 3. Ensure Admission Criteria, Admission Process, and Outreach efforts are
working FOR you, and not AGAINST you 4. Once the patient is in the bed, Deliver on Your Promise…

Questions?
21

Contact Information
Daniel B. Walter Senior Principal Walter Consulting 404.636.9700 [email protected] www.walterconsulting.com
22