PPL Asset Management - PJM
26
PPL Asset Management PJM TRPSTF May 23 rd , 2016
Transcript of PPL Asset Management - PJM

PPL Asset Management
PJM TRPSTF
May 23rd, 2016

1
PPL Asset Management
PPL Examples of Asset Management
• Transmission Line Reliability Analysis Tool
• Cellon Wood Poles
• SF6 Gas Circuit Breakers – Mortality Analysis
• CCVT – Mortality Analysis

2
PPL Asset Management – Transmission Lines
PPL Transmission System Highlights
• 500kv, 230kV, 138kV and 69kV
• 1.4M Customers fed from 138kV and 69kV Lines
• 69kV and 138kV lines “Designed for Network,
Operated Radially”
• Aging Infrastructure – lines constructed as early as
1910’s
• About half of the ~50,000 Transmission Structures
are Wood Poles

3
PPL Asset Management – Transmission Lines
Typical PPL 69kV Topology
Motor operate these switches to
provide the ability to change
sources to the single feed sub.
Motor operate switches on
either side of taps to sectionalize
the main line for a fault on either
side and still feed the tap
Motor operate N.O.
switches to be able
to sectionalize for a
fault along the line
and feed any part of
the line from either
side source.
If taps are close in distance to each other it may not be
necessary to have more than one switch between them
since there are less chances for a fault there.
A switch here may be
installed in the case
of a long vulnerable
tap and there is
limitation on
sectionalizing the line
due to line loading.
A MOLBAB here allows the line to be sectionalized
and fed from the other source for a fault between
the first tap and the regional sub breaker.
These switches facing the line protection breaker from the first tap is meant to sectionalize the line
and re-energize all subs from the remote end in the case of a double circuit failure in the first
section of a line. This situation is dependent on line loading and relaying capabilities.

4
PPL Asset Management – Transmission Lines
Transmission Line Reliability Analysis Tool • Proprietary Asset Management Tool that supports a reliability
focused, cost effective and well coordinated asset investment and
condition-based maintenance program
• Dynamic Asset Health, Criticality and Risk Scores along with
predictive SAIFI and MAIFI measurements
• Risk scores and probability of failure should be scalable from
component level up to system level
• Condition-based maintenance algorithms to trigger alerts and
warnings and to initiate work orders
• System-wide Asset Inventory to capture relevant information
• Digitizing of inspection forms and trouble reports to feed field data
directly into Asset Database

5
PPL Asset Management – Transmission Lines
Use Cases for Transmission Line Tool: • Maintenance – condition-based inspections and maintenance
• Rehabilitate versus Rebuild – better understand impact and
analysis around decision
• Project Prioritization – compare lines based on overall Risk
(Health, Criticality, and Performance)
• Reliability Improvements – understand performance impact when
addressing known reliability issues
• Asset Optimization – optimize line performance through
component-level analysis
• Transmission Operations – provide information to make
operational decisions based on Risk
• Life-cycle management – ability to project health of line into the
future

6
Probability
Severity
Unacceptable
Consequences
Acceptable
Probability
(Out of Design)
Acceptable
Risk
Unacceptable
Risk
Risk Matrix
Risk = Criticality x Health
(Severity x Probability)
PPL Asset Management – Transmission Lines
Example: Line A = B3
Line B = C1
7
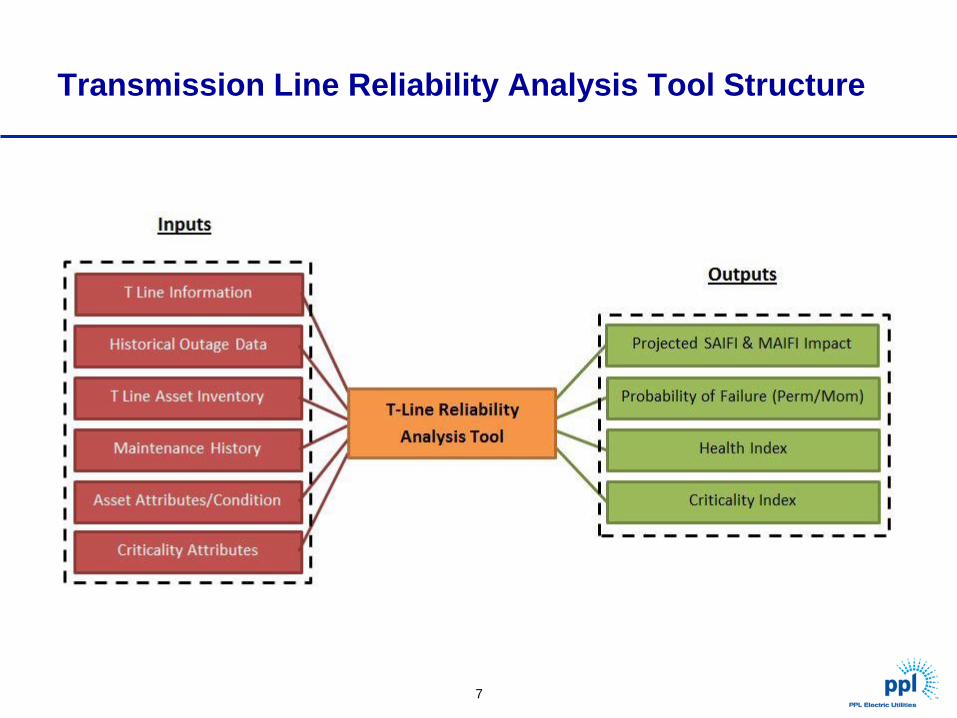
Transmission Line Reliability Analysis Tool Structure

8
Transmission Line Reliability Analysis Tool
• Assessment is based on 3 key areas: Performance, Asset Health,
and Criticality
• Assessment is completed at the component, structure and line level
to provide an aggregate score at the Line, Region or System level
• MicroStrategy reporting interface is used to analyze the asset data
• Standard Reporting Capabilities:
• Projected MAIFI & SAIFI Performance
• Current Health & Criticality
• Risk Score (Rating)
• Scenario Forecast Reporting Capabilities:
• Future Status (aged assets)
• Idealized Status (rebuilt/replaced assets)

9
Transmission Line Reliability Analysis Tool
• Performance (MAIFI & SAIFI) • Baseline uses MAIFI/SAIFI impact per outage event (customer
dependent) • Probability of Failure (Momentary & Permanent)
• Evaluated at the structure level and compiled at the line level • Factors in historical outage history and performance • Asset specific attributes positively/negatively impact Pf
• Projected MAIFI & SAIFI is a function of Pf and MAIFI/SAIFI per event
• Asset Health • Baseline score is based on the aggregate of all the structures on the
line • Health score is calculated using modeled life curves • Additional attributes are weighted against the health score for various
attributes that impact structures positively/negatively
• Criticality Score • Based on various factors specific to the transmission line
• Topology (Voltage Class, Single Circuit, Double Circuit, etc.) • Loading (Average, Peak) • Operability (switches, transfer capability, etc.) • Critical Customers

10
Transmission Line Reliability Analysis Tool
• Assessment Methodology for T-Line Assets
• Utilize Condition Parameters (CP) and Weights (W) assigned to given
assets for both permanent and momentary impacts
• All attributes specific to a structure are weighted against the health and
projected MAIFI & SAIFI metrics
• Common Attributes
• Structure Material
• Structure Type & Configuration
• Cross Arms
• Guying
• Type & Level of Insulation
• Environmental (Wooded, Fields, Mountainous, Wetland, etc.)
• Crossing (Line, River, Structure, etc.)
• Underbuilt Assets

11
Transmission Line Reliability Analysis Tool

12
Transmission Line Reliability Analysis Tool

13
Transmission Line Reliability Analysis Tool

14
PPL Asset Management
PPL Examples of Asset Management
• Cellon Wood Poles

15
• Cellon Wood Pole Highlights • 2010 – 1st Failure of Cellon Wood Pole
• Root Cause Analysis identified correlation between Cellon-treated
Douglas Fir Wood with high probability for excessive internal decay
• “Rotted” poles are structurally compromised and at risk of failure
• Failure is a risk to public Safety and Reliability
• Wood Pole inspections are ineffective at identifying “rotted” poles
• Cellon Pole Program developed to systematically replace at-risk poles
on the system with Steel
• Targeted high Criticality lines, Critical crossings, Roadways and public
locations first
• Condition Parameters in Transmission Line Reliability Analysis Tool
reflect the poor condition of these structure types
• Over 2/3 of Cellons replaced since 2010
Cellon Wood Poles

16
Cellon Wood Poles

17
Cellon Wood Poles

18
PPL Asset Management
PPL Examples of Asset Management
• SF6 Gas Circuit Breakers – Mortality Analysis

19
Reliability “Bathtub” Curve

20
• SF6 Breaker failures are
increasing 33% year over year
• SF6 breakers leak and alarm
creating emergency work
• Breakers are repeatedly filled
unplanned
• Breakers are repaired after
several alarms
• Model and vintage drives
survival rate
• Repairing breaker mitigates
issue for ~12 months
• Once a breaker begins to leak it
will repeatedly leak more often
• Cost/Benefit Analysis shows
leaking breaker should be
planned for replacement in lieu
of repeated repairs
• 46 SF6 breakers added to Capital
Replacement Plan over 5 years
• Proactive replacement will reduce
maintenance costs on SF6 fills, leak
repairs and alarm call-outs
• Less SF6 will be lost to the
environment
• Less unplanned line outages for SF6
fills/leaks will occur
Expected Survival Rate (Vendor A)
Situation Findings Results
0
10
20
30
40
50
60
70
80
90
100
0 5 10 15 20 25 30 35 40 45 50 55
Years
% S
urv
ival
3rd Fill
2nd Fill
1st Fill
Repair
SF6 Circuit Breakers – Mortality Analysis

21
PPL Asset Management
PPL Examples of Asset Management
• CCVT – Mortality Analysis

22
• Develop a statistical model for Time-to-Failure maintenance data
• Forecast expected CCVT Failures and Replacements
• Reduce Doble-testing (currently every 4 years)
• Optimize O&M Spending
• Improve Reliability Performance of the Fleet
• Ensure Safe Operation of CCVT Fleet (no catastrophic failures)
CCVT – Mortality Analysis

23
Bigger Reliability drop expected for Vendor X and Y
Behavior due to faster mean-time-to-failure as compared with other OEMs
• Statistical model
proved life expectancy
based on Test Criteria
• Learning from
statistical models can
help shape the Testing
program
• Risk is measured as a
function of Survival
Probability
Lowest
Longevity
Vendor X
and Y
Higher longevity
Vendor A and B
CCVT – Mortality Analysis

24
Revise CCVT Replacement program to reduce operating
Cost and improve Reliability of System.
106 CCVTs
Urgent
46 CCVTs
5 yr. Forecast
• Plan asset replacement at
recommended age to
minimize risk of failure and
reduce maintenance costs
of future Doble-testing
• Manage risk based on
Failure probability model
CCVT – Mortality Analysis

25
Testing Program can be significantly reduced by implementing a Condition-
based program vs. a Time-based 4 year cycle
Recommended Test and Replacement Program • Findings based on over 20
years of Doble-Testing, Failure
and Maintenance Data
• Identified several high risk
CCVTs that required immediate
Doble testing
• Implemented reduced testing
cycles for future tests
• Developed revised Capital
Replacement program based
on results
CCVT – Mortality Analysis
Manufacturer
First Test Criteria
(years)
Continuous Testing
(years)
Replacement Age
(Years)
Vendor A 16 8 30
Vendor B 14 8 30
Vendor C 5 6 20
Vendor D 24 8 44
Vendor E 19 8 42
Vendor F 14 8 30
Vendor G 14 8 30
Vendor H 24 6 30
Vendor I 14 8 30