· Hv: 157 Hv:156 Hv : 199 Hv:207 Hv:161 20 g 20 . 129 SO . Created Date: 00000101000000Z

Chapter 6 1©2005 Pearson Education, Inc.
Diminishing Returns (pp. 199 - 207)
Labor per year1 2 3 4 5
Increasing laborholding capital
constant (A, B, C)OR
Increasing capitalholding labor constant
(E, D, C
q1 = 55
q2 = 75
q3 = 90
1
2
3
4
5Capitalper year
D
E
A B C

Chapter 6 2©2005 Pearson Education, Inc.
Production: Two Variable Inputs (pp. 199 -207)
�Substituting Among Inputs�Companies must decide what combination of
inputs to use to produce a certain quantity ofoutput
�There is a trade-off between inputs, allowingthem to use more of one input and less ofanother for the same level of output (Do youknow the Luddites in England in the early19th century?)

Chapter 6 3©2005 Pearson Education, Inc.
Production: Two Variable Inputs (pp. 199 -207)
�Substituting Among Inputs�Slope of the isoquant shows how one input
can be substituted for the other and keep thelevel of output the same
�The negative of the slope is the marginalrate of technical substitution (MRTS)� Amount by which the quantity of one input can
be reduced when one extra unit of another inputis used, so that output remains constant

Chapter 6 4©2005 Pearson Education, Inc.
Production: Two Variable Inputs (pp. 199 -207)
� The marginal rate of technicalsubstitution equals:
)( qLKMRTS
InputLaborinChange
InputCapitalinChangeMRTS
of level fixed a forΔΔ−=
−=

Chapter 6 5©2005 Pearson Education, Inc.
Production: Two Variable Inputs(pp. 199 - 207)
�As labor increases to replace capital�Labor becomes relatively less productive
�Capital becomes relatively more productive
�Need less capital to keep output constant
�Isoquant becomes flatter (convex to theorigin)
q = L K

Chapter 6 6©2005 Pearson Education, Inc.
Marginal Rate ofTechnical Substitution (pp. 199 - 207)
Labor per month
1
2
3
4
1 2 3 4 5
5Capital per year
Negative Slope measuresMRTS;
MRTS decreases as move downthe indifference curve
1
1
1
1
2
1
2/3
1/3
Q1 =55
Q2 =75
Q3 =90

Chapter 6 7©2005 Pearson Education, Inc.
MRTS and Marginal Products (pp. 199 - 207)
� If we increase labor and decrease capitalto keep output constant, we can see howmuch the increase in output is due to theincreased labor�Amount of labor increased (i.e., ΔL positive)
times the marginal productivity of labor
))(( LMPL Δ=

Chapter 6 8©2005 Pearson Education, Inc.
MRTS and Marginal Products (pp. 199 - 207)
�Similarly, the decrease in output from thedecrease in capital can be calculated�Decrease in output from reduction of
capital(ΔK is negative) times the marginalproduce of capital
))(( KMPK Δ=

Chapter 6 9©2005 Pearson Education, Inc.
MRTS and Marginal Products (pp. 199 - 207)
� If we are holding output constant, the neteffect of increasing labor and decreasingcapital must be zero
�Using changes in output from capital andlabor we can see
0 K))((MP L))((MP KL =Δ+Δ

Chapter 6 10©2005 Pearson Education, Inc.
MRTS and Marginal Products (pp. 199 - 207)
�Rearranging equation, we can see therelationship between MRTS and MPs
MRTSK
L
MP
L
K
=Δ
Δ−=
Δ=Δ
=Δ+Δ
)(
)
))(
L
KL
KL
(MP
K))((MP- (MP
0 K))((MP L))((MP
Chapter 6 11©2005 Pearson Education, Inc.
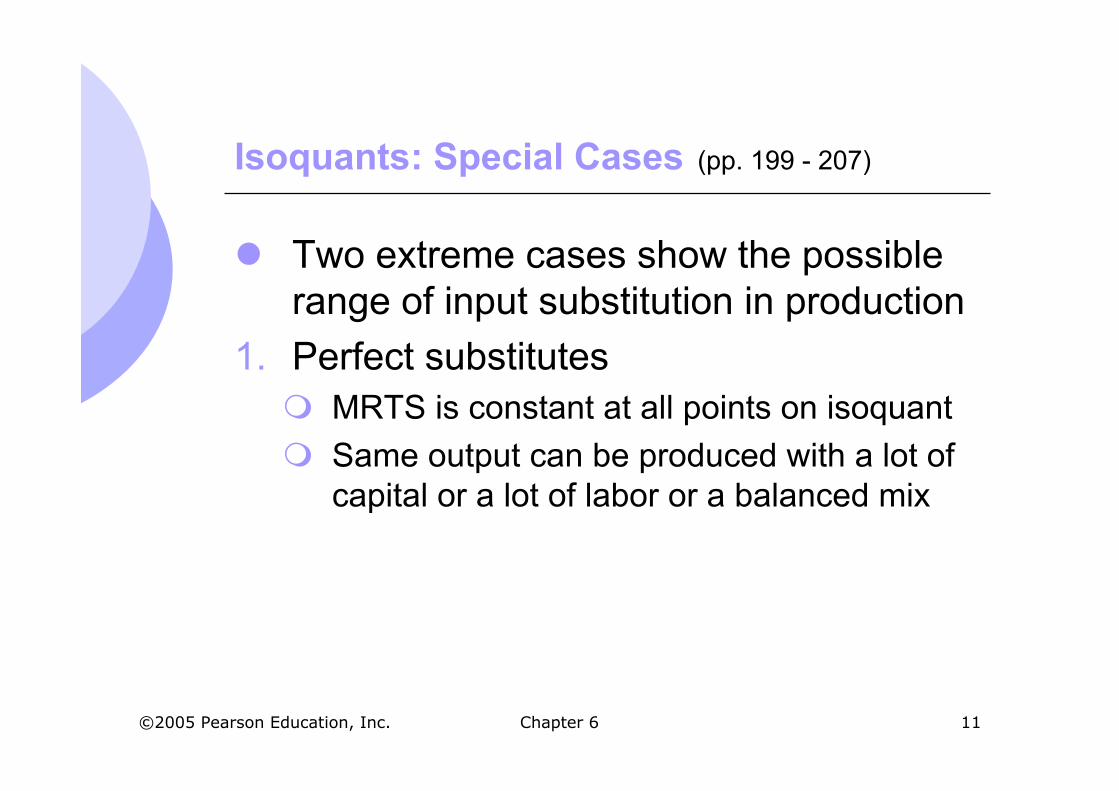
Isoquants: Special Cases (pp. 199 - 207)
� Two extreme cases show the possiblerange of input substitution in production
1. Perfect substitutes� MRTS is constant at all points on isoquant
� Same output can be produced with a lot ofcapital or a lot of labor or a balanced mix

Chapter 6 12©2005 Pearson Education, Inc.
Perfect Substitutes (pp. 199 - 207)
Laborper month
Capitalper
month
Q1 Q2 Q3
A
B
C
Same output can bereached with mostlycapital or mostly labor(A or C) or with equalamount of both (B)

Chapter 6 13©2005 Pearson Education, Inc.
Isoquants: Special Cases (pp. 199 - 207)
2. Perfect Complements� Fixed proportions production function
� There is no substitution available betweeninputs
� The output can be made with only a specificproportion of capital and labor
� Cannot increase output unless increaseboth capital and labor in that specificproportion

Chapter 6 14©2005 Pearson Education, Inc.
Fixed-ProportionsProduction Function (pp. 199 - 207)
Labor per month
Capitalper
month
L1
K1Q1
A
Q2
Q3
B
C
Same output canonly be producedwith one set ofinputs.

Chapter 6 15©2005 Pearson Education, Inc.
A Production Function forWheat (pp. 199 - 207)
� Farmers can produce crops with differentcombinations of capital and labor�Crops in US are typically grown with capital-
intensive technology
�Crops in developing countries grown withlabor-intensive productions
�Can show the different options of cropproduction with isoquants

Chapter 6 16©2005 Pearson Education, Inc.
A Production Function forWheat: Ex. 6-3 (pp. 199 - 207)
�Manager of a farm can use the isoquantto decide what combination of labor andcapital will maximize profits from cropproduction�A: 500 hours of labor, 100 units of capital for
13,800 bushels per year�B: decreases units of capital to 90, but must
increase hours of labor by 260 to 760 hours�This experiment shows the farmer the shape
of the isoquant

Chapter 6 17©2005 Pearson Education, Inc.
Isoquant Describing the Productionof Wheat : Ex. 6-3 (pp. 199 - 207)
Capital
Labor250 500 760 1000
40
80
120
10090
Output = 13,800 bushels per year
A
10- K =ΔB
260 L =Δ
Point A is more capital-intensive, and
B is more labor-intensive.

Chapter 6 18©2005 Pearson Education, Inc.
A Production Function for Wheat :Ex. 6-3 (pp. 199 - 207)
� Increase L to 760 and decrease K to 90the MRTS =0.04 < 1
04.0)260/10( =−−=ΔΔ= L
K- MRTS
�When wage (i.e.,cost of labor) is equal tocost of running a machine, more capitalshould be used
�Unless labor is much less expensive thancapital, production should be capital intensive

Chapter 6 19©2005 Pearson Education, Inc.
Returns to Scale (pp. 207 - 210)
� In addition to discussing the tradeoffbetween inputs to keep production thesame
�How does a firm decide, in the long run,the best way to increase output?�Can change the scale of production by
increasing all inputs in proportion
�If double inputs, output will most likelyincrease but by how much?

Chapter 6 20©2005 Pearson Education, Inc.
Returns to Scale (pp. 207 - 210)
�Rate at which output increases as inputsare increased proportionately�Increasing returns to scale
�Constant returns to scale
�Decreasing returns to scale

Chapter 6 21©2005 Pearson Education, Inc.
Returns to Scale (pp. 207 - 210)
� Increasing returns to scale: outputmore than doubles when all inputs aredoubled�Larger output associated with lower cost
(cars)
�One firm is more efficient than many(utilities)
�The isoquants get closer together

Chapter 6 22©2005 Pearson Education, Inc.
Increasing Returns to Scale (pp. 207 - 210)
10
20
30
The isoquantsmove closertogether
Labor (hours)5 10
Capital(machine
hours)
2
4
A

Chapter 6 23©2005 Pearson Education, Inc.
Returns to Scale (pp. 207 - 210)
�Constant returns to scale: outputdoubles when all inputs are doubled
� Size does not affect productivity
� May have a large number of producers
� Isoquants are equidistant apart

Chapter 6 24©2005 Pearson Education, Inc.
Returns to Scale (pp. 207 - 210)
ConstantReturns:
Isoquants areequally spaced
20
30
Labor (hours)155 10
A
10
Capital(machine
hours)
2
4
6

Chapter 6 25©2005 Pearson Education, Inc.
Returns to Scale (pp. 207 - 210)
�Decreasing returns to scale: outputless than doubles when all inputs aredoubled
� Decreasing efficiency with large size
� Reduction of entrepreneurial abilities
� Isoquants become farther apart
Exercise: Problem 8 on page 212. (To beincluded in your HW)

Chapter 6 26©2005 Pearson Education, Inc.
Returns to Scale (pp. 207 - 210)
Labor (hours)
Capital(machine
hours)
Decreasing Returns:Isoquants get further apart
10
10
4
A
18
5
2

Chapter 6 27©2005 Pearson Education, Inc.
Returns to Scale: Carpet IndustryEx. 6-4 (pp. 207 - 210)
� The carpet industry has grown from a small industry to alarge industry with some very large firms
� There are four relatively large manufacturers along with anumber of smaller ones
� Growth has come from� Increased consumer demand
� More efficient production reducing costs
� Innovation and competition have reduced real prices

Chapter 6 28©2005 Pearson Education, Inc.
The U.S. Carpet Industry (pp. 207 - 210)

Chapter 6 29©2005 Pearson Education, Inc.
Returns to Scale: Carpet Industry(pp. 207 - 210)
�Some growth can be explained byreturns to scale
�Carpet production is highly capitalintensive�Heavy upfront investment in machines for
carpet production
� Increases in scale of operating haveoccurred by putting in larger and moreefficient machines into larger plants

Chapter 6 30©2005 Pearson Education, Inc.
Returns to Scale: Carpet IndustryResults (pp. 207 - 210)
1. Large Manufacturers� Increases in machinery and labor
� Doubling inputs has more than doubledoutput
� Economies of scale exist for largeproducers

Chapter 6 31©2005 Pearson Education, Inc.
Returns to Scale: Carpet IndustryResults (pp. 207 - 210)
2. Small Manufacturers� Small increases in scale have little or no
impact on output
� Proportional increases in inputs increaseoutput proportionally
� Constant returns to scale for smallproducers

Chapter 6 32©2005 Pearson Education, Inc.
Returns to Scale: Carpet Industry (pp.207 - 210)
From this we can see that the carpetindustry is one where:
1. There are constant returns to scale forrelatively small plants
2. There are increasing returns to scale forrelatively larger plants� These are limited, however
� Eventually reach decreasing returns