PowerRatingofHybridElectricPower Rating of Hybrid Electric ... · PDF...
17
EVS28 KINTEX, Korea, May 3-6, 2015 Power Rating of Hybrid Electric Power Rating of Hybrid Electric Vehicles for Vehicle Classification Dongseok Choi 1 , Kihyeon Ryu, Jaewan Lee and Jaeseung Shin 1 Author 1 (corresponding author) TS Korea Automobile Testing and Research Institute, 200 Samjon-Ro, Songsan-Myun, Hwasung-Si, Gyeonggi-Do, 445-871, [email protected]
Transcript of PowerRatingofHybridElectricPower Rating of Hybrid Electric ... · PDF...

EVS28KINTEX, Korea, May 3-6, 2015
Power Rating of Hybrid ElectricPower Rating of Hybrid Electric Vehicles for Vehicle Classification
Dongseok Choi1, Kihyeon Ryu, Jaewan Lee and Jaeseung Shin1Author 1 (corresponding author) TS Korea Automobile Testing and Research Institute, ( p g ) g ,
200 Samjon-Ro, Songsan-Myun, Hwasung-Si, Gyeonggi-Do, 445-871, [email protected]

Introduction
Current situation>- Mass production of HEVs and PHEVs for energy efficiencyp gy y- Increased Electric Fraction of (P)HEVs for longer EV range- Clear demand from WLTP-SG-EV (P-to-M ratio, Downscaling Method, Gear Shift Model)
Problems>- Representative power for HEVs and PHEVs- Vehicle classification and Taxation (vehicle occupation tax)Vehicle classification and Taxation (vehicle occupation tax)- Not defined terminology on (P)HEV’s power
Suggested solution>Suggested solution>- Concept of system power
2

Motivation – Concept of system power
“What is the system power? “ The power is measured at the end side of the powertrain
without tires. The power obtained the relationship between wheel torque
and ehicle speedand vehicle speed.PowertrainEnergy Storage
Energy Converter(ICE, E-Motor, Fuel cell, …)
Drivetrain
Wheel torque Wheel torque
3
Wheel torque Wheel torque< Defined by UN/WP.29/GRPE/ VPSD IWG >

Objective“ System power ”
HEVsICE power E-Motor power
E-MotorICE
P, T
P
, T
E MotorICE
P
T T
P
Vehicle
P
T
P, T
P, T T
VN N
d
4
V : vehicle speedN : speedP : power T : torque
Background – Related standards
SAE J1491 : Vehicle Acceleration Measurement (2006)- Measuring launch response and acceleration performance- Passenger cars and light-duty trucks- Field test procedure- Uncertainty about test result- Uncertainty about test result-- Effect of ambient conditions on tire pressure and temperature-- Track coefficient of static and dynamic friction-- Non standard instrumentation-- Driver difference-- Track temperature
SAE J2908 : HEV System Power Ratings (on going)P i i (Wh l d P )
-- Track temperature
- Powertrain power rating (Wheel torque and Power)- Electric assist- Electric-only power rating
5
Electric only power rating- Regen power rating

Powertrain test bed Test bed
Dynamometer spec.• Max power : 290 kW @1100 ~ 3000 rpm• Max torque : 2500 Nm @ ~ 1100 rpm
(40% overload : 3500 Nm)• Wheel base : 1.8 ~ 3.8 m
Control jig for accelerator pedal
• Thread : 1.2 ~ 2.2 m
6

Test vehicles
Specification of powertrain for test vehicles
ItemsTestVehicles
PowerDrivetrainType
Electric Fraction(EF)
[%]ICE[kW]
E-Motor[kW]Vehicles [%][kW] [kW]
HEV 1 133.2 15 AT(6) 10.1
HEV 2 110.4 30 AT(6) 21.4
HEV 3 72.9 60.4 e-CVT 45.3
PHEV 72.9 60.4 e-CVT 45.3
HEV 4 116.3 105.2 e-CVT 47.5
EF =Motor power
(ICE power + Motor power)X 100
7
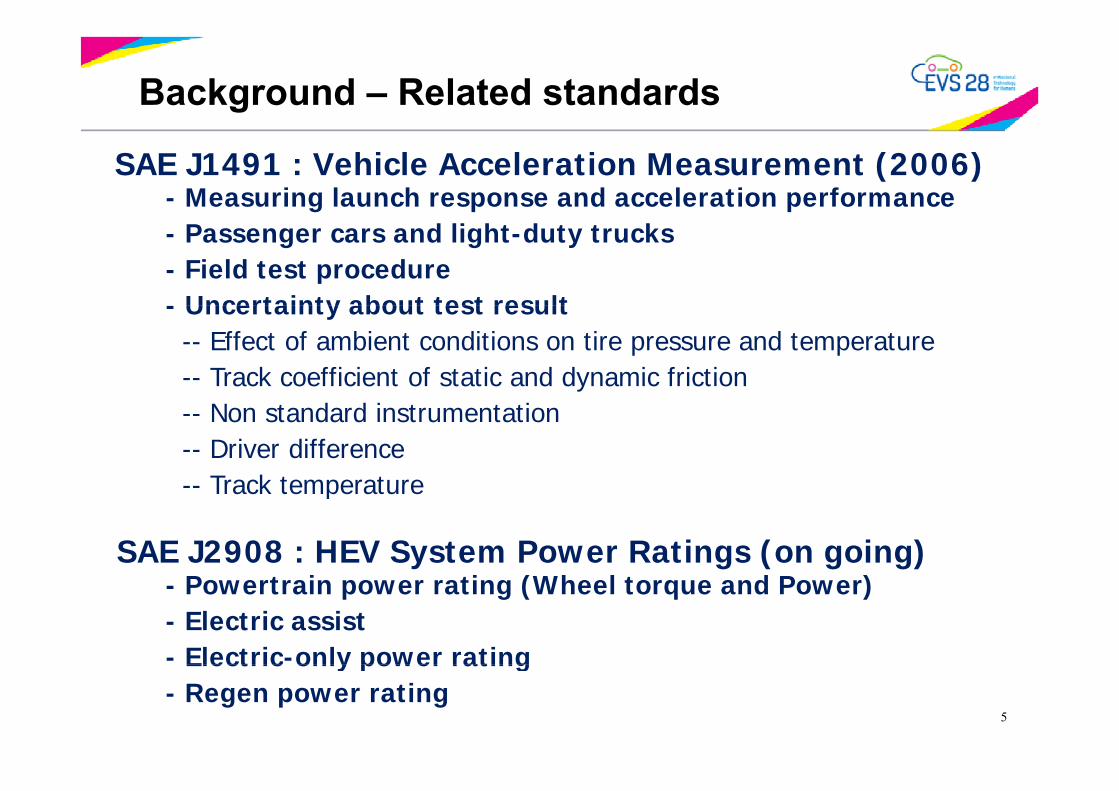
Development process
x,
V max
V min
V hi l i Test c cleVehicle warming Test cycle
ssin
g ta
pro
ces
8
Da

Test procedure and test method
@ 90 ± 10 km/h for 20min
@ 90 ± 10 km/h for 10min
RLadapted = RLtrack – Fpowertrain loss
9

Determination of max system power How to determine max system power?
: 5% error bar
Criterion for max power : < COV 2%
10
Criterion for max power : < COV 2%

Test result of HEV 1 (EF = 10.1%)Max. power : 103.4 kW
ICE (133.2 kW) AT Wheel
Motor (15 kW)
Belt
Test No.
MaxSystem
M.S.Pdifference
Vehicle Speed
V.S.difference
Power (kW) (%) (km/h) (%)
1 103.4 -0.4 139 0.5
2 103.0 -0.8 137 -1.0
3 105.0 1.2 139 0.5
Avg. 103.8 - 138 -
11
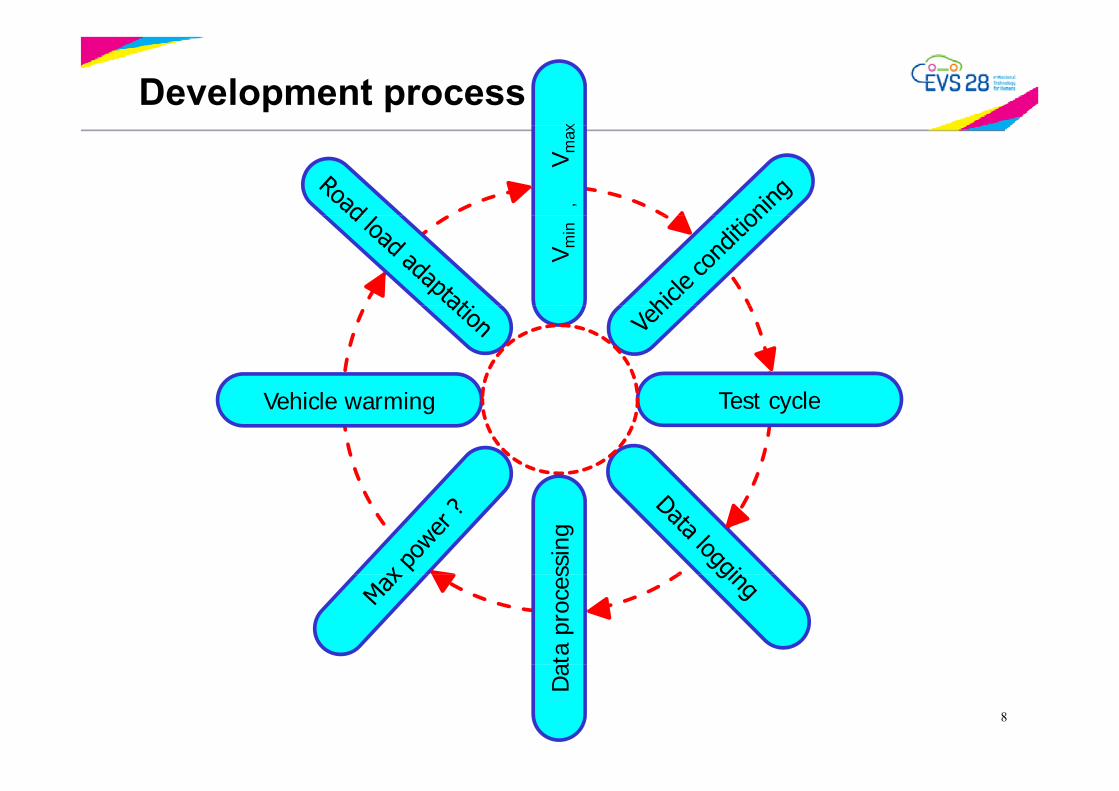
Test result of HEV 2 (EF = 21.4%)
Max. power : 103.2kWICE (110.4kW)
Motor(30kW)AT Wheel
Test No.
MaxSystem
M.S.Pdifference
Vehicle Speed
V.S.difference
Power (kW) (%) (km/h) (%)
1 102.4 -0.4 147 0.7
2 102.7 -0.1 146 0.0
3 103.2 0.4 145 -0.7
Avg. 102.8 - 146 -
12

Test result of HEV 3 (EF = 45.3%)Max. power : 74.4kWICE (72.9 kW)
Motor (60.4 kW)e-CVT Wheel
Test No.
MaxSystem
M.S.Pdifference
Vehicle Speed
V.S.difference
Power (kW) (%) (km/h) (%)
1 74.1 -0.1 139 0.2
2 74.1 -0.1 137 -1.2
3 74.4 0.3 140 1.0
Avg. 74.2 - 139 -
13

Test result of PHEV (EF = 45.3%)Max. power : 78.9kWICE (72.9 kW)
Motor (60.4 kW)e-CVT Wheel
( )
Test No.
MaxSystem
M.S.Pdifference
Vehicle Speed
V.S.difference
Power (kW) (%) (km/h) (%)
1 78.9 0.3 150 -1.7
2 78.5 -0.2 156 2.2
3 78.6 -0.1 152 -0.4
Avg. 78.7 - 153 -
14

Test result of HEV 4 (EF = 47.5%)Max. power : 119.7kWICE (116.3 kW)
Motor (105 2 kW)e-CVT Wheel
Motor (105.2 kW)
Test No.
MaxSystem
M.S.Pdifference
Vehicle Speed
V.S.difference
Power (kW) (%) (km/h) (%)
1 119.7 0.6 117 2.0
2 115.6 -2.9 113 -1.5
3 121.8 2.3 114 -0.6
Avg. 119.0 - 115 -
15

Conclusions and future work
Conclusions
System power means the power is measured at the end side of the powertrain without a tire.
For the determination of max system power, the criterion was the less than COV 2%.
The test procedure for system power measurement was developed and the test result had a good repeatability within ±3 percent.
Future work To validate the test procedure for various types of vehicles such as
plug-in hybrid vehicles and electric vehicles with in-wheel motors
16
p g y

Acknowledgements
This research was supported by the Ministry of Land, Infrastructure and Transport.It was also supported by the Korea Agency for Infrastructure Technology AdvancementIt was also supported by the Korea Agency for Infrastructure Technology Advancement
(Project No. : 13PTSI-C054118-05).
htt // k17
http://www.car.go.kr