Powerpoint template for scientific posters - Baylor University
1
Materials and Methods Five containers served as identical microenvironments. Sediment and water were collected from the first cell at the Lake Waco Wetlands (Fig. 2). 2kg of sediment, 5.5L of water, 30g of green algae were added to each container, and nutrients in the form of fertilizer were added in graduated increments of 5mL. Container 1 served as a control to which no nutrients were added. Containers were kept in the lab, with a12-hour artificial light cycle. Measurements of dissolved oxygen, carbon dioxide, and pH were taken weekly using of LaMotte test kits. A HACH DR/890 colorimeter was used to measure nitrate (Fig. 3). Samples were collected over a 3 week period. An additional container was added after week 2 to which only 1 mL of fertilizer was added. Acknowledgments Results (Figure 4) Conclusions Literature cited • “Restoring Life to the Dead Zone: Addressing Gulf Hypoxia, a National Problem.” U.S. Geological Survey. National Wetlands Research Center, Lafayette: 2000. <http://www.nwrc.usgs.gov/factshts/016- 00.pdf >. • “Hypoxia and Wetland Restoration.” U.S. EPA 2002. National Coastal Condition Report. Office of Research and Development, Office of Water, U.S. Environmental Protection Agency, Washington, DC. <http://www.epa.gov/wetlands/pdf/hypoxia_pr.pdf >. • Rheinheimer, Gerhard, and N. Walker. Aquatic Microbiology. 3rd ed. Chichester , West Sussex: John Wiley & Sons Ltd, 1986. Print. • Burns, Richard C. Nitrogen fixation in bacteria and higher plants (Molecular biology, biochemistry, and biophysics). New York : Springer-Verlag, 1975. Print. • Sprent, P.. Nitrogen Fixing Organisms: Pure and applied aspects. 1 ed. New York: Springer, 1990. Print. Introduction Hypoxia is an increasingly emerging problem in many areas destroying the natural habitat of many fresh and saltwater organisms and causing fish kills (Fig. 1). Several causes contribute to this, including climate and topography. It is suspected that nutrient pollution leads to a cycle that causes hypoxia to a greater extent than these other factors. The addition of nutrients in the form of fertilizers, animal waste, and sewage cause algal blooms that decay and consume the oxygen in the water system (NWRC, 2000). Eutrophication has been a significant part of initiating the hypoxic cycle (EPA, 2002). The question addressed by this study is this: What level of nutrients will enrich an environment without eventually causing hypoxia? Abstract Jessica Castrillon, Tiffany Goines, and Hanna Wiswall Department of Biology, Baylor University, Waco, Texas 76708 Hypoxia in a Freshwater Ecosystem related to Varying Levels of Nutrients Figure 1. The hypoxic zone or “Dead Zone” in the Gulf of Mexico is mainly due to excessive nutrients brought in by the Mississippi River. Figure 3. The picture on the left shows nitrate testing and the device used. The picture on the right is a sample with 0 mg/L of dissolved oxygen and the kit used. We would like to thank Dr. Harvill for all his patience in helping us put this together, Dr. Hill for her sound and quite timely advice, and Baylor University and the Lake Waco Wetlands for allowing us this opportunity and supporting us in our work. Thank you! There is evidence that nutrient pollution and eutrophication of water result in hypoxia, with levels of dissolved oxygen below 2ppm. The goal of this preliminary study was to provide data on the maximum levels of nutrients that will result in positive effects on an environment that do not lead to hypoxia. This was tested by adding gradually increasing levels of fertilizer to six separate, identical microenvironments. Measures of carbon dioxide, dissolved oxygen, pH, and nitrate were taken weekly. The results demonstrated high levels of fertilizer cause dramatic fluctuations in DO, while even a relatively low level still leads to hypoxia. Future studies in this area are advised to use lower increments of fertilizer. An inverse relationship is shown between nitrogen and dissolved oxygen consumption and breakdown. A hypothesis was formed that the nitrate levels in Containers 4 and 5 would be extremely high and cause hypoxia rapidly. This was clearly shown in the results (Fig. 4). After week 2, there was an algal bloom that caused depletion in nitrogen levels and an increase in dissolved oxygen levels. After week 3, bacteria began to consume the decomposed algae which caused nitrification, which in turn, caused another spike in nitrate levels in week 4. As algae was photosynthesizing it used CO 2 causing a gradual increase in dissolved oxygen. The dissolved oxygen was then consumed by the bacteria causing the CO 2 to increase after week 2. Figure 2. The Lake Waco Wetlands consists of five connected cells which water flows through. As the water progresses through each cell it is filtered. 7 7.1 7.2 7.3 7.4 7.5 7.6 7.7 7.8 7.9 8 1 2 3 4 pH Weeks pH 0 1 2 3 4 5 6 7 1 2 3 4 nitrate levels (mg/L) Weeks Nitrates Container 1 Container 2 Container 3 Container 4 Container 5 Container 6 0 5 10 15 20 25 30 35 1 2 3 4 CO 2 levels (ppm) Weeks Carbon Dioxide 0 2 4 6 8 10 12 14 16 1 2 3 4 dissolved oxygen (ppm) Weeks Dissolved Oxygen Based on the data collected in the preliminary experiment, the relationship between dissolved oxygen and nitrogen had confirmed our hypothesis. As the level of nitrates increased, the levels of dissolved oxygen decreased. The trend can be concluded in the opposed measurements taken for nitrates and dissolved oxygen in four consecutive weeks tested. Carbon dioxide also played a role in the data. During the second week the levels increased to the maximum amount, and then gradually decreased. This fluctuation can also be seen in the pH measurement fluctuation between 7 and 8. This trend evaluated in dissolved oxygen, carbon dioxide, pH, and nitrates can be attributed to photosynthesis and nitrification (Sprent, 1990; Burns, 1975).
Transcript of Powerpoint template for scientific posters - Baylor University
Materials and MethodsFive containers served as identical
microenvironments. Sediment and
water were collected from the first cell
at the Lake Waco Wetlands (Fig. 2).
2kg of sediment, 5.5L of water, 30g of
green algae were added to each
container, and nutrients in the form of
fertilizer were added in graduated
increments of 5mL. Container 1 served
as a control to which no nutrients were
added. Containers were kept in the lab,
with a12-hour artificial light cycle.
Measurements of dissolved
oxygen, carbon dioxide, and pH were
taken weekly using of LaMotte test kits.
A HACH DR/890 colorimeter was used
to measure nitrate (Fig. 3). Samples
were collected over a 3 week period.
An additional container was added after
week 2 to which only 1 mL of fertilizer
was added.
Acknowledgments
Results (Figure 4)
Conclusions
Literature cited
• “Restoring Life to the Dead Zone: Addressing Gulf
Hypoxia, a National Problem.” U.S. Geological
Survey. National Wetlands Research Center,
Lafayette:
2000. <http://www.nwrc.usgs.gov/factshts/016-
00.pdf>.
• “Hypoxia and Wetland Restoration.” U.S. EPA 2002.
National Coastal Condition Report. Office of
Research and Development, Office of Water, U.S.
Environmental Protection Agency, Washington,
DC.
<http://www.epa.gov/wetlands/pdf/hypoxia_pr.pdf>.
• Rheinheimer, Gerhard, and N. Walker. Aquatic
Microbiology. 3rd ed. Chichester , West Sussex: John
Wiley & Sons Ltd, 1986. Print.
• Burns, Richard C. Nitrogen fixation in bacteria and
higher plants (Molecular biology, biochemistry, and
biophysics). New York : Springer-Verlag, 1975. Print.
• Sprent, P.. Nitrogen Fixing Organisms: Pure and
applied aspects. 1 ed. New York: Springer, 1990. Print.
IntroductionHypoxia is an increasingly emerging problem in
many areas destroying the natural habitat of many
fresh and saltwater organisms and causing fish kills
(Fig. 1). Several causes contribute to this, including
climate and topography. It is suspected that nutrient
pollution leads to a cycle that causes hypoxia to a
greater extent than these other factors. The addition
of nutrients in the form of fertilizers, animal waste,
and sewage cause algal blooms that decay and
consume the oxygen in the water system (NWRC,
2000).
Eutrophication has been a significant part of
initiating the hypoxic cycle (EPA, 2002). The
question addressed by this study is this: What level
of nutrients will enrich an environment without
eventually causing hypoxia?
Abstract
Jessica Castrillon, Tiffany Goines, and Hanna Wiswall
Department of Biology, Baylor University, Waco, Texas 76708
Hypoxia in a Freshwater Ecosystem related to Varying Levels of Nutrients
Figure 1. The
hypoxic zone or “Dead Zone” in the Gulf of Mexico is mainly due to excessive nutrients brought in by the Mississippi River.
Figure 3. The picture on the left shows nitrate testing
and the device used. The picture on the right is a
sample with 0 mg/L of dissolved oxygen and the kit
used.
We would like to thank Dr. Harvill for all his patience
in helping us put this together, Dr. Hill for her sound and
quite timely advice, and Baylor University and the Lake
Waco Wetlands for allowing us this opportunity and
supporting us in our work. Thank you!
There is evidence that nutrient pollution and
eutrophication of water result in hypoxia, with
levels of dissolved oxygen below 2ppm. The goal
of this preliminary study was to provide data on
the maximum levels of nutrients that will result in
positive effects on an environment that do not lead
to hypoxia. This was tested by adding gradually
increasing levels of fertilizer to six separate,
identical microenvironments. Measures of carbon
dioxide, dissolved oxygen, pH, and nitrate were
taken weekly. The results demonstrated high
levels of fertilizer cause dramatic fluctuations in
DO, while even a relatively low level still leads to
hypoxia. Future studies in this area are advised to
use lower increments of fertilizer.
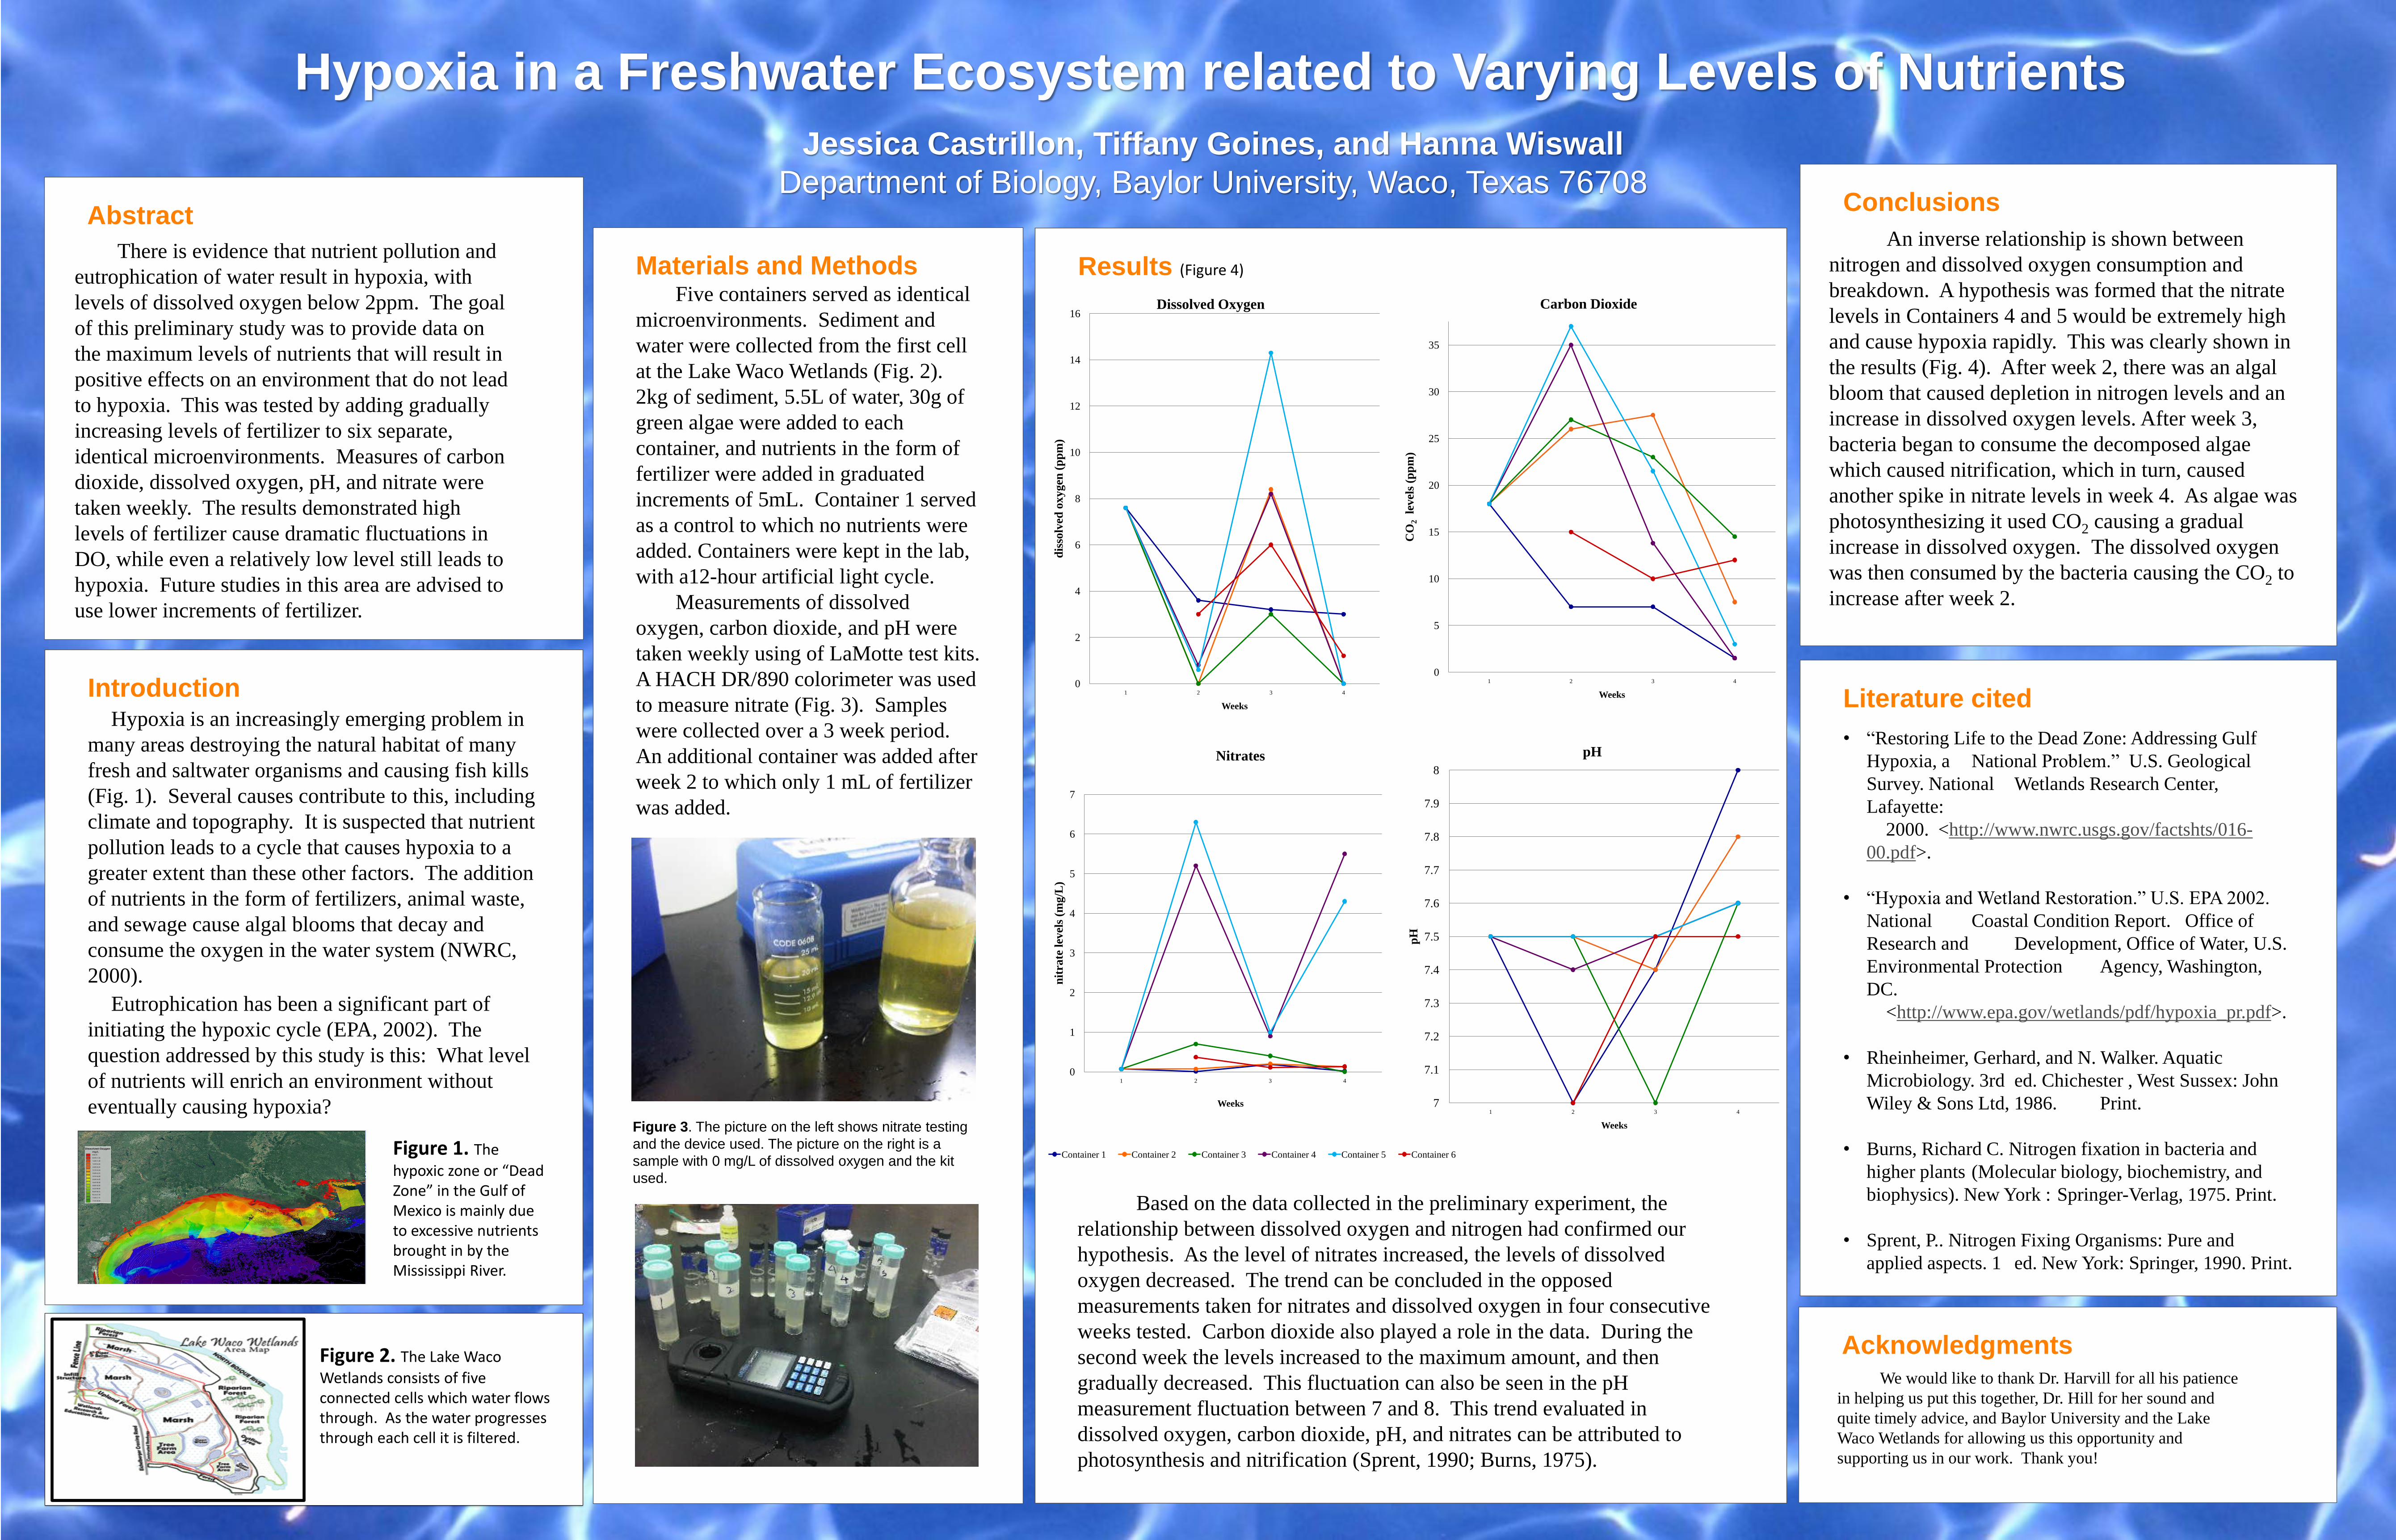
An inverse relationship is shown between
nitrogen and dissolved oxygen consumption and
breakdown. A hypothesis was formed that the nitrate
levels in Containers 4 and 5 would be extremely high
and cause hypoxia rapidly. This was clearly shown in
the results (Fig. 4). After week 2, there was an algal
bloom that caused depletion in nitrogen levels and an
increase in dissolved oxygen levels. After week 3,
bacteria began to consume the decomposed algae
which caused nitrification, which in turn, caused
another spike in nitrate levels in week 4. As algae was
photosynthesizing it used CO2 causing a gradual
increase in dissolved oxygen. The dissolved oxygen
was then consumed by the bacteria causing the CO2 to
increase after week 2.
Figure 2. The Lake Waco
Wetlands consists of five connected cells which water flows through. As the water progresses through each cell it is filtered.
7
7.1
7.2
7.3
7.4
7.5
7.6
7.7
7.8
7.9
8
1 2 3 4
pH
Weeks
pH
0
1
2
3
4
5
6
7
1 2 3 4
nit
rate
lev
els
(mg
/L)
Weeks
Nitrates
Container 1 Container 2 Container 3 Container 4 Container 5 Container 6
0
5
10
15
20
25
30
35
1 2 3 4
CO
2le
vel
s (p
pm
)
Weeks
Carbon Dioxide
0
2
4
6
8
10
12
14
16
1 2 3 4
dis
solv
ed o
xy
gen
(p
pm
)
Weeks
Dissolved Oxygen
Based on the data collected in the preliminary experiment, the
relationship between dissolved oxygen and nitrogen had confirmed our
hypothesis. As the level of nitrates increased, the levels of dissolved
oxygen decreased. The trend can be concluded in the opposed
measurements taken for nitrates and dissolved oxygen in four consecutive
weeks tested. Carbon dioxide also played a role in the data. During the
second week the levels increased to the maximum amount, and then
gradually decreased. This fluctuation can also be seen in the pH
measurement fluctuation between 7 and 8. This trend evaluated in
dissolved oxygen, carbon dioxide, pH, and nitrates can be attributed to
photosynthesis and nitrification (Sprent, 1990; Burns, 1975).