PowerPoint Presentation · prospectus or offer document under the applicable laws of ... modify or...
31
Q1FY17 CORPORATE PRESENTATION
Transcript of PowerPoint Presentation · prospectus or offer document under the applicable laws of ... modify or...

Q1FY17CORPORATE PRESENTATION
This presentation has been prepared by and is the sole responsibility of Capital First Limited (together with its subsidiaries, referred to as the
“Company”). By accessing this presentation, you are agreeing to be bound by the trailing restrictions.
This presentation does not constitute or form part of any offer or invitation or inducement to sell or issue, or any solicitation of any offer or
recommendation to purchase or subscribe for, any securities of the Company, nor shall it or any part of it or the fact of its distribution form
the basis of, or be relied on in connection with, any contractor commitment therefore. In particular, this presentation is not intended to be a
prospectus or offer document under the applicable laws of any jurisdiction, including India. No representation or warranty, express or
implied, is made as to, and no reliance should be placed on, the fairness, accuracy, completeness or correctness of the information or
opinions contained in this presentation. Such information and opinions are in all events not current after the date of this presentation. There
is no obligation to update, modify or amend this communication or to otherwise notify the recipient if information, opinion, projection,
forecast or estimate set forth herein, changes or subsequently becomes inaccurate.
Certain statements contained in this presentation that are not statements of historical fact constitute “forward-looking statements.” You can
generally identify forward-looking statements by terminology such as “aim”, “anticipate”, “believe”, “continue”, “could”, “estimate”, “expect”,
“intend”, “may”, “objective”, “goal”, “plan”, “potential”, “project”, “pursue”, “shall”, “should”, “will”, “would”, or other words or phrases of
similar import. These forward-looking statements involve known and unknown risks, uncertainties, assumptions and other factors that may
cause the Company’s actual results, performance or achievements to be materially different from any future results, performance or
achievements expressed or implied by such forward-looking statements or other projections. Important factors that could cause actual
results, performance or achievements to differ materially include, among others: (a) material changes in the regulations governing our
businesses; (b) the Company's inability to comply with the capital adequacy norms prescribed by the RBI; (c) decrease in the value of the
Company's collateral or delays in enforcing the Company's collateral upon default by borrowers on their obligations to the Company; (d) the
Company's inability to control the level of NPAs in the Company's portfolio effectively; (e) certain failures, including internal or external fraud,
operational errors, systems malfunctions, or cyber security incidents; (f) volatility in interest rates and other market conditions; and(g) any
adverse changes to the Indian economy.
This presentation is for general information purposes only, without regard to any specific objectives, financial situations or informational
needs of any particular person. The Company may alter, modify or otherwise change in any manner the content of this presentation, without
obligation to notify any person of such change or changes.
Disclaimer
2
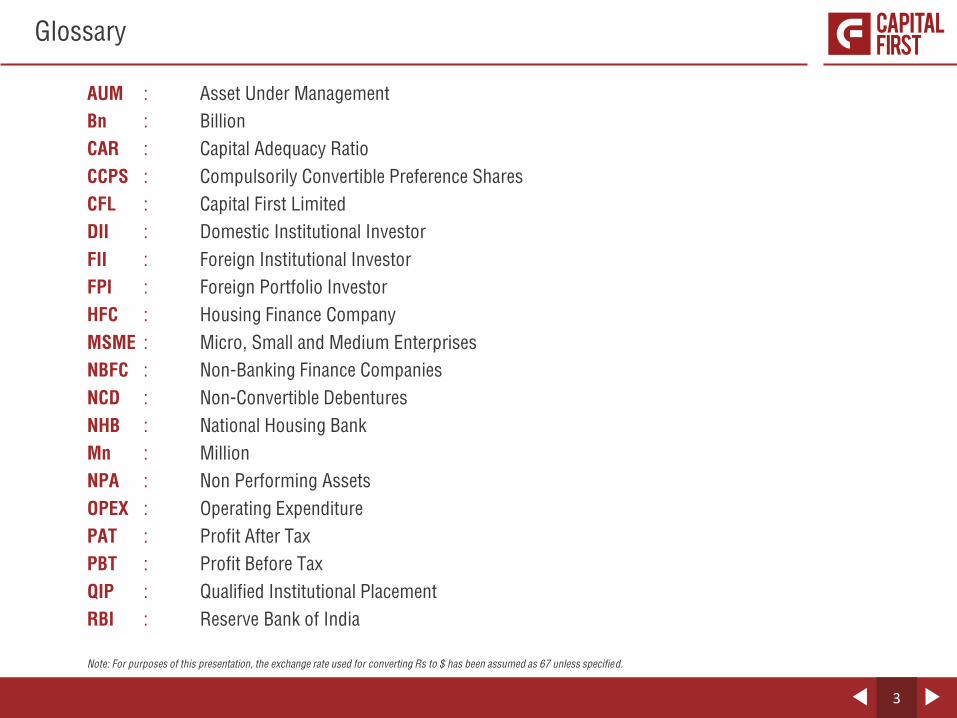
Glossary
AUM : Asset Under Management
Bn : Billion
CAR : Capital Adequacy Ratio
CCPS : Compulsorily Convertible Preference Shares
CFL : Capital First Limited
DII : Domestic Institutional Investor
FII : Foreign Institutional Investor
FPI : Foreign Portfolio Investor
HFC : Housing Finance Company
MSME : Micro, Small and Medium Enterprises
NBFC : Non-Banking Finance Companies
NCD : Non-Convertible Debentures
NHB : National Housing Bank
Mn : Million
NPA : Non Performing Assets
OPEX : Operating Expenditure
PAT : Profit After Tax
PBT : Profit Before Tax
QIP : Qualified Institutional Placement
RBI : Reserve Bank of India
Note: For purposes of this presentation, the exchange rate used for converting Rs to $ has been assumed as 67 unless specified.
3

Overview of the Company
Changing Asset Composition
Product Offering
Credit Processes
Credit Rating & Capital Position
Board of Directors
Shareholding Pattern
Financial Results
Page : 5
Page : 8
Page : 10
Page : 16
Page : 19
Page : 22
Page : 25
Page : 25
Agenda
01
02
03
04
05
06
07
08
4
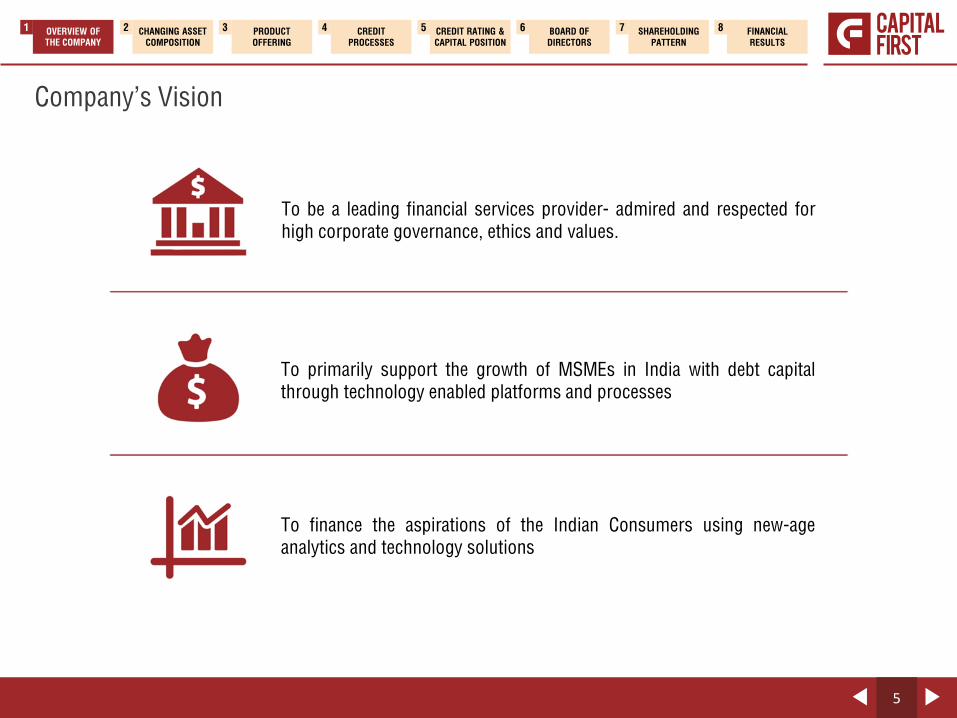
To be a leading financial services provider- admired and respected for
high corporate governance, ethics and values.
To primarily support the growth of MSMEs in India with debt capital
through technology enabled platforms and processes
To finance the aspirations of the Indian Consumers using new-age
analytics and technology solutions
Company’s Vision
FINANCIAL
RESULTS
8SHAREHOLDING
PATTERN
7BOARD OF
DIRECTORS
6CREDIT RATING &
CAPITAL POSITION
5CREDIT
PROCESSES
4PRODUCT
OFFERING
3CHANGING ASSET
COMPOSITION
2OVERVIEW OF
THE COMPANY
1
5
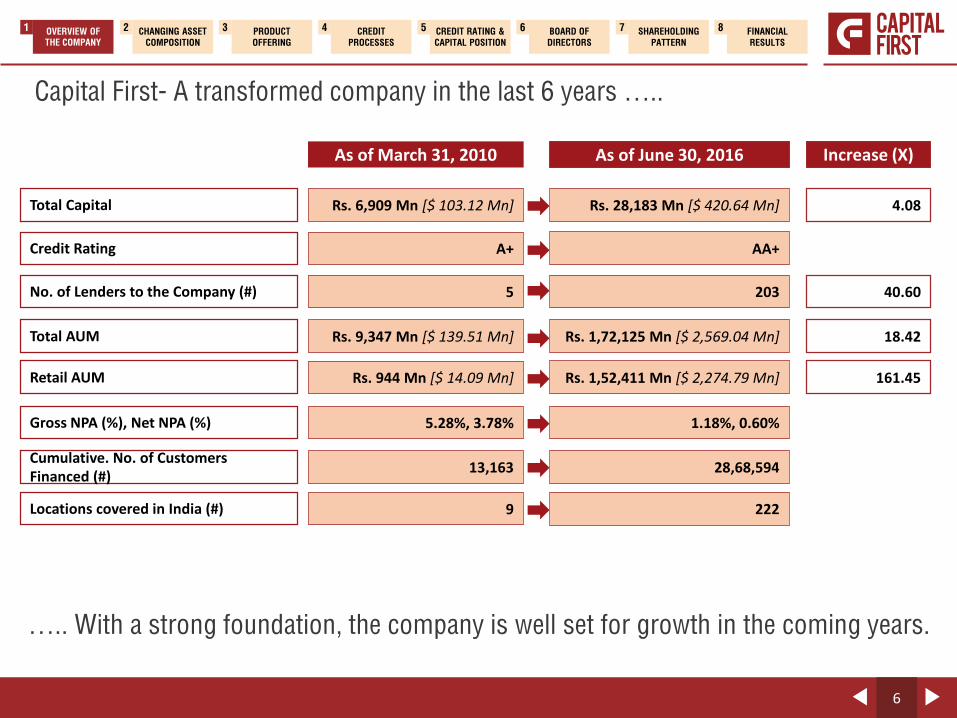
Capital First- A transformed company in the last 6 years …..
….. With a strong foundation, the company is well set for growth in the coming years.
Total Capital
Locations covered in India (#)
Credit Rating
No. of Lenders to the Company (#)
Total AUM
Retail AUM
Gross NPA (%), Net NPA (%)
Cumulative. No. of Customers Financed (#)
Rs. 6,909 Mn [$ 103.12 Mn]
9
A+
5
Rs. 9,347 Mn [$ 139.51 Mn]
Rs. 944 Mn [$ 14.09 Mn]
5.28%, 3.78%
13,163
As of March 31, 2010
Rs. 28,183 Mn [$ 420.64 Mn]
222
AA+
203
Rs. 1,72,125 Mn [$ 2,569.04 Mn]
Rs. 1,52,411 Mn [$ 2,274.79 Mn]
1.18%, 0.60%
28,68,594
As of June 30, 2016
4.08
40.60
18.42
161.45
Increase (X)
6
FINANCIAL
RESULTS
8SHAREHOLDING
PATTERN
7BOARD OF
DIRECTORS
6CREDIT RATING &
CAPITAL POSITION
5CREDIT
PROCESSES
4PRODUCT
OFFERING
3CHANGING ASSET
COMPOSITION
2OVERVIEW OF
THE COMPANY
1
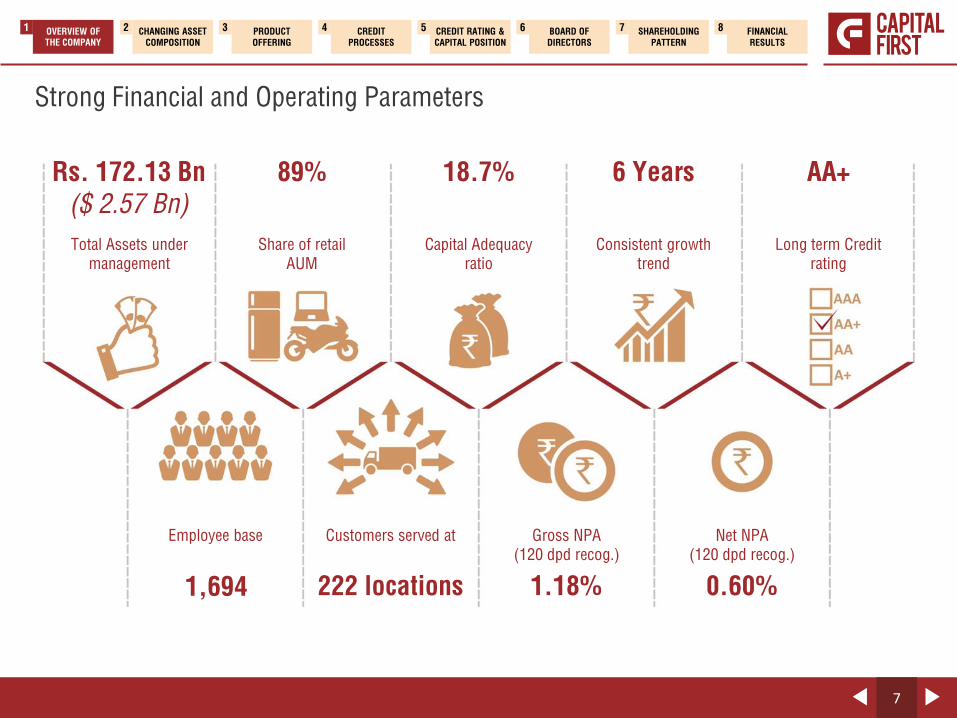
Strong Financial and Operating Parameters
Rs. 172.13 Bn
($ 2.57 Bn)
89% 18.7% 6 Years AA+
Total Assets under
management
Share of retail
AUM
Capital Adequacy
ratio
Consistent growth
trend
Long term Credit
rating
Employee base Customers served at Gross NPA
(120 dpd recog.)
Net NPA
(120 dpd recog.)
222 locations 1.18% 0.60%1,694
7
FINANCIAL
RESULTS
8SHAREHOLDING
PATTERN
7BOARD OF
DIRECTORS
6CREDIT RATING &
CAPITAL POSITION
5CREDIT
PROCESSES
4PRODUCT
OFFERING
3CHANGING ASSET
COMPOSITION
2OVERVIEW OF
THE COMPANY
1
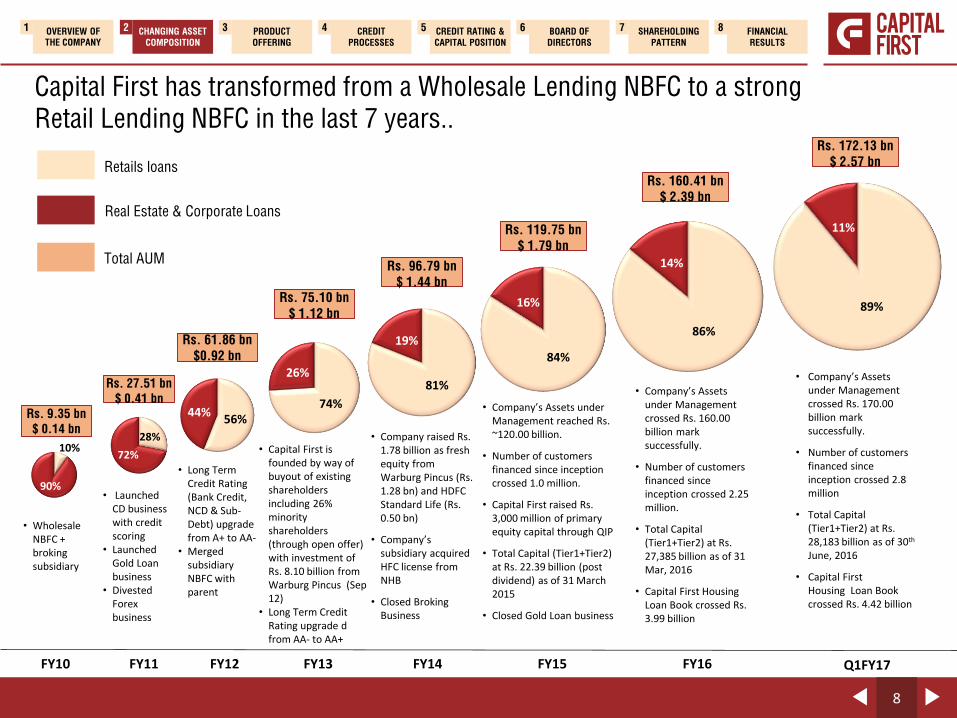
Capital First has transformed from a Wholesale Lending NBFC to a strong
Retail Lending NBFC in the last 7 years..
8
FINANCIAL
RESULTS
8SHAREHOLDING
PATTERN
7BOARD OF
DIRECTORS
6CREDIT RATING &
CAPITAL POSITION
5CREDIT
PROCESSES
4PRODUCT
OFFERING
3CHANGING ASSET
COMPOSITION
2OVERVIEW OF
THE COMPANY
1
Retails loans
Real Estate & Corporate Loans
Total AUM
89%
11%
FY11 FY12 FY13 FY14 FY15
• Launched CD business with credit scoring
• Launched Gold Loan business
• Divested Forex business
• Long Term Credit Rating (Bank Credit, NCD & Sub-Debt) upgrade from A+ to AA-
• Merged subsidiary NBFC with parent
• Capital First is founded by way of buyout of existing shareholders including 26% minority shareholders (through open offer) with investment of Rs. 8.10 billion from Warburg Pincus (Sep 12)
• Long Term Credit Rating upgrade d from AA- to AA+
• Company raised Rs. 1.78 billion as fresh equity from Warburg Pincus (Rs. 1.28 bn) and HDFC Standard Life (Rs. 0.50 bn)
• Company’s subsidiary acquired HFC license from NHB
• Closed Broking Business
Rs. 27.51 bn
$ 0.41 bn
Rs. 61.86 bn
$0.92 bn
Rs. 75.10 bn
$ 1.12 bn
Rs. 96.79 bn
$ 1.44 bn
Rs. 119.75 bn
$ 1.79 bn
• Company’s Assets under Management reached Rs. ~120.00 billion.
• Number of customers financed since inception crossed 1.0 million.
• Capital First raised Rs. 3,000 million of primary equity capital through QIP
• Total Capital (Tier1+Tier2) at Rs. 22.39 billion (post dividend) as of 31 March 2015
• Closed Gold Loan business
FY16 Q1FY17
Rs. 160.41 bn
$ 2.39 bn
Rs. 172.13 bn
$ 2.57 bn
• Company’s Assets under Management crossed Rs. 160.00 billion mark successfully.
• Number of customers financed since inception crossed 2.25 million.
• Total Capital (Tier1+Tier2) at Rs. 27,385 billion as of 31 Mar, 2016
• Capital First Housing Loan Book crossed Rs. 3.99 billion
28%
72%
56%44%
74%
26%81%
19%
84%
16%
86%
14%
• Company’s Assets under Management crossed Rs. 170.00 billion mark successfully.
• Number of customers financed since inception crossed 2.8 million
• Total Capital (Tier1+Tier2) at Rs. 28,183 billion as of 30th
June, 2016
• Capital First Housing Loan Book crossed Rs. 4.42 billion
• Wholesale NBFC + broking subsidiary
Rs. 9.35 bn
$ 0.14 bn
10%
90%
FY10
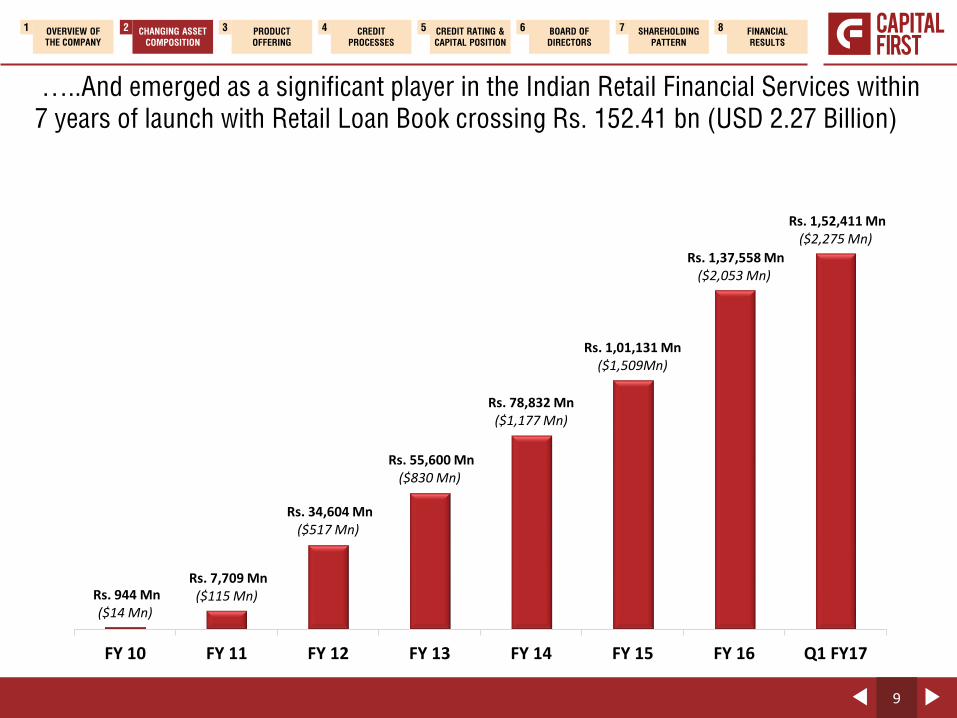
…..And emerged as a significant player in the Indian Retail Financial Services within
7 years of launch with Retail Loan Book crossing Rs. 152.41 bn (USD 2.27 Billion)
9
FINANCIAL
RESULTS
8SHAREHOLDING
PATTERN
7BOARD OF
DIRECTORS
6CREDIT RATING &
CAPITAL POSITION
5CREDIT
PROCESSES
4PRODUCT
OFFERING
3CHANGING ASSET
COMPOSITION
2OVERVIEW OF
THE COMPANY
1
Rs. 944 Mn($14 Mn)
Rs. 7,709 Mn($115 Mn)
Rs. 34,604 Mn($517 Mn)
Rs. 55,600 Mn($830 Mn)
Rs. 78,832 Mn($1,177 Mn)
Rs. 1,01,131 Mn($1,509Mn)
Rs. 1,37,558 Mn($2,053 Mn)
Rs. 1,52,411 Mn($2,275 Mn)
FY 10 FY 11 FY 12 FY 13 FY 14 FY 15 FY 16 Q1 FY17
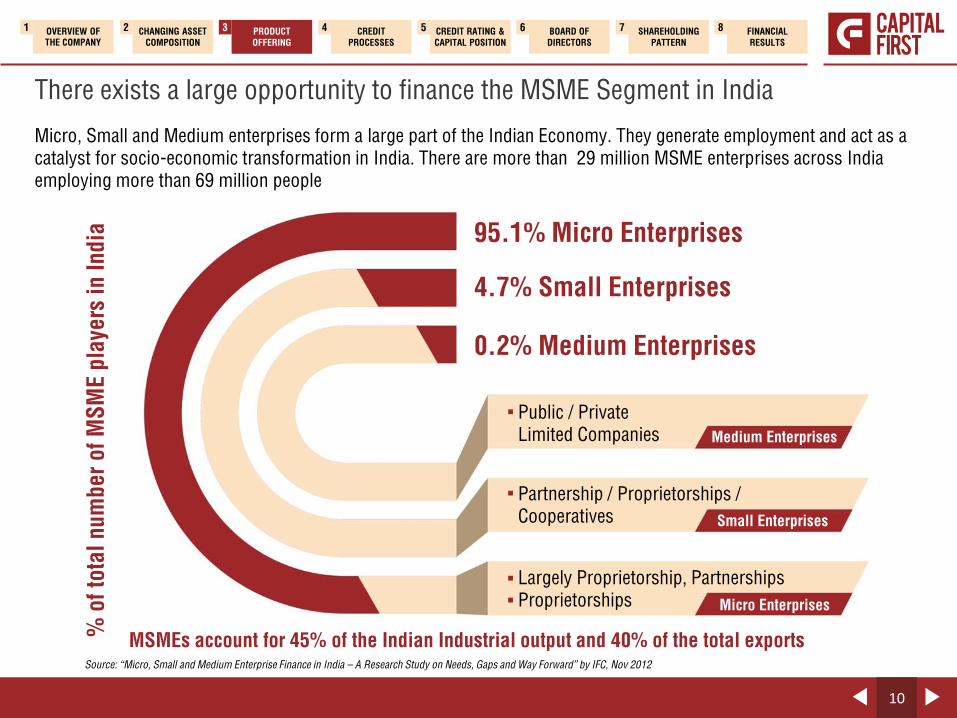
There exists a large opportunity to finance the MSME Segment in India
Micro, Small and Medium enterprises form a large part of the Indian Economy. They generate employment and act as a
catalyst for socio-economic transformation in India. There are more than 29 million MSME enterprises across India
employing more than 69 million people
95.1% Micro Enterprises
4.7% Small Enterprises
0.2% Medium Enterprises
Public / Private
Limited Companies
Partnership / Proprietorships /
Cooperatives
Largely Proprietorship, Partnerships
Proprietorships
Medium Enterprises
Small Enterprises
Micro Enterprises
MSMEs account for 45% of the Indian Industrial output and 40% of the total exports
% o
f to
tal
num
ber
of
MS
ME p
laye
rs i
n I
nd
ia
Source: “Micro, Small and Medium Enterprise Finance in India – A Research Study on Needs, Gaps and Way Forward” by IFC, Nov 2012
10
FINANCIAL
RESULTS
8SHAREHOLDING
PATTERN
7BOARD OF
DIRECTORS
6CREDIT RATING &
CAPITAL POSITION
5CREDIT
PROCESSES
4PRODUCT
OFFERING
3CHANGING ASSET
COMPOSITION
2OVERVIEW OF
THE COMPANY
1
11
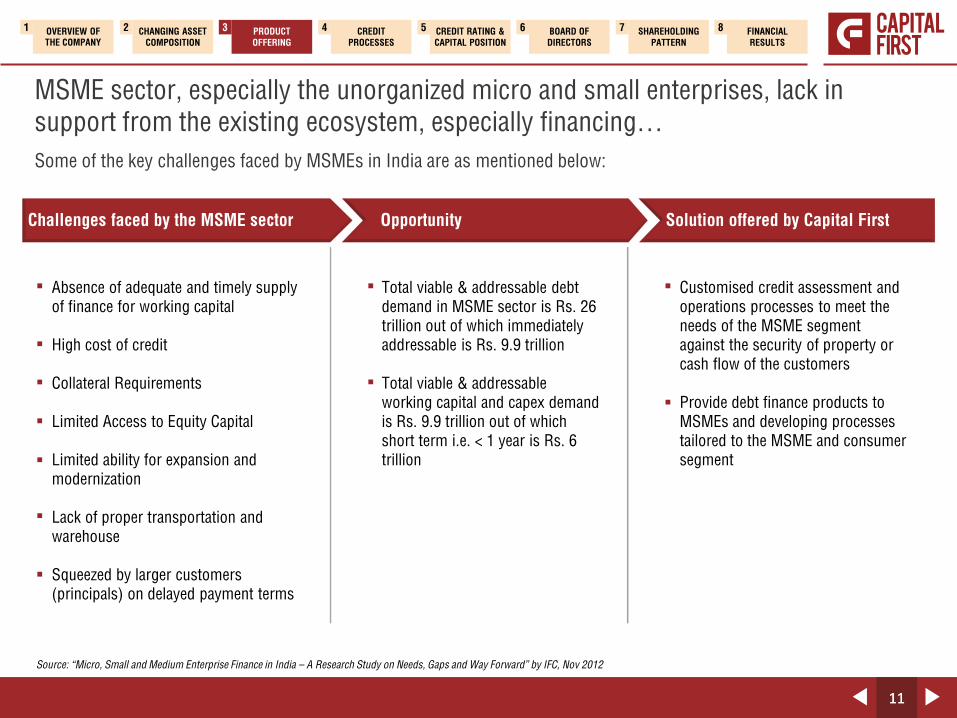
MSME sector, especially the unorganized micro and small enterprises, lack in
support from the existing ecosystem, especially financing…
Some of the key challenges faced by MSMEs in India are as mentioned below:
Challenges faced by the MSME sector Opportunity Solution offered by Capital First
Absence of adequate and timely supply
of finance for working capital
High cost of credit
Collateral Requirements
Limited Access to Equity Capital
Limited ability for expansion and
modernization
Lack of proper transportation and
warehouse
Squeezed by larger customers
(principals) on delayed payment terms
Total viable & addressable debt
demand in MSME sector is Rs. 26
trillion out of which immediately
addressable is Rs. 9.9 trillion
Total viable & addressable
working capital and capex demand
is Rs. 9.9 trillion out of which
short term i.e. < 1 year is Rs. 6
trillion
Customised credit assessment and
operations processes to meet the
needs of the MSME segment
against the security of property or
cash flow of the customers
Provide debt finance products to
MSMEs and developing processes
tailored to the MSME and consumer
segment
Source: “Micro, Small and Medium Enterprise Finance in India – A Research Study on Needs, Gaps and Way Forward” by IFC, Nov 2012
11
FINANCIAL
RESULTS
8SHAREHOLDING
PATTERN
7BOARD OF
DIRECTORS
6CREDIT RATING &
CAPITAL POSITION
5CREDIT
PROCESSES
4PRODUCT
OFFERING
3CHANGING ASSET
COMPOSITION
2OVERVIEW OF
THE COMPANY
1
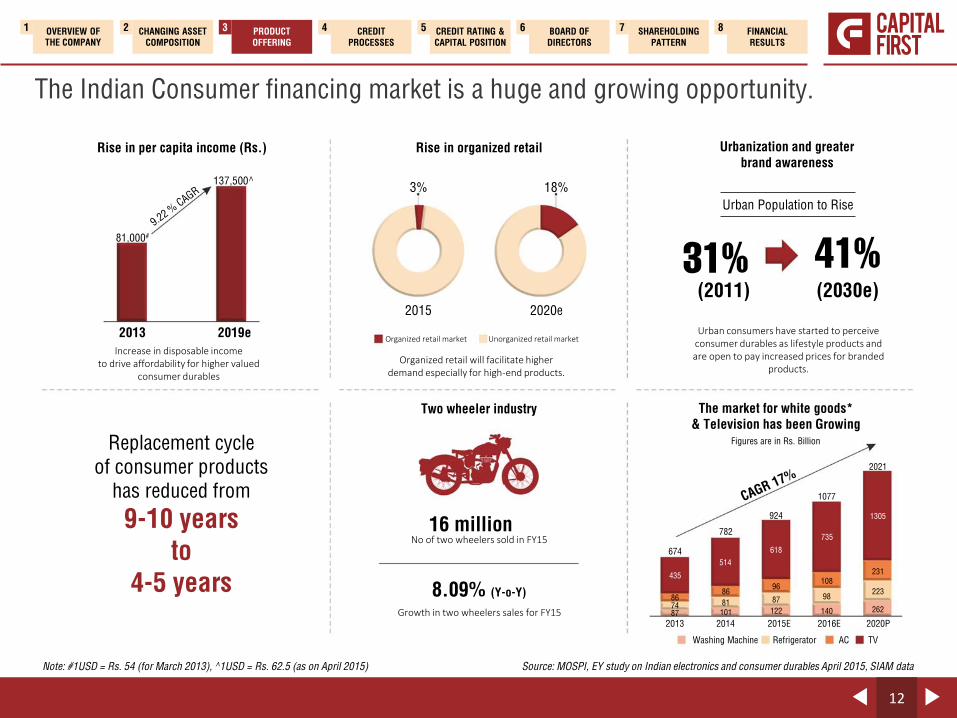
The Indian Consumer financing market is a huge and growing opportunity.
Rise in per capita income (Rs.)
137,500^
81,000#
2013 2019e
Increase in disposable incometo drive affordability for higher valued
consumer durables
Replacement cycle
of consumer products
has reduced from
9-10 years
to
4-5 years
Note: #1USD = Rs. 54 (for March 2013), ̂ 1USD = Rs. 62.5 (as on April 2015)
Organized retail will facilitate higherdemand especially for high-end products.
Organized retail market Unorganized retail market
2015 2020e
18%3%
Rise in organized retail
Two wheeler industry
16 millionNo of two wheelers sold in FY15
8.09% (Y-o-Y)
Growth in two wheelers sales for FY15
Urbanization and greater
brand awareness
Urban Population to Rise
31% 41%(2011) (2030e)
Urban consumers have started to perceive consumer durables as lifestyle products and are open to pay increased prices for branded
products.
Source: MOSPI, EY study on Indian electronics and consumer durables April 2015, SIAM data
The market for white goods*
& Television has been GrowingFigures are in Rs. Billion
674
782
924
435
514
618
735
1077
1305
2021
231
140
98
10896
87
122101
81
86
877486
2013 2014 2015E 2016E 2020P
Washing Machine Refrigerator AC TV
223
262
12
FINANCIAL
RESULTS
8SHAREHOLDING
PATTERN
7BOARD OF
DIRECTORS
6CREDIT RATING &
CAPITAL POSITION
5CREDIT
PROCESSES
4PRODUCT
OFFERING
3CHANGING ASSET
COMPOSITION
2OVERVIEW OF
THE COMPANY
1
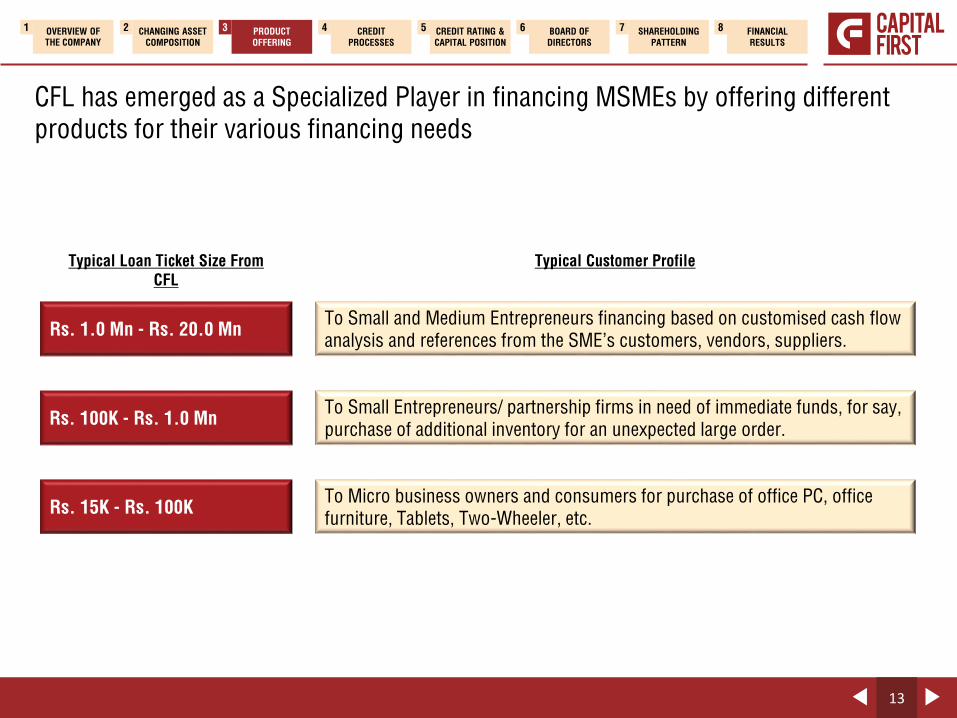
CFL has emerged as a Specialized Player in financing MSMEs by offering different
products for their various financing needs
Typical Loan Ticket Size From
CFL
Rs. 15K - Rs. 100KTo Micro business owners and consumers for purchase of office PC, office
furniture, Tablets, Two-Wheeler, etc.
Rs. 100K - Rs. 1.0 MnTo Small Entrepreneurs/ partnership firms in need of immediate funds, for say,
purchase of additional inventory for an unexpected large order.
Rs. 1.0 Mn - Rs. 20.0 MnTo Small and Medium Entrepreneurs financing based on customised cash flow
analysis and references from the SME’s customers, vendors, suppliers.
Typical Customer Profile
13
FINANCIAL
RESULTS
8SHAREHOLDING
PATTERN
7BOARD OF
DIRECTORS
6CREDIT RATING &
CAPITAL POSITION
5CREDIT
PROCESSES
4PRODUCT
OFFERING
3CHANGING ASSET
COMPOSITION
2OVERVIEW OF
THE COMPANY
1
14
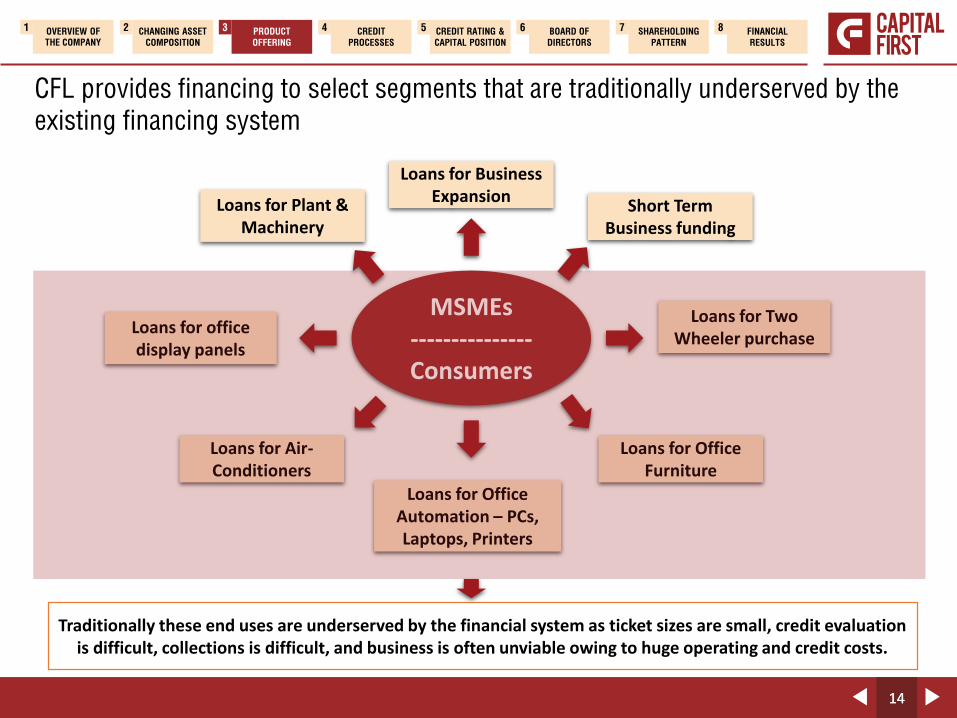
CFL provides financing to select segments that are traditionally underserved by the
existing financing system
MSMEs---------------Consumers
Loans for Business Expansion
Short Term Business funding
Loans for Two Wheeler purchase
Loans for Office Furniture
Loans for Office Automation – PCs, Laptops, Printers
Loans for Plant & Machinery
Loans for office display panels
Loans for Air-Conditioners
Traditionally these end uses are underserved by the financial system as ticket sizes are small, credit evaluation is difficult, collections is difficult, and business is often unviable owing to huge operating and credit costs.
14
FINANCIAL
RESULTS
8SHAREHOLDING
PATTERN
7BOARD OF
DIRECTORS
6CREDIT RATING &
CAPITAL POSITION
5CREDIT
PROCESSES
4PRODUCT
OFFERING
3CHANGING ASSET
COMPOSITION
2OVERVIEW OF
THE COMPANY
1

15
Key Product Offerings
MS
ME L
oans
Tw
o W
he
ele
r L
oa
ns
Consu
mer
Dura
ble
Loans
Products Key FeaturesAverage Loan
Ticket Size
(Rs.)
Average
Loan Tenor
(Months)
Average Loan
to Value Ratio
(%)
Challenges
CFL provides long term loans to MSMEs after proper evaluation of cash flows.Backed by collateral of residential or commercial property.Monthly amortizing products with no moratorium.CFL also provides unsecured short tenure working capital loans to the MSMEs.
CFL provides financing to salaried segment as well as self employed individuals like small traders, shop keepers for purchase of new two-wheelers.
CFL provides financing to salaried and self-employed customers for purchasing of LCD/LED panels, Laptops, Air-conditioners and other such white good products. They are also availed by small entrepreneurs for official purposes.
9,600,000($ 150,000)
44,000($675)
30,000($460)
60*
24
8
42%
70%
76%
Evaluation of cash flows is a key challenge for credit appraisal of MSMEs
High collection cost as the collection efforts required are significant due to small ticket size and large number of customers running into millions. Operating expenditure is also very high.
High collection cost as the collection efforts required are significant due to small ticket size and large number of customers running into millions. Operating expenditure is also very high.
Note: All the loan product related figures are for the period FY15. * On actuarial basis
15
FINANCIAL
RESULTS
8SHAREHOLDING
PATTERN
7BOARD OF
DIRECTORS
6CREDIT RATING &
CAPITAL POSITION
5CREDIT
PROCESSES
4PRODUCT
OFFERING
3CHANGING ASSET
COMPOSITION
2OVERVIEW OF
THE COMPANY
1
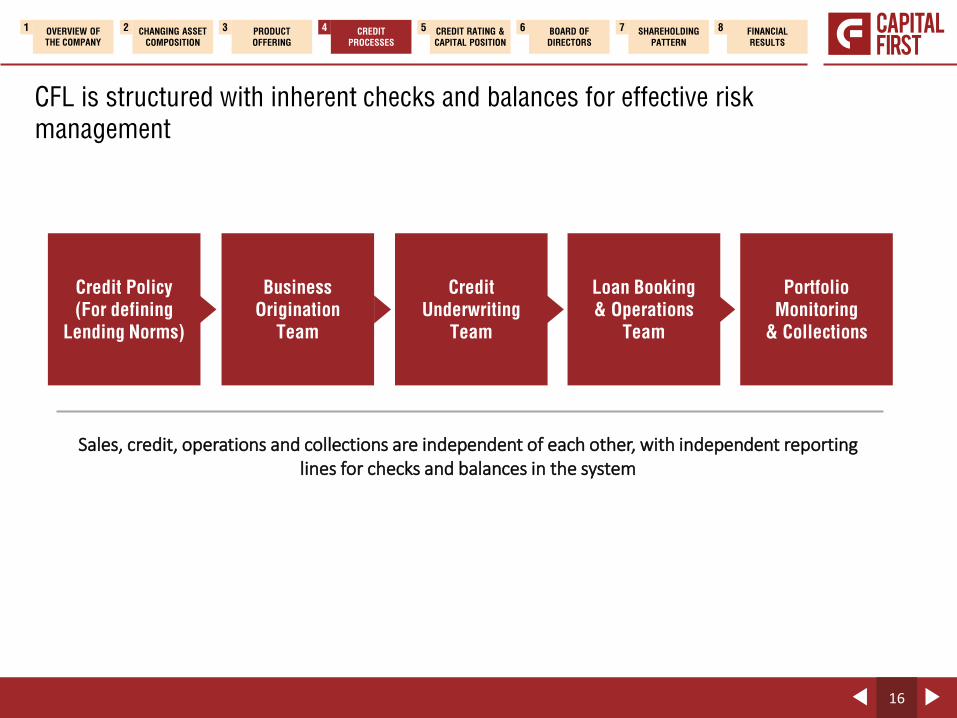
CFL is structured with inherent checks and balances for effective risk
management
Credit Policy
(For defining
Lending Norms)
Business
Origination
Team
Credit
Underwriting
Team
Loan Booking
& Operations
Team
Portfolio
Monitoring
& Collections
Sales, credit, operations and collections are independent of each other, with independent reporting lines for checks and balances in the system
16
FINANCIAL
RESULTS
8SHAREHOLDING
PATTERN
7BOARD OF
DIRECTORS
6CREDIT RATING &
CAPITAL POSITION
5CREDIT
PROCESSES
4PRODUCT
OFFERING
3CHANGING ASSET
COMPOSITION
2OVERVIEW OF
THE COMPANY
1
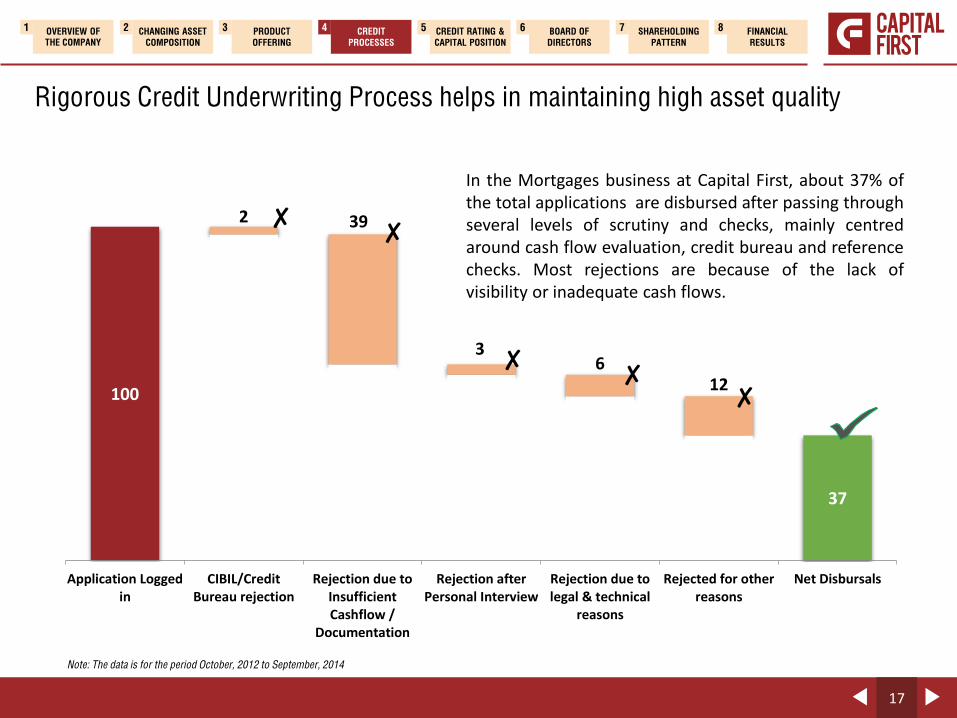
Rigorous Credit Underwriting Process helps in maintaining high asset quality
100 98
59 5649
37
2 39
36
12
37
Application Loggedin
CIBIL/CreditBureau rejection
Rejection due toInsufficientCashflow /
Documentation
Rejection afterPersonal Interview
Rejection due tolegal & technical
reasons
Rejected for otherreasons
Net Disbursals
In the Mortgages business at Capital First, about 37% ofthe total applications are disbursed after passing throughseveral levels of scrutiny and checks, mainly centredaround cash flow evaluation, credit bureau and referencechecks. Most rejections are because of the lack ofvisibility or inadequate cash flows.
✘✘
✘
✘✘
Note: The data is for the period October, 2012 to September, 2014
17
FINANCIAL
RESULTS
8SHAREHOLDING
PATTERN
7BOARD OF
DIRECTORS
6CREDIT RATING &
CAPITAL POSITION
5CREDIT
PROCESSES
4PRODUCT
OFFERING
3CHANGING ASSET
COMPOSITION
2OVERVIEW OF
THE COMPANY
1
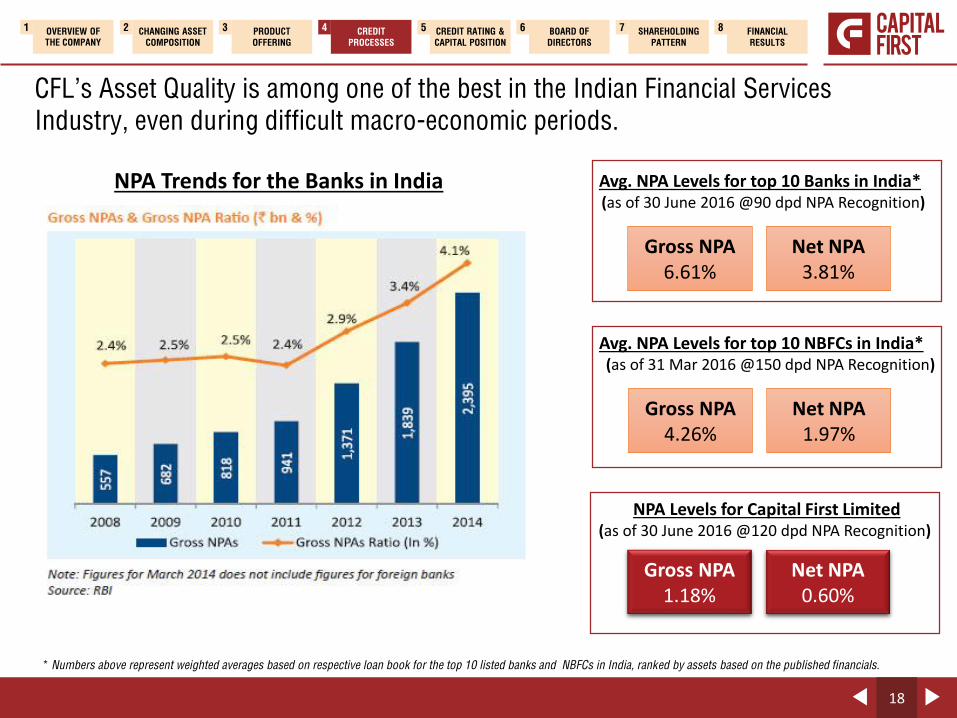
CFL’s Asset Quality is among one of the best in the Indian Financial Services
Industry, even during difficult macro-economic periods.
NPA Trends for the Banks in India Avg. NPA Levels for top 10 Banks in India*(as of 30 June 2016 @90 dpd NPA Recognition)
Gross NPA6.61%
Net NPA3.81%
Avg. NPA Levels for top 10 NBFCs in India*(as of 31 Mar 2016 @150 dpd NPA Recognition)
Gross NPA4.26%
Net NPA1.97%
NPA Levels for Capital First Limited(as of 30 June 2016 @120 dpd NPA Recognition)
Gross NPA1.18%
Net NPA0.60%
* Numbers above represent weighted averages based on respective loan book for the top 10 listed banks and NBFCs in India, ranked by assets based on the published financials.
18
FINANCIAL
RESULTS
8SHAREHOLDING
PATTERN
7BOARD OF
DIRECTORS
6CREDIT RATING &
CAPITAL POSITION
5CREDIT
PROCESSES
4PRODUCT
OFFERING
3CHANGING ASSET
COMPOSITION
2OVERVIEW OF
THE COMPANY
1
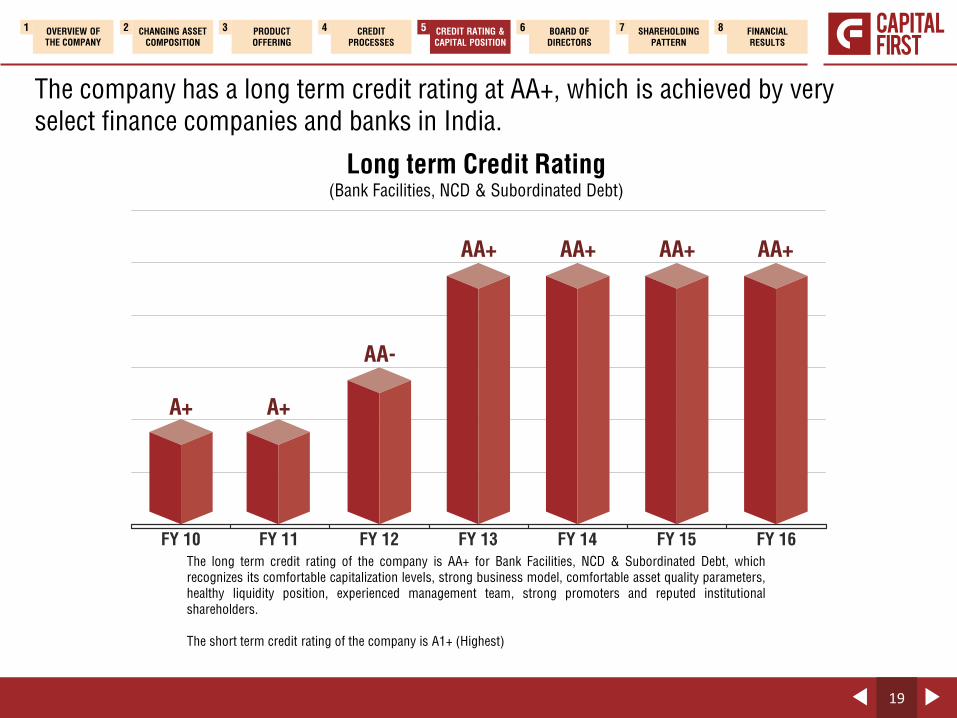
The company has a long term credit rating at AA+, which is achieved by very
select finance companies and banks in India.
Long term Credit Rating(Bank Facilities, NCD & Subordinated Debt)
The long term credit rating of the company is AA+ for Bank Facilities, NCD & Subordinated Debt, which
recognizes its comfortable capitalization levels, strong business model, comfortable asset quality parameters,
healthy liquidity position, experienced management team, strong promoters and reputed institutional
shareholders.
The short term credit rating of the company is A1+ (Highest)
FY 10 FY 11 FY 12 FY 13 FY 14 FY 15
A+ A+
AA-
AA+ AA+ AA+
FY 16
AA+
19
FINANCIAL
RESULTS
8SHAREHOLDING
PATTERN
7BOARD OF
DIRECTORS
6CREDIT RATING &
CAPITAL POSITION
5CREDIT
PROCESSES
4PRODUCT
OFFERING
3CHANGING ASSET
COMPOSITION
2OVERVIEW OF
THE COMPANY
1
20
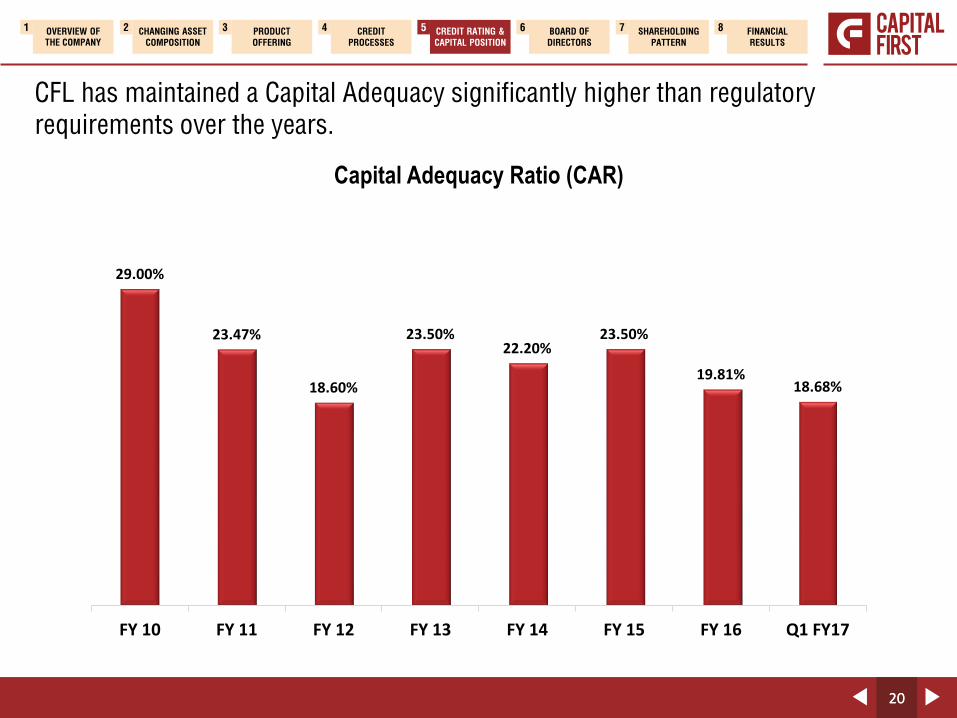
CFL has maintained a Capital Adequacy significantly higher than regulatory
requirements over the years.
Capital Adequacy Ratio (CAR)
20
FINANCIAL
RESULTS
8SHAREHOLDING
PATTERN
7BOARD OF
DIRECTORS
6CREDIT RATING &
CAPITAL POSITION
5CREDIT
PROCESSES
4PRODUCT
OFFERING
3CHANGING ASSET
COMPOSITION
2OVERVIEW OF
THE COMPANY
1
29.00%
23.47%
18.60%
23.50%22.20%
23.50%
19.81%18.68%
FY 10 FY 11 FY 12 FY 13 FY 14 FY 15 FY 16 Q1 FY17

Note: Capital includes Networth, Perpetual Debt and Sub-Debt
Total Capital of the Company has grown consistently and significantly over the years
to Rs. 28.18 Bn
Total Capital
21
FINANCIAL
RESULTS
8SHAREHOLDING
PATTERN
7BOARD OF
DIRECTORS
6CREDIT RATING &
CAPITAL POSITION
5CREDIT
PROCESSES
4PRODUCT
OFFERING
3CHANGING ASSET
COMPOSITION
2OVERVIEW OF
THE COMPANY
1
Rs. 6,909 Mn($103.12 Mn)
Rs. 7,471 Mn($111.51 Mn)
Rs. 10,316 Mn($153.97 Mn)
Rs. 15,107 Mn($225.48 Mn)
Rs. 17,869 Mn($266.70 Mn)
Rs. 22,388 Mn($334.15 Mn)
Rs. 27,385 Mn($408.73 Mn)
Rs. 28,183 Mn($420.64 Mn)
FY 10 FY 11 FY 12 FY 13 FY 14 FY 15 FY 16 Q1 FY17
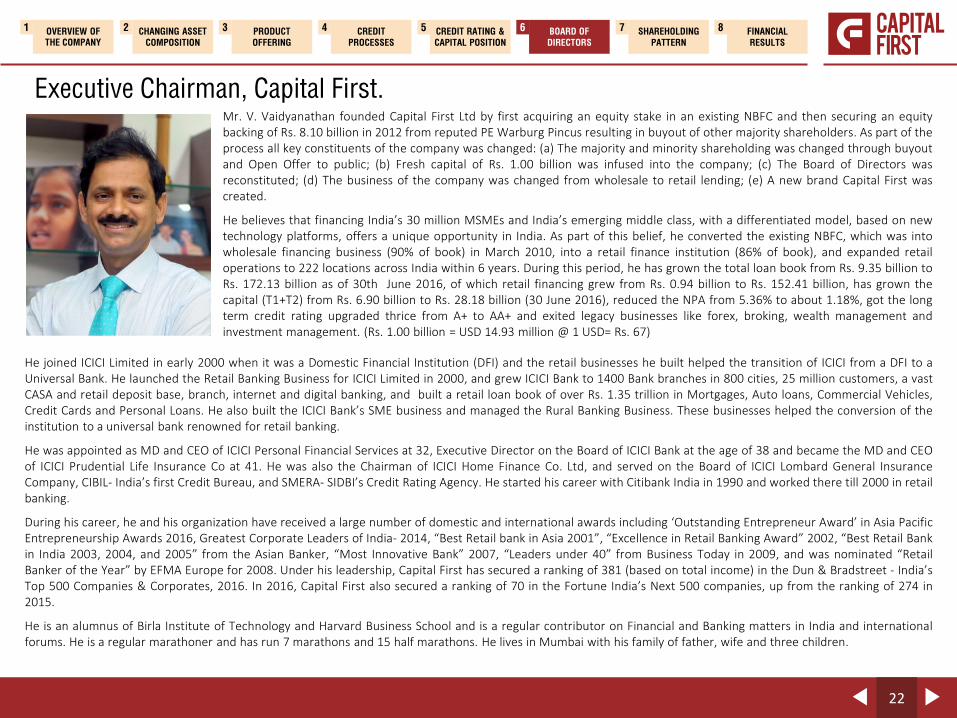
Executive Chairman, Capital First.Mr. V. Vaidyanathan founded Capital First Ltd by first acquiring an equity stake in an existing NBFC and then securing an equitybacking of Rs. 8.10 billion in 2012 from reputed PE Warburg Pincus resulting in buyout of other majority shareholders. As part of theprocess all key constituents of the company was changed: (a) The majority and minority shareholding was changed through buyoutand Open Offer to public; (b) Fresh capital of Rs. 1.00 billion was infused into the company; (c) The Board of Directors wasreconstituted; (d) The business of the company was changed from wholesale to retail lending; (e) A new brand Capital First wascreated.
He believes that financing India’s 30 million MSMEs and India’s emerging middle class, with a differentiated model, based on newtechnology platforms, offers a unique opportunity in India. As part of this belief, he converted the existing NBFC, which was intowholesale financing business (90% of book) in March 2010, into a retail finance institution (86% of book), and expanded retailoperations to 222 locations across India within 6 years. During this period, he has grown the total loan book from Rs. 9.35 billion toRs. 172.13 billion as of 30th June 2016, of which retail financing grew from Rs. 0.94 billion to Rs. 152.41 billion, has grown thecapital (T1+T2) from Rs. 6.90 billion to Rs. 28.18 billion (30 June 2016), reduced the NPA from 5.36% to about 1.18%, got the longterm credit rating upgraded thrice from A+ to AA+ and exited legacy businesses like forex, broking, wealth management andinvestment management. (Rs. 1.00 billion = USD 14.93 million @ 1 USD= Rs. 67)
He joined ICICI Limited in early 2000 when it was a Domestic Financial Institution (DFI) and the retail businesses he built helped the transition of ICICI from a DFI to aUniversal Bank. He launched the Retail Banking Business for ICICI Limited in 2000, and grew ICICI Bank to 1400 Bank branches in 800 cities, 25 million customers, a vastCASA and retail deposit base, branch, internet and digital banking, and built a retail loan book of over Rs. 1.35 trillion in Mortgages, Auto loans, Commercial Vehicles,Credit Cards and Personal Loans. He also built the ICICI Bank’s SME business and managed the Rural Banking Business. These businesses helped the conversion of theinstitution to a universal bank renowned for retail banking.
He was appointed as MD and CEO of ICICI Personal Financial Services at 32, Executive Director on the Board of ICICI Bank at the age of 38 and became the MD and CEOof ICICI Prudential Life Insurance Co at 41. He was also the Chairman of ICICI Home Finance Co. Ltd, and served on the Board of ICICI Lombard General InsuranceCompany, CIBIL- India’s first Credit Bureau, and SMERA- SIDBI’s Credit Rating Agency. He started his career with Citibank India in 1990 and worked there till 2000 in retailbanking.
During his career, he and his organization have received a large number of domestic and international awards including ‘Outstanding Entrepreneur Award’ in Asia PacificEntrepreneurship Awards 2016, Greatest Corporate Leaders of India- 2014, “Best Retail bank in Asia 2001”, “Excellence in Retail Banking Award” 2002, “Best Retail Bankin India 2003, 2004, and 2005” from the Asian Banker, “Most Innovative Bank” 2007, “Leaders under 40” from Business Today in 2009, and was nominated “RetailBanker of the Year” by EFMA Europe for 2008. Under his leadership, Capital First has secured a ranking of 381 (based on total income) in the Dun & Bradstreet - India’sTop 500 Companies & Corporates, 2016. In 2016, Capital First also secured a ranking of 70 in the Fortune India’s Next 500 companies, up from the ranking of 274 in2015.
He is an alumnus of Birla Institute of Technology and Harvard Business School and is a regular contributor on Financial and Banking matters in India and internationalforums. He is a regular marathoner and has run 7 marathons and 15 half marathons. He lives in Mumbai with his family of father, wife and three children.
22
FINANCIAL
RESULTS
8SHAREHOLDING
PATTERN
7BOARD OF
DIRECTORS
6CREDIT RATING &
CAPITAL POSITION
5CREDIT
PROCESSES
4PRODUCT
OFFERING
3CHANGING ASSET
COMPOSITION
2OVERVIEW OF
THE COMPANY
1
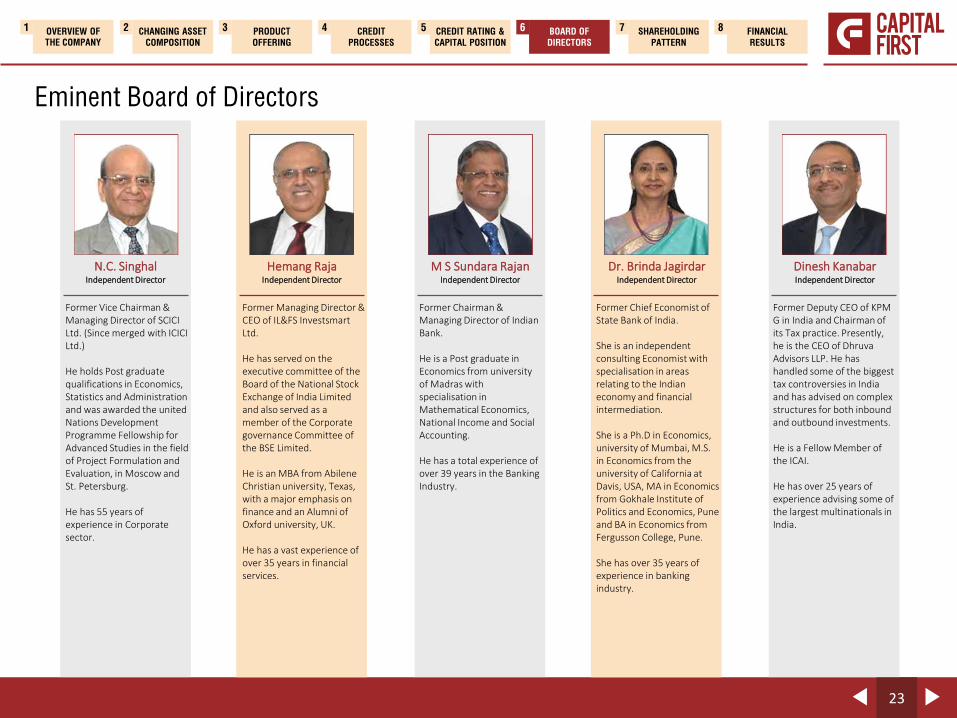
Eminent Board of Directors
N.C. SinghalIndependent Director
Former Vice Chairman & Managing Director of SCICI Ltd. (Since merged with ICICI Ltd.)
He holds Post graduate qualifications in Economics, Statistics and Administration and was awarded the united Nations Development Programme Fellowship for Advanced Studies in the field of Project Formulation and Evaluation, in Moscow and St. Petersburg.
He has 55 years of experience in Corporate sector.
Hemang RajaIndependent Director
Former Managing Director & CEO of IL&FS InvestsmartLtd.
He has served on the executive committee of the Board of the National Stock Exchange of India Limited and also served as a member of the Corporate governance Committee of the BSE Limited.
He is an MBA from Abilene Christian university, Texas, with a major emphasis on finance and an Alumni of Oxford university, UK.
He has a vast experience of over 35 years in financial services.
M S Sundara RajanIndependent Director
Former Chairman & Managing Director of Indian Bank.
He is a Post graduate in Economics from university of Madras with specialisation in Mathematical Economics, National Income and Social Accounting.
He has a total experience of over 39 years in the Banking Industry.
Dr. Brinda JagirdarIndependent Director
Former Chief Economist of State Bank of India.
She is an independent consulting Economist with specialisation in areas relating to the Indian economy and financial intermediation.
She is a Ph.D in Economics, university of Mumbai, M.S. in Economics from the university of California at Davis, USA, MA in Economics from Gokhale Institute of Politics and Economics, Pune and BA in Economics from Fergusson College, Pune.
She has over 35 years of experience in banking industry.
Dinesh KanabarIndependent Director
Former Deputy CEO of KPM G in India and Chairman of its Tax practice. Presently, he is the CEO of DhruvaAdvisors LLP. He has handled some of the biggest tax controversies in India and has advised on complex structures for both inbound and outbound investments.
He is a Fellow Member of the ICAI.
He has over 25 years of experience advising some of the largest multinationals in India.
23
FINANCIAL
RESULTS
8SHAREHOLDING
PATTERN
7BOARD OF
DIRECTORS
6CREDIT RATING &
CAPITAL POSITION
5CREDIT
PROCESSES
4PRODUCT
OFFERING
3CHANGING ASSET
COMPOSITION
2OVERVIEW OF
THE COMPANY
1

Eminent Board of Directors
Narendra OstawalNon-Executive Director
He is the Managing Director of Warburg Pincus India Private Limited.
Earlier, he has worked with 3i India Private Limited (part of 3i group PLC, UK) and McKinsey & Company.
He holds a Chartered Accountancy degree from ICAI and an MBA from IIM, Bangalore.
He has 13 years of experience in consulting and private equity segment.
Vishal MahadeviaNon-Executive Director
He is the Managing Director & Co-Head, Warburg PincusIndia Private Ltd.
Previously, he has worked with Greenbriar Equity group, Three Cities Research, Inc., and McKinsey & Company.
He is a B.S. in Economics with a concentration in finance and a B.S. in Electrical Engineering from the university of Pennsylvania.
He has 21 years of experience in Corporate sector across the globe
Apul NayyarExecutive Director
He is the Executive Director responsible for Retail and SME businesses at Capital First Limited.
Previously, he has worked in leadership positions across companies like India Infoline(IIFL), Merrill Lynch and Citigroup.
Apul is a qualified Chartered Accountant. He has successfully concluded Global Program for Management Development (GPMD) from Ross School of Business, Michigan, USA.
He has more than 18 years of experience in the Financial Services Industry.
Nihal Desai Executive Director
He is the Executive Director responsible for Risk, IT and Operations at Capital First Limited.
He has also worked with Serco India as Managing Director and developed new markets for its core and new BPO business.
With an Engineering degree in Computer Science and Post Graduate degree in management, he has been part of numerous management trainings from institutes like Wharton and IIM-Ahmedabad.
He has more than 20 years of work experience in the Financial Services domain.
24
FINANCIAL
RESULTS
8SHAREHOLDING
PATTERN
7BOARD OF
DIRECTORS
6CREDIT RATING &
CAPITAL POSITION
5CREDIT
PROCESSES
4PRODUCT
OFFERING
3CHANGING ASSET
COMPOSITION
2OVERVIEW OF
THE COMPANY
1

Reputed marquee FIIs and DIIs have invested in CFL
8.25%6.44%
8.10%
11.94%
65.27%
FII & FPI
Bodies
Corporate
Individuals
Others
Warburg Pincus-
Affiliated
Companies
Warburg Pincus, through its affiliate entities
Birla Asset Management
HDFC Standard Life Insurance Company
Swiss Finance Corporation Mauritius
Goldman Sachs Asset Management
Government Pension Fund Global
Kuwait Investment Authority
Jupiter Asset Management
Canara Robecco Mutual Fund
Ashburton Limited
Key Shareholders
Ashmore SICAV
25
FINANCIAL
RESULTS
8SHAREHOLDING
PATTERN
7BOARD OF
DIRECTORS
6CREDIT RATING &
CAPITAL POSITION
5CREDIT
PROCESSES
4PRODUCT
OFFERING
3CHANGING ASSET
COMPOSITION
2OVERVIEW OF
THE COMPANY
1
Warburg Pincus Affiliated
Companies, 65.11%
FII & FPI, 7.62%
Financial Institution/Bank/MF
/Insurance, 7.49%
Bodies Corporate,
7.22%
Individuals & Others, 12.57%
Total # of shares as of 30 June 2016: 9,12,37,744Book Value per Share: Rs. 189 ($2.82)
V. Vaidyanathan & Related Entities
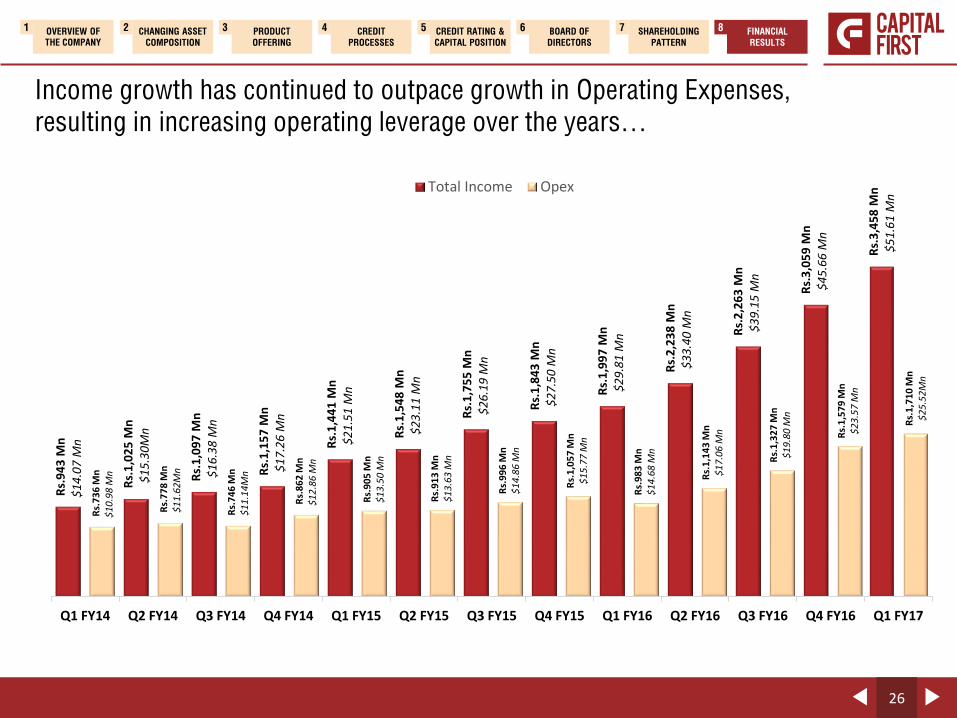
Income growth has continued to outpace growth in Operating Expenses,
resulting in increasing operating leverage over the years…
26
FINANCIAL
RESULTS
8SHAREHOLDING
PATTERN
7BOARD OF
DIRECTORS
6CREDIT RATING &
CAPITAL POSITION
5CREDIT
PROCESSES
4PRODUCT
OFFERING
3CHANGING ASSET
COMPOSITION
2OVERVIEW OF
THE COMPANY
1
Rs.
94
3 M
n$
14
.07
Mn
Rs.
1,0
25
Mn
$1
5.3
0M
n
Rs.
1,0
97
Mn
$1
6.3
8 M
n
Rs.
1,1
57
Mn
$1
7.2
6 M
n
Rs.
1,4
41
Mn
$2
1.5
1 M
n
Rs.
1,5
48
Mn
$2
3.1
1 M
n
Rs.
1,7
55
Mn
$2
6.1
9 M
n
Rs.
1,8
43
Mn
$2
7.5
0 M
n
Rs.
1,9
97
Mn
$2
9.8
1 M
n
Rs.
2,2
38
Mn
$3
3.4
0 M
n
Rs.
2,2
63
Mn
$3
9.1
5 M
n
Rs.
3,0
59
Mn
$4
5.6
6 M
n
Rs.
3,4
58
Mn
$5
1.6
1 M
n
Rs.
73
6 M
n$
10
.98
Mn
Rs.
77
8 M
n$
11
.62
Mn
Rs.
74
6 M
n$
11
.14
Mn
Rs.
86
2 M
n$
12
.86
Mn
Rs.
90
5 M
n$
13
.50
Mn
Rs.
91
3 M
n$
13
.63
Mn
Rs.
99
6 M
n$
14
.86
Mn
Rs.
1,0
57
Mn
$1
5.7
7 M
n
Rs.
98
3 M
n$
14
.68
Mn
Rs.
1,1
43
Mn
$1
7.0
6 M
n
Rs.
1,3
27
Mn
$1
9.8
0 M
n
Rs.
1,5
79
Mn
$2
3.5
7 M
n
Rs.
1,7
10
Mn
$2
5.5
2M
n
Q1 FY14 Q2 FY14 Q3 FY14 Q4 FY14 Q1 FY15 Q2 FY15 Q3 FY15 Q4 FY15 Q1 FY16 Q2 FY16 Q3 FY16 Q4 FY16 Q1 FY17
Total Income Opex
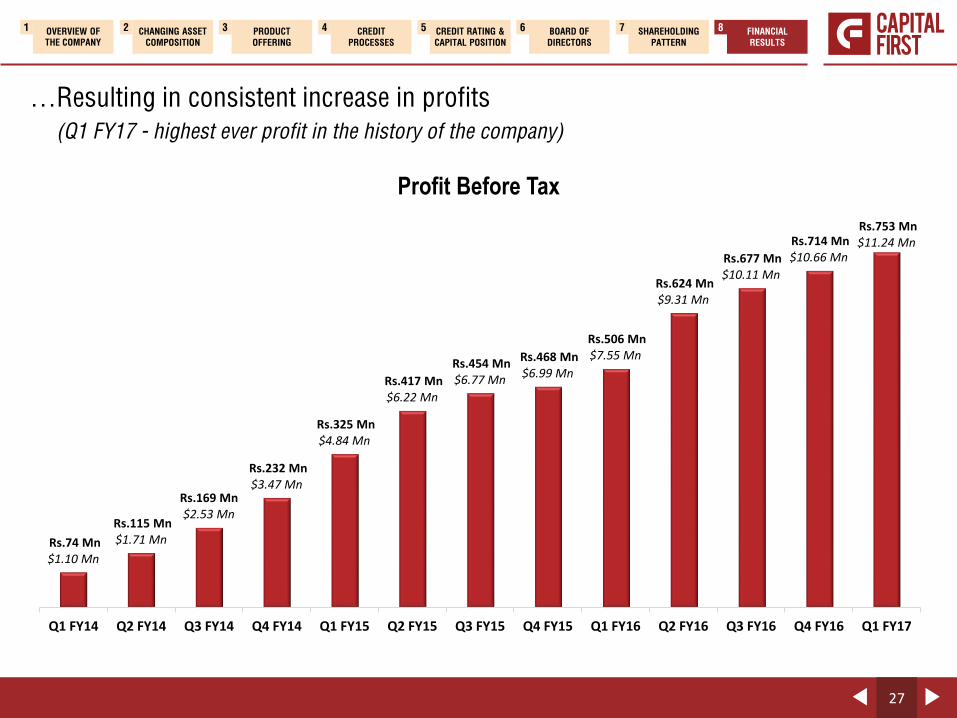
…Resulting in consistent increase in profits
(Q1 FY17 - highest ever profit in the history of the company)
27
FINANCIAL
RESULTS
8SHAREHOLDING
PATTERN
7BOARD OF
DIRECTORS
6CREDIT RATING &
CAPITAL POSITION
5CREDIT
PROCESSES
4PRODUCT
OFFERING
3CHANGING ASSET
COMPOSITION
2OVERVIEW OF
THE COMPANY
1
Rs.74 Mn$1.10 Mn
Rs.115 Mn$1.71 Mn
Rs.169 Mn$2.53 Mn
Rs.232 Mn$3.47 Mn
Rs.325 Mn$4.84 Mn
Rs.417 Mn$6.22 Mn
Rs.454 Mn$6.77 Mn
Rs.468 Mn$6.99 Mn
Rs.506 Mn$7.55 Mn
Rs.624 Mn$9.31 Mn
Rs.677 Mn$10.11 Mn
Rs.714 Mn$10.66 Mn
Rs.753 Mn$11.24 Mn
Q1 FY14 Q2 FY14 Q3 FY14 Q4 FY14 Q1 FY15 Q2 FY15 Q3 FY15 Q4 FY15 Q1 FY16 Q2 FY16 Q3 FY16 Q4 FY16 Q1 FY17
Profit Before Tax

Consolidated Profit & Loss Corresponding quarter (Q1-FY17 vs. Q1-FY16)
Particulars Q1-FY17 Q1-FY16 % Change
Interest Income 5,539 3,590 54%
Less: Interest Expense 2,760 1,987 39%
Net Interest Income (NII) 2,779 1,603 73%
Fee & Other Income 679$ 394 72%
Total Income 3,458 1,997 73%
Opex 1,710 983 74%
Provision 995* 508 96%
PBT 753 506 49%
Tax 261 175 49%
PAT 492 331 49%
28
FINANCIAL
RESULTS
8SHAREHOLDING
PATTERN
7BOARD OF
DIRECTORS
6CREDIT RATING &
CAPITAL POSITION
5CREDIT
PROCESSES
4PRODUCT
OFFERING
3CHANGING ASSET
COMPOSITION
2OVERVIEW OF
THE COMPANY
1
All figures are in Rs. Mn unless specified
*The Company has changed its estimates related to provisioning for retail mortgage and housing loans. Consequent to the change in such estimates, provisions for the quarter ended June 30, 2016 is higher by
Rs. 117.02 Mn. As per RBI requirement Standard Asset provisioning has been increased by 5bps to 35bps during Q1 FY17 which resulted in one time additional provisioning of Rs. 66.4 Mn.
$ Includes one time Interest on Income tax refund of Rs. 52.9 Mn.
#Includes one-time tax credit of Rs. 173.2 million in Q4-FY14 and Rs. 48.9 million in Q4-FY 15 on completion of Income Tax Assessment. Excluding these one timecredits, the PAT in Q4-FY14 and Q4-FY15 would have been Rs. 153.1 million and Rs. 308.9 million respectively.
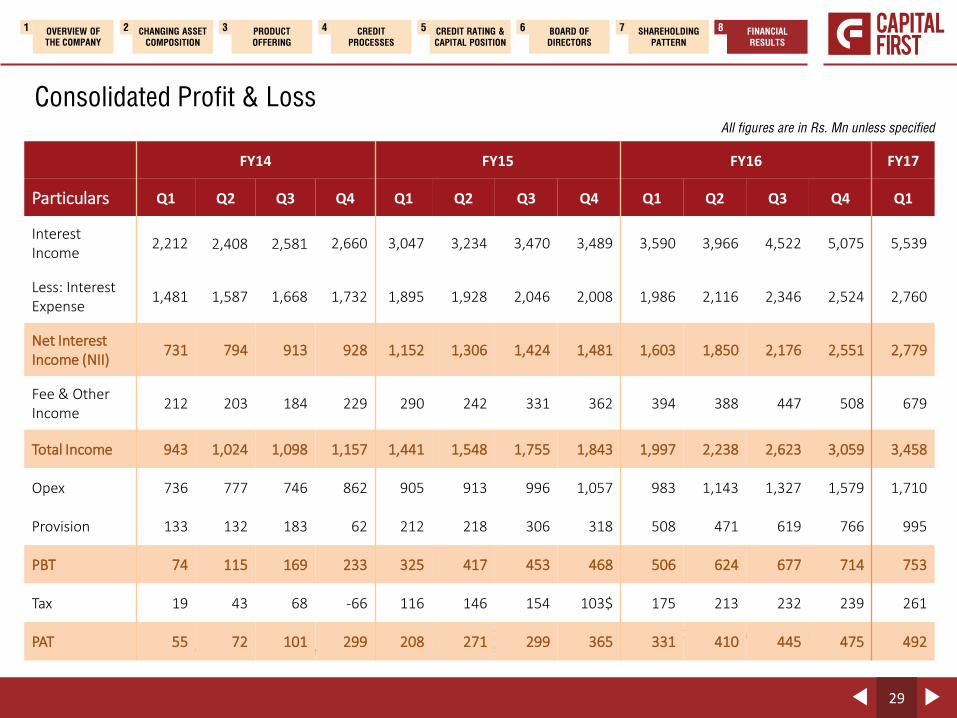
Consolidated Profit & Loss
FY14 FY15 FY16 FY17
Particulars Q1 Q2 Q3 Q4 Q1 Q2 Q3 Q4 Q1 Q2 Q3 Q4 Q1
Interest Income
2,212 2,408 2,581 2,660 3,047 3,234 3,470 3,489 3,590 3,966 4,522 5,075 5,539
Less: Interest Expense
1,481 1,587 1,668 1,732 1,895 1,928 2,046 2,008 1,986 2,116 2,346 2,524 2,760
Net Interest Income (NII)
731 794 913 928 1,152 1,306 1,424 1,481 1,603 1,850 2,176 2,551 2,779
Fee & Other Income
212 203 184 229 290 242 331 362 394 388 447 508 679
Total Income 943 1,024 1,098 1,157 1,441 1,548 1,755 1,843 1,997 2,238 2,623 3,059 3,458
Opex 736 777 746 862 905 913 996 1,057 983 1,143 1,327 1,579 1,710
Provision 133 132 183 62 212 218 306 318 508 471 619 766 995
PBT 74 115 169 233 325 417 453 468 506 624 677 714 753
Tax 19 43 68 -66 116 146 154 103$ 175 213 232 239 261
PAT 55 72 101 299 208 271 299 365 331 410 445 475 492
29
FINANCIAL
RESULTS
8SHAREHOLDING
PATTERN
7BOARD OF
DIRECTORS
6CREDIT RATING &
CAPITAL POSITION
5CREDIT
PROCESSES
4PRODUCT
OFFERING
3CHANGING ASSET
COMPOSITION
2OVERVIEW OF
THE COMPANY
1
All figures are in Rs. Mn unless specified

Consolidated Balance Sheet All figures are in Rs. Mn unless specified
Particulars As on
June 30, 2016As on
Mar 31, 2016
SOURCES OF FUNDS
Net worth 17,533 17,035
Loan funds 1,29,607 1,19,549
Total 1,47,140 1,36,584
APPLICATION OF FUNDS
Fixed Assets 304 292
Deferred Tax Asset (net) 637 546
Investments 402 416
Current Assets, Loans & Advances
Loan Book 1,36,653 126,666
Other current assets and advances 19,884 17,330
Less: Current liabilities and provisions (10,738) (8,666)
Net current assets 1,45,797 135,329
Total 1,47,140 136,584
30
FINANCIAL
RESULTS
8SHAREHOLDING
PATTERN
7BOARD OF
DIRECTORS
6CREDIT RATING &
CAPITAL POSITION
5CREDIT
PROCESSES
4PRODUCT
OFFERING
3CHANGING ASSET
COMPOSITION
2OVERVIEW OF
THE COMPANY
1
Thank You
INVESTOR CONTACTSAPTARSHI BAPARI
M : +91 22 4042 3534
P : +91 99200 39149
Capital First Limited
India Bulls Finance Centre,
Tower II, 15th Floor,
Senapati Bapat Marg,
Elphinstone (West),
Mumbai 400 013.
Kindly provide feedback about the presentation at [email protected]
www.capitalfirst.com