PowerPoint Presentation - Council of State Governmentsknowledgecenter.csg.org/kc/system/files/LegFed...
50
-
Upload
duonghuong -
Category
Documents
-
view
215 -
download
0
Transcript of PowerPoint Presentation - Council of State Governmentsknowledgecenter.csg.org/kc/system/files/LegFed...


Fiscal Austerity and the Federal System
Paul L. Posner
George Mason University

Outline: Autonomy and Interdependence in American federalism
Basic architecture: “fend-for-yourself-federalism” Substantial State and local fiscal autonomy Budget, tax and debt constraints mainly at the
state and local levels
Increased fiscal interdependence over time More federal transfers and mandates
Erosion of cooperative institutions Paradox of more interdependence and less
intergovernmental cooperation

THE RISE OF FISCAL INTERDEPENDENCE
Growth of Federal Intergovernmental Aid
953 separate federal grants in 2009
Totaled $607 billion in FY 2014
23.2% of State/Local expenditures in 2013
16.6% of total Federal expenditures in 2013
Growth of “federally induced costs” for state and local governments: mandates and preemptions


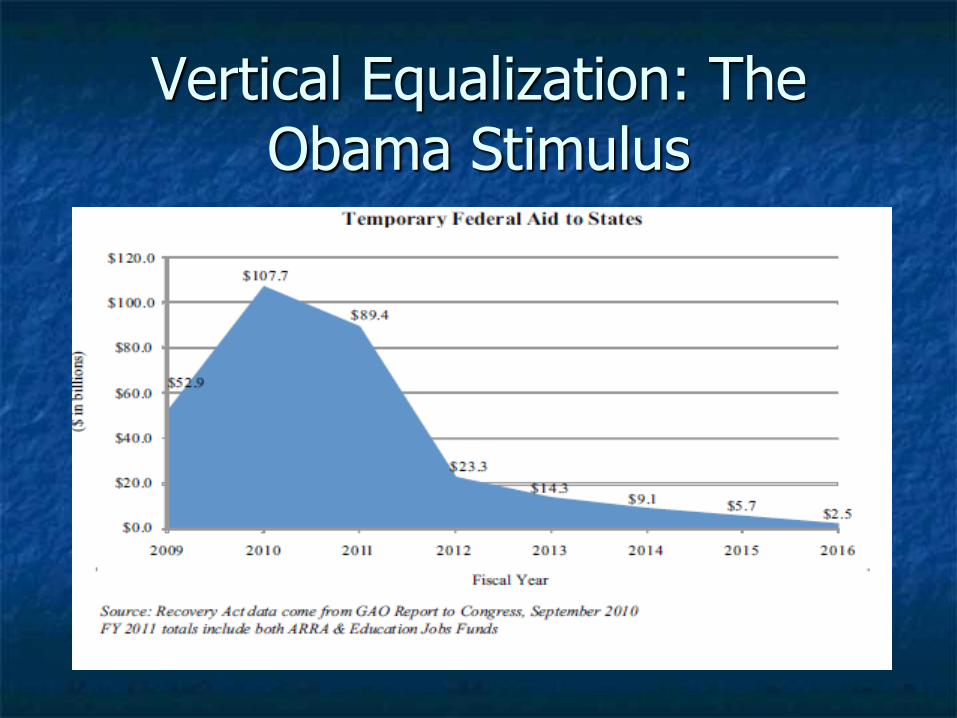
Vertical Equalization: The Obama Stimulus
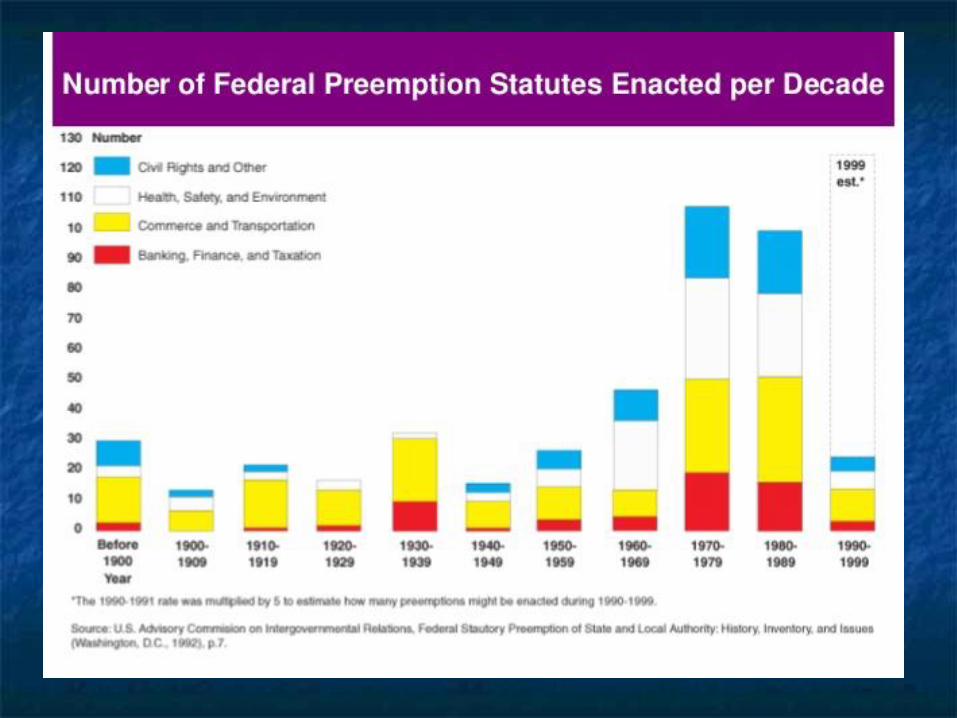

Rise of Federal Mandates
T
G
N
C AC R TR A

Current U.S. federal fiscal system is unsustainable
Major shifts in social and economic forces generating revenue and spending pressures
Globalization
Advancing technologies
Knowledge based economy
Aging of population
Rise in health care costs

BABY BUST, BABY BOOM, BABY BUST
Fertility Rate (Births per woman)
Note: Projections based on intermediate assumptions of the 2002 Trustees’ reports.
Source: The 2002 Annual Report of the Board of Trustees of the Federal Old-Age and Survivors Insurance and Disability
Insurance Trust Funds.

LABOR FORCE GROWTH Percent change (5-year moving average)
Note: Projections based on intermediate assumptions of the 2002 Trustees’ reports.
Source: The 2002 Annual Report of the Board of Trustees of the Federal Old-Age and Survivors Insurance and Disability
Insurance Trust Funds.

Medicare Beneficiaries

GAO Long Term Budget Outlook

Future Federal Aid at Risk: Long term Budget Trends

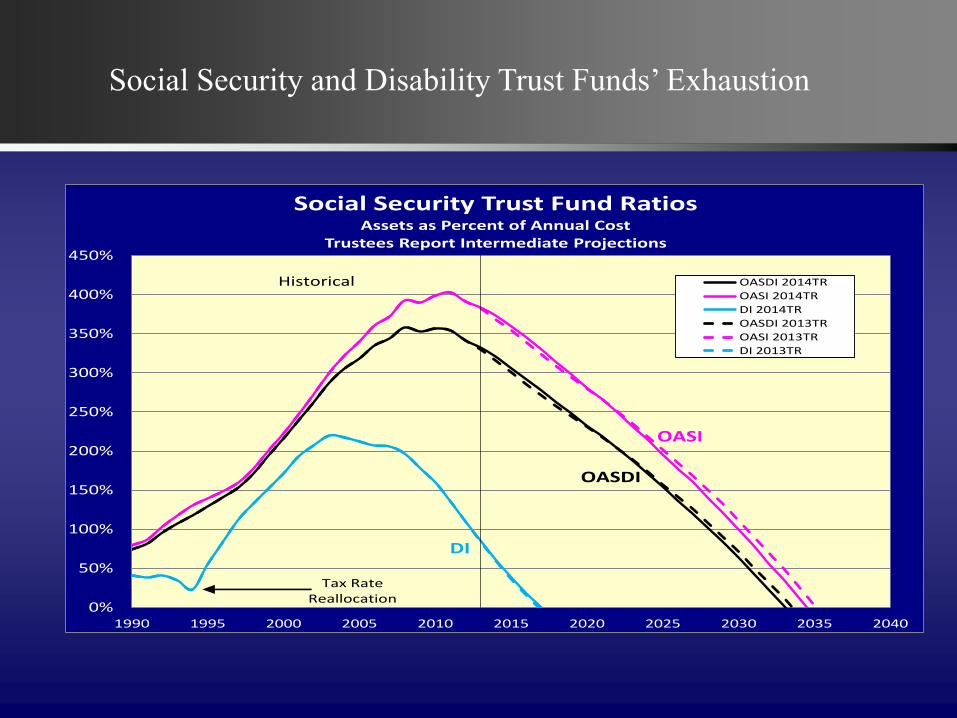
Exhaustion of social security and medicare trust funds
24

Future Federal Aid at Risk: Federal Budget “Sequester”

State and Local Fiscal Gap

Composition of State and Local Spending

State sales tax bases have been eroding
28

State and Local Funded Ratios with Liabilities Discounted by Riskless Rate
Alicia Munnell, Jeanne-Pierre Aubrey and Mark Caferelli, The Funding of State and Local Pensions, 2013-2017 (Boston, Ma: Center for Retirement Research, Boston College June 2014
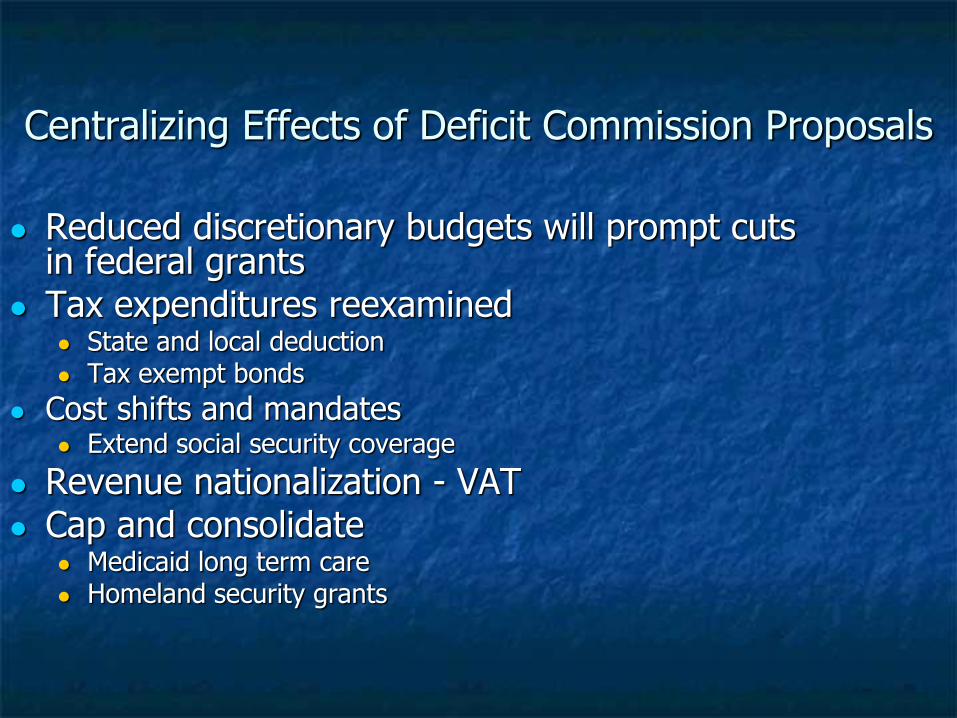
Centralizing Effects of Deficit Commission Proposals
Reduced discretionary budgets will prompt cuts in federal grants
Tax expenditures reexamined State and local deduction Tax exempt bonds
Cost shifts and mandates Extend social security coverage
Revenue nationalization - VAT Cap and consolidate
Medicaid long term care Homeland security grants


Federalism in an Age of Austerity
Go it alone federalism Partial and ineffective solutions Public confusion
Cost shifting Unfunded mandates Fiscal substitution
Fiscal coordination Win-win strategies VAT Sorting out responsibilities
The Case for Fiscal Collaboration
Health care costs and coverage
Economic growth in an aging society
National infrastructure investments
Revenue productivity
33

A Federalism reform agenda?
Tax policy Tax expenditure reform Consumption taxation Tax base sharing
Grants Sorting out Consolidation/performance grants Targeting
Regulatory Unfunded mandates act Performance outcomes Variable speed federalism
Institutions National/federal for engagement Fiscal impacts State capacity for engagement

Future Prospects for Reform: Intergovernmental Institutions:
1980
ACIR
OMB
GAO
Congressional IGR subcommittees
Academy for State and Local Government
2013 CBO cost estimation
GAO
G. William Hoagland
Sr. Vice President
Bipartisan Policy Center
August 4, 2015
Federalism in Uncertain Economic Times
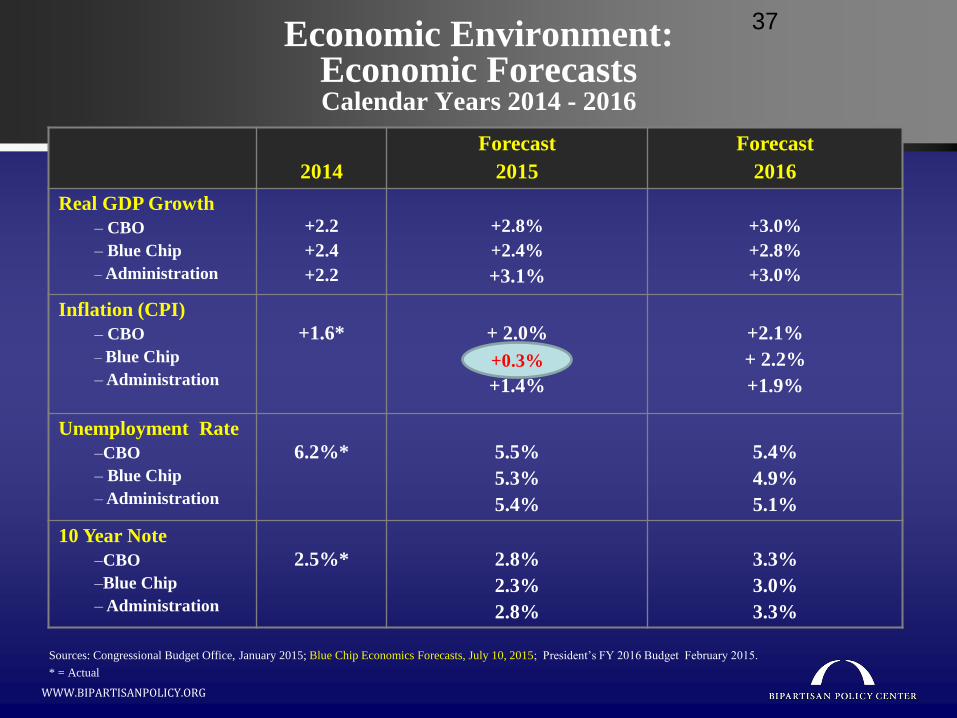
Economic Environment: Economic Forecasts Calendar Years 2014 - 2016
2014
Forecast
2015
Forecast
2016
Real GDP Growth
– CBO
– Blue Chip
– Administration
+2.2
+2.4
+2.2
+2.8%
+2.4%
+3.1%
+3.0%
+2.8%
+3.0%
Inflation (CPI)
– CBO
– Blue Chip
– Administration
+1.6*
+ 2.0%
+ 1.7%
+1.4%
+2.1%
+ 2.2%
+1.9%
Unemployment Rate
–CBO
– Blue Chip
– Administration
6.2%*
5.5%
5.3%
5.4%
5.4%
4.9%
5.1%
10 Year Note
–CBO
–Blue Chip
– Administration
2.5%*
2.8%
2.3%
2.8%
3.3%
3.0%
3.3%
Sources: Congressional Budget Office, January 2015; Blue Chip Economics Forecasts, July 10, 2015; President’s FY 2016 Budget February 2015.
* = Actual
WWW.BIPARTISANPOLICY.ORG
+0.3%
37

Recession as announced by National Bureau of Economic Research
Surplus
Deficit
Trend
Actual
Source: An Update of The Budget and Economic Outlook: Fiscal Years 2014 to 2025, and Analysis of the President’s 2016 Budget.
Congressional Budget Office; January 2015, March 2015. CBO March 2015 Baseline. Concurrent Resolution on the Budget for
Fiscal Year 2016, S.Con.Res. 11, April 29, 2015.
-2000
-1800
-1600
-1400
-1200
-1000
-800
-600
-400
-200
0
200
400
71 73 75 77 79 81 83 85 87 89 91 93 95 97 99 01 03 05 07 09 11 13 15 17 19 21 23 25
Do
lla
rs i
n B
illi
on
s
Year
Total Budget Surplus/Deficit
S.Con.Res.11
Total Budget Surplus/Deficit FY 1971-2025
Projections
WWW.BIPARTISANPOLICY.ORG
FY 2016 Budget Resolution

Budget Outlook FY 2012 – 2025
(In Billions of Dollars – % of GDP)
2012
Actual
2013
Actual
2014
Actual
2015
Proj 2016 2017 2018 …2025
% ∆ annual
2014-2025
Receipts 2,450 2,774 3,021 3,191 3,470 3,601 3,728 5,030 + 4.7%
Spending 3,537 3,455 3,506 3,677 3,925 4,056 4,217 6,069 + 5.3%
Deficits
% of GDP
1,087
6.8%
680
4.1%
485
2.8%
486
2.7%
455
2.4%
455
2.3%
489
2.4%
1,038
3.8%
+8.8%
NA
Public Debt
% GDP
Debt Subject Limit
% GDP
11,281
73%
16,027
100%
11,983
72%
16,699
101%
12,780
74%
17,781
103%
13,366
74%
18,473
103%
13,897
74%
19,144
102%
14,428
73%
19,794
100%
14,983
73%
20,502
100%
21,182
77%
26,926
98%
+ 4.4%
+4.0%
Source: Congressional Budget Office, The Budget and Economic Outlook 2015-2025. Updated Projections. March 2015.
CBO estimate of nominal GDP growth increase 4.3% annually 2015-2025.
WWW.BIPARTISANPOLICY.ORG

Source: CBO The 2014 Long-Term Budget Outlook, July 2014; The Budget & Economic Outlook: 2015 to 2025, January 2015.
The Accumulation of Public Debt Debt Held by the Public -- Exceeds 100% of Economy 2038
WWW.BIPARTISANPOLICY.ORG

Federal Spending Projected for 2025
“Other Health Programs” includes: Health insurance subsidies, exchanges, and related spending; Department of Defense Medicare-
Eligible Retiree Health Care Fund (including TRICARE for Life); Children’s Health Insurance Program, and other programs.
Medicare (16%)
Defense (12%)
Medicaid (10%)
Social Security (26%)
Other Mandatory Spending
(10%)
Domestic Discretionary
(11%)
Agriculture (0.3%)
Net Interest (14%)
Other Health Programs (2%)
Source: The Congressional Budget Office. The Budget and Economic Outlook: Fiscal Years 2014 to 2025, January 2015.
WWW.BIPARTISANPOLICY.ORG

10.810.0
17.7
19.8
7.3
4.7
-0.8
-3.8 -3.8
1.3
19.7
6.0
3.3
9.4
13.5
4.1
2.1
-2.4
-6.0 -6.2
-1.1
17.3
-8
-4
0
4
8
12
16
20
1965-70 1970-75 1975-80 1980-85 1985-90 1990-95 1995-00 2000-05 2005-10 2010-15 2015-20
Source: “The Budget and Economic Outlook Fiscal Years 2013 to 2023: Congressional Budget Office, February 2013” plus historical data.
Nominal Growth Real Growth in 2005 $ % Growth
Growth in Net Interest Average Annual Growth, 5-year periods (1965 – 2020)

Projected Growth in Major Budget Categories
WWW.BIPARTISANPOLICY.ORG
2012-2025 (% GDP)
44
0%
50%
100%
150%
200%
250%
300%
350%
400%
450%
1990 1995 2000 2005 2010 2015 2020 2025 2030 2035 2040
Social Security Trust Fund RatiosAssets as Percent of Annual Cost
Trustees Report Intermediate Projections
OASDI 2014TR
OASI 2014TR
DI 2014TR
OASDI 2013TR
OASI 2013TR
DI 2013TR
Historical
Tax RateReallocation
DI
OASDI
OASI
Social Security and Disability Trust Funds’ Exhaustion

Limits on Discretionary Budget Authority FY 2015 to 2021
(Billions of dollars)
Category 2015
est.
2016 2017 2018 2019 2020 2021 Annual Rate of
Increase
2015-2021
Defense Cap S.Con.Res. 11
POTUS
521
521
521
523
523
561
536
536
573
549
549
584
562
562
592
576
576
598
590
590
610
2.1%
2.1%
2.6%
Global War on
Terrorism -- OCO S.Con.Res.11
POTUS
64
64
94
58
65
27
63
27
58
27
50
27
48
27
-4.6%
-13.4%
Total Defense S.Con.Res. 11
POTUS
585
585
617
619
601
600
612
611
620
619
626
625
638
637
1.5%
1.5%
Nondefense Cap
S.Con.Res. 11
POTUS
534
534
534
493
493
530
504
477
541
516
478
551
530
487
560
543
495
565
555
503
575
0.6%
-1.0%
1.2%
Total
w/OCO
Cap
S.Con.Res.11
POTUS
1,119
1,119
1,119
1,016
1,016
1,091
1,040
1,013
1,114
1,065
1,027
1,135
1,092
1,049
1,152
1,119
1,071
1,163
1,146
1,093
1,185
0.4%
-0.4%
1.0%
Source: Fiscal Sequestration Report for FY 2014; Congressional Budget Office, January 2015.
WWW.BIPARTISANPOLICY.ORG

FY 2016
S.Con.Res. 11
President’s
Budget
Unified Deficit Estimate $6,721* $6,781**
Policy Changes:
Discretionary
Mandatory
Interest
Revenues
- 326
-4,190
- 773
0
-38a
+ 769a
- 153
+1,780
Total Policy Changes -5,289 -1,202
Resulting Unified Deficit $1,432 $5,579
Debt Held by Public to GDP 2025 55.6% 73.1%
Economic Growth Benefit $124 NA
Sources: * S.Con.Res. 11. Concurrent Resolution on the Budget for FY 2016, April 30; ** CBO Analysis of
President’s 2016 Budget. March 2015 baseline adjusted to be closely consistent with S.Con.Res assumptions.
a. Adjusted for not reclassifying surface transportation spending as mandatory. Consistent with congressional
scoring. ***=CBO March Baseline with extrapolation of OCO, Program Integrity and Emergency Spending in
baseline.
Comparison House/Senate/ President FY 2016 Budget $ Billions, FY 2016-25

Impending “Fiscal Speed Bumps” 2015-2016
Source: The Committee for a Responsible Federal Budget

114th Congress & Races 2014, 2016, 2018
Party
Affiliation
113th
Congress
Seats that
were up in
2014
114th
Congress
Seats Up
in
2016
Seats Up
in
2018
U.S. Senate
Democrats
54
21
46
10
24
Republicans
45
15
54
24
8
U.S. House
Democrats
201
201
188
188
NA
Republicans 234 234 246 (1 Vacant)
246 NA
24
21

Alice Rivlin Senior fellow, Brookings Institution Former director, White House Office of Management and Budget

Questions?
Please submit them in the question box
of the GoToWebinar taskbar.