

PowerPoint Presentation · Consumer Discretionary. Consumer Staples. Energy. Financials....
29
│
Transcript of PowerPoint Presentation · Consumer Discretionary. Consumer Staples. Energy. Financials....

│


€


15 For illustrative purposes only. Source: S&P Global Market Intelligence. As of March 15, 2018
EMEA – Based Targets
020406080
100120140160180200
Q1 2017 Q1 2018
Number of Private Equity Entry Transactions by Region Jan - 15 March 2017 vs. Jan - 15 March 2018
Africa
BeNeLux
France
Germany
Middle East
Nordics
RoE
Southern Europe
United Kingdom
0
10
20
30
40
50
60
70
80
Q1 2017 Q1 2018
Number of Private Equity Exit Transactions by Region Jan - 15 March 2017 vs. Jan - 15 March 2018
Africa
BeNeLux
France
Germany
Middle East
Nordics
RoE
Southern Europe
United Kingdom
02468
1012141618
Q1 2017 Q1 2018
Aggregate Private Equity Entry Transaction Values by Region (€bn)
Jan - 15 March 2017 vs. Jan - 15 March 2018
Africa
BeNeLux
France
Germany
Middle East
Nordics
RoE
Southern Europe
United Kingdom 0
5
10
15
20
Q1 2017 Q1 2018
Aggregate Private Equity Exit Transaction Values by Region (€bn)
Jan - 15 March 2017 vs. Jan - 15 March 2018
Africa
BeNeLux
France
Germany
Middle East
Nordics
RoE
Southern Europe
United Kingdom
Data Pack

0
50
100
150
200
250
Q1 2017 Q1 2018
Average Entry Transaction Size by Region (€mn) Jan - 15 March 2017 vs. Jan - 15 March 2018¹
Africa
BeNeLux
France
Germany
Middle East
Nordics
RoE
Southern Europe
United Kingdom 0
200
400
600
800
1000
1200
1400
Q1 2017 Q1 2018
Average Exit Transaction Size by Region (€mn) Jan - 15 March 2017 vs. Jan - 15 March 2018
Africa
BeNeLux
France
Germany
Middle East
Nordics
RoE
Southern Europe
United Kingdom
0
50
100
150
200
250
300
350
400
Q1 2017 Q1 2018
Number of Private Equity Entry Transactions by Industry Jan - 15 March 2017 vs. Jan - 15 March 2018
Consumer Discretionary
Consumer Staples
Energy
Financials
Healthcare
Industrials
Information Technology
Materials
Real Estate
Telecommunication Services
Utilities 0
10
20
30
40
50
60
70
80
Q1 2017 Q1 2018
Number of Private Equity Exit Transactions by Industry Jan - 15 March 2017 vs. Jan - 15 March 2018
Consumer Discretionary
Consumer Staples
Energy
Financials
Healthcare
Industrials
Information Technology
Materials
Real Estate
Telecommunication Services
Utilities
Data Pack
EMEA – Based Targets (continued)
16 For illustrative purposes only. Source: S&P Global Market Intelligence. As of March 15, 2018
1. The entry transaction averages have been calculated after removing the following deals to avoid overestimating the trend on the back of a single deal: Glencore Plc (LSE:GLEN) along with Qatari sovereign wealth fund of Qatar Investment Authority agreed to acquire 19.5% stake in Public Joint Stock Company Rosneft Oil Company (LSE:ROSN) from OJSC Rosneftegaz for €10.5 billion.

17 For illustrative purposes only. Source: S&P Global Market Intelligence. As of March 15, 2018
0
2
4
6
8
10
12
Q1 2017 Q1 2018
Aggregate Private Equity Entry Transaction Values by Industry (€bn)
Jan - 15 March 2017 vs. Jan - 15 March 2018
Consumer Discretionary
Consumer Staples
Energy
Financials
Healthcare
Industrials
Information Technology
Materials
Real Estate
Telecommunication Services
Utilities0
2
4
6
8
10
12
14
Q1 2017 Q1 2018
Aggregate Private Equity Exit Transaction Values by Industry (€bn)
Jan - 15 March 2017 vs. Jan - 15 March 2018
Consumer Discretionary
Consumer Staples
Energy
Financials
Healthcare
Industrials
Information Technology
Materials
Real Estate
Telecommunication Services
Utilities
050
100150200250300350400450
Q1 2017 Q1 2018
Average Entry Transaction Size by Industry (€mn)
Jan - 15 March 2017 vs. Jan - 15 March 2018²
Consumer Discretionary
Consumer Staples
Energy
Financials
Healthcare
Industrials
Information Technology
Materials
Real Estate
Telecommunication Services
Utilities0
500
1000
1500
2000
2500
3000
Q1 2017 Q1 2018
Average Exit Transaction Size by Industry (€mn)
Jan - 15 March 2017 vs. Jan - 15 March 2018
Consumer Discretionary
Consumer Staples
Energy
Financials
Healthcare
Industrials
Information Technology
Materials
Real Estate
Telecommunication Services
Utilities
Data Pack
EMEA – Based Targets (continued)
2. The entry transaction averages have been calculated after removing the following deal to avoid overestimating the trend on the back of a single deal: Glencore Plc (LSE:GLEN) along with Qatari sovereign wealth fund of Qatar Investment Authority agreed to acquire 19.5% stake in Public Joint Stock Company Rosneft Oil Company (LSE:ROSN) from OJSC Rosneftegaz for €10.5 billion.
18 For illustrative purposes only. Source: S&P Global Market Intelligence. As of March 15, 2018
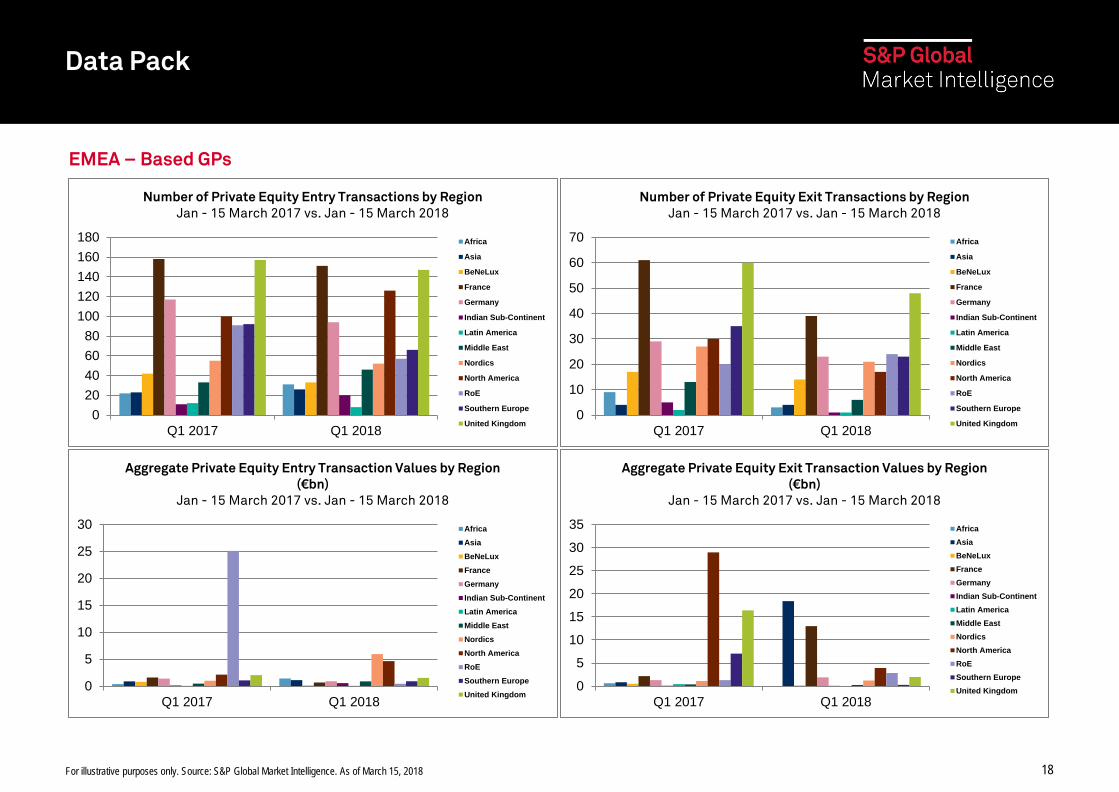
EMEA – Based GPs
020406080
100120140160180
Q1 2017 Q1 2018
Number of Private Equity Entry Transactions by Region Jan - 15 March 2017 vs. Jan - 15 March 2018
Africa
Asia
BeNeLux
France
Germany
Indian Sub-Continent
Latin America
Middle East
Nordics
North America
RoE
Southern Europe
United Kingdom0
10
20
30
40
50
60
70
Q1 2017 Q1 2018
Number of Private Equity Exit Transactions by Region Jan - 15 March 2017 vs. Jan - 15 March 2018
Africa
Asia
BeNeLux
France
Germany
Indian Sub-Continent
Latin America
Middle East
Nordics
North America
RoE
Southern Europe
United Kingdom
0
5
10
15
20
25
30
Q1 2017 Q1 2018
Aggregate Private Equity Entry Transaction Values by Region (€bn)
Jan - 15 March 2017 vs. Jan - 15 March 2018
AfricaAsiaBeNeLuxFranceGermanyIndian Sub-ContinentLatin AmericaMiddle EastNordicsNorth AmericaRoESouthern EuropeUnited Kingdom
0
5
10
15
20
25
30
35
Q1 2017 Q1 2018
Aggregate Private Equity Exit Transaction Values by Region (€bn)
Jan - 15 March 2017 vs. Jan - 15 March 2018
AfricaAsiaBeNeLuxFranceGermanyIndian Sub-ContinentLatin AmericaMiddle EastNordicsNorth AmericaRoESouthern EuropeUnited Kingdom
Data Pack

19 For illustrative purposes only. Source: S&P Global Market Intelligence. As of March 15, 2018
0
50
100
150
200
250
Q1 2017 Q1 2018
Average Entry Transaction Size by Region (€mn)
Jan - 15 March 2017 vs. Jan - 15 March 2018 Africa
Asia
BeNeLux
France
Germany
Indian Sub-Continent
Latin America
Middle East
Nordics
North America
RoE
Southern Europe
United Kingdom0
500
1000
1500
2000
2500
3000
3500
Q1 2017 Q1 2018
Average Exit Transaction Size by Region (€mn)
Jan - 15 March 2017 vs. Jan - 15 March 2018 Africa
Asia
BeNeLux
France
Germany
Indian Sub-Continent
Latin America
Middle East
Nordics
North America
RoE
Southern Europe
United Kingdom
050
100150200250300350400450
Q1 2017 Q1 2018
Number of Private Equity Entry Transactions by Industry Jan - 15 March 2017 vs. Jan - 15 March 2018
Consumer Discretionary
Consumer Staples
Energy
Financials
Healthcare
Industrials
Information Technology
Materials
Real Estate
Telecommunication Services
Utilities 0102030405060708090
100
Q1 2017 Q1 2018
Number of Private Equity Exit Transactions by Industry Jan - 15 March 2017 vs. Jan - 15 March 2018
Consumer Discretionary
Consumer Staples
Energy
Financials
Healthcare
Industrials
Information Technology
Materials
Real Estate
Telecommunication Services
Utilities
Data Pack
EMEA – Based GPs (continued)

20 For illustrative purposes only. Source: S&P Global Market Intelligence. As of March 15, 2018
0
5
10
15
20
25
Q1 2017 Q1 2018
Aggregate Private Equity Entry Transaction Values by Industry (€bn)
Jan - 15 March 2017 vs. Jan - 15 March 2018 Consumer Discretionary
Consumer Staples
Energy
Financials
Healthcare
Industrials
Information Technology
Materials
Real Estate
Telecommunication Services
Utilities 05
10152025303540
Q1 2017 Q1 2018
Aggregate Private Equity Exit Transaction Values by Industry (€bn)
Jan - 15 March 2017 vs. Jan - 15 March 2018
Consumer Discretionary
Consumer Staples
Energy
Financials
Healthcare
Industrials
Information Technology
Materials
Real Estate
Telecommunication Services
Utilities
0
20
40
60
80
100
120
140
Q1 2017 Q1 2018
Average Entry Transaction Size by Industry (€mn)
Jan - 15 March 2017 vs. Jan - 15 March 2018
Consumer Discretionary
Consumer Staples
Energy
Financials
Healthcare
Industrials
Information Technology
Materials
Real Estate
Telecommunication Services
Utilities0
500
1000
1500
2000
2500
3000
3500
Q1 2017 Q1 2018
Average Exit Transaction Size by Industry (€mn)
Jan - 15 March 2017 vs. Jan - 15 March 2018
Consumer Discretionary
Consumer Staples
Energy
Financials
Healthcare
Industrials
Information Technology
Materials
Real Estate
Telecommunication Services
Utilities
Data Pack
EMEA – Based GPs (continued)
21 For illustrative purposes only. Source: S&P Global Market Intelligence. As of March 15, 2018
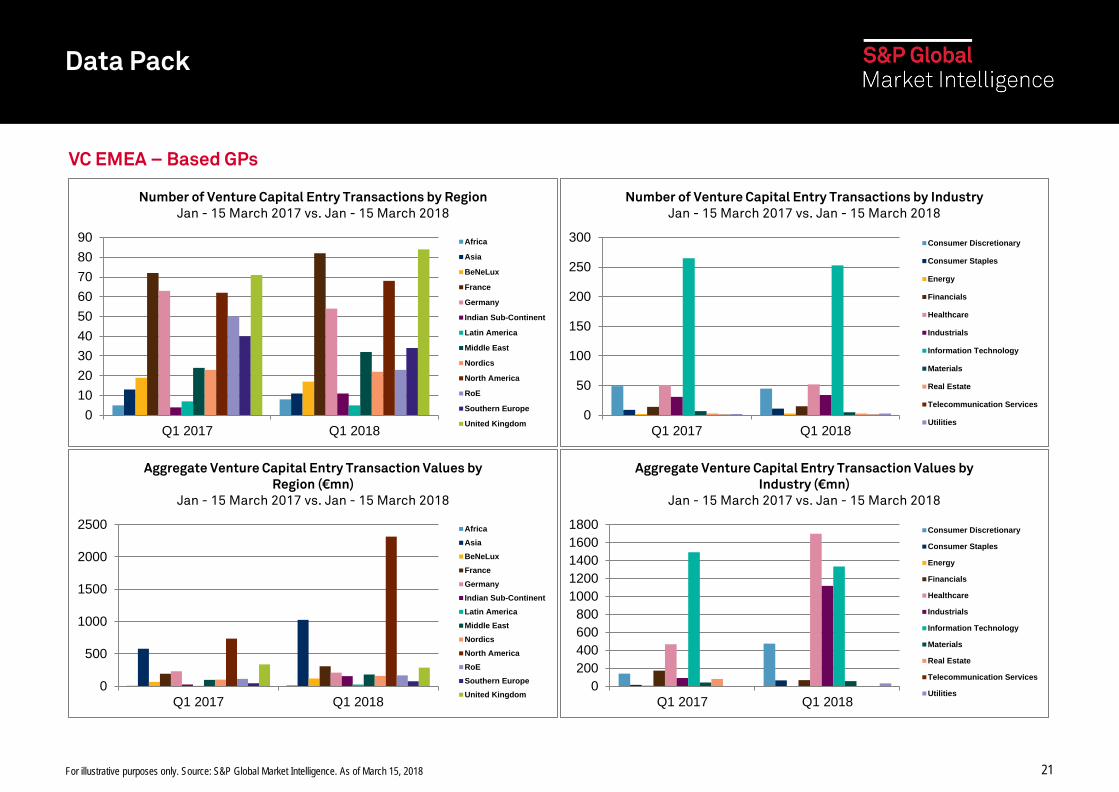
VC EMEA – Based GPs
0102030405060708090
Q1 2017 Q1 2018
Number of Venture Capital Entry Transactions by Region Jan - 15 March 2017 vs. Jan - 15 March 2018
Africa
Asia
BeNeLux
France
Germany
Indian Sub-Continent
Latin America
Middle East
Nordics
North America
RoE
Southern Europe
United Kingdom0
50
100
150
200
250
300
Q1 2017 Q1 2018
Number of Venture Capital Entry Transactions by Industry Jan - 15 March 2017 vs. Jan - 15 March 2018
Consumer Discretionary
Consumer Staples
Energy
Financials
Healthcare
Industrials
Information Technology
Materials
Real Estate
Telecommunication Services
Utilities
0
500
1000
1500
2000
2500
Q1 2017 Q1 2018
Aggregate Venture Capital Entry Transaction Values by Region (€mn)
Jan - 15 March 2017 vs. Jan - 15 March 2018
AfricaAsiaBeNeLuxFranceGermanyIndian Sub-ContinentLatin AmericaMiddle EastNordicsNorth AmericaRoESouthern EuropeUnited Kingdom
0200400600800
10001200140016001800
Q1 2017 Q1 2018
Aggregate Venture Capital Entry Transaction Values by Industry (€mn)
Jan - 15 March 2017 vs. Jan - 15 March 2018
Consumer Discretionary
Consumer Staples
Energy
Financials
Healthcare
Industrials
Information Technology
Materials
Real Estate
Telecommunication Services
Utilities
Data Pack

22 For illustrative purposes only. Source: S&P Global Market Intelligence. As of March 15, 2018
0
20
40
60
80
100
120
Q1 2017 Q1 2018
Average Entry Transaction Size by Region (€mn)
Jan - 15 March 2017 vs. Jan - 15 March 2018 Africa
Asia
BeNeLux
France
Germany
Indian Sub-Continent
Latin America
Middle East
Nordics
North America
RoE
Southern Europe
United Kingdom0
10
20
30
40
50
Q1 2017 Q1 2018
Average Entry Transaction Size by Industry (€mn)
Jan - 15 March 2017 vs. Jan - 15 March 2018 Consumer Discretionary
Consumer Staples
Energy
Financials
Healthcare
Industrials
Information Technology
Materials
Real Estate
Telecommunication Services
Utilities
Data Pack
VC EMEA – Based GPs (continued)
Data Pack
23 For illustrative purposes only. Source: S&P Global Market Intelligence. As of March 15, 2018
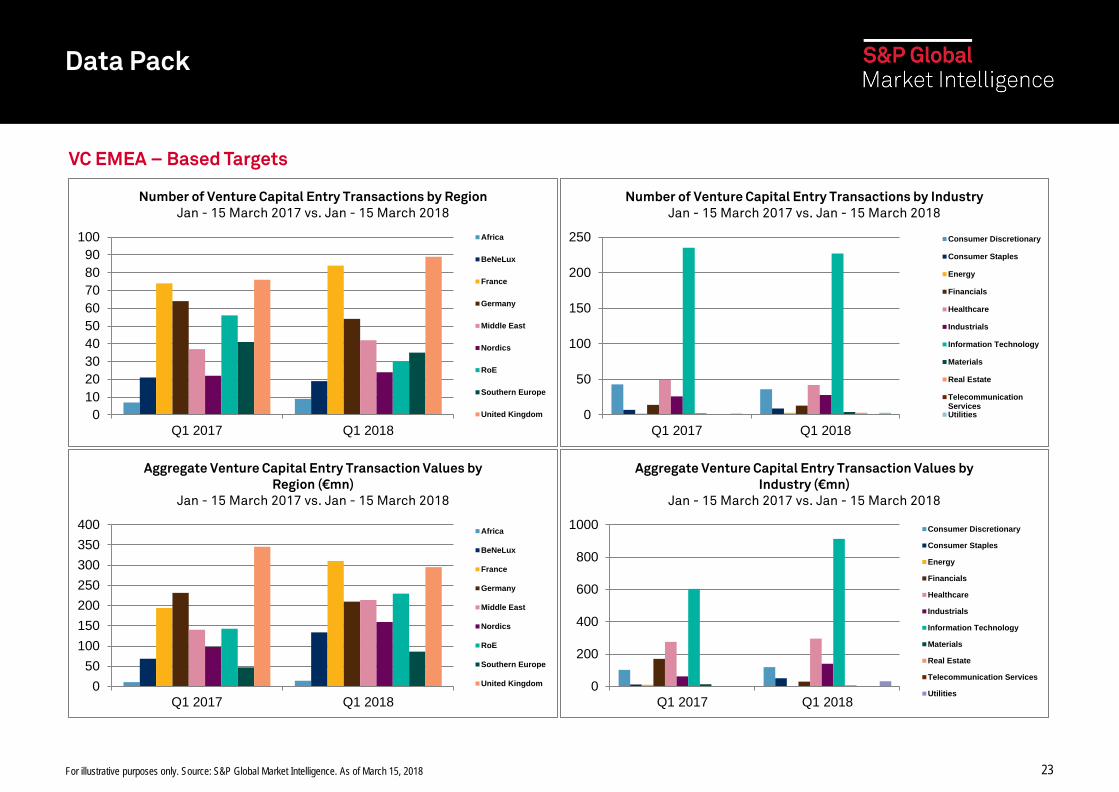
VC EMEA – Based Targets
0102030405060708090
100
Q1 2017 Q1 2018
Number of Venture Capital Entry Transactions by Region Jan - 15 March 2017 vs. Jan - 15 March 2018
Africa
BeNeLux
France
Germany
Middle East
Nordics
RoE
Southern Europe
United Kingdom 0
50
100
150
200
250
Q1 2017 Q1 2018
Number of Venture Capital Entry Transactions by Industry Jan - 15 March 2017 vs. Jan - 15 March 2018
Consumer Discretionary
Consumer Staples
Energy
Financials
Healthcare
Industrials
Information Technology
Materials
Real Estate
TelecommunicationServicesUtilities
050
100150200250300350400
Q1 2017 Q1 2018
Aggregate Venture Capital Entry Transaction Values by Region (€mn)
Jan - 15 March 2017 vs. Jan - 15 March 2018
Africa
BeNeLux
France
Germany
Middle East
Nordics
RoE
Southern Europe
United Kingdom 0
200
400
600
800
1000
Q1 2017 Q1 2018
Aggregate Venture Capital Entry Transaction Values by Industry (€mn)
Jan - 15 March 2017 vs. Jan - 15 March 2018
Consumer Discretionary
Consumer Staples
Energy
Financials
Healthcare
Industrials
Information Technology
Materials
Real Estate
Telecommunication Services
Utilities

24 For illustrative purposes only. Source: S&P Global Market Intelligence. As of March 15, 2018
0
2
4
6
8
10
Q1 2017 Q1 2018
Average Entry Transaction Size by Region (€mn)
Jan - 15 March 2017 vs. Jan - 15 March 2018
Africa
BeNeLux
France
Germany
Middle East
Nordics
RoE
Southern Europe
United Kingdom 02468
1012141618
Q1 2017 Q1 2018
Average Entry Transaction Size by Industry (€mn)
Jan - 15 March 2017 vs. Jan - 15 March 2018 Consumer Discretionary
Consumer Staples
Energy
Financials
Healthcare
Industrials
Information Technology
Materials
Real Estate
Telecommunication Services
Utilities
Data Pack
VC EMEA – Based Targets (continued)

25 For illustrative purposes only. Source: S&P Global Market Intelligence. As of March 15, 2018
EMEA Private Equity Market Snapshot
Multiples Table
*Multiples highlighted in bold & italics represent the sector average over a 2 year time horizon in order to provide a more comprehensive sector average.
Implied Enterprise Value/EBITDA EMEA Private Equity Exits, 01/01/17 -15/03/18 M&A, 01/01/17 -15/03/18
Consumer Discretionary 11.7 10.2
Consumer Staples 9.5 9.7
Energy 9.5 6.5
Financials 20.2 12.3
Healthcare 15.2 13.7
Industrials 11.9 10.2
Information Technology 12.5 12.1
Materials 9.5 8.4
Telecommunication Services 10.9 8.9
Utilities 11.9 11.9
Real Estate 27.8 22.0
Implied Equity Value/LTM Net Income EMEA Private Equity Exits, 01/01/17 -15/03/18 M&A, 01/01/17 -15/03/18
Consumer Discretionary 14.5 16.1
Consumer Staples 17.7 13.4
Energy 21.3 11.3
Financials 14.7 13.9
Healthcare 32.5 26.7
Industrials 18.0 15.4
Information Technology 18.4 20.7
Materials 17.2 15.0
Telecommunication Services 23.0 24.4
Utilities 16.8 19.1
Real Estate 14.2 15.2
26 For illustrative purposes only.
EMEA Private Equity Market Snapshot
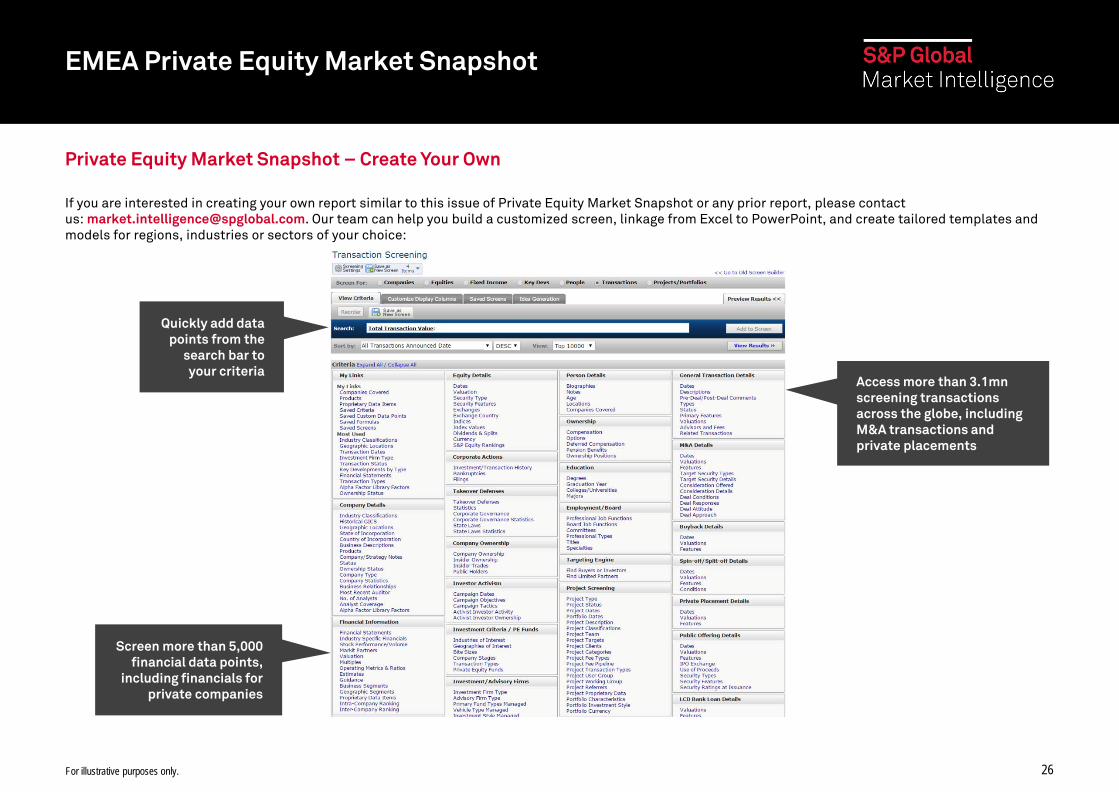
Private Equity Market Snapshot – Create Your Own
If you are interested in creating your own report similar to this issue of Private Equity Market Snapshot or any prior report, please contact us: [email protected]. Our team can help you build a customized screen, linkage from Excel to PowerPoint, and create tailored templates and models for regions, industries or sectors of your choice:
Quickly add data points from the
search bar to your criteria
Access more than 3.1mn screening transactions across the globe, including M&A transactions and private placements
Screen more than 5,000 financial data points,
including financials for private companies

27
EMEA Private Equity Market Snapshot
Previous Issues
Issue 1, March 2014 • EMEA-Based Private Equity Market Settles into a New Normal
Post-Financial Crisis • Information Technology Remains Attractive for PE and VC Firms
Issue 2, June 2014 • Healthy Start to 2014 for EMEA GPs, Despite April Hiccup • Healthcare: Resilient or Overheating? We examine PE activity pre
and post-financial crisis
Issue 3, September 2014 • Pressure from Strategic Buyers Slowing EMEA GPs’ Pace of
Investment in Q2 • Asia Capital Sun Rising over Europe: Asian PE investors show
growing interest in EMEA-based targets
Issue 4, January 2015 • 2014: EMEA Still Attractive to Global Private Equity • IT & Finance heat up • Germany: Has the Mittelstand lost its quintessentially strong
profile?
Issue 5, April 2015 • UK North-South Divide: Who is Benefitting from UK Private Equity
Investments? • Fall of Oil & Gas Prices: Potential PE Dealmaking Territory • Private Equity: What’s the Deal with Tax Havens?
Issue 6, July 2015 • European Leveraged Lending: How are PE Firms Taking Advantage
of Conditions in the European Leveraged Finance Market? • Consumer Confidence Conundrum – EMEA PE Skeptical about
Consumer Confidence Outlook? • Middle East Sovereign Wealth Funds – Perfect Partners for Mega-
Deals
Issue 7, September 2015 • Investment into EMEA Wanes as Regional Issues Accumulate • Private Equity Shifts Focus Towards Internet Retailers • Private Equity Exits: Secondaries and IPOs – Buffers and Bull
Markets
Issue 8, February 2016 • EMEA Becomes Increasingly Attractive to Global GPs • EMEA Healthcare Checkup • The Rise of Cyber Power in Germany • Have Buyout Holding Periods Reached their Peak?
Issue 9, April 2016 • 2016: Slow Start for EMEA Entries but Exits Skyrocketing • France: La Belle Vie for Private Equity • Spanner in the Works for Industrials • Will Private Equity Push through High-Yield Bond Market Volatility?
Issue 10, July 2016 • Is Investment into EMEA Running Out of Steam? • Sweden: Still ahead in the Nordic Private Equity Market? • IT in EMEA Losing Ground to the U.S. and Asia • Private Equity Sponsors Tap Powerful Direct-Lenders in Bid to
Raise Larger Unitranches
Issue 11, October 2016 • EMEA Emerging Markets Flourish Despite Brexit Jitters • Specialist Mid-Market GPs Face Stiff Competition • EMEA Consumer Products Losing Ground to US Targets • UK Large Caps, UK Mid-Caps: Spot Any Difference?
Issue 12, February 2017 • EMEA Fails to Attract Global Private Equity Capital in 2016 • Russia, Czech Republic and Poland lead the way for CEE • Real Estate and Private Equity: An Affair to Remember • Asia-Pacific Investors favour North America over Europe
Issue 13, April 2017 • 2017: EMEA Blossoms in the Spring • France Affected by Counterfactual Thinking? • Global GPs Cautiously Optimistic Towards the Energy Sector • Borrowers Hold the Upper Hand in Flooded Leveraged Loan Market
Issue 14, July 2017 • All Eyes on UK PE Targets • Sector Selection Critical to Success in Germany and Switzerland • Healthcare Sector Diagnosis: Chronic Arrhythmia • Private Equity Firms: Throwing Gas (and Oil) On A Potential Fire?
Issue 15, October 2017 • Lack of Brexit Clarity Fails to Stump UK Deals • Secondary Directs – A New Rite of Passage for PE Holdings? • China: Global GPs Look East to Capture IT Opportunities • Changing Tastes: Institutional Investors Satisfy Growing PE
Appetite Issue 16, February 2018 • UK, The Fairest of Them All • The Nordics: Losing Its Lustre or Going Through A Lull? • Strategic Buyers Trump Sponsors in Consumers • The PE Industry Shares Their 2018 Views

EMEA Private Equity Market Snapshot
For More Information
S&P Global Market Intelligence’s broad range of solutions and services were utilized in the production of this paper. For more information please contact: The Americas +1 212 438 8701 +1 888 806 5541 Asia-Pacific +852 2533 3588 Europe, Middle East and Africa +44 (0) 20 7176 1234 www.spglobal.com/marketintelligence
EMEA Private Equity Market Snapshot
Copyright © 2018 by S&P Global Market Intelligence, a division of S&P Global Inc. All rights reserved.
These materials have been prepared solely for information purposes based upon information generally available to the public and from sources believed to be reliable. No content (including index data, ratings, credit-related analyses and data, research, model, software or other application or output therefrom) or any part thereof (Content) may be modified, reverse engineered, reproduced or distributed in any form by any means, or stored in a database or retrieval system, without the prior written permission of S&P Global Market Intelligence or its affiliates (collectively, S&P Global). The Content shall not be used for any unlawful or unauthorized purposes. S&P Global and any third-party providers, (collectively S&P Global Parties) do not guarantee the accuracy, completeness, timeliness or availability of the Content. S&P Global Parties are not responsible for any errors or omissions, regardless of the cause, for the results obtained from the use of the Content. THE CONTENT IS PROVIDED ON “AS IS” BASIS. S&P GLOBAL PARTIES DISCLAIM ANY AND ALL EXPRESS OR IMPLIED WARRANTIES, INCLUDING, BUT NOT LIMITED TO, ANY WARRANTIES OF MERCHANTABILITY OR FITNESS FOR A PARTICULAR PURPOSE OR USE, FREEDOM FROM BUGS, SOFTWARE ERRORS OR DEFECTS, THAT THE CONTENT’S FUNCTIONING WILL BE UNINTERRUPTED OR THAT THE CONTENT WILL OPERATE WITH ANY SOFTWARE OR HARDWARE CONFIGURATION. In no event shall S&P Global Parties be liable to any party for any direct, indirect, incidental, exemplary, compensatory, punitive, special or consequential damages, costs, expenses, legal fees, or losses (including, without limitation, lost income or lost profits and opportunity costs or losses caused by negligence) in connection with any use of the Content even if advised of the possibility of such damages.
S&P Global Market Intelligence’s opinions, quotes and credit-related and other analyses are statements of opinion as of the date they are expressed and not statements of fact or recommendations to purchase, hold, or sell any securities or to make any investment decisions, and do not address the suitability of any security. S&P Global Market Intelligence may provide index data. Direct investment in an index is not possible. Exposure to an asset class represented by an index is available through investable instruments based on that index. S&P Global Market Intelligence assumes no obligation to update the Content following publication in any form or format. The Content should not be relied on and is not a substitute for the skill, judgment and experience of the user, its management, employees, advisors and/or clients when making investment and other business decisions. S&P Global Market Intelligence does not act as a fiduciary or an investment advisor except where registered as such. S&P Global keeps certain activities of its divisions separate from each other in order to preserve the independence and objectivity of their respective activities. As a result, certain divisions of S&P Global may have information that is not available to other S&P Global divisions. S&P Global has established policies and procedures to maintain the confidentiality of certain non-public information received in connection with each analytical process.
S&P Global may receive compensation for its ratings and certain analyses, normally from issuers or underwriters of securities or from obligors. S&P Global reserves the right to disseminate its opinions and analyses. S&P Global's public ratings and analyses are made available on its Web sites, www.standardandpoors.com (free of charge), and www.ratingsdirect.com and www.globalcreditportal.com (subscription), and may be distributed through other means, including via S&P Global publications and third-party redistributors. Additional information about our ratings fees is available at www.standardandpoors.com/usratingsfees.