PowerPoint Presentation · Company presentation . Content ... Slide 11 Belgacom ... 26 11 31 32 16...
60
Q3 2014 Company presentation
Transcript of PowerPoint Presentation · Company presentation . Content ... Slide 11 Belgacom ... 26 11 31 32 16...

Q3 2014
Company presentation

Content Group financials 3
Q3 2014 confirming a solid business performance 4
Group underlying revenue 5
Mobile services revenue 6
Underlying cost evolution 7
FTE- divestures and natural attrition reducing headcount 8
Group underlying EBITDA 9
Capex 10
FCF 11
Shareholder remuneration 12
Financial position 13
Guidance 14
Group operationals 15
Mobile performance 16
Fixed performance 17
Convergence progress 18
2
Network 20
Mobile 21
Fixed 22
Spectrum 23
Strategy: “Fit-for-Growth” 24
Consumer segment results 28
Enterprise segment results 36
Service Delivery Engine & Wholesale 43
Staff & Support 44
BICS 45
Other information 46
From reported to underlying 48
Pricing 50
Regulation 57

Slide 3
Group financials
Q3 2014

Q3 2014 confirming a solid business performance
• Underlying Group revenue of € 1,487m, i.e. -1.0% YoY.
• Core revenue +1.1% YoY, Consumer and Business segment
showing good improvement
• Revenue from BICS down 6.1% on lower Voice volumes
Revenue
Ebitda
Capex
• Underlying EBITDA of € 431m, up 1.5% YoY
• Continued improvement in Mobile Services revenue
• Structural cost reduction through simplification starting to
show in favourable trends for personnel and other expenses
• Belgacom invested € 198m in Q3 2014
• Further improving Fixed and Mobile networks, and IT systems
• Ytd 2014 capex of EUR 623m
4

1,502
1,487
12
5 -6
-27
0
underlying Q3'13 Underlying CBU Underlying EBU Underlying SDE BICS Intra-groupelimination &
S&S
underlying Q3'14
4,531
4,408
-15-8
-17
-84
1
underlyingYtd'13
Underlying CBU Underlying EBU Underlying SDE BICS Intra-groupelimination &
S&S
underlyingYtd'14
Group underlying* revenue
Q3
Ytd
* Adjusted for incidentals
• Consumer: sequential improvement driven by good TV growth and strong Mobile revenue
• Enterprise: strong Mobile services revenue, and growth in organic ICT revenue
• Carrier Wholesale Services continued to be under pressure.
• BICS: -6.1% YoY, growing non-voice revenue not fully covering for the lower Voice revenue
• Regulation impact estimated at €-18 m
• Ytd Sept ‘14, underlying revenue -2.7% YoY
• Underlying core revenue -1.2% YoY
• BICS decreased by 6.7% • Regulation impact estimated at
€ -37m
-2.7% underlying
-1.0% underlying
5

Mobile services revenue trend
-5.0%
-7.1%
-12.9%-13.3%-14.0%
-11.6%
-6.0%
-4.5%
0.0%Q3'12 Q4'12 Q1'13 Q2'13 Q3'13 Q4'13 Q1'14 Q2'14 Q3'14
Reported
On comparable basis
• Solid mobile customer growth +172,000 YoY for Group
• Impact from customer re-pricing further faded
• Steep increase in data usage as Smartphone penetration goes up
• Improved customer tiering, helped by joint-offers
• Churn levels kept under control in spite of increased competitive intensity
CBU &
EBU
Recovering Mobile Service revenue important driver of higher Core revenue
New Belgian Telco law & mobile price war Recovery
>44% Smartphone penetration; +9pp YoY
80% on new mobile tariff plans
6

600 609 598 605541
610 592
250
300
350
400
450
500
550
600
650
700
Q113 Q213 Q313 Q413 Q114 Q214 Q314
Mill
ions
Underlying Cost of Sales (€m)
207 214 210227
206 204 203
0
50
100
150
200
250
Q113 Q213 Q313 Q413 Q114 Q214 Q314
Mill
ions
Underlying non-HR expenses (€m)
269 261 268 262 258 259 260
150
170
190
210
230
250
270
290
Q113 Q213 Q313 Q413 Q114 Q214 Q314
Mill
ions
Underlying HR expenses (€m)
-3.0%
-3.4%
-1.0%
‘Fit for Growth’ strategy showing in positive underlying cost evolution
• Implementation of ‘Fit-for-Growth’ strategy showing in solid cost reduction
• Ytd Sept’14, underlying non-HR expenses totaled € 612m, -3.0% YoY
• Positive HR-cost evolution results from a natural attrition of -374 FTEs over the past 12 months
• No impact from inflation-based salary indexations • Ytd Sept’14 € 777m underlying HR expenses,
-2.7% YoY
• Lower CoS due to BICS, -6.6% YoY • Partly offset by higher CoS from the Consumer
segment, including a timing difference of tactical handset-joint-offers and other promotional costs
• Ytd Sept’14 underlying Cost of Sales totaled € 1,743m, or -3.6% YoY
7

Divestures and natural attrition reducing headcount
• 14,342 FTEs in Belgacom Group end September 2014 • vs one year ago -1,425 FTEs :
- 1,051 FTEs from divestures - 374 FTEs natural attrition
• End Sept’14: 5,038 civil servants, or +/- 35%
Estimated cash-out for termination benefits related to
past headcount reduction programs:
€ million
2014 49
2015 22
2016 6
2017 5
2018-2035 15* (* Cumulative for
full period)
PTS -6,300 FTE
BeST -4,160 FTE
2006-2012 Tutorship & FMS -3,900 FTE
Telindus +2,600 FTE
14,342
44Yr
average age
- contractual 39 Yr - statutory 52 Yr
Belgacom SA age pyramid
8

425
431
-3
9
0 -0.3 1
underlying Q3'13 Underlying CBU Underlying EBU Underlying SDE Underlying S&S BICS underlying Q3'14
1,294
1,276-13
-8
37
-6
underlyingYtd'13
Underlying CBU Underlying EBU Underlying SDE Underlying S&S BICS underlyingYtd'14
Group underlying* EBITDA
Q3
Ytd
* Adjusted for incidentals
• Underlying Group EBITDA showing further enhancement from previous quarters
• Strong segment result from the Enterprise business unit
• BICS’ segment result too was up by 2.6%
• Partly offset by a 1.2% decline for the Consumer segment
• Regulation impact estimated at €- 17m
-1.4% underlying
• Ytd Sept’14, underlying EBITDA was-1.4% YoY
• EBITDA showed impact from Mobile disruption on Consumer and Enterprise segment
• Regulation impact estimated at €- 33m
+1.5% underlying
9

€ 623 million capex ytd’14 Investing in excelling customer experience
Slide 10 *This does not include the € 120 mio capex paid for a 800 Mhz spectrum
* 734
777753
852
11.1%12.1% 11.7%
13.5%
2010 2011 2012 2013 Outlook 2014
Group Capex (in € mio )
capex as percentage of revenuearound 960m
EUR
*
FY 2014 capex to be around € 960m: Access networks IT and systems Convergence services Brand image and includes Belgian Jupiler Pro
League football
Q2’13 Q2’14
H1’13 H1’14 176
198
546
623
Q3’13 Q3’14 Ytd ’14 Ytd ’13
Over first 9 months of 2014 Belgacom invested € 623m a.o. in:
• Further improving the Fixed experience for customers
through Vectoring, which offers dedicated speeds of 70 Mbps
• Providing the best Mobile experience combining wide coverage with very high standards in calling and Mobile speeds
• Network transformation and simplification enabling significant efficiencies in the network and costs savings
2010 2011 2012 2013 2014
10

410
629
150
10730
7
Slide 11
Belgacom generated € 629m of FCF ytd’14, or € +219m YoY. Main drivers for the FCF increase are
• higher cash received from the sale of consolidated companies and buildings
• lower income tax payments, partly due to timing differences
• partly offset by more cash paid for the acquisition of intangible assets and property, plant and equipment.
Ytd 2014
(in million €)
Q3’14 FCF of € 238m; bringing ytd’14 FCF to € 629m
11

Belgacom ownership
338,025,135 shares in total
Shareholder remuneration & structure
On 23 October 2014, Belgacom’s Board of Directors approved to return to the shareholders a total gross interim dividend of EUR 0.50 per share. The Board of Directors also confirmed their intention to pay a stable total gross dividend of €1.50 per share over the result of 2014, 2015 and 2016. For the interim dividend: • Ex-coupon date: 10 December 2014 • Record date: 11 December 2014 • Payment date: 12 December 2014
Status 31 Oct ‘14 Shares % shares % Voting % Dividend
Belgian state 180,887,569 53.51% 56.34% 55.94%
Free float 140,156,615 41.46% 43.66% 43.34%
Own shares 16,980,951 5.02% - 0.72%
Belgacom commits to an attractive shareholder remuneration policy by returning, in principle, most of its annual free cash flow, to its shareholders. The return of free cash flow either through dividends or share buybacks, will be reviewed on an annual basis, in order to keep strategic financial flexibility for future growth, organically or via selective M&A, with a clear focus on value creation. This also includes confirming appropriate levels of distributable reserves. The shareholder remuneration policy is based on a number of assumptions regarding future business and market evolutions, and may be subject to change in case of unforeseen risks or events outside the company's control
Interim dividend
over 2014 result
General policy
shareholder return
12

Sound financial position
Debt maturing
2015 € 145m
2016 € 950m
2018 € 500m
2023 € 100m
2028 € 150m
2026 € 73m
• Net financial debt at € 1,725m, € 90m lower versus end 2013
• The outstanding long term financial gross debt amounted to € 2.5Bio
• Credit ratings: Standard & Poor’s A; Moody’s A1 – both stable outlook
2024 € 600m
( 1 ,815)
629
(553)
(33) 43 (4) ( 1 ,725)
Net debtDecember 2013
FCF Dividends Non controllinginterests
Net sale oftreasury shares
Other Net debtSeptember 2014
13

Full-year EBITDA outlook raised to ‘slightly positive’ on Belgacom’s good business trends
FY 2013 YtD 2013 YtD 2014% Change
YtD
Guidance FY 2014
(revised on 1 August 2014)
New Guidance FY 2014 (revised on 24 October 2014)
Reported Group revenue 6,318 4,736 4,597
non-recurring 0 0 62
Telindus France 242 177 75
4,410 3,293 3,279 -0.4% Decline between '-1% and -2%' Decline between '-1% and -2%'
BICS 1,666 1,266 1,182 -6.7% Decline between '-5% and -10%' Decline between '-5% and -10%'
Reported Group EBITDA 1,699 1,301 1,400
non-recurring -13 1 67
Telindus France 11 6 -0.4
EBITDA-base for guidance** 1,702 1,294 1,334 3.1% Decline between '-1% and -2%' Slightly positive
Capex 972 546 623 Around EUR 960 million Around EUR 960 million
* i.e. Reported group revenue minus non-recurring & Telindus FR & BICS; including capital gain on building sales
** i.e. Reported group EBITDA minus non-recurring & Telindus FR
Core business*
Metrics
14

Slide 15
Group
Operationals
Q3 2014

-58 -48-67
-46 -39
20 21 33 22 2118
3325
2511
Q3'13 Q4'13 Q1'14 Q2'14 Q3'14
Postpaid Payingcards
PostpaidInternetEverywhereCards
Prepaid
-21 6 -102
-7
26
11
31 32
16
8
15
25
8
15
6
6
7
5
5
Q3'13 Q4'13 Q1'14 Q2'14 Q3'14
InternetEverywherecardsM2M
Paying cards(other thanM2M)
3931
45
64
36
Continued solid operational Mobile performance
Belgian Mobile market growing by 3.2% YoY to 12.6 million mobile cards
Mobile penetration at 113% Belgacom market share at 40.3%, slightly down mainly
due lower prepaid market share
Consumer mobile net adds
Enterprise mobile net adds
Mobile customer base growing Increase on mobile postpaid; slowing prepaid decline
*Including Voice and Data mobile cards sold through CBU, as well as M2M cards in EBU. Mobile cards from the Tango, MVNO and SDE&W segment are included as well.
Prepaid
Postpaid
*
+23 +39 +55 +52 +26
16
Mobile market shares (company estimation)

Good performance for Fixed products, especially for Proximus TV
Digital TV market growing at stable pace. Belgian digital TV penetration @ 80.6%
Stable DTV market share of 32.3%
Continued growth of TV customer base
Total TV market** share of 28% ; +2pp YoY
Belgian Fixed internet market
still growing, but at slower pace
Internet penetration @ 79%
Belgacom market share stable
Stable market, Fixed Voice penetration @ 71%
Belgacom containing Fixed Voice line erosion
Fixed Voice line “upgraded” via:
Flat rate calling “Happy Time XL” and “Happy Time International”
Multi-play packaging
*
77% of the 1.3 mio Consumer Internet
lines has a Belgacom TV subscription
8
17 16
12 13
1,660 1,677 1,694 1,705 1,718
Q3'13 Q4'13 Q1'14 Q2'14 Q3'14
Broadband customer evolution net adds total
19
31 30 3033
1,447 1,465 1,495 1,525 1,558
1,198 1,204 1,225 1,244 1,264
Q3'13 Q4'13 Q1'14 Q2'14 Q3'14
TV evolution net adds total Unique Customers
-33 -33 -34-26 -25
2,969 2,936 2,902 2,876 2,850
Q3'13 Q4'13 Q1'14 Q2'14 Q3'14
Fixed Voice customer evolution net adds total
17

26.0%
19.9% 19.4%20.3% 20.4%
19.4%
21.7%
16.4%
13.5% 13.7% 13.7%12.9%
12.2%
14.1%
11.3% 11.0%12.3% 11.8%
9.4% 9.7%
13.0%
7.6%8.3%
9.6%8.7%
6.9% 6.4%8.1%
1.2% 1.4% 1.7% 1.7% 2.1% 1.9%2.5%
Q1'13 Q2'13 Q3'13 Q4'13 Q1'14 Q2'14 Q3'14
Annualized full churn rate of a x-play Household
1-Play
Total
2-Play
3-Play
4-Play
• 55% of HH are multi-play , +2.7 p.p. yoy
• # 4-play HH +14% YoY, at very low churn
• multi-play convergent household,
i.e. Fixed + Mobile, grew 3.5pp to 51.0%.
“Significantly lower full churn for multi-play households”
-22
-10
-29
-25
-12
-27-29-10
-8
-3
-4
-7
-4
-7
1
-3
-3
-1
0
-1
4
12 16
10 11 12 12
12
Q1'13 Q2'13 Q3'13 Q4'13 Q1'14 Q2'14 Q3'14
CBU Households per x-play: net adds of the quarter (in '000)
4-Play
3-Play
2-Play
1-Play
Good progress in convergence strategy - Operational drivers x-play Household reporting
CBU Households per x-play Q3'14:
Total of 2,312,000 Households
1-Play:1,031
45%
4-Play:379
16%
3-Play:518
22%2-Play:
383
17%
Number of Households in '000
CBU Households per x-play Q3'13:
Total of 2,378,000 Households
1-Play:1,124
47%
4-Play:333
14%
3-Play:516
22%
2-Play:405
17%
Number of Households in '000
38% HH on 3-
or 4- play
18

• € 381m came from X-play
households; +1.6% YoY
• 75% from multi-play HH +2.7 p.p. YoY
• 4-play HH revenue +15.5% YoY due to growing number of 4-play HH and YoY increase in ARPH to € 105.0
99.6 €103.0 € 103.4 € 102.6 € 101.8 €
103.9 € 105.0 €
68.8 € 69.9 € 70.6 € 69.9 € 69.6 € 70.9 € 71.8 €
50.2 € 51.9 € 52.3 € 51.8 € 51.9 € 53.3 € 54.7 €
47.3 € 47.8 € 48.1 € 47.2 € 46.9 € 47.4 € 48.1 €
30.4 € 31.2 € 30.8 € 29.8 € 29.3 € 29.9 € 30.8 €
Q1'13 Q2'13 Q3'13 Q4'13 Q1'14 Q2'14 Q3'14
Average Revenue per x-play Househould (ARPH) in €
4-Play
3-Play
Total
2-Play
1-Play
4.52 4.55 4.57 4.60 4.61 4.63 4.63
3.12 3.13 3.14 3.15 3.15 3.16 3.16
2.15 2.18 2.21 2.24 2.26 2.29 2.32
2.04 2.04 2.04 2.04 2.04 2.04 2.04
1.14 1.15 1.15 1.16 1.15 1.16 1.16
Q1'13 Q2'13 Q3'13 Q4'13 Q1'14 Q2'14 Q3'14
Average Revenue Generating Unit per x-play Household
4-Play
3-Play
Total
2-Play
1-Play
CBU revenue from households slightly up YoY - higher ARPH & RGUs
CBU Revenues per x-play Q3'14:
Total x-play Revenues of € 381mio
1-Play:97
25%
4-Play:117
31%
3-Play:111
29%
2-Play:56
15%
Revenues per x-play in € mio
CBU Revenues per x-play Q3'13:
Total x-play Revenues of € 375mio
1-Play:105
28%
4-Play:102
27%
3-Play:110
29%
2-Play:59
15%
Revenues per x-play in € mio
60% rev from 3- or 4- play HH
19

Slide 20
High-quality & innovative networks

Overall best speed experience in
Belgium to its customers
Best optimized experience cross
2G, 3G, 4G technologies & WiFi
Best 4G experience in the cities &
at the coast (on 1800 Mhz band)
Mobile Network - Best true customer experience as TOP priority
Best Customer Experience… …across technologies …where it matters…
Average download speed on 4G capable device *
>40% faster average download speed experience
with a 4G capable device vs nearest competition
Leverage mobile experience through wifi
• 970.000 WiFi hotspots available today for our
customers all throughout Belgium (+40.000 vs Q2)
• 13.200.000 WiFi hotspots available abroad
(e.g. NL, FR, UK, DE,…)
• EAP SIM: Since November, mobile devices of Proximus
customers will connect automatically to WiFi when present,
via SIM authentication: bringing true convergence
Mobile Network Outdoor Coverage*: ~99% 3G & 2G coverage ~66% 4G coverage
* Source: coverage and speeds are measured by independent agency CommSquare through national drive tests
20.3 Mbps
14.1 Mbps
14.2 Mbps
Proximus
Mobistar
Base
21

Fixed Network Coverage & Speed: 99.85% DSL 90% FTTC average VDSL2 speed: ~40 Mbps
Mass roll-out well
underway: in Q3 13%
of remote optical
platforms made
vectoring-ready
Majority of regional
industrial zonings in
Belgium are already
equipped with
Belgacom fiber
All new residential
zonings that are
sufficiently large are
by default equipped
with Belgacom fiber
Go-to-market campaign
launched to promote presence
of FTTB in industrial zonings
Through cancellation of
crosstalk on a VDSL2 line,
Vectoring enables up-to-70
Mbps speeds on copper
Fixed Network - Driving customer experience with new technologies
Vectoring technology on VDSL
FTTH in Greenfields
Deployment of FTTH in new
residential zonings started in
2014 following successful trials
last year
FTTB in Industrial Zonings
30 Mbps
Dynamic Line Management on VDSL2
VDSL2
Vectoring on VDSL2
Vectoring + Dynamic Line
Management for Vectoring
Fiber-To-The-Home (FTTH) &
Fiber-To-The-Business (FTTB)
up-to
50Mbps
up-to
70 Mbps
up-to
100 Mbps
up-to
1000 Mbps Technology evolution Dedicated video grade speed
22

Spectrum: ownership & usage
Proximus 2 x 12
Mobistar 2 x 12
Base 2 x 10
Proximus 2 x 20.8
Mobistar 2 x 20.8
Base 2 x 22
Unallocated 2 x 11.4
Unallocated 2 x 15
900 MHz
1800 MHz
2100 MHz
2600 MHz
Proximus 2 x 15
Mobistar 2 x 14.8
Base 2 x 14.8
1x 5.4
1x5 1x5 Unallocated
2 x 14.8 1x5
Proximus 2 x 20
Mobistar 2 x 20
Base 2 x 15
Datang 1 x 45
• Used for 2G, 3G and 4G
• Licenses granted in ‘95
• 1st tacit extension (‘10-’15):
Belgacom pays €74m (annual
payments).
• 2nd tacit extension (7/4/2015-
15/03/2021): no auction (fee based
on current law – annual or one-off)
• Regulator re-assigned recently the
spectrum reserved forTelenet/Voo
• Allowed to deploy UMTS in 900 MHz
spectrum & 4G in 1800 MHz
900 MHz & 1800 MHz
• Used for 3G
• UMTS licenses granted in
2001
• 20 year-licenses valid until
15/3/2021
• Belgacom paid € 150m (one-
off payment)
• 2 Aug ‘11, BIPT awarded 4th
license to Telenet/Voo for €
71.5m (2X 14.8 MHz)
• In May ‘14 Telenet/Voo
handed back their license
2100 MHz
• Will be used for 4G
• Licenses granted in July ‘12
• 15 year-license valid until
30/6/2027
• Out of 5 candidates, 4 have
obtained spectrum in 2.6 GHz
band
• Belgacom paid € 20.22 Mio
(one-off payment)
• No coverage obligations
2600 MHz
• Used for 4G
• Licenses granted in
November ‘13
• 20 year-license valid until
29/11/2033
• Belgacom pays € 120 Mio in
total (annual instalments)
• Coverage obligations
800 MHz
800 MHz
Proximus 2 x 10
Mobistar 2 x 10
Base 2 x 10

Slide 24
Fit for Growth strategy

Invest
We estimate our annual investment needs to be around €900m* over the coming years to cover network, convergence, new services and content needs
• Build seamless fixed-mobile hand-over • Push TV replay, TV everywhere • Leverage cloud, unified communication and collaboration • Develop ICT as a service and security
To build the foundation of our next wave of growth • Maintain mobile leadership and further deploy 4G • Push legacy copper network to max capabilities (vectoring, DLM) • Gradually introduce FTTH
• Enrich entertainment offer • Introduce new CPE for better in-house experience
Access networks
Convergence services
Brand image
• Push digital (e-sales, e-services) • Renew selling and ordering • Support end-to-end processes • Improve systems stability and (cyber) security
IT and systems
* For 2014 increased to ‘around € 960m’; also including capitalised Belgian football broadcasting rights for the next 3 seasons. 25

Transform
As from 2014, we ambition to keep workforce cost at least flat over the next 5 years, while pursuing additional cost savings building up to another €100m annually by 2018 (HR & non-HR opex)
Simplify to structurally reduce cost
• Products and services portfolio • Network • IT and platforms • E sales and services
Develop superior customer experience
• Product usage experience (TV Everywhere, FON, …) • Touchpoints experience (call centers, technicians, …) • End-to-end process (first time right) • 360°customer communication quality
• Address different segments with differentiated offers (Scarlet) • Push convergence via triple-play, quad-play and ICT services • Reinforce brand investment
• Simpler and leaner organization for faster decision • Reduction of resource costs leveraging pension wall • Right talent at right place • Real performance management
Build efficient organization
Improve brand differentiation
To support the transformation and commercial brand image, we foresee about € 20m
exceptional spending (mainly opex) in 2014.
26

Grow
We ambition to return to top line and EBITDA growth in 2016
Leverage convergence value
Capture new growth
potential
• Pursue data monetization • Leverage entertainment platform • Seize the opportunities of cloud and security • Be selective in development of new innovative services
• Deliver solution-centricity to unlock value in EBU • Exploit upselling potential to quad-play • Leverage seamless network integration and convergent applications
Regain market shares
• Exploit mobile leadership • Improved broadband experience • Roll-out fiber in greenfield and gradually in brownfield to offer the ultimate
broadband experience • Superior customer experience (web, shops of the future, …)
27

Slide 28
Consumer results
Q3 2014

84 82 84 83 85 85 85
65 70 67 80 64 67 67
Q113 Q213 Q313 Q413 Q114 Q214 Q314
Non-HR Personnel
CBU underlying Personnel & Non-HR costs (EUR mio)
139155
128149
131145 143
Q113 Q213 Q313 Q413 Q114 Q214 Q314
CBU underlying Cost of Sales (EUR mio)
548 562544 550
532551 557
Q113 Q213 Q313 Q413 Q114 Q214 Q314
CBU underlying revenue (EUR mio)
Consumer - Underlying* quarterly P&L
Q3’14 HR expenses +0.9% to € 85m: higher headcount to support touchpoint experiences (call centers, home installations, etc…) for Proximus customers, in line with company’s Fit-for-Growth strategy.
Ytd Sept’14, HR-costs +1.7% YoY to € 255 m Q3’14 non-HR expenses of €67 m -0.9%, supported by a continued
focus on cost efficiency. Ytd Sept’14 Non-HR expenses - 2.1% to €198m
Q3’ 14 adjusted segment result -1,2% YoY Revenue increase offset by higher Cost of Goods sold operational expenses for the quarter remained stable yoy estimated negative regulation impact of € -6 m (-2.3%) . segment contribution margin of 47.1%, - 1.6 p.p.YoY Ytd Sept’14 segment result of € 767m, -1.7 % YoY
Q3’14 underlying revenue +2.2% YoY
Strong TV revenue compensating for Fixed Voice revenue erosion
Recovering Mobile service revenue and higher terminal sales.
Regulatory measures impacted Q3 revenue by an estimated amount of € -8 m (-1.4%).
Ytd Sept’14 € 1,639m in underlying revenue, -0.9% YoY
Q3’ 14 Cost of Sales +11.8% YoY from a low comparable basis different timing of tactical handset-subsidies and other promotional
costs. Ytd Sept’14, Cost of Sales remained fairly stable at € 420m, -0.4% YoY
+2.2%
+11.8%
+0.1%
*Adjusted for incidentals
260 255 265238
251 254 262
45.9%43.8%
47.9%
40.9%
46.8% 46.5%47.1%
30.0%
35.0%
40.0%
45.0%
50.0%
180
200
220
240
260
280
300
320
Q113 Q213 Q313 Q413 Q114 Q214 Q314
CBU underlying EBITDA (EUR mio) & margin-1.2%
29

544
557
-41
7 -6
-2
15
underlying Q3'13 Fixed Voice Fixed Internet TV Mobile ServiceRevenue
Subsidiaries Terminals &Others
underlying Q3'14
1,654
1,639-14
6
17
-34
-6
17
underlying Ytd'13 Fixed Voice Fixed Internet TV Mobile ServiceRevenue
Subsidiaries Terminals &Others
underlyingYtd'14
Consumer underlying* revenue variance
Q3’14
Ytd’14
*Adjusted for incidentals, i.e. impact from divested companies
+2.2% adjusted
-0.9% adjusted
30
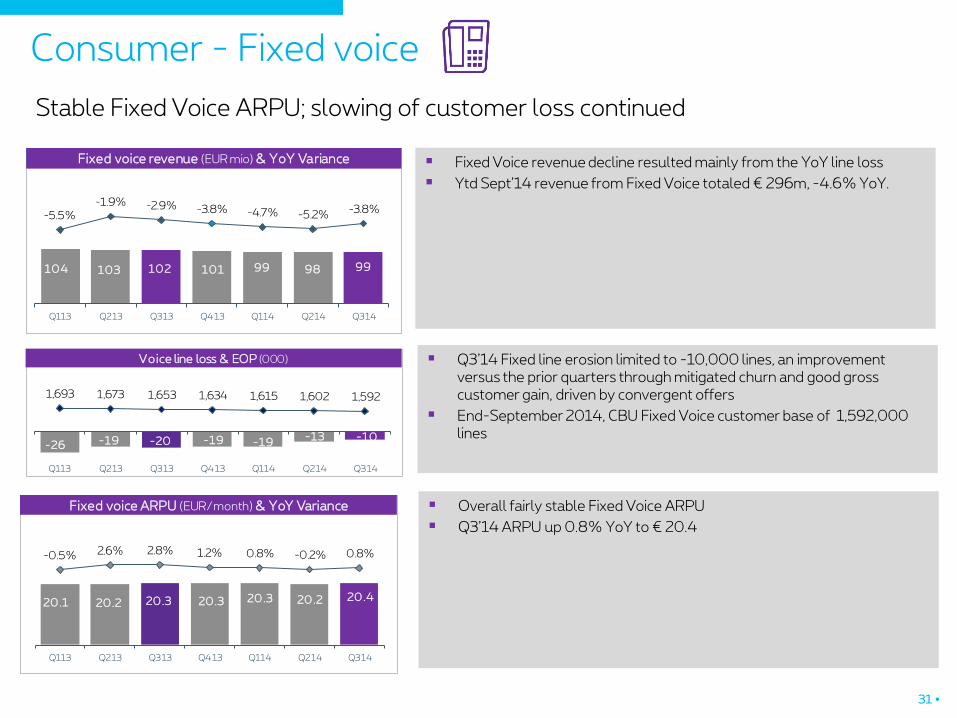
Consumer - Fixed voice Stable Fixed Voice ARPU; slowing of customer loss continued
Q3’14 Fixed line erosion limited to -10,000 lines, an improvement versus the prior quarters through mitigated churn and good gross customer gain, driven by convergent offers
End-September 2014, CBU Fixed Voice customer base of 1,592,000 lines
Overall fairly stable Fixed Voice ARPU
Q3’14 ARPU up 0.8% YoY to € 20.4
Fixed Voice revenue decline resulted mainly from the YoY line loss
Ytd Sept’14 revenue from Fixed Voice totaled € 296m, -4.6% YoY.
104 103 102 101 99 98 99
-5.5%-1.9% -2.9% -3.8% -4.7% -5.2% -3.8%
-25.0%
-20.0%
-15.0%
-10.0%
-5.0%
0.0%
0
20
40
60
80
100
120
140
160
180
Q113 Q213 Q313 Q413 Q114 Q214 Q314
Fixed voice revenue (EUR mio)Fixed voice revenue (EUR mio) & YoY Variance
-26 -19 -20 -19 -19-1 3 -10
1,693 1,673 1,653 1,634 1,615 1,602 1,592
30
530
1,030
1,530
2,030
-30
-10
10
30
50
Q113 Q213 Q313 Q413 Q114 Q214 Q314
Voice line loss & EOP (000)
20.1 20.2 20.3 20.3 20.3 20 .2 20.4
-0.5% 2.6% 2.8% 1.2% 0.8% -0.2% 0.8%
-50.0%
-40.0%
-30.0%
-20.0%
-10.0%
0.0%
10.0%
0.0
Q113 Q213 Q313 Q413 Q114 Q214 Q314
Fixed voice ARPU (EUR/month) & YoY Variance
31

Consumer – Mobile Service Solid further recovery of Mobile service revenue; Postpaid customer base growing
attractive convergent Packs and value-based Joint-Offers kept gross customer gains high in Q3, churn somewhat up on competitive moves
+32,000 Postpaid cards, +11,000 excl Internet-Everywhere data cards.
decline of Mobile Prepaid cards slowed, especially for the Proximus brand: successful summer promotion, strong take-up of Pay&Go Max
Prepaid includes a loss of 10,000 rather promo-sensitive Mobisud cards
Blended mobile ARPU stabilized in Q3’14
further fading of customer re-pricing and better tiering of customers through increased smartphone penetration and value-driving Joint-Offers
Q3 Postpaid ARPU of € 26.9, -1.3% YoY ; i.e. strong improvement from the +/- 5% decline in the prior quarters
Q3 Prepaid ARPU at € 11.7, -6.9% YoY , which is an improvement over the prior quarters as well.
Q3’14 revenue from Mobile services at € 187m, - 2.9% YoY
In spite of the additional roaming price cut on 1 July 2014, the revenue decline improved notably vs. H1. on growing mobile postpaid customer base and ARPU trend improvement
**As of 2014, Belgacom calculates the Mobile ARPU excluding Free Mobile data cards and excluding M2M. 2013 figures have been restated.
***As of 2014, the calculation of active customers is based on the monthly activity rate instead of a rolling
***
**
*
197 205 193 190 183 1 90 1 87
-12.8% -14.0% -15.1% -13.7%
-7.0% -7.0%
-2.9%
-30.0%
-25.0%
-20.0%
-15.0%
-10.0%
-5.0%
65
115
165
215
265
315
Q113 Q213 Q313 Q413 Q114 Q214 Q314
Mobile Service revenue (EUR mio)Mobil e Service revenue (EUR mio) & YoY Variance
2293
38 53 58 48 32
-99 -71 -58 -48 -67 -45 -39
3,566 3,588 3,568 3,573 3,564 3,566 3,559
0
500
1,000
1,500
2,000
2,500
3,000
3,500
4,000
4,500
5,000
-100
-50
0
50
100
150
200
Q113 Q213 Q313 Q413 Q114 Q214 Q314
prepaid postpaid
Mobil e growth & EOP (000)
19.5 20.6 19.7 19.4 19.0 19.9 19.7
-5.1% -5.1%-9.2% -8.1%
-3.0% -3.3%0.4%
-50.0%
-40.0%
-30.0%
-20.0%
-10.0%
0.0%
0.0
Q113 Q213 Q313 Q413 Q114 Q214 Q314
Blended net mobile ARPU (EUR/month) & YoY Variance
32

Consumer - Fixed Internet Fixed Internet revenue up 1.4%; Proximus and Scarlet adding +13,000 customers in the quarter
Q3’14 Fixed Internet revenue of € 91m, i.e. +1.4% YoY, driven by the growing customer base.
Fixed Internet customer base grew with 13,000 Proximus and Scarlet customers; continuing the improvement versus 2013
Q3’14 supported by the ‘September back-to-school campaign’
Total Fixed Internet customer base of 1,274,000 end-September 2014. .
Q3’14 Broadband ARPU of € 26.3 , slightly down from the same period in 2013 due to increased convergent pack penetration, with more value for the customer.
87 89 90 89 89 91 91
2.4%6.0% 5.9% 4.7% 2.2% 2.3% 1.4%
-40.0%
-35.0%
-30.0%
-25.0%
-20.0%
-15.0%
-10.0%
-5.0%
0.0%
5.0%
10.0%
5
25
45
65
85
105
125
Q113 Q213 Q313 Q413 Q114 Q214 Q314
Fixed Internet revenue (EUR mio)Fixed Internet revenue (EUR mio) & YoY Variance
10 7 9
17 1511 1 3
1,203 1,210 1,219 1,235 1,250 1,261 1,274
10
210
410
610
810
1,010
1,210
1
21
Q113 Q213 Q313 Q413 Q114 Q214 Q314
Broadband growth & EOP (000)Broadband growth & EOP (000)Broadband growth & EOP (000)Broadband growth & EOP (000)
26.3 26.7 26.9 26.4 26.1 26.3 26.3
-2.2% 0.9% 1.7% 1.2% -0.8% -1.3% -2.2%
-50.0%
-40.0%
-30.0%
-20.0%
-10.0%
0.0%
10.0%
0.0
Q113 Q213 Q313 Q413 Q114 Q214 Q314
Broadband ARPU (EUR/month) & YoY Variance
33

Proximus TV
Double digit revenue growth for Proximus TV through larger customer base and uptake of TV-options
Continued good customer growth
solid +33,000 TV subscriptions in Q3’14; incl. +13,000 multiple set-top boxes
CBU ended Sept’14 with a total TV customer base of 1,558,000, of which 294,000 were multiple streams
TV ARPU showed a 5.4% growth YoY to € 19.7 driven by the uptake of TV options.
Q3’14 TV revenue grew by 10.5% to €74m
continued subscriber growth,
and TV-options such as football subscriptions and TV-replay.
Ytd’14 revenue from Proximus TV totaled € 214m i.e. +8.5% YoY
*As of 2014, pending orders are excluded from the total TV customer base. Q4 2013 TV customer figures have been restated accordingly. There is no impact on the 2013 quarterly net adds and the 2013 ARPU’s
64 66 67 69 70 71 74
16.4% 15.8%
9.8% 11.3%8.9% 7.3%
10.5%
-15.0%
-10.0%
-5.0%
0.0%
5.0%
10.0%
15.0%
20.0%
25.0%
15
35
55
75
95
115
135
Q113 Q213 Q313 Q413 Q114 Q214 Q314
TV revenue (EUR mio)TV revenue (EUR mio) & YoY Variance
26 16 19 1730 30 33
1,412 1,428 1,447 1,465 1,495 1,525 1,558
0
200
400
600
800
1,000
1,200
1,400
1,600
-10
10
30
50
70
Q113 Q213 Q313 Q413 Q114 Q214 Q314
TV growth & EOP (000)
18.3 18.6 1 8.7 19.0 19.0 1 9.0 19.7
4.5% 5.7% 3.1% 4.4% 3.9% 2.1% 5.4%
-50.0%
-40.0%
-30.0%
-20.0%
-10.0%
0.0%
10.0%
0.0
Q113 Q213 Q313 Q413 Q114 Q214 Q314
TV ARPU (EUR/month) & YoY Variance
34

Tango Luxembourg Impacted by regulated MTR reduction
Tango Q3’14 revenue of € 30m, i.e. -7.4% YoY; mainly caused by the regulated MTR decrease.
The regulation impact was partly offset by the revenue growth coming from the growing postpaid, triple and quadruple-play customer base. However, the prepaid customer base declined, due to a reduction in life-time of the prepaid offers.
2932 32 33
28 28 30
8. 4%1 5 . 2% 1 4. 2%
9 . 9 %
-3. 5 %
-1 2. 6%-7 . 4%
-40.0%
-30.0%
-20.0%
-10.0%
0.0%
10.0%
20.0%
15
20
25
30
35
40
45
50
55
60
Q113 Q213 Q313 Q413 Q114 Q214 Q314
TV revenue (EUR mio)Tango revenue (EUR mio) & YoY Variance
273 274 278 280 280 283 278
Q113 Q213 Q313 Q413 Q114 Q214 Q314
Tango mobile customers EOP (000)
30 .1 31.1 30 .9 32.427.6 27.3 28.1
6.1% 6.3% 4.7% 5.3%
-8.4%-12.1% -9.0%
-50.0%
-40.0%
-30.0%
-20.0%
-10.0%
0.0%
10.0%
0
Q113 Q213 Q313 Q413 Q114 Q214 Q314
Ble nded mobile net ARPU (EUR/month) & YoY Variance
35

Slide 36
Enterprise results
Q3 2014

89 88 88 85 83 84 82
32 30 31 33 31 32 31
0
20
40
60
80
100
120
140
Q113 Q213 Q313 Q413 Q114 Q214 Q314
Personnel Non-HR
EBU underlying Personnel & Non-HR costs (EUR mio)
114 116112
124119
124
115
100
105
110
115
120
125
130
135
140
Q113 Q213 Q313 Q413 Q114 Q214 Q314
EBU underlying Cost of Sales (EUR mio)
494 495474
493 482 494479
400
420
440
460
480
500
520
540
560
580
600
Q113 Q213 Q313 Q413 Q114 Q214 Q314
EBU revenue (EUR mio)EBU underlying revenue (EUR mio)
Enterprise – Underlying* quarterly P&L
Higher underlying Cost of Sales mainly related to ICT
Ytd’14, EBU’s underlying Cost of Sales were € 358m, +4.6% YoY
Q3’14 underlying segment result totaled € 252m, +3.6% YoY
Strong improvement from previous quarters driven by better Direct Margin, especially for Mobile, and lower HR-expenses.
Underlying contribution margin ended 1.3pp higher at 52.5%.
Ytd’14, EBU’s underlying segment result totaled € 755m, -1.1% YoY
Q3’14 HR expenses on underlying basis -6.8% to € 82m, in general positively impacted by lower headcount, showing benefits from initiatives launched to improve efficiency. Ytd Sept’14 underlying HR expenses of EBU totaled € 249m -6.2% YoY
Q3’14 non-HR expenses of € 31m, stable YoY. Ytd Sept’14, EBU’s underlying non HR-expenses were € 94m, +1.2% YoY
EBU’s underlying revenue turned to growth in Q3’14
Incl. estimated regulation impact of € -10m (-2.2%).
Trend improvement from prior quarters driven by growing revenue from Mobile services and underlying ICT, more than offsetting lower revenue from Fixed Voice and Fixed Data.
Ytd’14, EBU posted €1,456m underlying revenue, -0.5% YoY
+1.2%
*Adjusted for incidentals, mainly effect from Telindus France divesture
+2.4%
-5.0%
259 261 243 251 248 255 252
52.4% 52.7% 51.2% 50.8% 51.5% 51.6% 52.5%
15.0%
20.0%
25.0%
30.0%
35.0%
40.0%
45.0%
50.0%
55.0%
-5
45
95
145
195
245
295
345
395
Q113 Q213 Q313 Q413 Q114 Q214 Q314
EBU underlying EBITDA (EUR mio) & margin+3.6%
37

474
-4
-2
6
6
-1
underlyingQ3'13
Fixed Voice Fixed Data ICT Mobile ServiceRevenue
Terminals &Others
underlyingQ3'14
479
1,464
-11
-5
13
-2
-2
underlyingYtd'13
Fixed Voice Fixed Data ICT Mobile ServiceRevenue
Terminals &Others
underlyingYtd'14
1,456
Enterprise underlying* revenue
Q3’14
Ytd’14
*Adjusted for incidentals, mainly impact from Telindus France divesture
-0.5% underlying
+1.2% underlying
38

Enterprise - Fixed Voice* Continued stable Fixed Voice revenue decline
Q3’14 Fixed Line erosion of -15,000 lines
EBU total Fixed Voice Line customer base of 1,249,000 by end-Sept’14, -4.3% line loss YoY
Somewhat higher Q3’14 Fixed Voice ARPU of EUR 28.6, up 1.4% YoY, a result of the price indexation early 2014.
Q3’14 EBU Fixed Voice revenue of € 110m
Fairly stable decline of 3.2% YoY
Key driver of the revenue decline is continued Fixed Voice line erosion triggered by companies rationalizing on Fixed line connections, only partly compensated for by price indexations
Ytd Sept’14, EBU reported € 336m Fixed Voice revenue, -3.2% YoY
*revenue from Belgacom Meeting Services (BMS) moved from Fixed Voice revenue to ICT, impacting both revenue and ARPU of Fixed Voice .2013 figures have been restated.
117 116 113 113 114 113 110
-4.9%-2.9% -3.3% -4.5% -3.1% -3.2% -3.2%
-25.0%
-20.0%
-15.0%
-10.0%
-5.0%
0.0%
0
20
40
60
80
100
120
140
160
180
Q113 Q213 Q313 Q413 Q114 Q214 Q314
Fixed voice revenue (EUR mio) & YoY Variance
-18 -19-13 -14 -15 -13 -15
1,338 1,318 1,305 1,292 1,277 1,264 1,249
-100
100
300
500
700
900
1,100
1,300
1,500
1,700
1,900
-20
0
20
Q113 Q213 Q313 Q413 Q114 Q214 Q314
Voice line loss & EOP (000)
28.5 28.6 28.2 28.5 29.1 29.1 28.6
-2.7% -0.7% 1.3% 0.3% 2.0% 1.5% 1.4%
-35.0%
-30.0%
-25.0%
-20.0%
-15.0%
-10.0%
-5.0%
0.0%
0.0
Q113 Q213 Q313 Q413 Q114 Q214 Q314
Fixed voice ARPU (EUR/month) & YoY VarianceFixed voice ARPU (EUR/month) & YoY Variance
39

Enterprise - Mobile Service Mobile Service revenue showing 4.1% year-on-year growth on larger mobile customer base, better tiering and slowing ARPU decline
Q3’14 commercially less intensive quarter for Proximus
Nevertheless; 36,000 mobile cards added , of which 16,000 Mobile Voice and paying data cards
low Mobile churn level of 8.8% in Q3’14
EBU ended Sept’14 with a total of 1,760,000 mobile cards, +11.1% YoY
Blended ARPU trend further improving to -3% YoY
fading effect from mobile customer re-pricing
increased consumption of data volumes
improved customer tiering
Q3’14 Mobile service revenue trend again showed a significant improvement
continuously growing mobile customer base,
strong improved customer tiering within the Business customer segment, growing its mid- and high end customer base firmly
sharp uptake in mobile data usage, in part driven by a greater smartphone penetration and a growing number of 4G-users
Higher data roaming volumes more than offsetting lower roaming prices
Ytd Sept’14, EBU generated € 416m revenue from Mobile services, limiting the decline YoY to -0.5%.
*As of 2014, Belgacom calculates the Mobile ARPU excluding Free Mobile data cards and excluding M2M. 2013 figures have been restated.
*As of 2014, the calculation of active customers is based on the monthly activity rate instead of a rolling average activity rate. The definition of an active customer remains unchanged. 2013
figures have been updated accordingly
*
*
142 142 135 137 135 140 141
-12.9% -12.2% -12.2%-8.7%
-4.7%-0.8%
4.1%
-30.0%
-25.0%
-20.0%
-15.0%
-10.0%
-5.0%
0.0%
5.0%
0
50
100
150
200
250
Q113 Q213 Q313 Q413 Q114 Q214 Q314
Mobil e Service revenue (EUR mio) & YoY Variance
2632 39
31
6445 36
1,512 1,545 1,584 1,615 1,679 1,724 1,760
1
201
401
601
801
1,001
1,201
1,401
1,601
1,801
2,001
0
20
40
60
80
Q113 Q213 Q313 Q413 Q114 Q214 Q314
Mobil e growth & EOP (000)
36.8 36.3 34.1 34.2 33.0 33.6 33.1
-14.8% -13.0% -15.6%-12.4% -10.4% -7.4%
-3.0%
-50.0%
-45.0%
-40.0%
-35.0%
-30.0%
-25.0%
-20.0%
-15.0%
-10.0%
-5.0%
0.0
Q113 Q213 Q313 Q413 Q114 Q214 Q314
Bl ended net Mobile ARPU (EUR/month) & YoY Variance
40

Enterprise - Fixed Data Fixed Data revenue impacted by migrations to Explore platform, Fixed Internet revenue stable
Q3’14 revenue was -1.6% YoY to € 93m
Fixed Data, revenue consists of Fixed Internet and data connectivity
continued migration from older technologies such as leased lines to the Belgacom Explore platform, for which pricing is more favorable for customers.
Fixed Internet revenue remained stable YoY
Ytd Sept’14, EBU recorded € 280m revenue in Fixed Data, -1.9% YoY
EBU ended Sept’14 with 443,000 Fixed Internet customers, or +0.5% YoY
ARPU flattish YoY at EUR 39.5.
SME customers opting more and more for advantageous converged Packs including internet.
*As of 1 January 2014, revenue from PABX is included in ICT. The 2013 figures have been restated accordingly. Previously PABX revenue was reported as part of Fixed Terminals.
96 96 94 95 94 94 93
-3.4% -3.4% -1.9% -0.5% -1.7% -2.2% -1.6%
-25.0%
-20.0%
-15.0%
-10.0%
-5.0%
0.0%
5.0%
10.0%
0
20
40
60
80
100
120
140
160
180
Q113 Q213 Q313 Q413 Q114 Q214 Q314
Fixed Data revenue (EUR mio) & YoY Variance
1
-2 -1 0
1 1
0
444 442 441 441 442 443 443
30
80
130
180
230
280
330
380
430
-10
11
Q113 Q213 Q313 Q413 Q114 Q214 Q314
Broadband growth & EOP (000)
39.0 39.3 39.5 39.2 39.3 39.7 39.5
-1.2% 0.9% 1.2% 1.1% 0.8% 0.9% -0.2%
-35.0%
-30.0%
-25.0%
-20.0%
-15.0%
-10.0%
-5.0%
0.0%
0.0
Q113 Q213 Q313 Q413 Q114 Q214 Q314
Broadband ARPU (EUR/month) & YoY Variance
41

Enterprise – underlying ICT* Underlying ICT revenue growth of 5.2%
EBU posted € 125 m underlying ICT revenue. This
resulted from a solid revenue from the Belux ICT activities.
Ytd Sept’14 organic ICT revenue totaled € 389m, +3.5% YoY
*adjusted for the divesture impact of Telindus France
On divesture of Telindus France:
On 30 April 2014, Belgacom disposed 100% of the shares in the Group Telindus France to Vivendi for EUR 86 million net of cash disposed of and recognized a gain on disposal of EUR 43 million (through non-recurring income). The Group Telindus France generated pro-forma revenues of € 241m and EBITDA of € 11m in 2013.
128 129 119134 128 136 125
0.3% 5.1% 5.2%
-90%
-70%
-50%
-30%
-10%
10%
0
20
40
60
80
100
120
140
160
180
Q113 Q213 Q313 Q413 Q114 Q214 Q314
underlying ICT revenue (EUR mio) & YoY Variance
42

-37 -37 -38 -36 -36 -35 -38
-60
-50
-40
-30
-20
-10
0
Q113 Q213 Q313 Q413 Q114 Q214 Q314
SDE&W Adjusted EBITDA (EUR mio)
45 42 45 42 42 42 44
50 52 50 49 49 44 45
0
20
40
60
80
100
120
140
Q113 Q213 Q313 Q413 Q114 Q214 Q314
Personnel Non-HR
SDE&W underlying Personnel & Non-HR costs (EUR mio)
109 9 10 9 9 9
0
2
4
6
8
10
Q113 Q213 Q313 Q413 Q114 Q214 Q314
SDE&W Cost of Sales (EUR mio)SDE&W Cost of Sales (EUR mio)
68 66 66 65 64 60 60
33
43
53
63
73
83
93
Q113 Q213 Q313 Q413 Q114 Q214 Q314
SDE&W revenue (EUR mio)
Service Delivery & Wholesale – P&L
CoS Q3’14 -3.3%
focus on lowering both HR and non-HR-related operating expenses., in line with company’s strategy to optimize the overall workforce cost
Q3’14 HR expenses of € 44m -1.1% YoY on lower headcount
non-HR expenses decreased to €45m, including the benefits from lower external workforce costs and maintenance cost optimization.
The revenue erosion in Q3’14 was fully offset by lower expenses, leading to a stable segment result of € -38m.
Ytd Sept’14, the segment result totaled € -109m, or a 2.4% improvement YoY
9.6% YoY revenue decline to € 60m, in line with the previous quarter
eroding Carrier Wholesale Services revenue due to continued decline in wholesale broadband lines, leased lines and traffic volumes.
negative impact from lowered Wholesale roaming tariffs, only partly compensated for by the roaming volume growth
-9.6%
-3.3%%
* 2013 figures have been restated to reflect the allocation of Belgacom wholesale revenues invoiced to Scarlet to the Consumer Business Unit segment.
-3.3%
-6.3%
0.0%
43

50 50 50 50 49 50 52
0
10
20
30
40
50
60
70
80
90
Q113 Q213 Q313 Q413 Q114 Q214 Q314
S&S adjusted Non-HR costs (EUR mio)
40 38 40 4037 37 37
22
27
32
37
42
47
Q113 Q213 Q313 Q413 Q114 Q214 Q314
S&S adjusted Personnel costs (EUR mio)
77 7
5
7 8 7
0
1
2
3
4
5
6
7
8
9
Q113 Q213 Q313 Q413 Q114 Q214 Q314
S&S Adjusted Revenue(EUR mio)
Staff & Support – P&L
For Q3’14, Staff and Support recorded revenue of € 7m.
Ytd’14 revenue of € 22 million, on an underlying basis (i.e. excluding proceeds from building sales)
Q3’14 HR expenses were 6.4% lower YoY mainly as result of a lower personnel base.
For the same reason, the Ytd’14 HR expenses of € 111 million were -5.5% YoY
Q3’14 non-HR expenses totaled € 52m.
Ytd’14 € 151m non HR-expenses, fairly stable YoY
-5.8%
-6.4%
+4.3%
44

417 413 437 401357
415 410
0
50
100
150
200
250
300
350
400
450
500
Q113 Q213 Q313 Q413 Q114 Q214 Q314
BICS underlying Revenue (EUR mio)
BICS – Underlying quarterly P&L
lower Voice traffic showing effect from the lost temporary traffic to Asia whch BICS captured in 2013. In Q3’14 BICS handled 6,981m minutes, -4.2% YoY
Non-Voice volumes +16.6% YoY
lower Gross margin was more than offset by a favorable evolution in operating expenses, leading to a € 39m segment result, +2.6% YoY.
EBITDA margin rose to 9.4%, from 8.6% for the year before
non-Voice gross margin up 23% in Q3’14, in part offsetting the pressure on the Voice gross margin.
overall, BICS’ gross margin erosion was limited to -3.3% or € -2m YoY
BICS Q3’14 revenue totaled € 410m, -6.1% or € 27m YoY
lower Voice revenue, down 8.7% on lower Voice traffic,
not fully offset by continued growth in non-voice revenue, up by 11% in Q3’14
Ytd’14 BICS generated € 1,182m revenue, -6.7% YoY
-6.1%
34 38 37 32 28 31 28
28 27 30 28 30 31 37
0
20
40
60
80
100
Q113 Q213 Q313 Q413 Q114 Q214 Q314
Non-Voice Voice
BICS Gross margin (EUR mio)
-3.3%
3537
3831 30 35 39
8.3% 8.9% 8.6% 7.7% 8.3% 8.3% 9.4%
-10.0%
-5.0%
0.0%
5.0%
10.0%
15.0%
20.0%
0
10
20
30
40
50
60
Q113 Q213 Q313 Q413 Q114 Q214 Q314
BICS EBITDA (EUR mio) & marginBICS underlying EBITDA (EUR mio) & margin
+2.6%
7,5567,267
6,701
7,2876,872
6,243
7,2596,981
445451
461
540512
499
583629
5,200
5,700
6,200
6,700
7,200
7,700
8,200
Q412 Q113 Q213 Q313 Q413 Q114 Q214 Q314
SMS/MMS Minutes
BICS Volumes (in mio)
45

Slide 46
Other information

Group – quarterly P&L – as reported
VARQ3/Q3
Total Revenues 1,586 1,583 1,568 4,736 1,582 6 ,318 1,480 1,631 1,486 4,597 -5 .2% -2.9%
Total OPEX -1,144 -1,153 -1,139 -3,436 -1,184 -4,619 -1,069 -1,074 -1,053 -3,196 -7.5% -7.0%
Costs of materials and charges to revenues -637 -645 -636 -1,918 -643 -2,561 -575 -620 -592 -1,787 -6.9% -6.8%
Personnel expenses and pensions -290 -283 -288 -860 -282 -1,142 -278 -255 -263 -797 -8.5% -7.3%
Other operating expenses -218 -225 -216 -659 -244 -903 -215 -202 -202 -618 -6.4% -6.2%
Non recurring expenses 0 0 1 1 -15 -14 -1 2 4 5 254.6% 383.0%
EBITDA 441 430 430 1,301 398 1,699 411 556 433 1,400 0.7% 7.7%
EBITDA margin 27.8% 27.2% 27.4% 27.5% 25.2% 26.9% 27.8% 34.1% 29.1% 30.5%
Depreciation -192 -200 -197 -589 -193 -782 -196 -207 -207 -610 5.0% 3.5%
EBIT 250 230 232 712 206 9 17 215 350 226 790 -2.9% 11.1%
Financial result -20 -24 -27 -72 -24 -96 -23 -20 -28 -71 4.8% -0.5%
Tax expense -53 -44 -44 -141 -29 -170 -40 -66 -34 -139 -21.7% -1.1%
Share of loss on associates 0 0 0 0 0 0 0 -1 -1 -1
Net income (Group) 171 155 156 482 148 630 149 25 1 156 556 0.2% 15 .3%
Non-controlling interest 5 6 6 17 4 22 4 12 7 23 9.4% 31.9%
Earnings/share in € 0.54 0.49 0.49 1.5 1 0.46 1.98 0.47 0.78 0.49 1.74 -0.3% 14.9%
Q413 Year Q114 Q214in mio € Q113 Q213
YTD-
SepQ313
YTD-
Sep VAR YTDQ314
47

From reported to underlying – incidentals
ytd13 ytd14 ytd13 ytd14
Incidental El ements -206 -189 -7 -125
Non-recurr ing items: 0 -62 -1 -67
Gain/l osses f rom disposal s 0 -62 0 -59
Other -1 -8
Other adjustments: -206 -127 -6 -57
Impact f rom disposed companies -192 -82 -5 1
-15 -7 1 0
-177 -75 -6 0
Capital izat ion customer instal l at ions 17 0
Transf ormat ion & Rebranding 0 8
-11 -45 -11 -45
HR-items of t ransient nature 0 -8
Lit igat ion prov isions & reversal s -3 0 -8 -13
Revenue EBITDAIncidental Elements Split
Capital gains on bu il ding sal es thin the f ramework of the Network Simpl if icat ion project .
- e.g. the non-recurring revenue of EUR 63 million recognized in the second quarter 2014 includes the gain on the disposal of Group Telindus France (EUR 43 million) and of the mobile remittance activities (EUR 20 million)
- e.g. a positive non-recurring expense of EUR 2 million was recorded in the second quarter of 2014 mainly resulting from a partial settlement of a post-employment benefit plan.
- EBU: Divesture of Telindus France in May 2014: no longer contributing to the EBU revenue
- CBU: Scarlet Netherlands (March 2014) and Sahara Net (May 2014), no longer contributing to the CBU revenue.
- Accounting alignment within the company for capitalization of network installation activities for customer connections as from of 1 January 2014. This lowers the HR and non-HR expenses (about EUR 20 mio on annual basis for the Belgacom Group).
- About € 20m exceptional spending (mainly opex) on full-year 2014 on transformation & commercial brand image, spending mainly in H2.
GROUP - Revenue incidentals GROUP - EBITDA incidentals
(EUR million) Q313 Q314 ytd13 ytd14 (EUR million) Q313 Q314 ytd13 ytd14
Reported 1,568 1,486 4,736 4,597 Reported 430 433 1,301 1,400
Underlying 1,502 1,487 4,531 4,408 Underlying 425 431 1,294 1,276
Incidentals - Total -67 1 -206 -189 Incidentals - Total -4 -1 -7 -125
Non Recurring Items 0 1 0 -62 Non Recurring Items -1 -3 -1 -67
Other incidentals -67 0 -206 -127 Other incidentals -3 2 -6 -57
48

Belgacom consolidated balance sheet
All balance sheet captions impacted by disposal of Group Telindus France:
Decrease of goodwill by € 26m
Intangible fixed assets & property, plant & equipment decreased € 23m
Shareholders’ equity increased from € 2,846m end 2013 to € 2,914m end September 2014. This mainly results from the net income generated over the first nine months exceeding the 2013 dividend payment in April 2014 of € 537m.
As of 30 September
(EUR mil l ion) 2013 2014
ASSETS
NON-CURRENT ASSETS 6,254 6,212
Goodwill 2,320 2,294
Intangible assets with finite useful life (*) 1,185 1,121
Property, plant and equipment 2,558 2,600
Investments in associates 6 4
Other participating interests 6 12
Deferred income tax assets 105 81
Other non-current assets 74 100
CURRENT ASSETS 2,163 2,434
Inventories 163 138
Trade receivables 1,289 1,250
Current tax assets 137 94
Other current assets 148 170
Investments 60 9
Cash and cash equivalents 355 773
Assets classified as held for sale 11 0
TOTAL ASSETS 8,417 8,646
LIABILITIES AND EQUITY
EQUITY 3,042 3,100
Sharehol ders' equity 2 ,846 2,914
Issued capital 1,000 1,000
Treasury shares -527 -482
Restricted reserve 100 100
Remeasurement reserve -51 -44
Stock compensation 13 9
Retained earnings 2,310 2,331
Foreign currency translation 1 0
Non-control l ing interests 196 185
NON-CURRENT LIABILITIES 2,865 3,362
Interest-bearing liabilities 1,950 2,548
Liability for pensions, other post-employment benefits and termination benefits 473 411
Provisions 204 180
Deferred income tax liabilities 128 114
Other non-current payables 111 109
CURRENT LIABILITIES 2,511 2,184
Interest-bearing liabilities 316 2
Trade payables 1,320 1,290
Tax payables 132 158
Other current payables 731 734
Liabilities associated with assets classified as held for sale 13 0
TOTAL LIABILITIES AND EQUITY 8,417 8,646
As of 31 D ecember
49

Pricing – Fixed products
Slide 50
€ 30.67 / month
Free to FIX Anytime
24/24
No Limit National Anytime
€ 20.99 / month
Free to FIX & to MOB during OffPeak & Weekend
Peak: 8-17h
Happy Time XL
€ 46.20 / month
Volume incl: Unlimited
Upload speed: 5 Mbps
3G: 250 MB
Cloud: 10 GB
+ unlimited hotspot access
Internet Maxi
€ 36.95 / month
Volume incl: 150 GB Upload speed: 4 Mbps
3G: 100 MB
Cloud: 10 GB
+ hotspot access
Internet Comfort
€ 25.50 / month
Volume incl: 100 GB
Upload speed: 3 Mbps
3G: 50 MB
Cloud: 10 GB
+ hotspot access
Internet Start
€ 21.5 / month
>70 channels
TV (only as option on Fixed connection)
€ 20.99 / month
Note: Lower tariffs during peak compared to Happy Time
Peak: 8-19h
Classic
€ 21.99 / month
Free to FIX ,to MOB & to most European countries
during OffPeak & Weekend
Peak: 8-17h
Happy time international
Fixed telephony (classic line)
Internet
Television
• Internet Start+TV: € 43.95 • Tel+TV: € 35.75
• No price differentiation on “download speed”
• Customers get highest available download speed
• The average speed a Proximus Internet customer receives is currently at 40 Mbps, and rising . This is dedicated speed at videograde quality.
• The actual received speed is higher for homes connected through Dynamic Line management (50 Mbps) or Vectoring (70 Mbps)
• Speeds can be lower due to factors as the distance between the connection point and the telephone exchange, the computer system and the internal cabling.

Pricing – TV options
Slide 51
€ 14.95 / month
Unlimited access to an extensive range of movies in a specific on-demand catalog and to the "ms" channel
which offers varied programming. Every day a new film or episode of a series on the "ms" channel, at the same time available in the on-demand catalog of this Pass.
Movies & Series Pass
€ 3 / month
I can go back up to 36 hours in my TV guide.
€ 7/ month
I can go back up to 36 hours in my TV guide and fast forward in the program I have chosen.
TV Replay
€ 9.95 / month
Belgian football:
All the matches of the Jupiler Pro League
Belgacom 11
€ 9.95 / month
European football: - UEFA Champions League
- English League Cup - Spanish League
- Copa del Rey - Portuguese League
Belgacom 11+
€ 14.95 / month
The best of Belgian and European football:
Belgacom 11 +
Belgacom 11+
All Foot
€ 4.95 / month
Thanks to TV Overall, your smartphone, tablet or laptop becomes an additional TV screen! You won’t miss any of
your favourite programs anymore since your TV can now follow you anywhere. You can enjoy TV
Everywhere at home and anywhere else. At home via your Belgacom Wi-Fi connection. Everywhere else via a
Wi-Fi Fon Spot or the Proximus 3G/4G network.
TV Everywhere
Note: TV Overall is free
for customers having a comfort or
maxi Pack

Slide 52
Consumer Mobile Postpaid subscriptions On Oct 1st, Smart 25 and Smart 35 offers reviewed, increasing the competitiveness of Proximus mid-end offers, especially in Pack
€ 25 € 20 in PACK
240 min Unlt SMS
€ 0.25 / min € 0.25 / MMS € 0.85 / MB
Easy+ 25
€ 15 € 13 in PACK
150 min
Unlt SMS
€ 0.25 / min € 0.25 / MMS € 0.85 / MB
Easy+ 15
voice & sms only (non-Smartphone
users)
€ 35 € 30 in PACK
300min &
Unlt Px-2-Px Unlt SMS
2 GB € 0.25 / min
€ 0.25 / MMS € 0.10 / MB
Smart+ 35
€ 25 € 20 in PACK
300 min Unlt SMS
2 GB
€ 0.25 / min € 0.25 / MMS € 0.10 / MB
Smart 25
€ 15 € 13 in PACK
120 min
Unlt SMS 500MB
€ 0.25 / min
€ 0.25 / MMS € 0.10 / MB
Smart+ 15
€ 50
€ 40 in PACK
Unlt voice Unlt SMS
3 GB
Unlimited / min € 0.25 / MMS € 0.10 / MB
Smart+ 50
€ 10
20 min Unlt SMS
€ 0.25 / min € 0.25 / MMS € 0.85 / MB
Easy+ 10
Voice, sms & data (Smartphone users)
€ 45 € 35 in PACK
Unlt min Unlt SMS
€ 0.25 / MMS € 0.85 / MB
Easy+ 45
€ 65
€ 55 in PACK
Unlt voice Unlt SMS (incl EU)
5 GB
Unlimited / min € 0.25 / MMS € 0.10 / MB
Smart+ 65
ideal for social media and surf ideal for video
SUPER FAST VERY FAST
4G 4G
Up to 25 Mbps Up to 129 Mbps i.e. maximum possible speed
Speed Tiering
Reviewed 1 Oct’14

Pricing – Mobile Voice (Prepaid)
Slide 53
Reload bonus For each reload, with Pay&Go Easy you get :
• Bonus 1 (towards fix and Mobile): € 10 reload= 30min, € 15 reload= 60min, € 25 reload= 90min, € 50 reload= 200 min
OR Bonus 2 (towards fix): € 10 reload=150 min, € 15 reload=600 min, € 25 reload=unlimited min, € 50 reload=unlimited
€ 0.50 / min Peak € 0.25 / min OffPeak
€ 0.12 / SMS Peak € 0.08 / SMS OffPeak
€ 0.25 / MMS € 0.5/MB
Pay & Go Smart
€ 0.27/ min € 0.12 / SMS
€ 0.25 / MMS € 0.5 /MB
Pay & Go Easy Focus on calls
Focus on Calls &
SMS
Reload bonus For each reload, with Pay&Go Smart you get:
• Bonus € 10 Reload: unltd. SMS OffPeak + 10 MB Peak: 7 – 16h • Bonus € 15 Reload: unltd. SMS + 150 MB • Bonus € 25 Reload: unltd. SMS + 500 MB
Pay & Go Max
€ 0.30 / min € 0.12 / SMS
€ 0.25 / MMS € 0.5/MB
Reload bundles For Pay&Go Max reload you get:
• € 15 Reload: 90 min + unltd. SMS + 250 MB • € 25 Reload: 150 min + unltd. SMS + 500 MB • € 50 Reload: 360 min + unltd. SMS + 2 GB
For each reload, you get a bundle and no more credit The bundle has a validity of 31 days Out of bundle usage is possible with additional reloads
Focus on Calls, SMS
& Data

Pricing – Mobile Data
€ 34.99 / month
4 GB incl.
€0.03 / MB
Favorite
€ 19.99 / month
2 GB incl.
€0.03 / MB
Comfort
€ 4.99 / month
+ € 1 /day of surf
1 GB incl.
€0.03 / MB
Daily Pay & Surf for iPad
€ 24.99 / month
3 GB incl. (if you use more – usage
is free but at a lower speed)
Favorite for iPad
Laptop & Tablet Only iPad Only
€ 10 500 MB € 15 750 MB
€ 25 1250 MB € 50 2500 MB
Pay & Surf
€ 5 reduction if you are already
a Proximus fixed internet customer
Prepaid Only Prepaid Only
Reload € 10 > in 31d: +50% data volume
Slide 54
€ 4.99 50 MB € 9.99 500 MB
€ 0.5 / MB (prepaid ) Or
€ 0.85 / MB (postpaid)
GSM Only
General Prepaid Only
Pay & Surf Standard
included
€ 10 500 MB € 15 750 MB
€ 25 1250 MB € 50 2500 MB
Reload € 10 > in 31d: +50% data volume

Pricing converged Belgacom PACKS - successful combinations
Slide 55
€ 53.95 / month
TV TV Everywhere
+ Internet Comfort
+Unlimited volume +Unlimited hotspot
access +500 MB + 1 GB (Tv Everywhere) 3G/4G
10 GB cloud
TV + Internet
€ 53.95 / month
Fixed Voice (incl.
Happy Time XL and Happy Time International)
+ Internet Comfort
+Unlimited volume +Unlimited hotspot
access +500 MB 3G/4G
10 GB cloud
Fix+ Internet
€ 35.75 / month
TV +
Fixed Voice (incl. Happy Time XL)
TV + Fix
€ 62.95 / month
TV
TV Everywhere +
Fixed Voice (incl. Happy Time XL and
Happy Time International)
+ Internet Comfort
+Unlimited volume +Unlimited hotspot
access +500 MB + 1 GB (Tv Everywhere) 3G/4G
10 GB cloud
TV & Fix + Internet
€ 66.95 / month
TV TV Everywhere
+ Mobile
Smart+/Easy+ 15 +
Internet Comfort +Unlimited volume +Unlimited hotspot
access +500 MB + 1 GB (Tv Everywhere) 3G/4G
10 GB cloud
TV & Mobile & Internet
€ 75.95 / month
TV TV Everywhere
+ Fixed voice (incl.
Happy Time XL and Happy Time International)
+ Mobile
Smart+/Easy+ 15 +
Internet Comfort +Unlimited volume +Unlimited hotspot
access +500 MB + 1 GB (Tv Everywhere) 3G/4G
10 GB cloud
TV & Fix & Mobile & Internet
€ 2 to €10 /month discount for each Proximus subscription (as of € 15 /month) added to your Pack
(maximum of 6 Proximus subscriptions per pack)
2-Play 3-Play 4-Play

Slide 56
Positioning Scarlet as no frills brand,
with very attractive pricing for ‘price
seekers’
€ 39 / month TV:
~30 channels +
Fixed Voice line: Free calls to fix Off Peak
+ Internet:
Unlimited volume Down 30 Mbps
Up 3 Mbps
TV + Fix + Internet

Regulation- 1
Outlook
Regulation impacts
(Decrease in EUR million)
Revenue ~ € 14m € 3m € 4m € 4m
EBITDA ~ € 7m € 1m € 2m € 2m
Revenue ~ € 36m € 5m € 7m € 14m
EBITDA ~ € 36m € 5m € 7m € 14m
Revenue ~ € 50m € 8m € 11m € 18m
EBITDA ~ € 43m € 7m € 9m € 17m
Estimated impact
Q3 2014Q2 2014Q1 2014FY 2014
MTR
Roaming
(i.e. Voice, SMS and Data)
Total
Estimated negative financial impact from regulatory price decreases
MTR -regulation
• Luxembourg - Regulator implements symmetrical MTR at 0.98 €cts, down from 8.2 €cts
On 16 January 2014, the Luxembourg regulator, ILR, published its final decision concerning its review of the MTR market analysis. The three mobile operators (EPT, Tango and Orange) are submitted a.o to an obligation of cost orientation for their MTR. ILR intends to define the MTR on basis of a pure bottom-up long run incremental cost (LRIC) cost model. Until the finalisation of this model, ILR sets symmetrical MTR at 0.98 €ct/min (based on a benchmarking) as from 1 February 2014. MTR were previously at 8.2 €ct for EPT and Tango and 10.5 eurocents for Orange. Tango has appealed the decision.
The estimated impact on TANGO (reported in CBU) for 2014 is: € -14 m revenue, € -7m EBITDA
7.2
4.623.83
2.62
9.02
11.43
1.08
Before* 01-Aug-10* 01-Jan-11 01-Jan-12 01-Jan-13
MTR-Glidepath in €ct
Proximus Mobistar Base
• Belgium - the last MTR-cut was applied on 1 January 2013
*excl VAT, including inflation
BIPT is developing a new cost model to set MTR for period ‘14-’17
57

• Roaming III Regulation entered into force on 1 July 2012.
• This regulation covers a ten-year period until 30 June 2022.
• It imposed a further lowering of the existing regulated price caps, and extended the roaming regulation to retail data as from July 2012. It also imposed transparency measure to avoid bill shocks and has extended the transparency measures to roaming outside EU since July 2012.
• Roaming III Regulation also foresees structural measures − Wholesale roaming access (1 July 2012) − Decoupling, i.e. separate selling of roaming services from
domestic mobile services(1 July 2014)
• In its package of measures to address the fragmentation of the EU telecoms sector, referred now to as “Connected Continent”, the EU Commission has proposed to impose additional measures to abolish roaming in the coming years. On 3 April 2014, the European Parliament voted on its first reading on the EC proposal and proposed to ban such charges as from 15 December 2015. The reform has now to be discussed with the EU Council. Timing is unclear for the moment. Adoption of the package possible in the first half of 2015.
• Estimated impact on Q3 2014 financials: − Revenue: ~ € -14m − EBITDA: ~ € -14m
• Estimated impact on FY 14 financials: − Revenue: ~ € -36m − EBITDA: ~ € -36m
Regulation- 2 Mobile voice and data-roaming: EU Roaming III Regulation regulation
58

Source: National Bank, 28/07/2014 1 GDP – percentage change on preceding year 2 Number of unemployed as a percentage of total labour force 3 Index of consumer prices – percentage change on preceding year
Macro economic environment
• Belgium decreases to 0,2, Europe to 0,3.
• Decrease caused by lower energy prices.
0%
2%
4%
6%
8%
10%
12%
14%
JA
N
AP
R
JU
L
OC
T
JA
N
AP
R
JU
L
OC
T
JA
N
AP
R
JU
L
OC
T
JA
N
AP
R
JU
L
OC
T
JA
N
AP
R
JU
L
OC
T
JA
N
AP
R
JU
L
OC
T
JA
N
AP
R
JU
L
OC
T
JA
N
AP
R
JU
L
OC
T
JA
N
AP
R
JU
L
OC
T
2007 2008 2009 2010 2011 2012 2013 2014 2015
Unemployment rate
Belgium Euro area
• Unemployment rate stabilised at 8.5% in Belgium in August.
-1,5%
-1,0%
-0,5%
0,0%
0,5%
1,0%
1,5%
2,0%
2,5%
2011 2012 1Q 2013 2Q 2013 3Q 2013 4Q 2013 1Q 2014 2Q 2014 3Q 2014 FC 2014 FC 2015
GDP Growth actuals and forecast
Belgium Euro Area
forecast
• After growth of the GDP during 4 consecutive quarters, the GDP slowed down again in 2Q14. The reason is the temporary drop in the building sector.
59

Cautionary Statement
“This communication might include some forward-looking statements, without limitation, regarding Belgacom’s financial or operational results, certain strategic plans or objectives, macro-economic trends, regulation, future market conditions and other risk factors. These forward-looking statements rely on a number of assumptions concerning future events and are subject to uncertainties and other factors, many of which are outside Belgacom’s control. Therefore the actual future results may differ materially from those expressed in or implied by the statements. Readers are cautioned not to put undue reliance on forward-looking statements, which speak only of the date of this communication. Belgacom disclaims any intention or obligation to update and revise any forward-looking statements, whether as a result of new information, future events or otherwise.“
60