PowerPoint Presentation€¦ · PPT file · Web view · 2014-02-24... Handling Difficult People...
18
Local Government Learning and Development Network Learning Solutions Report 10 February 2014
Transcript of PowerPoint Presentation€¦ · PPT file · Web view · 2014-02-24... Handling Difficult People...

Local Government Learning and Development Network
Learning Solutions Report
10 February 2014

L&D Network 2
ProgramLGNSW MEETING• Welcome and Introductions• Upcoming LGNSW events• ASTD Global Report• Relational Selling• Lunch
GTAN MEETING• Funding arrangements – DEC• GSA Report• GTAN Skills sets• VET research reports and professional development

L&D Network 3
Trends• Writing skills (grant writing and report writing)• Handling Difficult People and Verbal Judo• Strategic Planning• Finance for Non Finance Managers

L&D Network 4
Upcoming Conferences Seminars• Employment Law Seminar – 16 May 2014
• PA/EA Conference - 20 June 2014 (dinner on 19 June)
Both events are in Sydney

L&D Network 5
February WorkshopsWHS Risk Management•Friday 14 February – Sydney•Friday 28 February – NewcastleCustomer Care Professionalism•Thursday 20 February – Port MacquarieEnglish Grammar and Punctuation•Tuesday 25 February – BallinaWriting Winning Grant Applications•Tuesday 25 February – Dubbo
Presented on the 15 February 2013
2013 State of the IndustryGLOBAL REPORT
6
American Society of Training and Development
L&D Network 7
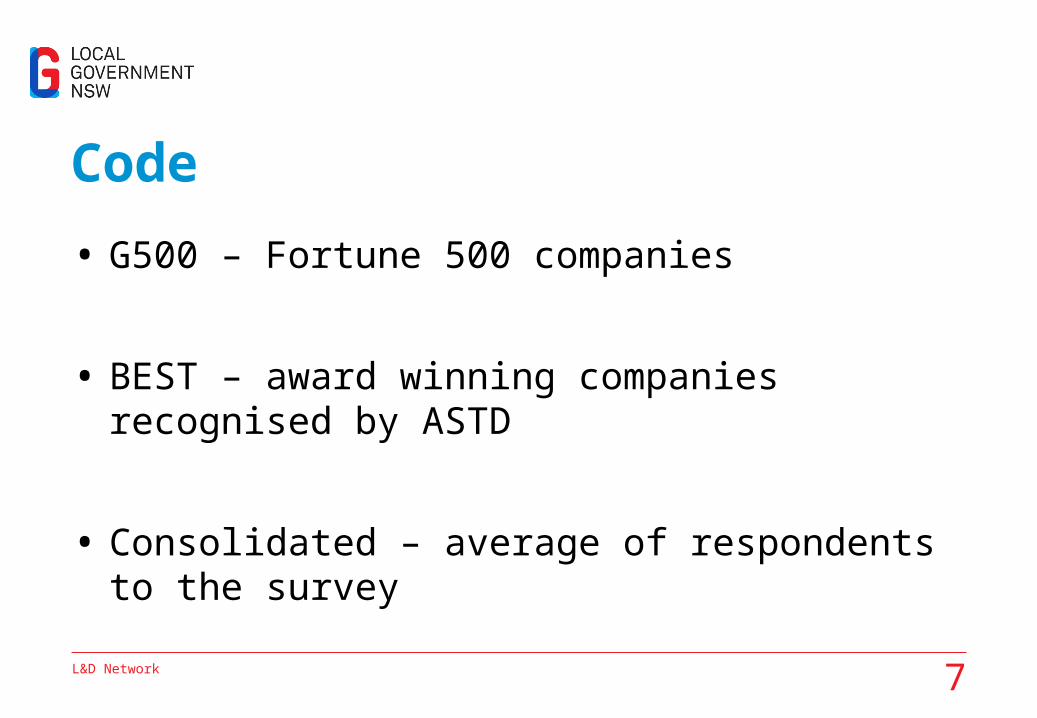
Code• G500 – Fortune 500 companies
• BEST – award winning companies recognised by ASTD
• Consolidated – average of respondents to the survey

AVERAGE DIRECT EXPENDITURE PER EMPLOYEE (U.S$1,195)
Note: Consolidated data for 2005 are not available due to transition to WLP Scorecard

LEARNING HOURS USED PER EMPLOYEE = 30.3 hours
Note: Consolidated data for 2005 are not available due to transition to WLP Scorecard

Note: Consolidated data for 2005 are not available due to transition to WLP Scorecard
DIRECT EXPENDITURE AS A PERCENTAGE OF PAYROLL (3.6%)

11
EXPENDITURE DISTRIBUTION
(CONSOLIDATED)
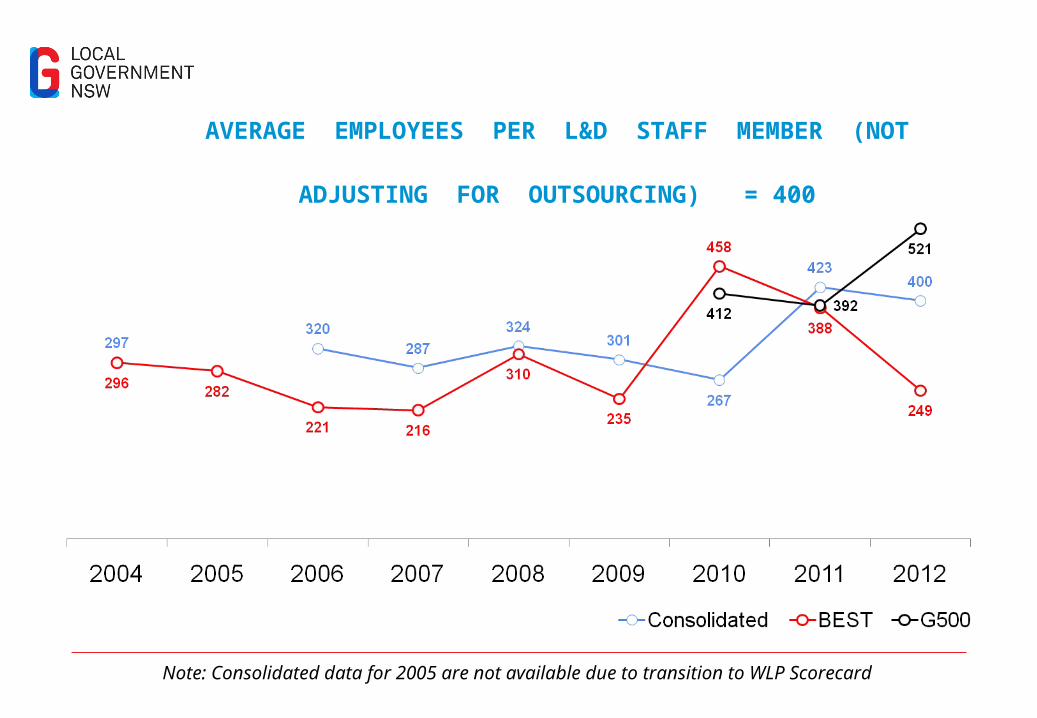
AVERAGE EMPLOYEES PER L&D STAFF MEMBER (NOT ADJUSTING FOR
OUTSOURCING) = 400
Note: Consolidated data for 2005 are not available due to transition to WLP Scorecard
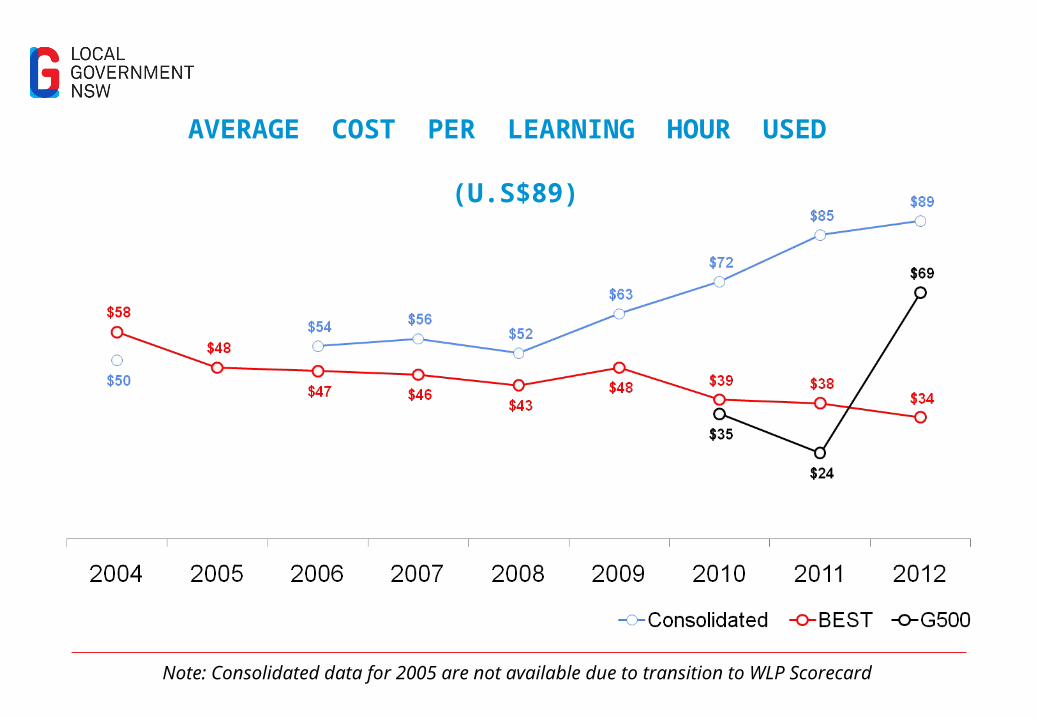
AVERAGE COST PER LEARNING HOUR USED (U.S$89)
Note: Consolidated data for 2005 are not available due to transition to WLP Scorecard

AVERAGE PERCENTAGE OF LEARNING CONTENT BY
CONTENT AREA

INSTRUCTOR-LED DELIVERY METHODS
(AVAILABLE)
Inst
ruct
or-le
d cl
assr
oom
Inst
ruct
or-le
d on
line
Inst
ruct
or-le
d re
mot
e (s
atel
lite,
vid
eo, e
tc.)
All
Inst
ruct
or-le
d

16
ConclusionThe data presented in this State of the Industry report can be used by organisations to help them benchmark their training programs and make educated decisions for their training offerings.
When using these data ASTD makes the following suggestions:•Keep in mind the data reported here are averages and reporting organisations change from year to year.•Don’t aim to replicate the numbers presented. Instead, observe the trends over time and use the information as a benchmark to compare your own data and trends.•Use the data reported by industry size when available. When possible, look to the tables to review data by organisation size, which will more closely mirror your organisation.
In 2012 we saw organisations continue to invest in their employees despite a challenging economic environment. Organisations faced with an increasing number of employees managed to maintain training and development opportunities delivered in a variety of methods and on numerous topics.

17
US Training Salaries• Customer Service Trainer = $47,000-$62,000• Training Manager = $40,000 - $110,000 (Median
$66k)• Training Centre Manager = $68,000 - $110,000• Technical Trainer = $40,000 - $86,000
AUSTRALIATraining coordinator $46,000 - $87,000 (median
$60K)


![080220 Powerpoint Plain[1]](https://static.fdocuments.in/doc/165x107/559a7d0a1a28aba2648b46f3/080220-powerpoint-plain1.jpg)

![[ PowerPoint Template ]](https://static.fdocuments.in/doc/165x107/56814853550346895db565d2/-powerpoint-template--5697ba40150e6.jpg)