Powering Africa: Meeting the financing and reform challenges
10
Powering Africa: Meeting the financing and reform challenges $ Anton Eberhard a,n , Maria Shkaratan b a Graduate School of Business, University of Cape Town, South Africa b World Bank, USA article info Article history: Received 11 June 2011 Accepted 17 October 2011 Available online 14 January 2012 Keywords: Africa Electricity Finance abstract Sub-Saharan Africa faces chronic power problems, including insufficient generation capacity, low connectivity, poor reliability, and high costs, all of which constrain development. The investment requirements to meet Africa’s power needs are noted and strategies to address the funding gap are set out. The time for an ideological debate on public versus private investment is over—both are needed. Africa’s key challenges are the management of hybrid power markets, the reform of state-owned utilities, cost-reflective pricing, better targeting of subsidies, the nimbler rollout of electrification, and stronger regional integration. & 2011 Elsevier Ltd. All rights reserved. 1. Africa underpowered Sub-Saharan Africa is in the midst of a power crisis character- ized by inadequate, unreliable, and costly electricity infrastruc- ture. Household connections to the power grid are lower than in any other region. The weakness of the power sector has con- strained economic growth and development in the region. The combined power generation capacity of the 48 countries of Sub-Saharan Africa is about 80 gigawatts (GW); a single country—Spain—has more. The installed capacity per capita in Sub-Saharan Africa (excluding South Africa) is a little more than a third of South Asia’s (the two regions were equal in 1980) and about a tenth of that of Latin America (Fig. 1). Capacity growth has been largely stagnant during the last three decades, with growth rates of barely half those found in other developing regions. This has widened the gap between Sub-Saharan Africa and the rest of the developing world, even compared to other country groups in the same income bracket (Yepes et al., 2008). Less than three in every ten people living in Sub-Saharan Africa have access to electricity, compared to more than half in South Asia and 90 percent in East Asia. Progress in extending new connections has also been slow. On current trends, fewer than 45 percent of African countries will achieve universal access to electricity by 2050 (Banerjee et al., 2008). Per capita consumption of electricity averages just 40 kWh per month in the region, and only 10 kWh if South Africa is excluded (Eberhard et al., 2011, p. 6). By contrast, the average per capita consumption is 100 kWh per month in the developing world and close to 1000 kWh per month in high-income countries. If South Africa is excluded, Sub-Saharan Africa is the only world region in which per capita consumption of electricity is falling. Not only is total electricity generation and consumption in Africa very small, it is also unequally distributed between countries. South Africa’s power infrastructure stands in stark contrast to that of the region as a whole. With a population of 47 million people, South Africa has a total generating capacity of about 40 GW (850 W per person), accounting for about 60 percent of the region’s electricity consumption. Nigeria, with a population of 140 million, is the region’s second largest generator, with an effective utility operat- ing capacity of about 4 GW (28 W per person). Comparative data for other African countries is given in Fig. 2. Power supply in Sub-Saharan Africa is notoriously unreliable. About 15 percent of installed capacity is not operational, mainly as a result of ageing plant and lack of maintenance (Eberhard et al., 2011, p. 189). Power outages are frequent (Fig. 3). For these reasons, own generation constitutes a significant proportion of total installed power capacity in the region. In the Democratic Republic of Congo, Equatorial Guinea, and Mauritania, backup generators account for half of total installed capacity, and for West Africa as a whole, 17 percent (Fig. 4). The increasing use of grid-connected temporary emergency power in the region reflects the gravity of the power crisis. Countries experiencing pressing power shortages can enter into short-term leases with specialized operators who install new capacity typically in shipping containers within a few weeks. Contents lists available at SciVerse ScienceDirect journal homepage: www.elsevier.com/locate/enpol Energy Policy 0301-4215/$ - see front matter & 2011 Elsevier Ltd. All rights reserved. doi:10.1016/j.enpol.2011.10.033 $ This paper is based on data collection and analysis in 24 countries included in the African Infrastructure Country Diagnostic (AICD) study managed by the World Bank (under the leadership of Vivien Foster) on behalf of the Investment Consortium for Africa and the African Development Bank. The authors of this paper were the lead authors of a book published at the conclusion of this study: Africa’s Power Infrastructure: Investment, Integration, Efficiency, World Bank, Washington, DC, 2011. n Corresponding author. Tel.: þ27 21 4061362; fax: þ27 21 4061070. E-mail addresses: [email protected] (A. Eberhard), [email protected] (M. Shkaratan). Energy Policy 42 (2012) 9–18
-
Upload
anton-eberhard -
Category
Documents
-
view
212 -
download
0
Transcript of Powering Africa: Meeting the financing and reform challenges
Energy Policy 42 (2012) 9–18
Contents lists available at SciVerse ScienceDirect
Energy Policy
0301-42
doi:10.1
$This
the Afri
Bank (u
Consort
paper w
Africa’s
Washinn Corr
E-m
Mshkar
journal homepage: www.elsevier.com/locate/enpol
Powering Africa: Meeting the financing and reform challenges$
Anton Eberhard a,n, Maria Shkaratan b
a Graduate School of Business, University of Cape Town, South Africab World Bank, USA
a r t i c l e i n f o
Article history:
Received 11 June 2011
Accepted 17 October 2011Available online 14 January 2012
Keywords:
Africa
Electricity
Finance
15/$ - see front matter & 2011 Elsevier Ltd. A
016/j.enpol.2011.10.033
paper is based on data collection and analys
can Infrastructure Country Diagnostic (AICD)
nder the leadership of Vivien Foster) on
ium for Africa and the African Developmen
ere the lead authors of a book published at
Power Infrastructure: Investment, Integrat
gton, DC, 2011.
esponding author. Tel.: þ27 21 4061362; fax
ail addresses: [email protected] (A. Eber
[email protected] (M. Shkaratan).
a b s t r a c t
Sub-Saharan Africa faces chronic power problems, including insufficient generation capacity, low
connectivity, poor reliability, and high costs, all of which constrain development. The investment
requirements to meet Africa’s power needs are noted and strategies to address the funding gap are set
out. The time for an ideological debate on public versus private investment is over—both are needed.
Africa’s key challenges are the management of hybrid power markets, the reform of state-owned
utilities, cost-reflective pricing, better targeting of subsidies, the nimbler rollout of electrification, and
stronger regional integration.
& 2011 Elsevier Ltd. All rights reserved.
1. Africa underpowered
Sub-Saharan Africa is in the midst of a power crisis character-ized by inadequate, unreliable, and costly electricity infrastruc-ture. Household connections to the power grid are lower than inany other region. The weakness of the power sector has con-strained economic growth and development in the region.
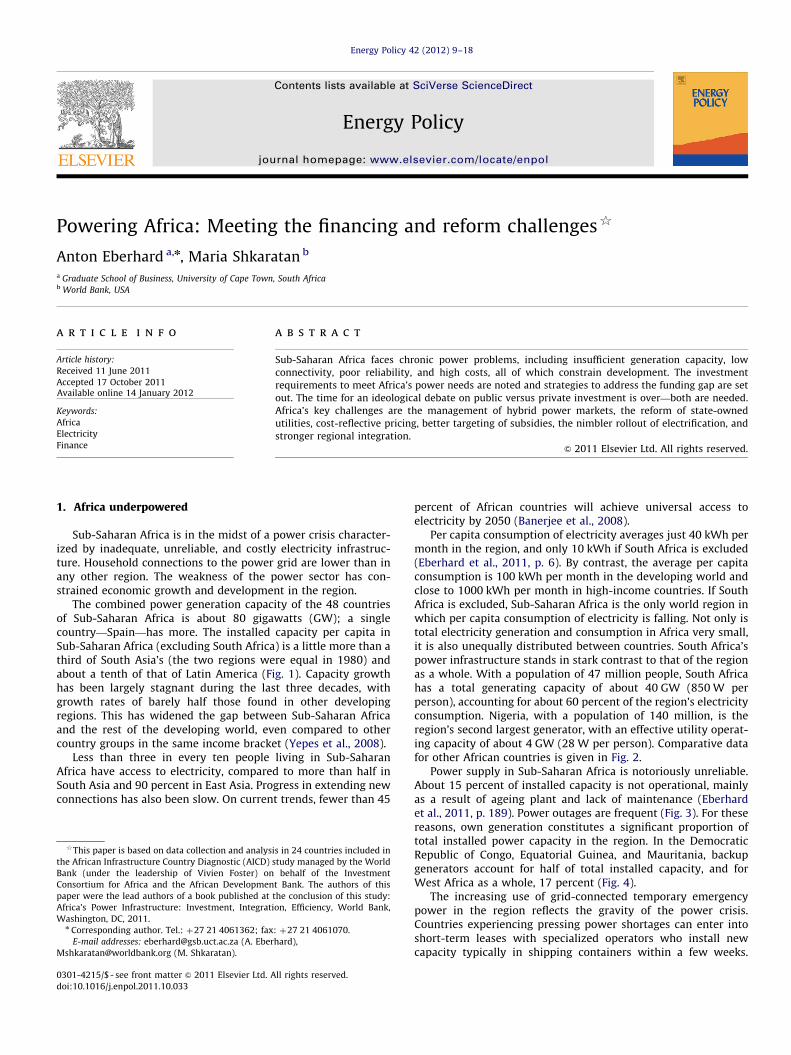
The combined power generation capacity of the 48 countriesof Sub-Saharan Africa is about 80 gigawatts (GW); a singlecountry—Spain—has more. The installed capacity per capita inSub-Saharan Africa (excluding South Africa) is a little more than athird of South Asia’s (the two regions were equal in 1980) andabout a tenth of that of Latin America (Fig. 1). Capacity growthhas been largely stagnant during the last three decades, withgrowth rates of barely half those found in other developingregions. This has widened the gap between Sub-Saharan Africaand the rest of the developing world, even compared to othercountry groups in the same income bracket (Yepes et al., 2008).
Less than three in every ten people living in Sub-SaharanAfrica have access to electricity, compared to more than half inSouth Asia and 90 percent in East Asia. Progress in extending newconnections has also been slow. On current trends, fewer than 45
ll rights reserved.
is in 24 countries included in
study managed by the World
behalf of the Investment
t Bank. The authors of this
the conclusion of this study:
ion, Efficiency, World Bank,
: þ27 21 4061070.
hard),
percent of African countries will achieve universal access toelectricity by 2050 (Banerjee et al., 2008).
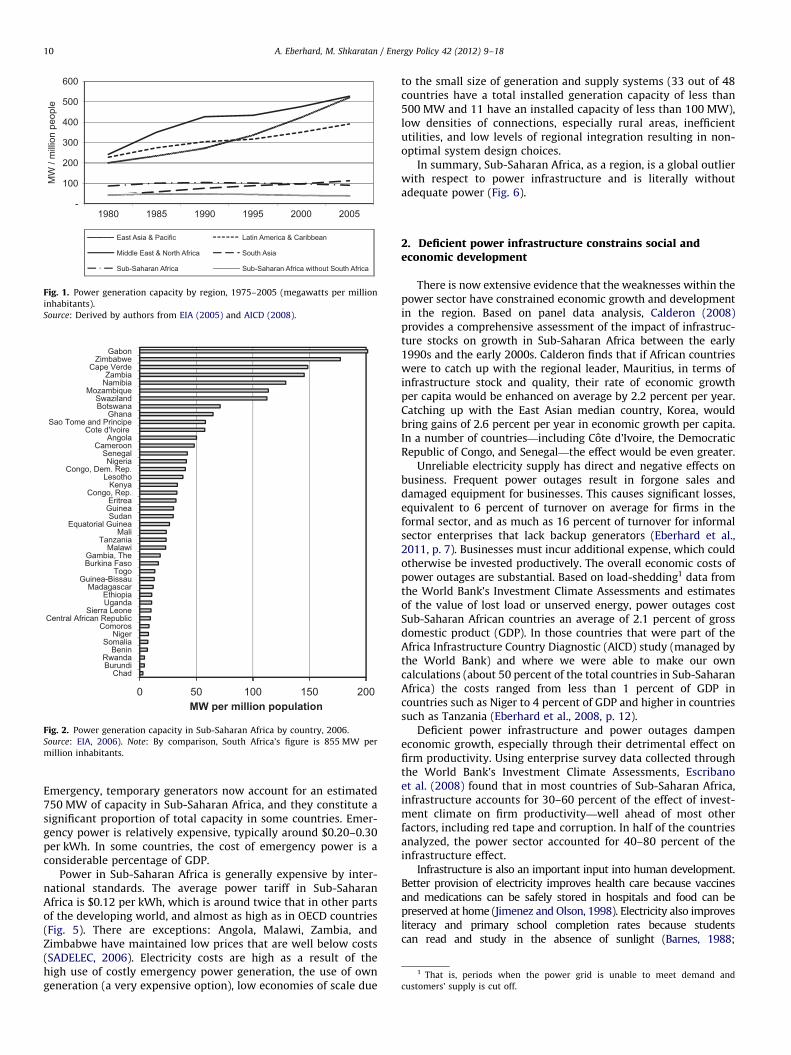
Per capita consumption of electricity averages just 40 kWh permonth in the region, and only 10 kWh if South Africa is excluded(Eberhard et al., 2011, p. 6). By contrast, the average per capitaconsumption is 100 kWh per month in the developing world andclose to 1000 kWh per month in high-income countries. If SouthAfrica is excluded, Sub-Saharan Africa is the only world region inwhich per capita consumption of electricity is falling. Not only istotal electricity generation and consumption in Africa very small,it is also unequally distributed between countries. South Africa’spower infrastructure stands in stark contrast to that of the regionas a whole. With a population of 47 million people, South Africahas a total generating capacity of about 40 GW (850 W perperson), accounting for about 60 percent of the region’s electricityconsumption. Nigeria, with a population of 140 million, is theregion’s second largest generator, with an effective utility operat-ing capacity of about 4 GW (28 W per person). Comparative datafor other African countries is given in Fig. 2.
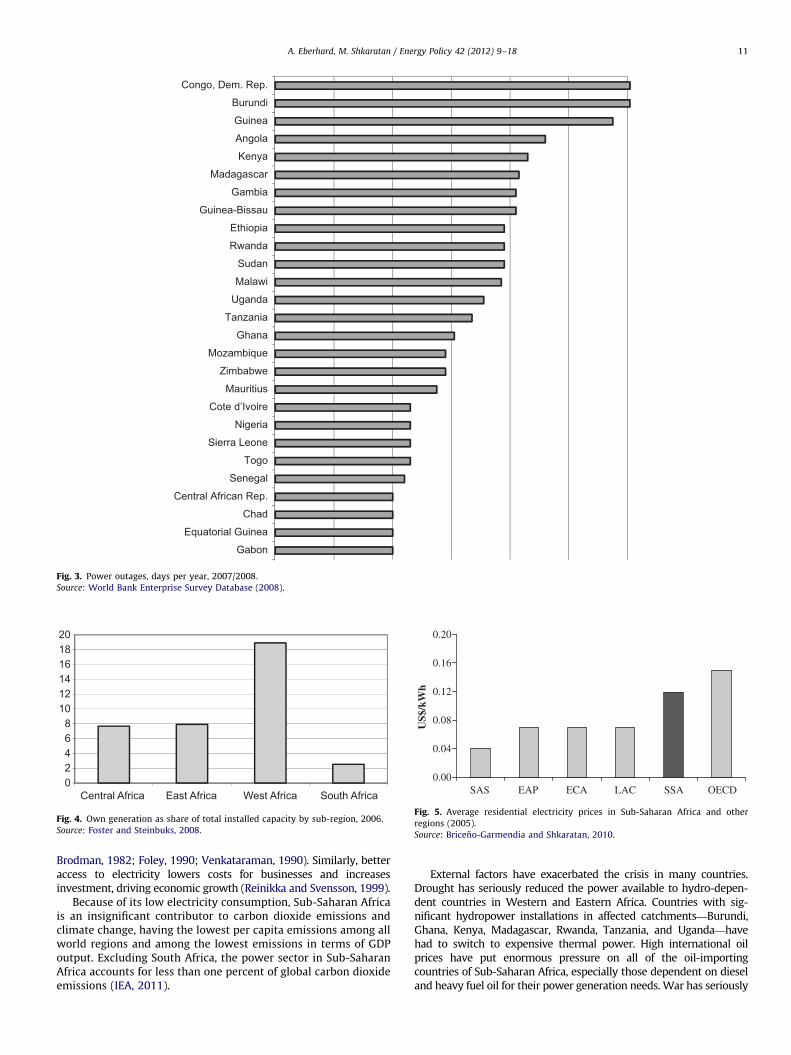
Power supply in Sub-Saharan Africa is notoriously unreliable.About 15 percent of installed capacity is not operational, mainlyas a result of ageing plant and lack of maintenance (Eberhardet al., 2011, p. 189). Power outages are frequent (Fig. 3). For thesereasons, own generation constitutes a significant proportion oftotal installed power capacity in the region. In the DemocraticRepublic of Congo, Equatorial Guinea, and Mauritania, backupgenerators account for half of total installed capacity, and forWest Africa as a whole, 17 percent (Fig. 4).
The increasing use of grid-connected temporary emergencypower in the region reflects the gravity of the power crisis.Countries experiencing pressing power shortages can enter intoshort-term leases with specialized operators who install newcapacity typically in shipping containers within a few weeks.
-
100
200
300
400
500
600
1980
MW
/ m
illio
n pe
ople
1985 1990 1995 2000 2005
East Asia & Pacific Latin America & Caribbean
Middle East & North Africa South Asia
Sub-Saharan Africa Sub-Saharan Africa without South Africa
Fig. 1. Power generation capacity by region, 1975–2005 (megawatts per million
inhabitants).
Source: Derived by authors from EIA (2005) and AICD (2008).
0 50 100 150 200
ChadBurundiRwanda
BeninSomalia
NigerComoros
Central African RepublicSierra Leone
UgandaEthiopia
MadagascarGuinea-Bissau
TogoBurkina FasoGambia, The
MalawiTanzania
MaliEquatorial Guinea
SudanGuineaEritrea
Congo, Rep.Kenya
LesothoCongo, Dem. Rep.
NigeriaSenegal
CameroonAngola
Cote d'Ivoire Sao Tome and Principe
GhanaBotswanaSwaziland
MozambiqueNamibiaZambia
Cape VerdeZimbabwe
Gabon
MW per million population
Fig. 2. Power generation capacity in Sub-Saharan Africa by country, 2006.
Source: EIA, 2006). Note: By comparison, South Africa’s figure is 855 MW per
million inhabitants.
1 That is, periods when the power grid is unable to meet demand and
customers’ supply is cut off.
A. Eberhard, M. Shkaratan / Energy Policy 42 (2012) 9–1810
Emergency, temporary generators now account for an estimated750 MW of capacity in Sub-Saharan Africa, and they constitute asignificant proportion of total capacity in some countries. Emer-gency power is relatively expensive, typically around $0.20–0.30per kWh. In some countries, the cost of emergency power is aconsiderable percentage of GDP.
Power in Sub-Saharan Africa is generally expensive by inter-national standards. The average power tariff in Sub-SaharanAfrica is $0.12 per kWh, which is around twice that in other partsof the developing world, and almost as high as in OECD countries(Fig. 5). There are exceptions: Angola, Malawi, Zambia, andZimbabwe have maintained low prices that are well below costs(SADELEC, 2006). Electricity costs are high as a result of thehigh use of costly emergency power generation, the use of owngeneration (a very expensive option), low economies of scale due
to the small size of generation and supply systems (33 out of 48countries have a total installed generation capacity of less than500 MW and 11 have an installed capacity of less than 100 MW),low densities of connections, especially rural areas, inefficientutilities, and low levels of regional integration resulting in non-optimal system design choices.
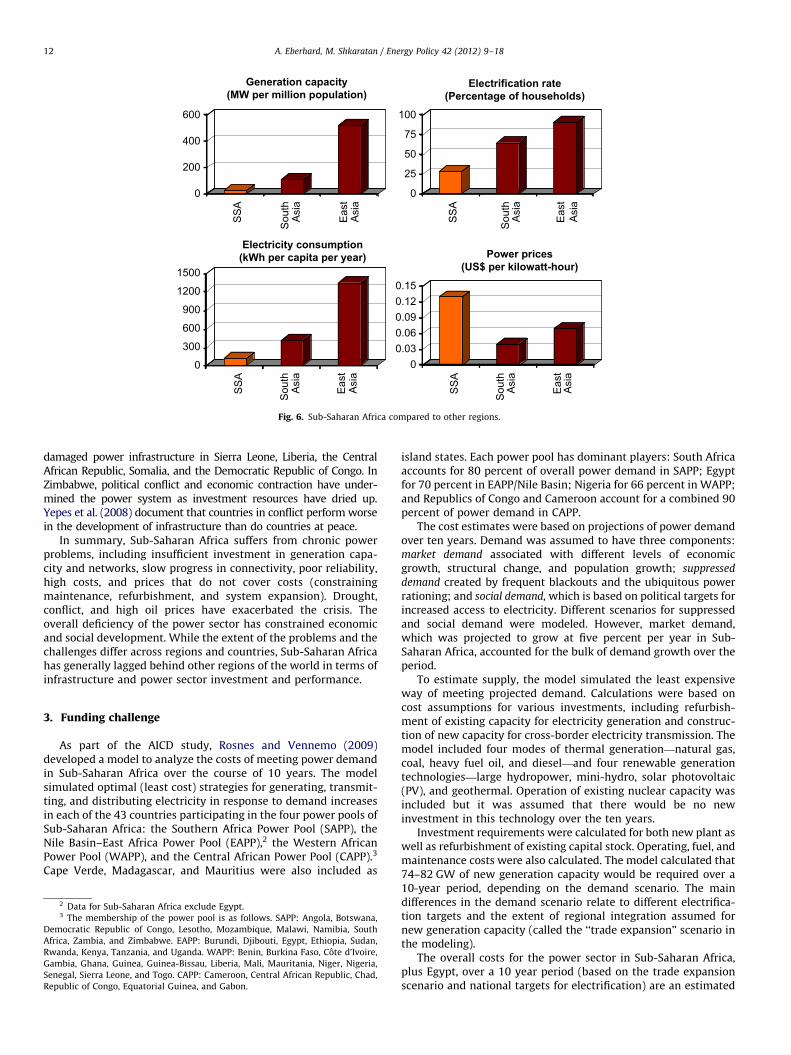
In summary, Sub-Saharan Africa, as a region, is a global outlierwith respect to power infrastructure and is literally withoutadequate power (Fig. 6).
2. Deficient power infrastructure constrains social andeconomic development
There is now extensive evidence that the weaknesses within thepower sector have constrained economic growth and developmentin the region. Based on panel data analysis, Calderon (2008)provides a comprehensive assessment of the impact of infrastruc-ture stocks on growth in Sub-Saharan Africa between the early1990s and the early 2000s. Calderon finds that if African countrieswere to catch up with the regional leader, Mauritius, in terms ofinfrastructure stock and quality, their rate of economic growthper capita would be enhanced on average by 2.2 percent per year.Catching up with the East Asian median country, Korea, wouldbring gains of 2.6 percent per year in economic growth per capita.In a number of countries—including Cote d’Ivoire, the DemocraticRepublic of Congo, and Senegal—the effect would be even greater.
Unreliable electricity supply has direct and negative effects onbusiness. Frequent power outages result in forgone sales anddamaged equipment for businesses. This causes significant losses,equivalent to 6 percent of turnover on average for firms in theformal sector, and as much as 16 percent of turnover for informalsector enterprises that lack backup generators (Eberhard et al.,2011, p. 7). Businesses must incur additional expense, which couldotherwise be invested productively. The overall economic costs ofpower outages are substantial. Based on load-shedding1 data fromthe World Bank’s Investment Climate Assessments and estimatesof the value of lost load or unserved energy, power outages costSub-Saharan African countries an average of 2.1 percent of grossdomestic product (GDP). In those countries that were part of theAfrica Infrastructure Country Diagnostic (AICD) study (managed bythe World Bank) and where we were able to make our owncalculations (about 50 percent of the total countries in Sub-SaharanAfrica) the costs ranged from less than 1 percent of GDP incountries such as Niger to 4 percent of GDP and higher in countriessuch as Tanzania (Eberhard et al., 2008, p. 12).
Deficient power infrastructure and power outages dampeneconomic growth, especially through their detrimental effect onfirm productivity. Using enterprise survey data collected throughthe World Bank’s Investment Climate Assessments, Escribanoet al. (2008) found that in most countries of Sub-Saharan Africa,infrastructure accounts for 30–60 percent of the effect of invest-ment climate on firm productivity—well ahead of most otherfactors, including red tape and corruption. In half of the countriesanalyzed, the power sector accounted for 40–80 percent of theinfrastructure effect.
Infrastructure is also an important input into human development.Better provision of electricity improves health care because vaccinesand medications can be safely stored in hospitals and food can bepreserved at home (Jimenez and Olson, 1998). Electricity also improvesliteracy and primary school completion rates because studentscan read and study in the absence of sunlight (Barnes, 1988;
Gabon
Equatorial Guinea
Chad
Central African Rep.
Senegal
Togo
Sierra Leone
Nigeria
Cote d’Ivoire
Mauritius
Zimbabwe
Mozambique
Ghana
Tanzania
Uganda
Malawi
Sudan
Rwanda
Ethiopia
Guinea-Bissau
Gambia
Madagascar
Kenya
Angola
Guinea
Burundi
Congo, Dem. Rep.
Fig. 3. Power outages, days per year, 2007/2008.
Source: World Bank Enterprise Survey Database (2008).
02468
101214161820
Central Africa East Africa West Africa South Africa
Fig. 4. Own generation as share of total installed capacity by sub-region, 2006.
Source: Foster and Steinbuks, 2008.
0.00
0.04
0.08
0.12
0.16
0.20
SAS
US$
/kWh
EAP ECA LAC SSA OECD
Fig. 5. Average residential electricity prices in Sub-Saharan Africa and other
regions (2005).
Source: Briceno-Garmendia and Shkaratan, 2010.
A. Eberhard, M. Shkaratan / Energy Policy 42 (2012) 9–18 11
Brodman, 1982; Foley, 1990; Venkataraman, 1990). Similarly, betteraccess to electricity lowers costs for businesses and increasesinvestment, driving economic growth (Reinikka and Svensson, 1999).
Because of its low electricity consumption, Sub-Saharan Africais an insignificant contributor to carbon dioxide emissions andclimate change, having the lowest per capita emissions among allworld regions and among the lowest emissions in terms of GDPoutput. Excluding South Africa, the power sector in Sub-SaharanAfrica accounts for less than one percent of global carbon dioxideemissions (IEA, 2011).
External factors have exacerbated the crisis in many countries.Drought has seriously reduced the power available to hydro-depen-dent countries in Western and Eastern Africa. Countries with sig-nificant hydropower installations in affected catchments—Burundi,Ghana, Kenya, Madagascar, Rwanda, Tanzania, and Uganda—havehad to switch to expensive thermal power. High international oilprices have put enormous pressure on all of the oil-importingcountries of Sub-Saharan Africa, especially those dependent on dieseland heavy fuel oil for their power generation needs. War has seriously
0
200
400
600
SS
A
Sou
thA
sia
Eas
tA
sia
0
25
50
75
100
SS
A
Sou
thA
sia
Eas
tA
sia
0
300
600
900
1200
1500
SS
A
Sou
thA
sia
Eas
tA
sia
00.030.060.090.120.15
SS
A
Sou
thA
sia
Eas
tA
sia
Generation capacity(MW per million population)
Electrification rate(Percentage of households)
Electricity consumption(kWh per capita per year) Power prices
(US$ per kilowatt-hour)
Fig. 6. Sub-Saharan Africa compared to other regions.
A. Eberhard, M. Shkaratan / Energy Policy 42 (2012) 9–1812
damaged power infrastructure in Sierra Leone, Liberia, the CentralAfrican Republic, Somalia, and the Democratic Republic of Congo. InZimbabwe, political conflict and economic contraction have under-mined the power system as investment resources have dried up.Yepes et al. (2008) document that countries in conflict perform worsein the development of infrastructure than do countries at peace.
In summary, Sub-Saharan Africa suffers from chronic powerproblems, including insufficient investment in generation capa-city and networks, slow progress in connectivity, poor reliability,high costs, and prices that do not cover costs (constrainingmaintenance, refurbishment, and system expansion). Drought,conflict, and high oil prices have exacerbated the crisis. Theoverall deficiency of the power sector has constrained economicand social development. While the extent of the problems and thechallenges differ across regions and countries, Sub-Saharan Africahas generally lagged behind other regions of the world in terms ofinfrastructure and power sector investment and performance.
3. Funding challenge
As part of the AICD study, Rosnes and Vennemo (2009)developed a model to analyze the costs of meeting power demandin Sub-Saharan Africa over the course of 10 years. The modelsimulated optimal (least cost) strategies for generating, transmit-ting, and distributing electricity in response to demand increasesin each of the 43 countries participating in the four power pools ofSub-Saharan Africa: the Southern Africa Power Pool (SAPP), theNile Basin–East Africa Power Pool (EAPP),2 the Western AfricanPower Pool (WAPP), and the Central African Power Pool (CAPP).3
Cape Verde, Madagascar, and Mauritius were also included as
2 Data for Sub-Saharan Africa exclude Egypt.3 The membership of the power pool is as follows. SAPP: Angola, Botswana,
Democratic Republic of Congo, Lesotho, Mozambique, Malawi, Namibia, South
Africa, Zambia, and Zimbabwe. EAPP: Burundi, Djibouti, Egypt, Ethiopia, Sudan,
Rwanda, Kenya, Tanzania, and Uganda. WAPP: Benin, Burkina Faso, Cote d’Ivoire,
Gambia, Ghana, Guinea, Guinea-Bissau, Liberia, Mali, Mauritania, Niger, Nigeria,
Senegal, Sierra Leone, and Togo. CAPP: Cameroon, Central African Republic, Chad,
Republic of Congo, Equatorial Guinea, and Gabon.
island states. Each power pool has dominant players: South Africaaccounts for 80 percent of overall power demand in SAPP; Egyptfor 70 percent in EAPP/Nile Basin; Nigeria for 66 percent in WAPP;and Republics of Congo and Cameroon account for a combined 90percent of power demand in CAPP.
The cost estimates were based on projections of power demandover ten years. Demand was assumed to have three components:market demand associated with different levels of economicgrowth, structural change, and population growth; suppressed
demand created by frequent blackouts and the ubiquitous powerrationing; and social demand, which is based on political targets forincreased access to electricity. Different scenarios for suppressedand social demand were modeled. However, market demand,which was projected to grow at five percent per year in Sub-Saharan Africa, accounted for the bulk of demand growth over theperiod.
To estimate supply, the model simulated the least expensiveway of meeting projected demand. Calculations were based oncost assumptions for various investments, including refurbish-ment of existing capacity for electricity generation and construc-tion of new capacity for cross-border electricity transmission. Themodel included four modes of thermal generation—natural gas,coal, heavy fuel oil, and diesel—and four renewable generationtechnologies—large hydropower, mini-hydro, solar photovoltaic(PV), and geothermal. Operation of existing nuclear capacity wasincluded but it was assumed that there would be no newinvestment in this technology over the ten years.
Investment requirements were calculated for both new plant aswell as refurbishment of existing capital stock. Operating, fuel, andmaintenance costs were also calculated. The model calculated that74–82 GW of new generation capacity would be required over a10-year period, depending on the demand scenario. The maindifferences in the demand scenario relate to different electrifica-tion targets and the extent of regional integration assumed fornew generation capacity (called the ‘‘trade expansion’’ scenario inthe modeling).
The overall costs for the power sector in Sub-Saharan Africa,plus Egypt, over a 10 year period (based on the trade expansionscenario and national targets for electrification) are an estimated
0%
20%
40%
60%
80%
100%
Q1
Budget quintile
Perc
enta
ge c
over
age
Q2 Q3 Q4 Q5
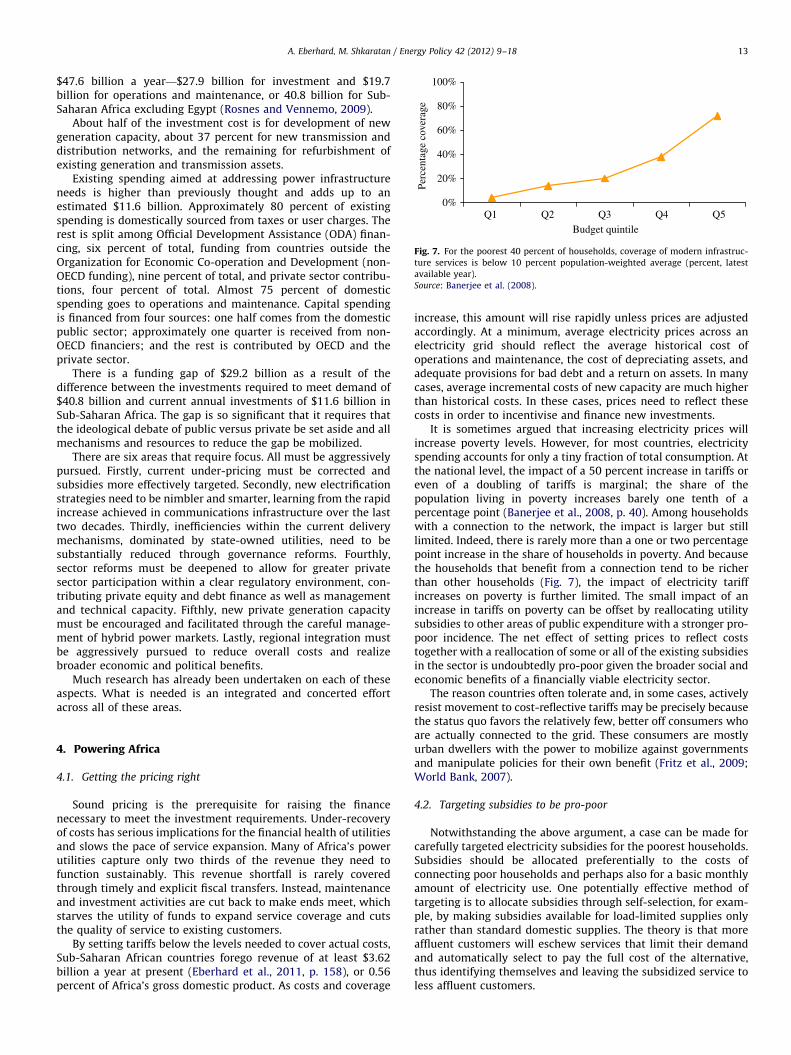
Fig. 7. For the poorest 40 percent of households, coverage of modern infrastruc-
ture services is below 10 percent population-weighted average (percent, latest
available year).
Source: Banerjee et al. (2008).
A. Eberhard, M. Shkaratan / Energy Policy 42 (2012) 9–18 13
$47.6 billion a year—$27.9 billion for investment and $19.7billion for operations and maintenance, or 40.8 billion for Sub-Saharan Africa excluding Egypt (Rosnes and Vennemo, 2009).
About half of the investment cost is for development of newgeneration capacity, about 37 percent for new transmission anddistribution networks, and the remaining for refurbishment ofexisting generation and transmission assets.
Existing spending aimed at addressing power infrastructureneeds is higher than previously thought and adds up to anestimated $11.6 billion. Approximately 80 percent of existingspending is domestically sourced from taxes or user charges. Therest is split among Official Development Assistance (ODA) finan-cing, six percent of total, funding from countries outside theOrganization for Economic Co-operation and Development (non-OECD funding), nine percent of total, and private sector contribu-tions, four percent of total. Almost 75 percent of domesticspending goes to operations and maintenance. Capital spendingis financed from four sources: one half comes from the domesticpublic sector; approximately one quarter is received from non-OECD financiers; and the rest is contributed by OECD and theprivate sector.
There is a funding gap of $29.2 billion as a result of thedifference between the investments required to meet demand of$40.8 billion and current annual investments of $11.6 billion inSub-Saharan Africa. The gap is so significant that it requires thatthe ideological debate of public versus private be set aside and allmechanisms and resources to reduce the gap be mobilized.
There are six areas that require focus. All must be aggressivelypursued. Firstly, current under-pricing must be corrected andsubsidies more effectively targeted. Secondly, new electrificationstrategies need to be nimbler and smarter, learning from the rapidincrease achieved in communications infrastructure over the lasttwo decades. Thirdly, inefficiencies within the current deliverymechanisms, dominated by state-owned utilities, need to besubstantially reduced through governance reforms. Fourthly,sector reforms must be deepened to allow for greater privatesector participation within a clear regulatory environment, con-tributing private equity and debt finance as well as managementand technical capacity. Fifthly, new private generation capacitymust be encouraged and facilitated through the careful manage-ment of hybrid power markets. Lastly, regional integration mustbe aggressively pursued to reduce overall costs and realizebroader economic and political benefits.
Much research has already been undertaken on each of theseaspects. What is needed is an integrated and concerted effortacross all of these areas.
4. Powering Africa
4.1. Getting the pricing right
Sound pricing is the prerequisite for raising the financenecessary to meet the investment requirements. Under-recoveryof costs has serious implications for the financial health of utilitiesand slows the pace of service expansion. Many of Africa’s powerutilities capture only two thirds of the revenue they need tofunction sustainably. This revenue shortfall is rarely coveredthrough timely and explicit fiscal transfers. Instead, maintenanceand investment activities are cut back to make ends meet, whichstarves the utility of funds to expand service coverage and cutsthe quality of service to existing customers.
By setting tariffs below the levels needed to cover actual costs,Sub-Saharan African countries forego revenue of at least $3.62billion a year at present (Eberhard et al., 2011, p. 158), or 0.56percent of Africa’s gross domestic product. As costs and coverage
increase, this amount will rise rapidly unless prices are adjustedaccordingly. At a minimum, average electricity prices across anelectricity grid should reflect the average historical cost ofoperations and maintenance, the cost of depreciating assets, andadequate provisions for bad debt and a return on assets. In manycases, average incremental costs of new capacity are much higherthan historical costs. In these cases, prices need to reflect thesecosts in order to incentivise and finance new investments.
It is sometimes argued that increasing electricity prices willincrease poverty levels. However, for most countries, electricityspending accounts for only a tiny fraction of total consumption. Atthe national level, the impact of a 50 percent increase in tariffs oreven of a doubling of tariffs is marginal; the share of thepopulation living in poverty increases barely one tenth of apercentage point (Banerjee et al., 2008, p. 40). Among householdswith a connection to the network, the impact is larger but stilllimited. Indeed, there is rarely more than a one or two percentagepoint increase in the share of households in poverty. And becausethe households that benefit from a connection tend to be richerthan other households (Fig. 7), the impact of electricity tariffincreases on poverty is further limited. The small impact of anincrease in tariffs on poverty can be offset by reallocating utilitysubsidies to other areas of public expenditure with a stronger pro-poor incidence. The net effect of setting prices to reflect coststogether with a reallocation of some or all of the existing subsidiesin the sector is undoubtedly pro-poor given the broader social andeconomic benefits of a financially viable electricity sector.
The reason countries often tolerate and, in some cases, activelyresist movement to cost-reflective tariffs may be precisely becausethe status quo favors the relatively few, better off consumers whoare actually connected to the grid. These consumers are mostlyurban dwellers with the power to mobilize against governmentsand manipulate policies for their own benefit (Fritz et al., 2009;World Bank, 2007).
4.2. Targeting subsidies to be pro-poor
Notwithstanding the above argument, a case can be made forcarefully targeted electricity subsidies for the poorest households.Subsidies should be allocated preferentially to the costs ofconnecting poor households and perhaps also for a basic monthlyamount of electricity use. One potentially effective method oftargeting is to allocate subsidies through self-selection, for exam-ple, by making subsidies available for load-limited supplies onlyrather than standard domestic supplies. The theory is that moreaffluent customers will eschew services that limit their demandand automatically select to pay the full cost of the alternative,thus identifying themselves and leaving the subsidized service toless affluent customers.
A. Eberhard, M. Shkaratan / Energy Policy 42 (2012) 9–1814
The level of subsidies needs to be fiscally affordable. Providinga use-of-service subsidy of just $2 to all household connectionswould absorb, on average, 1.1 percent of GDP over and aboveexisting spending. The cost of providing a once-off capital subsidyof $200 to cover network connection costs for all unconnectedhouseholds over 20 years would be substantially lower, at 0.35percent of GDP. A key difference is that the cost of this once-offsubsidy would disappear at the end of the decade, whereasthe use-of-service subsidy would continue indefinitely (Banerjeeet al., 2008, p. 34).
Getting the prices right, and targeting subsidies more effec-tively, are fundamental to meeting the investment challenge.However, pricing reform is heavily dependent on other sectorreforms. These are addressed below.
4.3. Being smarter about how electrification is rolled out
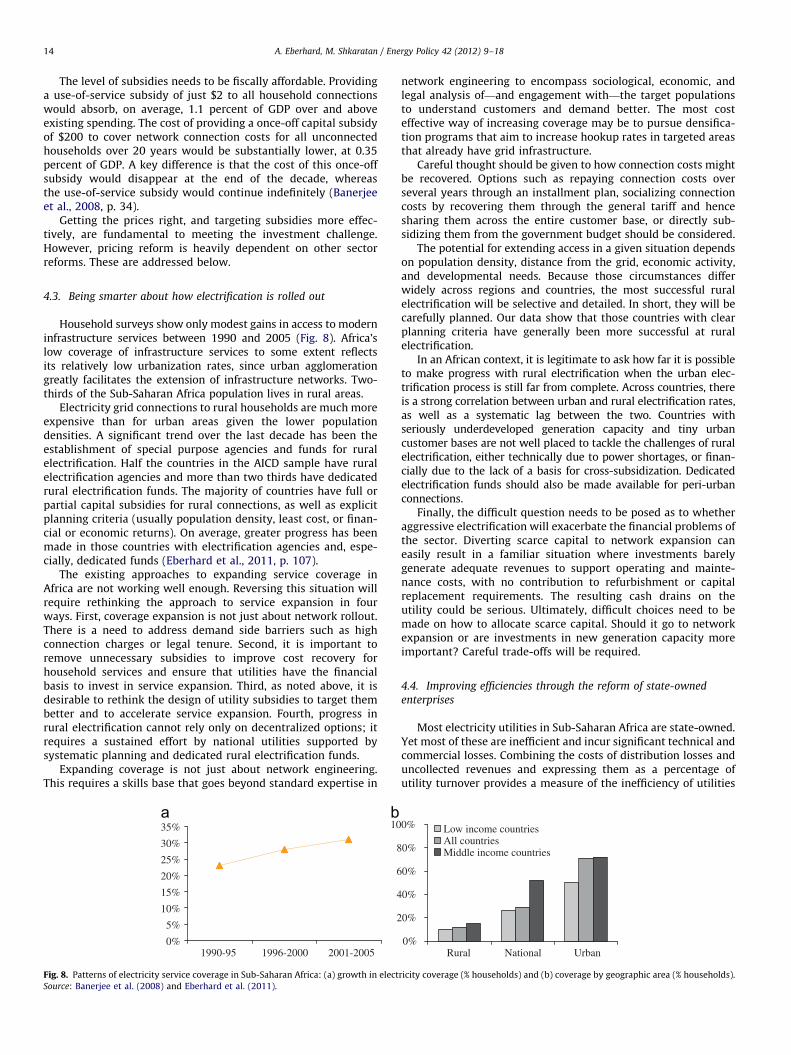
Household surveys show only modest gains in access to moderninfrastructure services between 1990 and 2005 (Fig. 8). Africa’slow coverage of infrastructure services to some extent reflectsits relatively low urbanization rates, since urban agglomerationgreatly facilitates the extension of infrastructure networks. Two-thirds of the Sub-Saharan Africa population lives in rural areas.
Electricity grid connections to rural households are much moreexpensive than for urban areas given the lower populationdensities. A significant trend over the last decade has been theestablishment of special purpose agencies and funds for ruralelectrification. Half the countries in the AICD sample have ruralelectrification agencies and more than two thirds have dedicatedrural electrification funds. The majority of countries have full orpartial capital subsidies for rural connections, as well as explicitplanning criteria (usually population density, least cost, or finan-cial or economic returns). On average, greater progress has beenmade in those countries with electrification agencies and, espe-cially, dedicated funds (Eberhard et al., 2011, p. 107).
The existing approaches to expanding service coverage inAfrica are not working well enough. Reversing this situation willrequire rethinking the approach to service expansion in fourways. First, coverage expansion is not just about network rollout.There is a need to address demand side barriers such as highconnection charges or legal tenure. Second, it is important toremove unnecessary subsidies to improve cost recovery forhousehold services and ensure that utilities have the financialbasis to invest in service expansion. Third, as noted above, it isdesirable to rethink the design of utility subsidies to target thembetter and to accelerate service expansion. Fourth, progress inrural electrification cannot rely only on decentralized options; itrequires a sustained effort by national utilities supported bysystematic planning and dedicated rural electrification funds.
Expanding coverage is not just about network engineering.This requires a skills base that goes beyond standard expertise in
0%
5%
10%
15%
20%
25%
30%
35%
1990-95
2
4
6
8
10
1996-2000 2001-2005
Fig. 8. Patterns of electricity service coverage in Sub-Saharan Africa: (a) growth in elect
Source: Banerjee et al. (2008) and Eberhard et al. (2011).
network engineering to encompass sociological, economic, andlegal analysis of—and engagement with—the target populationsto understand customers and demand better. The most costeffective way of increasing coverage may be to pursue densifica-tion programs that aim to increase hookup rates in targeted areasthat already have grid infrastructure.
Careful thought should be given to how connection costs mightbe recovered. Options such as repaying connection costs overseveral years through an installment plan, socializing connectioncosts by recovering them through the general tariff and hencesharing them across the entire customer base, or directly sub-sidizing them from the government budget should be considered.
The potential for extending access in a given situation dependson population density, distance from the grid, economic activity,and developmental needs. Because those circumstances differwidely across regions and countries, the most successful ruralelectrification will be selective and detailed. In short, they will becarefully planned. Our data show that those countries with clearplanning criteria have generally been more successful at ruralelectrification.
In an African context, it is legitimate to ask how far it is possibleto make progress with rural electrification when the urban elec-trification process is still far from complete. Across countries, thereis a strong correlation between urban and rural electrification rates,as well as a systematic lag between the two. Countries withseriously underdeveloped generation capacity and tiny urbancustomer bases are not well placed to tackle the challenges of ruralelectrification, either technically due to power shortages, or finan-cially due to the lack of a basis for cross-subsidization. Dedicatedelectrification funds should also be made available for peri-urbanconnections.
Finally, the difficult question needs to be posed as to whetheraggressive electrification will exacerbate the financial problems ofthe sector. Diverting scarce capital to network expansion caneasily result in a familiar situation where investments barelygenerate adequate revenues to support operating and mainte-nance costs, with no contribution to refurbishment or capitalreplacement requirements. The resulting cash drains on theutility could be serious. Ultimately, difficult choices need to bemade on how to allocate scarce capital. Should it go to networkexpansion or are investments in new generation capacity moreimportant? Careful trade-offs will be required.
4.4. Improving efficiencies through the reform of state-owned
enterprises
Most electricity utilities in Sub-Saharan Africa are state-owned.Yet most of these are inefficient and incur significant technical andcommercial losses. Combining the costs of distribution losses anduncollected revenues and expressing them as a percentage ofutility turnover provides a measure of the inefficiency of utilities
0%
0%
0%
0%
0%
0%
Rural
Low income countriesAll countriesMiddle income countries
National Urban
ricity coverage (% households) and (b) coverage by geographic area (% households).
0
ZambiaKenya
SenegalRwandaLesotho
Burkina FasoBenin
EthiopiaChad
MozambiqueTanzania
CameroonNamibia 2006
Cape VerdeBotswana
MalawiMali
UgandaGhana
NigerCongo, Rep.
NigeriaCote d'Ivoire
Congo DR
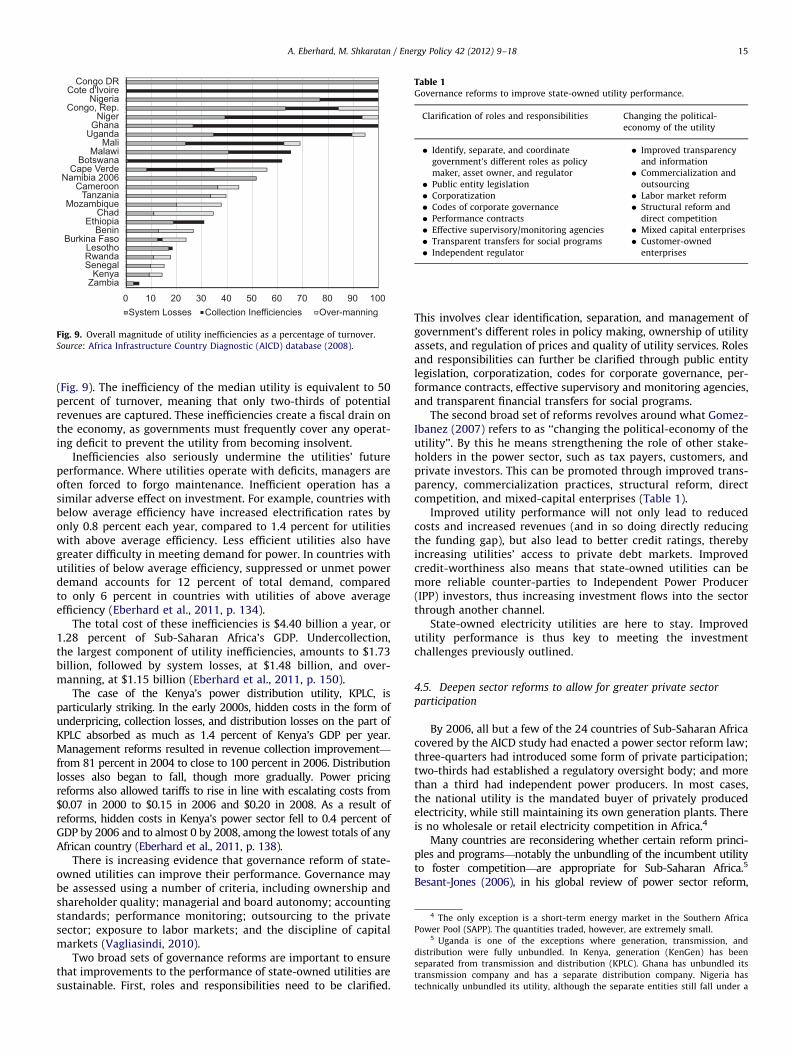
System Losses Collection Inefficiencies Over-manning10 20 30 40 50 60 70 80 90 100
Fig. 9. Overall magnitude of utility inefficiencies as a percentage of turnover.
Source: Africa Infrastructure Country Diagnostic (AICD) database (2008).
Table 1Governance reforms to improve state-owned utility performance.
Clarification of roles and responsibilities Changing the political-
economy of the utility
� Identify, separate, and coordinate
government’s different roles as policy
maker, asset owner, and regulator
� Public entity legislation
� Corporatization
� Codes of corporate governance
� Performance contracts
� Effective supervisory/monitoring agencies
� Transparent transfers for social programs
� Independent regulator
� Improved transparency
and information
� Commercialization and
outsourcing
� Labor market reform
� Structural reform and
direct competition
� Mixed capital enterprises
� Customer-owned
enterprises
4 The only exception is a short-term energy market in the Southern Africa
Power Pool (SAPP). The quantities traded, however, are extremely small.5 Uganda is one of the exceptions where generation, transmission, and
distribution were fully unbundled. In Kenya, generation (KenGen) has been
separated from transmission and distribution (KPLC). Ghana has unbundled its
transmission company and has a separate distribution company. Nigeria has
technically unbundled its utility, although the separate entities still fall under a
A. Eberhard, M. Shkaratan / Energy Policy 42 (2012) 9–18 15
(Fig. 9). The inefficiency of the median utility is equivalent to 50percent of turnover, meaning that only two-thirds of potentialrevenues are captured. These inefficiencies create a fiscal drain onthe economy, as governments must frequently cover any operat-ing deficit to prevent the utility from becoming insolvent.
Inefficiencies also seriously undermine the utilities’ futureperformance. Where utilities operate with deficits, managers areoften forced to forgo maintenance. Inefficient operation has asimilar adverse effect on investment. For example, countries withbelow average efficiency have increased electrification rates byonly 0.8 percent each year, compared to 1.4 percent for utilitieswith above average efficiency. Less efficient utilities also havegreater difficulty in meeting demand for power. In countries withutilities of below average efficiency, suppressed or unmet powerdemand accounts for 12 percent of total demand, comparedto only 6 percent in countries with utilities of above averageefficiency (Eberhard et al., 2011, p. 134).
The total cost of these inefficiencies is $4.40 billion a year, or1.28 percent of Sub-Saharan Africa’s GDP. Undercollection,the largest component of utility inefficiencies, amounts to $1.73billion, followed by system losses, at $1.48 billion, and over-manning, at $1.15 billion (Eberhard et al., 2011, p. 150).
The case of the Kenya’s power distribution utility, KPLC, isparticularly striking. In the early 2000s, hidden costs in the form ofunderpricing, collection losses, and distribution losses on the part ofKPLC absorbed as much as 1.4 percent of Kenya’s GDP per year.Management reforms resulted in revenue collection improvement—from 81 percent in 2004 to close to 100 percent in 2006. Distributionlosses also began to fall, though more gradually. Power pricingreforms also allowed tariffs to rise in line with escalating costs from$0.07 in 2000 to $0.15 in 2006 and $0.20 in 2008. As a result ofreforms, hidden costs in Kenya’s power sector fell to 0.4 percent ofGDP by 2006 and to almost 0 by 2008, among the lowest totals of anyAfrican country (Eberhard et al., 2011, p. 138).
There is increasing evidence that governance reform of state-owned utilities can improve their performance. Governance maybe assessed using a number of criteria, including ownership andshareholder quality; managerial and board autonomy; accountingstandards; performance monitoring; outsourcing to the privatesector; exposure to labor markets; and the discipline of capitalmarkets (Vagliasindi, 2010).
Two broad sets of governance reforms are important to ensurethat improvements to the performance of state-owned utilities aresustainable. First, roles and responsibilities need to be clarified.
This involves clear identification, separation, and management ofgovernment’s different roles in policy making, ownership of utilityassets, and regulation of prices and quality of utility services. Rolesand responsibilities can further be clarified through public entitylegislation, corporatization, codes for corporate governance, per-formance contracts, effective supervisory and monitoring agencies,and transparent financial transfers for social programs.
The second broad set of reforms revolves around what Gomez-Ibanez (2007) refers to as ‘‘changing the political-economy of theutility’’. By this he means strengthening the role of other stake-holders in the power sector, such as tax payers, customers, andprivate investors. This can be promoted through improved trans-parency, commercialization practices, structural reform, directcompetition, and mixed-capital enterprises (Table 1).
Improved utility performance will not only lead to reducedcosts and increased revenues (and in so doing directly reducingthe funding gap), but also lead to better credit ratings, therebyincreasing utilities’ access to private debt markets. Improvedcredit-worthiness also means that state-owned utilities can bemore reliable counter-parties to Independent Power Producer(IPP) investors, thus increasing investment flows into the sectorthrough another channel.
State-owned electricity utilities are here to stay. Improvedutility performance is thus key to meeting the investmentchallenges previously outlined.
4.5. Deepen sector reforms to allow for greater private sector
participation
By 2006, all but a few of the 24 countries of Sub-Saharan Africacovered by the AICD study had enacted a power sector reform law;three-quarters had introduced some form of private participation;two-thirds had established a regulatory oversight body; and morethan a third had independent power producers. In most cases,the national utility is the mandated buyer of privately producedelectricity, while still maintaining its own generation plants. Thereis no wholesale or retail electricity competition in Africa.4
Many countries are reconsidering whether certain reform princi-ples and programs—notably the unbundling of the incumbent utilityto foster competition—are appropriate for Sub-Saharan Africa.5
Besant-Jones (2006), in his global review of power sector reform,
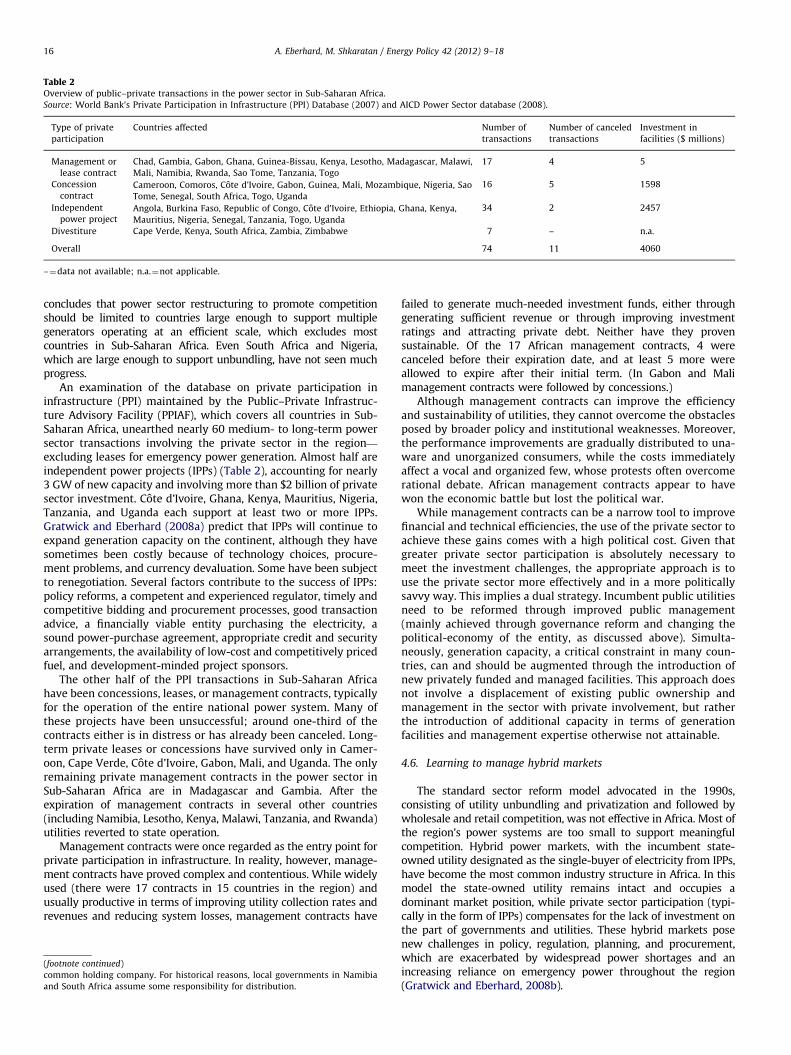
Table 2Overview of public–private transactions in the power sector in Sub-Saharan Africa.
Source: World Bank’s Private Participation in Infrastructure (PPI) Database (2007) and AICD Power Sector database (2008).
Type of private
participation
Countries affected Number of
transactions
Number of canceled
transactions
Investment in
facilities ($ millions)
Management or
lease contract
Chad, Gambia, Gabon, Ghana, Guinea-Bissau, Kenya, Lesotho, Madagascar, Malawi,
Mali, Namibia, Rwanda, Sao Tome, Tanzania, Togo
17 4 5
Concession
contractCameroon, Comoros, Cote d’Ivoire, Gabon, Guinea, Mali, Mozambique, Nigeria, Sao
Tome, Senegal, South Africa, Togo, Uganda
16 5 1598
Independent
power projectAngola, Burkina Faso, Republic of Congo, Cote d’Ivoire, Ethiopia, Ghana, Kenya,
Mauritius, Nigeria, Senegal, Tanzania, Togo, Uganda
34 2 2457
Divestiture Cape Verde, Kenya, South Africa, Zambia, Zimbabwe 7 – n.a.
Overall 74 11 4060
–¼data not available; n.a.¼not applicable.
A. Eberhard, M. Shkaratan / Energy Policy 42 (2012) 9–1816
concludes that power sector restructuring to promote competitionshould be limited to countries large enough to support multiplegenerators operating at an efficient scale, which excludes mostcountries in Sub-Saharan Africa. Even South Africa and Nigeria,which are large enough to support unbundling, have not seen muchprogress.
An examination of the database on private participation ininfrastructure (PPI) maintained by the Public–Private Infrastruc-ture Advisory Facility (PPIAF), which covers all countries in Sub-Saharan Africa, unearthed nearly 60 medium- to long-term powersector transactions involving the private sector in the region—
excluding leases for emergency power generation. Almost half areindependent power projects (IPPs) (Table 2), accounting for nearly3 GW of new capacity and involving more than $2 billion of privatesector investment. Cote d’Ivoire, Ghana, Kenya, Mauritius, Nigeria,Tanzania, and Uganda each support at least two or more IPPs.Gratwick and Eberhard (2008a) predict that IPPs will continue toexpand generation capacity on the continent, although they havesometimes been costly because of technology choices, procure-ment problems, and currency devaluation. Some have been subjectto renegotiation. Several factors contribute to the success of IPPs:policy reforms, a competent and experienced regulator, timely andcompetitive bidding and procurement processes, good transactionadvice, a financially viable entity purchasing the electricity, asound power-purchase agreement, appropriate credit and securityarrangements, the availability of low-cost and competitively pricedfuel, and development-minded project sponsors.
The other half of the PPI transactions in Sub-Saharan Africahave been concessions, leases, or management contracts, typicallyfor the operation of the entire national power system. Many ofthese projects have been unsuccessful; around one-third of thecontracts either is in distress or has already been canceled. Long-term private leases or concessions have survived only in Camer-oon, Cape Verde, Cote d’Ivoire, Gabon, Mali, and Uganda. The onlyremaining private management contracts in the power sector inSub-Saharan Africa are in Madagascar and Gambia. After theexpiration of management contracts in several other countries(including Namibia, Lesotho, Kenya, Malawi, Tanzania, and Rwanda)utilities reverted to state operation.
Management contracts were once regarded as the entry point forprivate participation in infrastructure. In reality, however, manage-ment contracts have proved complex and contentious. While widelyused (there were 17 contracts in 15 countries in the region) andusually productive in terms of improving utility collection rates andrevenues and reducing system losses, management contracts have
(footnote continued)
common holding company. For historical reasons, local governments in Namibia
and South Africa assume some responsibility for distribution.
failed to generate much-needed investment funds, either throughgenerating sufficient revenue or through improving investmentratings and attracting private debt. Neither have they provensustainable. Of the 17 African management contracts, 4 werecanceled before their expiration date, and at least 5 more wereallowed to expire after their initial term. (In Gabon and Malimanagement contracts were followed by concessions.)
Although management contracts can improve the efficiencyand sustainability of utilities, they cannot overcome the obstaclesposed by broader policy and institutional weaknesses. Moreover,the performance improvements are gradually distributed to una-ware and unorganized consumers, while the costs immediatelyaffect a vocal and organized few, whose protests often overcomerational debate. African management contracts appear to havewon the economic battle but lost the political war.
While management contracts can be a narrow tool to improvefinancial and technical efficiencies, the use of the private sector toachieve these gains comes with a high political cost. Given thatgreater private sector participation is absolutely necessary tomeet the investment challenges, the appropriate approach is touse the private sector more effectively and in a more politicallysavvy way. This implies a dual strategy. Incumbent public utilitiesneed to be reformed through improved public management(mainly achieved through governance reform and changing thepolitical-economy of the entity, as discussed above). Simulta-neously, generation capacity, a critical constraint in many coun-tries, can and should be augmented through the introduction ofnew privately funded and managed facilities. This approach doesnot involve a displacement of existing public ownership andmanagement in the sector with private involvement, but ratherthe introduction of additional capacity in terms of generationfacilities and management expertise otherwise not attainable.
4.6. Learning to manage hybrid markets
The standard sector reform model advocated in the 1990s,consisting of utility unbundling and privatization and followed bywholesale and retail competition, was not effective in Africa. Most ofthe region’s power systems are too small to support meaningfulcompetition. Hybrid power markets, with the incumbent state-owned utility designated as the single-buyer of electricity from IPPs,have become the most common industry structure in Africa. In thismodel the state-owned utility remains intact and occupies adominant market position, while private sector participation (typi-cally in the form of IPPs) compensates for the lack of investment onthe part of governments and utilities. These hybrid markets posenew challenges in policy, regulation, planning, and procurement,which are exacerbated by widespread power shortages and anincreasing reliance on emergency power throughout the region(Gratwick and Eberhard, 2008b).

A. Eberhard, M. Shkaratan / Energy Policy 42 (2012) 9–18 17
The allocation of responsibility for ensuring adequate andreliable supply is often ambiguous in hybrid power markets.Few countries in Africa have an explicit security of supplystandard, and while incumbent state-owned national utilitieshave typically assumed responsibility as supplier of last resort,few government departments or regulators explicitly monitoradequacy and reliability of supply. If monitoring were institutio-nalized, then regulators would be in a better position to assess theneed for investment in new capacity.
Incumbent state-owned utilities often argue that they are ableto supply power more cheaply or quickly than private alternatives(even if they lack the resources to do so). Yet rigorous analysisthat assigns appropriate costs to capital seldom supports suchclaims, which undermine the entry of IPPs. Regardless, mostAfrican utilities have not supplied adequate investment in muchneeded generation capacity.
Poor understanding of hybrid power markets prevents policymakers from devising clear and transparent criteria for allocatingnew building opportunities among the incumbent state-owned utilityand IPPs. The failure to order new plants on a timely basis discouragesinvestors and results in power shortages that prompt recourse toexpensive emergency power. This has been the case in Tanzania andRwanda, for example. When authorities finally begin procurement,they may not take the trouble to conduct international competitivebidding. This is unfortunate, because a rigorous bidding processprovides credibility and transparency and results in more competi-tively priced power, and unsolicited bids can lead to expensive power.
Hybrid power markets will not disappear from the Africanlandscape in the near future. To maximize their benefit, Africangovernments and their development partners must develop arobust institutional foundation for central power purchases withclear criteria for offtake agreements. They must also improve theirplanning capabilities, establish clear policies for allocating newinvestment opportunities among the state-owned utilities andIPPs, and commit to competitive and timely bidding processes.
Development finance institutions and bilateral donors can pro-vide advice and expertise to governments and utilities on establish-ing transparent frameworks and procedures for contracting andreaching financial closure with project sponsors and private inves-tors. Yet they must be careful to pay sufficient attention to thepeculiarities of the hybrid market. Otherwise lending to publicutilities may unintentionally deepen hybrid markets’ inherent con-tradictions and crowd out private investment. The sector requiresstronger public institutions that can engage effectively with theprivate sector.
While a dominant national utility can play a useful role inaggregating demand and entering into long-term contracts withnew investors, there are few advantages in assigning it exclusivebuying rights. Instead, IPPs should be able to enter into willingseller–buyer arrangements and supply directly to both the nationalutility and large customers. Large customers should also have choiceand should be able to contract directly with IPPs or import power.Such an arrangement would require non-discriminatory access tothe grid. In other words, instead of a single-buyer there should be acentral non-exclusive buyer.
Thought also needs to be given to the long-term implicationsof signing 25 or 30 year contracts with IPPs. It may be advanta-geous to migrate to a more short-term market in the future andhence sunset clauses should be considered when signing PPAs.These may enable and encourage IPPs to trade at least part oftheir production on a power exchange in the future.
4.7. Rethinking regulatory design
Utility regulation in developing countries has coincided withthe emergence of new problems. In many cases, regulators are far
from independent and are subjected to pressure from govern-ments to modify or overturn decisions. Turnover among commis-sioners has been high, with many resigning under pressure beforecompleting their full term. The disconnect between law (or rule)and practice is often wide. Tariff setting remains highly politi-cized, and governments are sensitive to popular resentmentagainst price increases, which are often necessary to cover costs.Establishing independent regulatory agencies may be particularlyrisky for all stakeholders (governments, utilities, investors, andcustomers) in sectors that are being reformed, especially whenprices are not already high enough to ensure sufficient revenue. Insome ways, it is not surprising to find political interference andpressure on regulators.
Governments in developing countries often underestimate thedifficulty of establishing new public institutions. Building endur-ing systems of governance, management, and organization andcreating new professional capacity are lengthy processes. Manyregulatory institutions in developing countries are no more than afew years old, and few are older than ten. Many are still fragileand lack capacity.
Independent regulation requires strong regulatory commitmentand competent institutions and people. The reality is that devel-oping countries are often only weakly committed to independentregulation and face capacity constraints (Tremolet and Shah, 2005).It may be prudent in such cases to acknowledge that weakregulatory commitment, political expediency, fragile institutions,and capacity constraints necessitate limits on regulatory discretion.This does not imply that independent regulation is undesirable. Butbecause of limited institutional capacity in the sector, complemen-tary, transitional, or hybrid regulatory options and models (such asregulatory contracts or outsourcing of regulatory functions) may bea better starting point (Eberhard, 2007).
Each country therefore must choose from a menu of regulatoryoptions to create a hybrid model that best fits its particularsituation. The model must be flexible enough to evolve accordingto growth in a country’s regulatory commitment and capacity. Inthe end, designing and implementing legitimate, competentregulatory institutions in developing countries will always be achallenge. Nevertheless, establishing an effective regulatory sys-tem is essential to the region’s strategy of increasing privateparticipation in the power sector.
More effective regulation of incumbent state-owned utilitieswill remain a critical challenge. Regulators can play a useful role inensuring that tariffs are cost-reflective while encouraging utilitiesto reduce costs and improving efficiencies. Improved financialperformance impacts positively on credit ratings, and helps posi-tion utilities to raise private debt and fund capacity expansion.
4.8. Realizing the benefits of regional trade
Only a small fraction of the ample hydropower and thermalenergy resources in Sub-Saharan Africa have been developed intopower generation capacity. Some of the region’s least expensivesources of power are far from major centers of demand in countriestoo poor to develop them. For example, 61 percent of regionalhydropower potential is found in just two countries: DemocraticRepublic of Congo and Ethiopia. In addition, few countries in theregion have sufficient demand to justify power plants large enoughto exploit economies of scale. Based on the economic geography ofthe power sector in Sub-Saharan Africa, regional power trade hasmany potential benefits. Four regional power pools in Sub-SaharanAfrica have already been established but power trade amongcountries in the region is still very limited.
Rosnes and Vennemo (2009) performed detailed simulationsto estimate the potential benefits of regional power trade in Sub-Saharan Africa. In the trade expansion scenario annualized power

A. Eberhard, M. Shkaratan / Energy Policy 42 (2012) 9–1818
system costs in the trading regions would be between three andten percent lower. Since trade reduces the use of thermal powerplants, the gains from trade increase as fuel prices rise and morehydropower projects become profitable.
If regional power trade were allowed to expand, rising demandwould provide incentives for several countries to develop theirsignificant hydropower potential. However, water resource man-agement for hydropower is challenging for at least two reasons.First of all, it often requires multi-national efforts and jointdecision making by several countries. Secondly, hydropower mustcompete with other demands for water resources. Therefore,development of hydropower resources will require an establishedlegal and regulatory framework to facilitate international co-operation and multi-sectoral management.
5. Summary and conclusions
Africa’s inadequate generation capacity and inadequate, unreli-able transmission and distribution networks constrain economicgrowth and limit the social benefits of electricity use. Theeconomic costs are significant at more than two percent of GDPand a further two percentage points reduction in economic growth.
The total investment requirements for the power sector inSub-Saharan Africa over a 10 year period are an estimated $40.8billion a year. About half of the investment cost is for develop-ment of new generation capacity. Current spending aimed ataddressing power infrastructure needs is an estimated $11.6billion, leaving a funding gap of $29.2 billion. The gap is sosignificant that it requires that the ideological debate of publicversus private be set aside and all mechanisms and resources toreduce the gap be mobilized.
There are six areas that require focus. Firstly, current under-pricing must be corrected and subsidies more effectively targeted.Secondly, new electrification strategies need to be nimbler andsmarter. Thirdly, inefficiencies within the current delivery mechan-isms, dominated by state-owned utilities, need to be substantiallyreduced through governance reforms. Fourthly, sector reforms mustbe deepened to allow for greater private sector participation withina clear regulatory environment, contributing private equity and debtfinance as well as management and technical capacity. Fifthly, newprivate generation capacity must be encouraged and facilitatedthrough the careful management of hybrid power markets. Lastly,regional integration must be aggressively pursued to reduce overallcosts and realize other economic and political benefits.
References
Africa Infrastructure Country Diagnostic (AICD) database, 2008. Power Sector-World Bank, Washington, DC.
Barnes, Douglas F., 1988. Electric Power for Rural Growth: How Electricity AffectsRural Life in Developing Countries. Westview Press, Boulder, CO.
Banerjee, Sudeshna, Wodon, Quentin, Diallo, Amadou, Pushak, Taras, Uddin, Hellal,Tsimpo, Clarence, Foster, Vivien, 2008. Access, Affordability and Alternatives:Modern Infrastructure Services in Sub-Saharan Africa. Background Paper 2.Africa Infrastructure Country Diagnostic, World Bank, Washington, DC.
Besant-Jones, John, 2006. Reforming Power Markets in Developing Countries:What Have We Learned? Energy and Mining Sector Board Discussion Paper 19.World Bank, Washington, DC.
Briceno-Garmendia, Cecilia, Shkaratan, Maria, 2010. Power Tariffs: CaughtBetween Cost Recovery and Affordability. Working Paper 20. Africa Infra-structure Country Diagnostic, World Bank, Washington, DC.
Brodman, Janice, 1982). Rural Electrification and the Commercial Sector inIndonesia: Resources for the Future. Discussion Paper D-73L, World Bank,Washington, DC.
Calderon, Cesar, 2008. Infrastructure and Growth in Africa. Africa InfrastructureCountry Diagnostic Working Paper 3, Africa Infrastructure Country Diagnostic,World Bank, Washington, DC.
Eberhard, Anton, 2007. Matching regulatory design to country circumstances: thepotential for hybrid and transitional models. Gridlines Note No. 23, PPIAF,World Bank, Washington, DC.
Eberhard, Anton, Foster, Vivien, Briceno-Garmendia, Cecilia, Ouedraogo, Fatimata,Camos, Daniel, Shkaratan, Maria, 2008. Underpowered: The State of thePower Sector in Sub-Saharan Africa. Background Paper 6. Africa InfrastructureCountry Diagnostic, World Bank, Washington, DC.
Eberhard, Anton, Shkaratan, Maria, Rosnes, Orvika, Haakon, Vennemo, 2011.Africa’s Power Infrastructure: Investment, Integration, Efficiency. World Bank,Washington, DC.
Energy Information Administration (EIA), 2005. International Energy Data. USDepartment of Energy, /http://www.eia.doe.gov/emeu/internationalS.
Energy Information Administration (EIA), 2006. International Energy Data. USDepartment of Energy, /http://www.eia.doe.gov/emeu/internationalS.
Escribano, Alvaro, Guasch, Luis, Pena, Jorge, 2008. A Robust Assessment of theImpact of Infrastructure on African Firm’s Productivity. Working Paper 9.Africa Infrastructure Country Diagnostic, World Bank, Washington, DC.
Foley, Gerald, 1990. Electricity for Rural People. Panos Institute, London.Foster, Vivien, Steinbuks, Jevgenijs, 2008. Paying the Price for Unreliable Power
Supplies: In-House Generation of Electricity by Firms in Africa. Working Paper 2.Africa Infrastructure Country Diagnostic, World Bank, Washington, DC.
Fritz, Verena, Kaiser, Kai, Levy, Brian, 2009. Problem-Driven Governanceand Political Economy Analysis: Good Practice Framework. World Bank,Washington, DC.
Gomez-Ibanez, Jose, 2007. Alternatives to Infrastructure Privatization Revisited:Public Enterprise Reform from the 1960s to the 1980s. Policy ResearchWorking Paper 4391. World Bank, Washington, DC.
Gratwick, Katherine, Eberhard, Anton, 2008a. An analysis of independent powerprojects in Africa: understanding development and investment outcomes.Development Policy Review 26 (3), 309–338.
Gratwick, Katherine, Eberhard, Anton, 2008b. Demise of the standard model forpower sector reform and the emergence of hybrid power markets. EnergyPolicy 36, 3948–3960.
International Energy Agency, 2011. CO2 Emissions from Fuel Combustion. IEA,Paris.
Jimenez, Antonio, Olson, Ken, 1998. Renewable Energy for Rural Health ClinicsNa-tional Renewable Energy Laboratory, Golden, CO, USA /w?w?w?.rsvp.nrel.gov/vpconference/vp2000/handbooks/health_clinic_handbook.pdfS.
Reinikka, Ritva, Svensson, Jakob, 1999. Confronting competition: firms’ investmentresponse and constraints in Uganda. In: Collier, P., Reinikka, R. (Eds.), Assessingan African Success: Farms, Firms, and Government in Uganda’s Recovery,World Bank, Washington, DC.
Rosnes, Orvika, Vennemo, Haakon, 2009. Powering Up: Costing Power Infrastruc-ture Investment Needs in Southern and Eastern Africa. Background Paper 5.Africa Infrastructure Country Diagnostic, World Bank, Washington, DC.
SADELEC, Ltd., 2006. Electricity Prices in Southern and East Africa (IncludingSelected Performance Indicators). Republic of South Africa.
Tremolet, Sophie, Shah, Niraj, 2005. Wanted! Good Regulators for Good Regula-tion. Research Paper, World Bank, Washington, DC.
Vagliasindi, Maria, Nellis, John, 2010. Evaluating Africa’s Experience with Institu-tional Reform for the Infrastructure Sectors. AICD Working Paper 23. WorldBank, Washington, DC.
Venkataraman, Krishnaswami, 1990. Rural Electrification in the Asian and PacificRegion. In: Power Systems in Asia and the Pacific, with Emphasis on RuralElectrification. Economic and Social Commission for Asia and the Pacific,United Nations, New York, NY, pp. 310–32.
World Bank, 2007. Tools for Institutional, Political, and Social Analysis of PolicyReform—A Sourcebook for Development Practitioners. Washington, DC.
World Bank, 2008. Group Enterprise Survey Database. World Bank, Washington,DC.
Yepes, Tito, Pierce, Justin, Vivien, Foster, 2008. Making Sense of Africa’s Infra-structure Endowment: A Benchmarking Approach. Working Paper 1. AfricaInfrastructure Country Diagnostic, World Bank, Washington, DC.